Belleve East Land Use Study Review
44
Ordinary Meeting of Council 12 May 2021 6.1 FINANCIAL MANAGEMENT REPORT FOR PERIOD ENDED MARCH 2021 Ward: (All Wards) (Financial Services and Rates) Disclosure of Interest: Nil Authorised Officer: (Executive Manager Corporate) KEY ISSUES • This report provides Council with the suite of financial management reports in order for Council to monitor the financial performance and position of the City. • A summary page has been developed that includes high level financial information, commentary and graphical representation from the various statements and schedules included in the report. • Statements included are Financial Activity, Rate Setting, Cash Flow, Comprehensive Income, Financial Position, Changes in Equity, Capital Jobs, Cash and Investments and Net Current Funding. • A Debtors Schedule has been included that lists the top 10 non-rate debtors (in value). For privacy purposes the names of the debtors are not included, however the report provides insight into the management of the aged debtors. It is recommended that Council resolve to note the monthly financial management reports for the period ended 31 March 2021. BACKGROUND Section 6.4 of the Local Government Act 1995 requires an annual financial report to be prepared as well as such other financial reports as prescribed. Regulation 34(1) of the Local Government (Financial Management) Regulations 1996 (the Regulations) requires a local government to prepare each month a statement of financial activity reporting on the income and expenditure, as set out in the annual budget. The statement of financial activity is to be supported by such information as is considered relevant by the local government. A statement of financial activity and any accompanying documents are to be presented at the next ordinary council meeting following the end of the month to which the statement relates, or to the next ordinary council meeting after that meeting. In addition under regulation 34(5) of the Regulations each financial year, local government is to adopt a percentage or value, calculated in accordance with Australian Accounting Standards to be used in the statement of financial activity for reporting material variances.
Transcript of Belleve East Land Use Study Review

Ordinary Meeting of Council 12 May 2021
6.1 FINANCIAL MANAGEMENT REPORT FOR PERIOD ENDED MARCH 2021
Ward: (All Wards) (Financial Services and Rates)
Disclosure of Interest: Nil
Authorised Officer: (Executive Manager Corporate)
KEY ISSUES
• This report provides Council with the suite of financial management reports in order for Council to monitor the financial performance and position of the City.
• A summary page has been developed that includes high level financial information, commentary and graphical representation from the various statements and schedules included in the report.
• Statements included are Financial Activity, Rate Setting, Cash Flow, Comprehensive Income, Financial Position, Changes in Equity, Capital Jobs, Cash and Investments and Net Current Funding.
• A Debtors Schedule has been included that lists the top 10 non-rate debtors (in value). For privacy purposes the names of the debtors are not included, however the report provides insight into the management of the aged debtors.
It is recommended that Council resolve to note the monthly financial management reports for the period ended 31 March 2021.
BACKGROUND
Section 6.4 of the Local Government Act 1995 requires an annual financial report to be prepared as well as such other financial reports as prescribed.
Regulation 34(1) of the Local Government (Financial Management) Regulations 1996 (the Regulations) requires a local government to prepare each month a statement of financial activity reporting on the income and expenditure, as set out in the annual budget. The statement of financial activity is to be supported by such information as is considered relevant by the local government.
A statement of financial activity and any accompanying documents are to be presented at the next ordinary council meeting following the end of the month to which the statement relates, or to the next ordinary council meeting after that meeting.
In addition under regulation 34(5) of the Regulations each financial year, local government is to adopt a percentage or value, calculated in accordance with Australian Accounting Standards to be used in the statement of financial activity for reporting material variances.

Ordinary Meeting of Council 12 May 2021
The City of Swan Financial Management Reports use a materiality threshold to measure, monitor and report on financial performance and position of the City. The materiality threshold adopted by Council, together with the Annual Budget for 2020/2021 is variances greater or lower than 10% of the original adopted budget and greater than $50,000 in value.
DETAILS
The financial management report for the period ended 31 March 2021 is included as an attachment to this report.
As the information contained in the Statement of Financial Activity is repeated in the Income Statement and Balance Sheet, the analysis of the information is included below.
1. Statement of Comprehensive Income
Year to date revenue from ordinary activities is $185.9m, this is greater than revised budget by $6.5m
Expenditure on ordinary activities for the year to date is $125.7m, this is less than the revised budget by $11.7m.
Net result is $93.6m surplus in comparison to $67.3m revised budget year to date.
2. Statement of Financial Position
Trade and Other Receivables hade decreased by $19.4m, primarily due to the receipt of rates payments. Cash and Cash Equivalents and Other financial Assets have decreased by $1.9m. This has contributed to the net decrease in Current Assets of $21.6m
Non-Current Assets increased by $6.2m compared to February due to the progression of the 2020/2021 capital expenditure program.
3. Statement of Cash Flows
Cash and Cash Equivalents as at 31 March 2021 was $276.1m. Cash and Cash Equivalents as at 31 March 2020 was $228.6m. Reasons for the increase in cash include unfinished capital works as at 30 June 2020 with projects carried forward to 2020/2021 amounting to $41.5m.
CONSULTATION
Not applicable
ATTACHMENTS
Financial Report for the period ending 31 March 2021.

Ordinary Meeting of Council 12 May 2021
STRATEGIC IMPLICATIONS
Consistent with the City's Strategic Community Plan 2021-2031 Key Result Area - Governance Objectives:
G1.1 - Provide accountable and transparent leadership, and G2.1 - Improve capability and capacity.
Monitoring performance by comparison of budget and actual is an essential management tool to ensure financial performance within acceptable pre determined limits.
STATUTORY IMPLICATIONS
Section 6.4 of the Local Government Act 1995 and regulation 34(1) of the Local Government (Financial Management) Regulations 1996
FINANCIAL IMPLICATIONS
Compares financial activity with budget as detailed in this report.
VOTING REQUIREMENTS
Simple majority
RECOMMENDATION
That the Council resolve to:
1) Note the financial statements and report for the month ended 31 March 2021 in accordance with regulation 34(1) of the Local Government (Financial Management) Regulations 1996.
CARRIED EN BLOC

Financial Report
for the Period Ending
31st March 2021
Contents

1.0 Financial Summary 1.1
2.0 Statements of Comprehensive Income 2.1 By Nature & Type 2.2 By Program 2.3
3.0 Statements of Financial Position & Equity 3.1 Statement of Financial Position 3.2 Statement of Changes in Equity 3.3
4.0 Capital Payment 4.1 Capital Works Schedules 4.2 - 4.6
5.0 Council response to COVID-19 & Bushfire 5.1 COVID-19 Impact 5.2- 5.6 Wooroloo and Hills Bushfire Emergency 5.7- 5.1
6.0 Cash and Investments 6.1 Investment Report 6.2 - 6.4
7.0 Debtors Rates Debtors 7.1 Sundry Debtors 7.2
8.0 Statement of Financial Activity 8.1 - 8.3 (With Variance Analysis Commentary)
Statement of Financial Activity 8.4 Net Current Funding Position 8.5 Liquidity Over Three Years 8.5
9.0 Other Statutory Reports 9.1 Statement of Cash Flow 9.2 Rate Setting Statement 9.3

1.1
2.0 Statement of Comprehensive Income (Performance)
Year to 31st March 2021 Annual AnnualBudget Bgt Var
$000's %
Revenue 185,910 179,449 3% 186,075 100%
Expenses (125,692) (137,359) -9% (182,512) 69%
Profit/Loss 60,218 42,090 30% 3,563 1690%
Non-operating 33,391 25,230 24% 53,506 62%Net Result 93,609 67,320 28% 57,069 164%
3.0 Statement of Financial Position2020 2021 2021
June February March$000's $000's $000's
Current
Assets 235,568 301,175 279,579
Liabilities 71,795 65,627 61,408
Non Current
Assets 2,119,645 2,153,666 2,159,852
Liabilities 76,186 77,426 77,182Net Assets 2,207,232 2,311,789 2,300,842
4.0 Capital PaymentsYear to 31st March 2021 Annual Annual
Actual/Comm Budget Var Budget Bgt Var$000's $000's % $000's %
Buildings 19,779 23,954 83% 31,939 62%
Drainage 1,306 2,041 64% 2,721 48%
Footpaths 1,423 1,489 96% 1,986 72%
Parks 15,887 18,680 85% 24,907 64%
Roads 25,784 51,692 50% 68,923 37%
P&E, Other 10,322 27,183 38% 36,244 28%Total 74,501 125,039 60% 166,719 45%
6.0 Cash and InvestmentsVolume Held
February March Ave Interest$000's $000's %
Cash 46,749 46,810 0.0%Term Deposits 231,300 229,300 0.6%
Total 278,049 276,110 0.5%
7.0 Debtors February March Change
$000's $000's %
Trade DebtorsCurrent 183 263 44%
> 30 Days 130 89 -31%> 60 Days 42 57 36%> 90 Days 1,075 1,029 -4%
Total Trade 1,430 1,439 1%Rates Debtors
Rates Debtors 35,279 17,111 -51%Other Debtors 4,328 3,106 -28%Total Debtors 41,037 21,657 -47%
City of Swan - Financial Management SummaryReport for the period ended 31st March 2021
Actual '$000'sBudget '$000's
Variance%
Revenue exceeded ytd budget by 3% or $6.5m. Fees & Charges recovery postCOVID closure accounted for $3.7m, with $2.5m attributed to Recreation & Culture.Interim Rates also reported an above budget result of $ 2.4m.
Operating Expenses were 9% or $11.7m favourable against budget, with Materialsand Contracts accounting for $5.9m, Employee Costs $3.4m and Depreciation $2.2m.The variance was partially offset by unbudgeted Insurance Expenses which haveescalated, following the Wooroloo Bushfire. It is anticipated that a portion of the costswill be recouped from the LGIS.
The $8.1m favourable variance in Non-operating income largely consists of higherDeveloper Contributions $16.6m, driven by the Federal and WA building grantinitiatives. This was partly offset by lower Capital Grants of $9.1m.
The Cash and Equivalents end of month balance for March2021 is $276.1m.The City’s investment portfolio posted a return of 0.51%pa forthe month of March versus the bank bill index benchmark return of 0.02%pa. For the past 12 months, the investment portfolio returned0.90%pa, exceeding the bank bill index benchmark’s 0.11%paby 0.79%pa.35% of the portfolio was invested in non-fossil fuel lendingADIs, the same as the month prior.The RBA kept the official cash rate at 0.10%.
2.26
4.55 4.40
1.00 1.00 1.00
-
2.00
4.00
6.00
8.00
Jun-20 Feb-21 Mar-21C.Assets C.Liabilities
The City has spent $91.3m or 55% of $166.7m annual budget in Capital worksconsisting of $74.5m actual costs and $16.8m in commitments.
Buildings recorded $19.7m, 62% of YTD budget. Major costs were incurred for:Malaga Waste Transfer Station $6.9m, Ellenbrook Leisure Centre $2m, Brabham Community Centre $1.9m and Swan Active Ballajura $1.4m.
Parks incurred $15.8m, 15% lower than YTD budget of $18.6m, with substantialamounts in Brabham Neighbourhood Park $2.2m, Dayton Local Park - Passive $1.7m, Dayton Neighbourhood Park $1.6m, Midland Skate Park $1.5m and New Junction Public Open Space $1.3m.
Roads expenditure was $25.7m or 50% of YTD budget. Henley Brook Avenueaccounted for $2.8m, The Broadway $3.8m, Lloyd Street Extension $3m, Arthur Street$952k and Stock Rd Extension $1.1m were the major contributors.
The One Council Project has incurred $175k of its $1.9m annual budget.
0
1,000
2,000
3,000
4,000
Current > 30 Days > 60 Days > 90 Days
$000
's
Trade Debtors
February March
AAA47%
AA+ to AA-2%
A+ to A-51%
Current debtors have increased as a result of twolarge invoices raised.
30 day debtors decreased following unpaidGovernment department invoices moving to 60 days.
90+ day debtors reduced slightly by 4% due toongoing debt recovery.
Rates debtors excluding Emergency Service Levy reduced significantly by 51% or $18.1m. This was due to4th instalment received in March 2021.
Trade and Other Receivables have decreased by $19.4m asthe final rates instalment was due on 19 March 2021. Cashand Cash Equivalents and Other Financial Assets havedecreased by $1.9m. This has contributed to the netdecrease in Current Assets of $21.6m.Non-Current Assets increased by $6.2m compared toFebruary 2021 due to the progression of the 2020/21 capitalexpenditure program .Current Liabilities decreased by $4.2m, the major impactcoming from $3.5m decrease in Trade & Other Payablesand a $1.0m reduction in Borrowings due to loanrepayments.Current Ratio decreased from 4.55 to 4.40, this is notunusual in the second part of the year.

2.1
AASB 101.8 requires a financial report to include a "Statement of Comprehensive Income". The definition of "IncomeStatement" at Financial Management Regulation 3 is "income statement (or equivalent) that meets therequirements of Australian Accounting Standards for income statements". By virtue of the changes to terminology inAASB101, we now refer to the "income statement" as the "statement of comprehensive income" as that is the"equivalent" in the context of the Australian Accounting Standards.
The Statements of Comprehensive Income summarise the operating revenue and expenditure for a particular periodof a financial year. The principle aim of these financial statements are to report on the performance of the City inmeeting the approved budgets in both revenue and expenditure terms. An important aspect of The Statements ofComprehensive Income is the exclusion of capital and infrastructure project expenditure. There are two versionsthat are prepared with each presenting information in two distinct forms.
The first Statement of Comprehensive Income is by Nature & Type as prescribed by the Financial ManagementRegulations Schedule 1 Part 2 that ensures compliance with statutory requirements. The report categorisesrevenues and expenses into easy to understand types based on the nature of the individual revenue or expense. Forexample employee costs are made up of not only salaries and wages but also casual labour, labour hire, staffrecruitment, staff training etc.
The second Statement of Comprehensive Income is by Program. Since the withdrawal of AAS 27, AASB 1052.11(b)now governs the disclosure requirements relating to income and expenditure by program (function / activity). Thereport aims to give the reader information on what activity within the community revenue is generated from andwhere money is spent. For example the General Purpose Funding program is where most revenue is generated fromrates, the main source of local government funds. In regards to expenditure the program titled Recreation & Cultureoften has the greatest outlay. This program includes costs associated with operating Libraries, Leisure Centres,Street Lighting, maintaining Parks & Reserves and City owned Buildings.
Both reports calculate variances based on the Current Revised Budget. The actual figures for the year to date arecompared to the year to date current revised budget to present a monetary variance as well as a the variance shownas a percentage of the budget.
The following report on significant variances refers to those variances in the Statement of Comprehensive Income byNature and Type.
2.0 Statements of Comprehensive Income2.0 Statements of Comprehensive Income

Original Revised YTD Current YTD Actual $ Variance VAR % VAR /Budget Budget Revised Budget Note Current
2020/21 2020/21 @31 March @31 March Budget2021 2021
Revenue from Ordinary Activities132,671,220 132,671,220 Rates 132,635,061 135,709,946 3,074,885
7,370,748 7,415,348 Operating Grants, Subsidies and Contributions 5,732,661 5,555,589 (177,072)38,547,020 38,668,620 Fees and Charges 35,671,387 39,372,725 3,701,338 F 10%
410,000 410,000 Service Charges 410,000 423,693 13,6934,045,280 4,045,280 Interest Earnings 2,817,082 1,365,051 (1,452,031) U (52%)2,864,070 2,864,070 Other Revenue 2,182,773 3,482,865 1,300,092 F 60%
185,908,338 186,074,538 Sub-Total Ordinary Revenue 179,448,963 185,909,869 6,460,905
Expenses from Ordinary Activities(84,273,270) (84,514,050) Employee Costs (62,826,982) (59,454,285) 3,372,697(36,924,742) (40,864,022) Materials and Contracts (31,801,336) (25,880,127) 5,921,209 F (19%)(7,030,750) (7,030,750) Utility Charges (5,273,065) (4,559,607) 713,459 F (14%)
(44,669,250) (44,669,250) Depreciation on Non-Current Assets (33,501,937) (31,286,662) 2,215,275(1,525,770) (1,525,770) Interest Expenses (1,024,229) (908,242) 115,987 F (11%)(2,437,650) (2,437,650) Insurance Expenses (1,828,237) (2,722,095) (893,857) U 49%(1,470,897) (1,470,897) Other Expenditure (1,103,173) (880,927) 222,246 F (20%)
(178,332,329) (182,512,389) Sub-Total Ordinary Expenses (137,358,960) (125,691,945) 11,667,016
7,576,009 3,562,149 Ordinary Activities 42,090,003 60,217,924 18,127,921
Add Non Ordinary Activities3,296,600 3,296,600 Developer Contribution Plans: Cash 2,472,450 19,070,492 16,598,042 F 671%3,885,130 3,885,130 Developer Contribution Plans: In Kind - - - -(989,120) (989,120) Land Ceded to the Crown
14,000,000 14,000,000 Non-operating Gifted Assets from Developers22,654,270 28,743,180 Non-operating Grants, Subsidies and Contributions 23,079,612 13,939,637 (9,139,975) U (40%)
(429,480) (429,480) Profit/(Loss) on Asset Disposal (322,110) 381,150 703,260 F (218%)5,000,000 5,000,000 Unrealised Gain from Other Financial Assets: EMRC - - - -
54,993,409 57,068,459 Net Result 67,319,956 93,609,203 26,289,248
54,993,409 57,068,459 Total Comprehensive Income 67,319,956 93,609,203 26,289,248
2018 2019 202022.00% 16.00% 16.00%
9.07 8.04 7.99
1.16 1.06 1.06
City of SwanStatement of Comprehensive Income
By Nature or TypeFor the Period Ended 31 March 2021
1.44The Own Source Revenue Coverage Ratio measures the local government's ability to cover operating expenses from own source revenue. The higher the ratio, the more self reliant the local government is. Allows greater flexibility as less external funds required for operational purposes. A ratio above 0.90 is considered low risk and less than 0.60 high risk.
Income Ratios Current MonthOPERATING SURPLUS RATIO 30.24%The Operating Surplus Ratio highlights the scale/extent of any operating surplus or deficit. It measures the degree to which revenue, after depreciation is generated to apply to future asset renewal. The higher the ratio the more financial capacity to deal with asset renewal before reliance on external sources of revenue. Ytd ratios will vary considerably from year end results. A ratio above 15% is considered low risk - an indication that own source income is available to fund capital expenditure initiatives over and above depreciation. A ratio below 0% is considered high risk.
DEBT SERVICE COVER RATIO 14.15The Debt Service Cover Ratio measures the ability to service debt out. A ratio above 5.00 is considered low risk. However, the higher the ratio, the better the financial condition. A ratio below 2.00 should be monitored carefully.
OWN SOURCE REVENUE COVERAGE RATIO

2.
Original Revised YTD Current YTD Actual $ Variance VAR % Var /
Budget Budget Revised BudgetNOTE Current
Budget2020/21 2020/21 31 March 31 March
2021 2021Revenue from Ordinary Activities
139,943,560 139,943,560 General purpose funding 137,899,688 140,106,018 2,206,3302,205,120 2,205,120 Governance 1,688,560 1,909,220 220,660 F 13%1,152,360 1,152,360 Law, order, public safety 1,016,770 1,203,955 187,185 F 18%
325,000 325,000 Health 306,250 330,579 24,3293,845,788 3,845,788 Education and welfare 2,884,341 2,504,311 (380,030) U (13%)
50,000 50,000 Housing 37,500 26,003 (11,497) U (31%)29,310,000 29,310,000 Community amenities 28,412,272 27,988,037 (424,235)4,393,460 4,393,460 Recreation and culture 3,295,095 5,801,781 2,506,686 F 76%1,356,750 1,401,350 Transport 1,222,162 2,141,897 919,734 F 75%1,205,000 1,326,600 Economic services 1,095,350 2,099,438 1,004,088 F 92%2,121,300 2,121,300 Other property and services 1,590,975 1,798,631 207,656 F 13%
185,908,338 186,074,538 Sub Total Revenue 179,448,963 185,909,869 6,460,905
Expenses from Ordinary ActivitiesExcluding Borrowing Expenses
(3,262,066) (3,260,436) General purpose funding (2,279,420) (2,203,949) 75,471(10,628,647) (10,678,917) Governance (8,149,507) (7,019,435) 1,130,071 F (14%)(6,023,667) (6,023,667) Law, order, public safety (4,517,751) (4,145,918) 371,832(2,205,193) (2,205,443) Health (1,654,144) (1,612,302) 41,843
(11,173,898) (11,176,818) Education and welfare (8,383,344) (7,100,926) 1,282,418 F (15%)(106,219) (106,219) Housing (79,664) (68,407) 11,257
(28,945,124) (32,946,214) Community amenities (25,709,933) (22,801,952) 2,907,981 F (11%)(38,335,830) (38,311,930) Recreation and culture (28,727,969) (25,831,544) 2,896,425 F (10%)(65,735,179) (65,755,839) Transport (49,322,047) (47,505,595) 1,816,452(7,790,371) (7,920,381) Economic services (5,972,788) (5,060,596) 912,192 F (15%)(2,600,365) (2,600,755) Other property and services (1,538,166) (1,433,077) 105,088
(176,806,559) (180,986,619) Sub Total Non-Borrowing Expense (136,334,731) (124,783,703) 11,551,028
Borrowing Expenses(22,300) (22,300) Governance (15,486) (9,318) 6,168 F (40%)
(334,580) (334,580) Community Amenities (225,681) (208,240) 17,440(404,110) (404,110) Recreation And Culture (270,965) (406,194) (135,228) U 50%(550,550) (550,550) Transport (368,660) (142,514) 226,145 F (61%)(214,230) (214,230) Other Property And Services (143,438) (141,976) 1,461
(1,525,770) (1,525,770) Sub Total Borrowing Expenses (1,024,229) (908,242) 115,987
7,576,009 3,562,149 Net Operating result 42,090,003 60,217,924 18,127,921
Non-Operating Grants, Subsidies & Contributions193,750 193,750 Governance 145,312 181,185 35,872250,000 250,000 Law, Order And Public Safety 187,500 - (187,500) U (100%)
7,181,730 7,953,930 Community Amenities 3,244,650 19,070,492 15,825,842 F 488%3,757,600 3,757,600 Recreation And Culture 2,818,200 1,464,220 (1,353,980) U (48%)
32,452,920 37,769,630 Transport 19,156,400 12,294,233 (6,862,167) U (36%)43,836,000 49,924,910 25,552,062 33,010,129 7,458,067
Profit / (Loss) on Disposal Of Assets- - Governance - 8,454 8,454- - Transport - 247,044 247,044
(429,480) (429,480) Other Property And Services (322,110) 125,653 447,763 F (139%)(429,480) (429,480) (322,110) 381,150 703,260
Land Ceded to the Crown(989,120) (989,120) Community Amenities - - - -(989,120) (989,120) - - -
Profit/(Loss) on Impairment of InvestmentsUnrealised Gain from Other Financial Assets:EMRC
5,000,000 5,000,000 General Purpose Funding - - - -
54,993,409 57,068,459 Net Result 67,319,956 93,609,203 26,289,248- - Other Comprehensive Income - - -
54,993,409 57,068,459 Total Comprehensive Income 67,319,956 93,609,203 26,289,248
City of SwanStatement of Comprehensive Income
By ProgramFor the Period Ended 31 March 2021

3.1
Description
2. Statement of Change in Equity
Financial Ratios 2018 2019 2020 Current MonthCURRENT RATIO 3.23 2.78 2.26 4.40
QUICK RATIO 3.20 2.76 2.24 4.35
UNTIED CASH TO TOTAL CREDITORS 65.89 6.71 9.13 21.15
This ratio assesses the City's ability to meet immediate commitments from readily available cash. Trade creditors include orders for goods and services that have been received but not paid and any amount owing for GST. The higher the ratio the better placed Council is to pay its Creditors. This ratio is always at its lowest point at the end of the financial year and the beginning of the new financial year as much of the cash reserves of the City has been expended by this time and collection of rates revenue is yet to accelerate. This ratio has improved over the last couple of years with an improvement in net funds available at the end of the year. In preparation for transition to the new financial management system, the majority of trade creditors were settled resulting in a $533k balance at the end of June 2018. As such, calculation of the untied cash to total creditors ratio was distorted.
A Current Ratio shows short - term paying ability with restricted assets removed from the current assets. It relates to the immediate financial sustainability of Council. A ratio greater than 1.00 (100%) indicates Council has more current assets than current liabilities. If less than 1.00 (100%), current liabilities are greater than current assets and there may be a short term funding issue.
1. Statement of Financial Position
AASB 101 requires all Councils to prepare a Statement of Financial Position, which discloses the assets, liabilities and equity of the Councilas at the reporting date. The ratepayer equity in the Council can be calculated by deducting total liabilities from total assets.
The purpose of the Statement of Financial Position is to provide a "snap - shot" of the overall financial position of the Council as at aparticular date. An entity shall present current and non-current assets, and current and non-current liabilities, as separate classificationson the face of its balance sheet and on the basis of liquidity. Subject to special requirements for revaluation of various classes of assets,accepted accounting practice includes well defined accounting principles. This convention dictates that an asset represents the value of aninvestment acquired to provide future economic benefit to an entity. The future economic benefits may be in the form of cash or cashequivalents or in the case of not-for-profit (including public sector) entities, the economic benefits are derived from meeting the entitiesobjectives of providing goods and services.
Councils are required by AASB 101 to prepare a Statement of Changes in Equity and include it in the Financial Statements. The Statementof Changes in Equity reconciles the opening and closing balances of each class of the local government's equity over the reporting period.It provides a summary of causes of the changes in equity and identifies specifically the changes in composition of the local government'sequity.
A Quick Ratio measures the short - term debt paying ability and the liquid position of the City of the Swan and the ability to pay its immediate debts with restricted assets and inventories removed from the calculation. The ratio should be greater than 1.00 (100%).
3.0 Statement of Financial Position & Equity
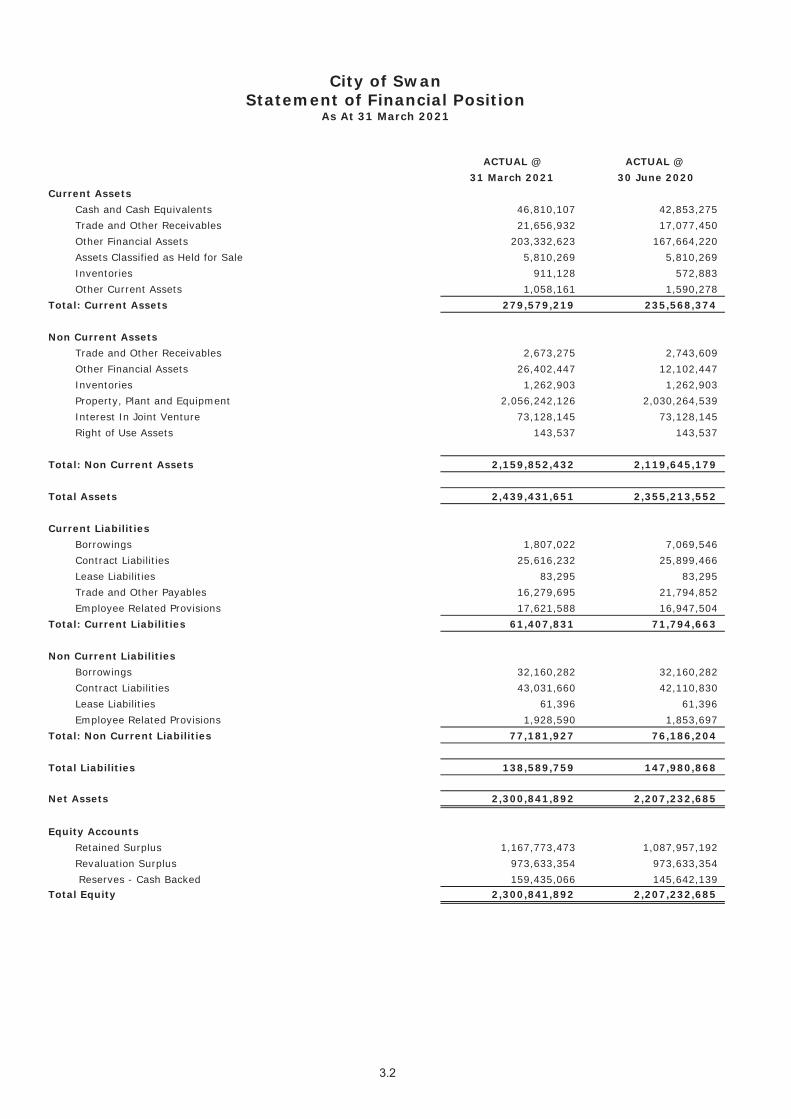
ACTUAL @ ACTUAL @31 March 2021 30 June 2020
Current AssetsCash and Cash Equivalents 46,810,107 42,853,275Trade and Other Receivables 21,656,932 17,077,450Other Financial Assets 203,332,623 167,664,220Assets Classified as Held for Sale 5,810,269 5,810,269Inventories 911,128 572,883Other Current Assets 1,058,161 1,590,278
Total: Current Assets 279,579,219 235,568,374
Non Current AssetsTrade and Other Receivables 2,673,275 2,743,609Other Financial Assets 26,402,447 12,102,447Inventories 1,262,903 1,262,903Property, Plant and Equipment 2,056,242,126 2,030,264,539Interest In Joint Venture 73,128,145 73,128,145Right of Use Assets 143,537 143,537
Total: Non Current Assets 2,159,852,432 2,119,645,179
Total Assets 2,439,431,651 2,355,213,552
Current LiabilitiesBorrowings 1,807,022 7,069,546Contract Liabilities 25,616,232 25,899,466Lease Liabilities 83,295 83,295Trade and Other Payables 16,279,695 21,794,852Employee Related Provisions 17,621,588 16,947,504
Total: Current Liabilities 61,407,831 71,794,663
Non Current LiabilitiesBorrowings 32,160,282 32,160,282Contract Liabilities 43,031,660 42,110,830Lease Liabilities 61,396 61,396Employee Related Provisions 1,928,590 1,853,697
Total: Non Current Liabilities 77,181,927 76,186,204
Total Liabilities 138,589,759 147,980,868
Net Assets 2,300,841,892 2,207,232,685
Equity AccountsRetained Surplus 1,167,773,473 1,087,957,192Revaluation Surplus 973,633,354 973,633,354 Reserves - Cash Backed 159,435,066 145,642,139
Total Equity 2,300,841,892 2,207,232,685
City of SwanStatement of Financial Position
As At 31 March 2021

RETAINED RESERVES CASH / ASSET REVALUATION TOTALSURPLUS INVESTMENT BACKED SURPLUS EQUITY
Balance as at 30 June 2019 1,088,951,274 141,828,299 973,010,369 2,203,789,942
Change in accounting Policy (67,984,835) (67,984,835)
Net Result 66,990,752 - - 66,990,752
- - 622,985 622,985
- 3,813,840 - 3,813,840
Balance as at 30 June 2020 1,087,957,192 145,642,139 973,633,354 2,207,232,685
Net Result 93,609,203 - - 93,609,203
- - - -(13,792,927) 13,792,927 - -
Balance as at 31 March 2021 1,167,773,473 159,435,066 973,633,354 2,300,841,892
ADDITIONAL DISCLOSURE ON CASH HOLDINGS, INVESTMENTS, RESERVES & MUNICIPAL FUNDS31 March 2021 30 June 2020
Cash/Investment Backed Reserves677,585 550,602
12,193,094 13,494,53384,378 72,396
1,142,713 1,365,4794,919,641 4,892,698
648,057 645,2391,876,263 1,452,6004,934,299 4,244,854
16,045,070 11,602,61421,747,904 24,537,73910,700,008 10,092,12117,956,526 13,281,510
386,662 297,182160,269 237,117
Urban Growth Corridor Sub-Regional Contributions27,104,446 23,660,5565,810,765 3,625,857
26,317,373 22,250,3651,305,636 4,441,0751,265,016 668,926
76,584 73,084242,258 242,258274,870 274,87030,770 30,770
216,120 216,12010,500 10,500
3,035,056 3,179,275- -
273,202 201,799159,435,066 145,642,139
9,677,062 9,588,606169,112,128 155,230,745
Add: Unrestricted cash / investmentc assets (i.e. MUNI funds) 106,997,979 66,922,530276,110,107 222,153,275
Consisting of:Cash and Cash Equivalents 46,810,107 42,853,275Term Deposits 229,300,000 179,300,000
276,110,107 222,153,275
- Unspent Specific Grants- Public Art
Sub total Cash/Investment Backed ReservesAdd: Other Restricted CashTotal of restricted cash / investment assets
TOTAL CASH AND CASH EQUIVALENTS , INVESTMENTS
- Roadwork
- Caversham- Dayton (West Swan East)- Bennett Springs- Bullsbrook Residential
Other Restricted Assets- Drainage- Footpath- Malaga Parking- Midland Parking- Ellenbrook Parking- Guildford Parking
- Brabham (Albion)
General InsuranceGravel Pit RehabilitationHazelmere/Guildford DrainageMidland District Drainage DevelopmentPlant & Equipment ReserveWaste ManagementEmployee Entitlements - LSLHazelmere Industrial Area Infrastructure - Stage 2Ellenbrook BridgeStrategic Development
Aveley Community
City of SwanStatement of Changes in Equity
For the Period Ended 31 March 2021
Other Comprehensive Income
Transfers from(to) Reserves
Other Comprehensive IncomeTransfers from(to) Reserves
Aged Services Asset ReplacementCity Asset ReplacementEllenbrook Community Facilities

4.1
Comments
Clayton / Cowie Roundabout incurred YTD costs of $583k or 65% of annual budget of $891k. The roundabout has beencompleted and opened to the public as of second quarter of the financial year. Outstanding works for landscaping andlinemarking will be completed by 30 May 2021.
Brabham Neighborhood Park spent $2.2m or 63% of its $3.5m annual budget. The park will be open to general publicon Monday 19 April 2021 as the project has reached practical completion.
Brabham Community Centre recorded $1.9m ($1.3m committed cost) of $2m annual budget. The construction of thepavilion is in progress with anticipated practical completion in May 2021.
Malaga Waste Transfer Station has reached practical completion recording $6.9m YTD cost or 101% against annualbudget of $6.8m. A budget adjustment will be submitted to address this budget overrun.
YTD costs for Haddrill Road is $1.2m ($570k committed) or 32% of $4.1m annual budget. Construction is in progresswith drainage section significantly completed while all other works are anticipated to be completed by 30 May 2021.
4.0 Capital
0
20
40
60
80
100
120
140
160
Jul Aug Sep Oct Nov Dec Jan Feb Mar Apr May Jun
Mill
ions
$
Capital Expenditure - Actual v Budgetwith Prior Year comparison
Actual 20/21 Budget 20/21
Prior Year Actual Prior Year Budget
-
10
20
30
40
50
60
70
80
Buildings Drainage Footpaths Parks Roads P&E, Other
Mill
ions
$
YTD Capital Works expenditure Actual & CommittedBudget

Page 1 of 5
YTD Capital Projects Summary ReportFor the Period Ending 31 March 2021
Expenses RevenueCode Description FY Budget YTD Actual Commitments YTD Total % of Budget FY Budget YTD Actual % of BudgetBCW - Building Capital Works
200000 BCW 28 Keane Street Building 30,000 17,595 0 17,595 59% 0 0 0%200001 BCW Administration Building 299,140 234,815 12,305 247,121 83% 0 0 0%200002 BCW Air Conditioning Renewal Program 139,910 62,229 93,764 155,994 111% 0 0 0%200003 BCW Alice Daveron Centre 491,900 41,751 33,933 75,684 15% 0 0 0%200005 BCW Swan Active Beechboro 1,080,240 57,619 21,650 79,269 7% 0 0 0%200006 BCW Altone Park Library 15,760 15,755 0 15,755 100% 0 0 0%200009 BCW Swan Active Ballajura 1,127,000 358,634 1,112,436 1,471,070 131% 0 0 0%200013 BCW Bellevue Hall 614,820 502,957 9,002 511,960 83% 0 0 0%200014 BCW Bin Compounds 23,000 0 24,984 24,984 109% 0 0 0%200017 BCW Bullsbrook Waste Transfer Sta 450,000 603,944 176,987 780,931 174% 0 0 0%200018 BCW Bus Shelters - Renewal Program 43,300 0 0 0 0% 21,300 0 0%200022 BCW Community Facilities 130,000 53,697 42,677 96,374 74% 0 0 0%200026 BCW District Park Active- Buildin 2,654,300 61,891 0 61,891 2% 0 0 0%200028 BCW Ellenbrook DOS Nthn 20,000 4,345 0 4,345 22% 0 0 0%200030 BCW Ellenbrook Leisure Centre 2,729,650 1,957,514 85,871 2,043,385 75% 0 260 0%200035 BCW Equipment Fire System Safety 69,000 4,309 73,860 78,169 113% 0 0 0%200045 BCW Integrated Systems Program 1,224,280 302,478 142,009 444,487 36% 0 0 0%200050 BCW Lock & Key Renewal Program 402,000 22,739 37,055 59,794 15% 0 0 0%200052 BCW Malaga Waste Transfer Station 6,861,370 6,808,240 144,023 6,952,264 101% 0 0 0%200053 BCW Malvern Springs Community Cen 61,120 52,273 0 52,273 86% 0 0 0%200055 BCW Midland Library 573,000 77,355 34,808 112,163 20% 0 0 0%200056 BCW Midland Junction Lotteries House 57,100 32,833 0 32,833 58% 0 0 0%200058 BCW Midland Town Hall 306,150 15,019 5,300 20,319 7% 0 0 0%200060 BCW Midland/Guildford Cricket Club 0 -1,044 0 -1,044 0% 0 0 0%200063 BCW Old Mechanical Workshop 346,810 18,456 33,360 51,816 15% 0 0 0%200064 BCW Operations Centre 569,750 497,424 57,074 554,498 97% 0 0 0%200069 BCW Ron Jose Park Pavilion 1,234,710 1,011,587 0 1,011,587 82% 375,000 125,000 33%200076 BCW Swan Active Midland 558,870 344,581 13,201 357,783 64% 0 0 0%200083 BCW West Gidgegannup Fire Station 13,730 12,393 0 12,393 90% 0 0 0%200085 BCW West Swan Home Supp 70,000 6,935 13,152 20,087 29% 0 0 0%200091 BCW Swan Guildford Artefact Store 242,000 58,340 11,847 70,187 29% 0 0 0%200100 BCW Woodlake Community Centre 18,900 0 0 0 0% 0 0 0%200108 BCW Bus Shelters - New Shelters 133,300 5,909 88,379 94,288 71% 21,300 0 0%200109 BCW Charlottes Vineyard Pavilion 0 7,687 0 7,687 0% 0 0 0%200110 BCW Ellenbrook Youth Facility 488,450 96,394 0 96,394 20% 0 0 0%200111 BCW Gidgegannup Country Womens Association 157,000 94,152 0 94,152 60% 0 0 0%200113 BCW Brockman Community Centre 3,931,580 590,623 4,900 595,523 15% 3,340,000 1,250,000 37%200116 BCW Heritage Buildings Renewal Program 10,000 0 0 0 0% 0 0 0%200119 BCW Brabham - Community Centre 2,060,200 602,664 1,331,067 1,933,731 94% 0 0 0%200122 BCW Bullsbrook Museum 140,000 458 126,373 126,831 91% 0 0 0%200123 BCW DCP Dayton Neighb. Park Community Buildi 94,840 94,488 0 94,488 100% 0 0 0%200124 BCW Guildford Library 55,200 0 0 0 0% 0 0 0%200127 BCW SP Men's Shed Sea Container Storage 39,970 18,072 0 18,072 45% 0 0 0%200128 BCW SP Rabbitohs Storage Shed 37,410 33,122 1,730 34,852 93% 0 0 0%200129 BCW SP Swan Valley Sporting Club 21,190 0 0 0 0% 0 0 0%200130 BCW SP Valley Bowls 50,000 0 0 0 0% 0 0 0%200131 BCW SP Admin building 67,410 72,591 0 72,591 108% 0 0 0%200132 BCW SP Baskerville Pavilion 620 3,177 0 3,177 512% 0 0 0%200133 BCW SP PA Percy Cullen Pavillion 55,560 25,762 0 25,762 46% 0 0 0%200134 BCW SP Ellenbrook Resource Centre 193,940 78,458 0 78,458 40% 0 0 0%200135 BCW SP Gidgegannup Country Womens Associatio 200,000 6,981 3,200 10,181 5% 0 0 0%200136 BCW SP Guildford Heritage Buildings 35,000 0 0 0 0% 0 0 0%200137 BCW SP Bus Shelters New City Wide 100,000 0 42,673 42,673 43% 0 0 0%200138 BCW SP Midland/Guilford Cricket Club 50,000 75,743 0 75,743 151% 0 0 0%200139 BCW SP Swan Active Beechboro 30,000 0 0 0 0% 0 0 0%200140 BCW SP West SwanHall 648,840 477,574 206,075 683,648 105% 0 0 0%200142 BCW The New Junction Modular Toilet Block 300,000 102,321 9,534 111,855 37% 0 0 0%200143 BCW Coolamon Pavilion 50,800 4,980 48,619 53,599 106% 0 0 0%200144 BCW Gidgegannup Showgrounds 105,000 84,863 0 84,863 81% 0 0 0%200145 BCW Lilac Hill Park Pavilion 180,000 0 3,123 3,123 2% 0 0 0%200147 BCW Guildford Town Hall 122,000 13,476 0 13,476 11% 0 0 0%200148 BCW Security Upgrades - Minor 50,000 0 0 0 0% 0 0 0%200232 BCW Gidgegannup Pony Club 22,840 7,997 0 7,997 35% 0 0 0%700073 BCW Kingfisher Oval Community Centre 49,970 182 0 182 0% 0 0 0%
BCW - Building Capital Works 31,938,930 15,734,335 4,044,970 19,779,305 62% 3,757,600 1,375,260 37%
BRG - Bridges Capital Works
800126 BRG Bells Rapids Footbridge, Brigadoon 70,000 0 0 0 0% 0 0 0%800128 BRG Beverley Terrace Boardwalk, South Guildford 155,000 21,622 0 21,622 14% 0 0 0%800135 BRG Reen Road Box Culvert, Gidgegannup 412,480 41,607 295,036 336,643 82% 0 0 0%800138 BRG West Swan Road Bridge, Belhus 418,310 0 0 0 0% 0 0 0%800186 BRG Sandown Bridge 25,000 0 0 0 0% 0 0 0%800193 BRG Rutland Road Bridge 397,000 863 0 863 0% 0 0 0%800194 BRG Arthur Street / Reid Hwy Overpass Bridge 5,000,000 5,000,000 0 5,000,000 100% 0 0 0%800243 BRG Blackadder Creek - Great Northern 55,200 0 0 0 0% 48,000 24,000 50%800244 BRG Central Lakes Footbridge 30,000 0 0 0 0% 0 0 0%800246 BRG Paperbark Place Footbridge 35,000 0 0 0 0% 0 0 0%800248 BRG Shelduck Park Boardwalk 30,000 0 0 0 0% 0 0 0%800250 BRG Susannah Brook POS Bridge 20,000 0 0 0 0% 0 0 0%800251 BRG The Brook Footbridge 35,000 0 0 0 0% 0 0 0%800252 BRG The Grapevine Boardwalk 160,000 123,861 13,762 137,623 86% 0 0 0%
BRG - Bridges Capital Works 6,842,990 5,187,952 308,798 5,496,750 80% 48,000 24,000 50%
DRN - Drainage
300022 DRN Midland Drainage, Midland 50,000 2,242 0 2,242 4% 0 0 0%300026 DRN Other Drainage Upgrades, Midland 0 17,377 8,678 26,056 0% 0 0 0%

Page 2 of 5
YTD Capital Projects Summary ReportFor the Period Ending 31 March 2021
Expenses RevenueCode Description FY Budget YTD Actual Commitments YTD Total % of Budget FY Budget YTD Actual % of Budget
300032 DRN William Street, Midland 125,000 103,449 18,120 121,570 97% 0 0 0%300038 DRN Blackadder Creek , Midland 140,000 33,655 0 33,655 24% 0 0 0%300024 DRN Morrison Road/Poynton Ave, Woodbridge 385,000 304,244 1,740 305,984 79% 0 0 0%300057 DRN Wynne Street, Hazelmere 457,000 45,277 3,770 49,047 11% 0 0 0%300044 DRN Swan Street, Guildford 0 77,480 21,615 99,095 0% 0 0 0%300059 DRN Loder Way, South Guildford 12,000 0 11,560 11,560 96% 0 0 0%300030 DRN Sophia Street, Bellevue 160,000 139,260 19,816 159,076 99% 0 0 0%300000 DRN Albert Street, Bellevue 487,890 226,965 84,168 311,132 64% 0 0 0%300048 DRN May Street, Bellevue 196,000 3,925 47,891 51,816 26% 0 0 0%300052 DRN Dayton Boulevard Drainage Clearing 50,000 7,997 17,799 25,795 52% 0 0 0%300054 DRN SP Other Drainage Upgrades 80,000 0 0 0 0% 0 0 0%300055 DRN SP Gidgegannup Showgrounds Drainage 100,000 0 16,500 16,500 17% 0 0 0%300056 DRN Croydon Street, Bellevue 240,000 400 51,752 52,152 22% 0 0 0%300058 DRN Altone Road, Beechboro 150,000 5,112 0 5,112 3% 0 0 0%300060 DRN Nottingham Gardens - Ballajura 88,000 0 0 0 0% 0 0 0%300061 DRN Bromley Road, Herne Hill 0 34,790 126 34,916 0% 0 0 0%
DRN - Drainage 2,720,890 1,002,174 303,535 1,305,709 48% 0 0 0%
FTP - Footpaths
400001 FTP City Wide Footpaths New 420,000 21,441 238,778 260,219 62% 0 0 0%400004 FTP Universal Access - Footpath 30,000 0 22,178 22,178 74% 0 0 0%400010 FTP West Swan Road 315,000 23,291 23,316 46,606 15% 200,000 80,000 40%400011 FTP Barbera Lane The Vines 0 18,089 0 18,089 0% 0 0 0%400013 FTP SP Ellenbrook/Aveley Footpath 47,820 3,142 0 3,142 7% 0 0 0%400014 FTP SP Illawarra Crescent 192,410 210,594 0 210,594 109% 0 0 0%400015 FTP SP Minor Footpath works 50,000 51,661 4,500 56,161 112% 0 0 0%400016 FTP SP Drumpellier Drive 150,000 48,220 0 48,220 32% 0 0 0%400017 FTP SP Railway Parade Footpath 484,800 389,355 10,124 399,479 82% 0 0 0%400018 FTP SP Wistful Wetlands Footpath 28,500 30,533 0 30,533 107% 0 0 0%400019 FTP Millhouse Road 87,000 0 28,323 28,323 33% 0 0 0%400020 FTP Mornington Park 180,000 231,595 68,280 299,875 167% 0 0 0%
FTP - Footpaths 1,985,530 1,027,919 395,499 1,423,417 72% 200,000 80,000 40%
ISV - Information Services
600008 ISV Leisure System Replacement 0 28,305 11,190 39,495 0% 0 0 0%600012 ISV One Council Implementation 1,924,920 96,632 38,324 134,955 7% 0 0 0%600030 ISV Library Services - Futures Labs 44,810 28,152 32 28,184 63% 0 0 0%600034 ISV ePlanning 138,070 17,900 687 18,587 13% 0 0 0%600035 ISV Snap Send Solve App 18,940 110 0 110 1% 0 0 0%912402 ISV Computer Upgrades & Replacement 1,225,430 533,335 62,377 595,712 49% 0 0 0%
ISV - Information Services 3,352,170 704,433 112,610 817,043 24% 0 0 0%
PRK - Parks and Reserves
700001 PRK Annies Landing Playgrounds 46,000 45,037 0 45,037 98% 0 0 0%700007 PRK Brabham Neighbourhood Park 3,518,210 2,151,478 79,776 2,231,254 63% 0 1,200 0%700012 PRK Central Park Toilets 4,860 4,966 0 4,966 102% 0 0 0%700013 PRK Chequers Club Bore/Irrigation 121,090 4,037 35,327 39,364 33% 0 0 0%700018 PRK Dayton Local Park - Passive 2,314,930 1,655,925 13,875 1,669,800 72% 0 0 0%700019 PRK Dayton Neighbourhood Park 3,530,450 1,751,864 45,217 1,797,080 51% 0 0 0%700020 PRK District Park Active 868,770 760,975 3,815 764,790 88% 0 1,200 0%700024 PRK Emu Lake Restoration 30,000 2,788 5,300 8,088 27% 0 0 0%700025 PRK Foreshore Restoration 15,000 1,812 0 1,812 12% 0 0 0%700031 PRK Foreshore Restrn-Middle Swan R 25,000 225,927 5,496 231,423 926% 0 0 0%700033 PRK Foreshore Restrn-Wangalla Brk 136,000 16,867 40,812 57,679 42% 0 0 0%700040 PRK Kings Meadow 75,980 0 0 0 0% 37,990 0 0%700044 PRK City Wide - Minor Park Furniture 20,000 3,546 1,400 4,946 25% 0 0 0%700053 PRK Acquisition of Public Art 150,000 9,867 59,000 68,867 46% 0 0 0%700054 PRK Regional Open Space - Whiteman 120,000 22,051 10,325 32,376 27% 120,000 0 0%700055 PRK Street Trees - Residential 250,000 110,857 25,343 136,200 54% 0 0 0%700056 PRK Reticulation/Hydrozoning 391,000 159,622 118,370 277,991 71% 0 112 0%700057 PRK Ron Jose Oval 0 79 0 79 0% 0 0 0%700058 PRK Street Trees - Rural 20,000 4,429 11,844 16,273 81% 0 0 0%700060 PRK Sports Oval Lighting - Minor 0 7,946 0 7,946 0% 0 0 0%700061 PRK Tourism Signage 0 0 27,740 27,740 0% 0 0 0%700062 PRK Altone AFL Oval Lighting Safety Rectification 218,320 186,160 0 186,160 85% 0 40,000 0%700064 PRK Kingfisher AFL Oval Lighting Safety Rectificat 211,240 191,253 0 191,253 91% 0 0 0%700066 PRK Percy Cullen Oval 55,000 21,534 8,350 29,884 54% 0 0 0%700071 PRK PA Stirling Square Light Horse 279,920 0 0 0 0% 0 0 0%700072 PRK PA Swan Valley Art Trail 0 25,875 0 25,875 0% 0 0 0%700074 PRK Bushland Preservation 118,000 35,678 13,500 49,178 42% 0 0 0%700075 PRK Parks Electrical Infrastructure 152,000 35,371 0 35,371 23% 0 0 0%700076 PRK Minor Projects Parks & Streetscapes 104,500 71,901 8,829 80,729 77% 0 0 0%700077 PRK City Wide - Parks & Streetscapes Renewal Pr 52,500 33,464 5,811 39,275 75% 0 0 0%700081 PRK Multigenerational Space 150,000 0 0 0 0% 0 0 0%700084 PRK Ron Jose Park - Lighting 358,500 0 2,000 2,000 1% 300,000 0 0%700088 PRK Pickett Park, Bullsbrook 37,000 8,181 1,103 9,284 25% 0 0 0%700094 PRK Woodlake Park, Ellenbrook 60,000 59,272 5,939 65,211 109% 0 0 0%700097 PRK New Junction Public Open Space 3,400,000 1,202,386 189,781 1,392,167 41% 1,320,430 770,595 58%700099 PRK Midland Skate Park 1,730,000 673,382 809,132 1,482,514 86% 1,000,000 0 0%700104 PRK Bluegum Park 35,000 0 0 0 0% 0 0 0%700106 PRK Fawell Park 9,000 8,739 0 8,739 97% 0 0 0%700108 PRK SP Sandown Park 150,000 25,863 0 25,863 17% 0 0 0%700109 PRK SP Dayton Dog Park 150,000 29,664 0 29,664 20% 0 0 0%700110 PRK SP Dulcie Liddlelow 56,000 61,716 9,809 71,524 128% 0 0 0%700111 PRK SP Hamelin Park 25,000 15,954 0 15,954 64% 0 0 0%

Page 3 of 5
YTD Capital Projects Summary ReportFor the Period Ending 31 March 2021
Expenses RevenueCode Description FY Budget YTD Actual Commitments YTD Total % of Budget FY Budget YTD Actual % of Budget
700112 PRK SP Jenna Pulin Crescent 7,000 10,675 0 10,675 152% 0 0 0%700113 PRK SP Jungle Park 35,000 44,590 0 44,590 127% 0 0 0%700114 PRK SP Lighting and shade structures at SRRP 100,000 121,698 0 121,698 122% 0 0 0%700115 PRK SP Livvi's Playground 52,000 46,480 0 46,480 89% 0 0 0%700116 PRK SP Lowrey Park 15,000 9,401 0 9,401 63% 0 0 0%700117 PRK SP Upper Swan Primary School 16,500 0 0 0 0% 0 0 0%700118 PRK SP Valley Bowls - Artificial Turf Replacement 150,000 135,026 0 135,026 90% 0 0 0%700119 PRK SP Altone Park Oval 244,970 120,851 0 120,851 49% 0 0 0%700121 PRK SP Aveley Central Park - Shade Sails 210,000 57,321 24,421 81,742 39% 0 0 0%700122 PRK SP Percy Cullen Oval 30,000 28,463 0 28,463 95% 0 0 0%700123 PRK SP Kingfisher AFL Oval Kingfisher Oval - Drai 115,000 0 0 0 0% 0 0 0%700124 PRK SP Drumpellier Drive 116,000 114,797 476 115,274 99% 0 0 0%700126 PRK SP Swan Active Ballajura 43,010 43,010 0 43,010 100% 0 0 0%700127 PRK SP Swan Active Beechboro 46,990 43,125 0 43,125 92% 0 0 0%700130 PRK SP Woodlake Park 30,000 27,502 0 27,502 92% 0 0 0%700132 PRK Dayton Boulevard BMX Track 10,000 0 0 0 0% 0 0 0%700133 PRK Midvale Netball Centre 88,000 0 95,769 95,769 109% 0 0 0%700134 PRK Charlottes Playing Fields 360,000 2,585 3,000 5,585 2% 0 0 0%700136 PRK Dulcie Netball Courts 89,000 0 4,500 4,500 5% 0 0 0%700137 PRK Lillac Hill Cricket Ground 50,000 25,039 0 25,039 50% 0 0 0%700138 PRK Turkich Parade Oval 10,000 9,357 0 9,357 94% 0 0 0%700140 PRK Foreshore Restrn-Ardmore Park 20,000 19,603 0 19,603 98% 0 0 0%700142 PRK Foreshore Restrn-Guildford Wharf 100,000 26,223 12,468 38,691 39% 50,000 0 0%700143 PRK Darling Range Public Art 20,000 17,817 0 17,817 89% 0 0 0%700145 PRK Central Lakes 50,000 3,746 0 3,746 7% 0 0 0%700146 PRK Maguire Oval 110,000 67,604 179 67,784 62% 0 0 0%700148 PRK SP Almeria Park 120,000 91,059 18,596 109,655 91% 0 0 0%700149 PRK SP Alta Laguna Tennis Court Playground 140,000 17,368 144,634 162,002 116% 0 0 0%700150 PRK SP Altone Park Rec Centre 100,000 19,223 95,129 114,353 114% 0 0 0%700151 PRK SP Anna Plains 114,000 118,887 0 118,887 104% 0 0 0%700152 PRK SP Baskerville Hall 100,000 16,752 91,415 108,167 108% 0 0 0%700153 PRK SP Bluegum Park 100,000 95,799 0 95,799 96% 0 0 0%700154 PRK SP Brilliant Rise Park 100,000 124,058 0 124,058 124% 0 0 0%700155 PRK SP Caloria Park 30,000 31,395 0 31,395 105% 0 0 0%700156 PRK SP Carew Park 104,630 102,401 1,586 103,986 99% 0 0 0%700157 PRK SP Central Lakes 170,000 224,012 0 224,012 132% 0 0 0%700158 PRK SP Coonawarra Park 120,000 18,775 120,186 138,962 116% 0 0 0%700159 PRK SP Corti Park 60,000 0 49,900 49,900 83% 0 0 0%700160 PRK SP Fountain Park 139,000 146,136 0 146,136 105% 0 0 0%700161 PRK SP Grassdale Wetland 100,000 15,657 77,888 93,546 94% 0 0 0%700162 PRK SP Holmesdale Park 126,390 129,236 5,608 134,844 107% 0 0 0%700163 PRK SP Kingsmeadow Oval 140,000 878 0 878 1% 0 0 0%700164 PRK SP Kulungar Park 100,000 9,298 84,598 93,896 94% 0 0 0%700165 PRK SP Lockridge Family Centre 20,000 12,496 0 12,496 62% 0 0 0%700166 PRK SP Maguire Oval 160,000 171,380 0 171,380 107% 0 0 0%700167 PRK SP Natham Square Park 120,000 21,231 138,144 159,375 133% 0 0 0%700168 PRK SP Ron Jose Oval 130,000 20,586 126,027 146,613 113% 0 0 0%700169 PRK SP Sacramento Park 100,000 17,396 102,459 119,855 120% 0 0 0%700170 PRK SP Saint Elias Place Park 100,000 9,796 91,803 101,599 102% 0 0 0%700171 PRK SP Simla Park 100,000 11,996 84,239 96,235 96% 0 0 0%700172 PRK SP Stirling Square 120,000 0 125,037 125,037 104% 0 0 0%700174 PRK SP Delapre Park 51,930 56,052 0 56,052 108% 0 0 0%700175 PRK SP Oakhill Park 119,440 17,046 76,743 93,788 79% 0 0 0%700176 PRK SP Warnock Park 100,000 19,271 84,559 103,830 104% 0 0 0%700178 PRK SP Lloyd Penn Park 560,000 40,566 343,259 383,824 69% 0 0 0%700179 PRK Foreshore Restrn-Bells Rapids 77,050 3,190 0 3,190 4% 38,520 0 0%700180 PRK Baskerville Oval - Parks & Streetscapes 77,000 57,765 0 57,765 75% 0 0 0%700181 PRK SP Bottlebrush POS 100,000 13,769 111,530 125,299 125% 0 0 0%
PRK - Parks and Reserves 24,907,180 12,234,853 3,652,045 15,886,897 64% 2,866,940 860,941 30%
RDN - Roads
800016 RDN Campersic Road 5,270 0 0 0 0% 0 0 0%800021 RDN Chittering Road 65,000 62,457 1,668 64,125 99% 0 0 0%800022 RDN Contributions to Works by Others 200,000 38,614 0 38,614 19% 0 0 0%800025 RDN Drumpellier Drive 78,200 79,120 0 79,120 101% 0 0 0%800028 RDN Ellenbrook Town Centre Parking 40,000 0 0 0 0% 0 0 0%800030 RDN Gnangara Road 75,000 2,228 0 2,228 3% 0 0 0%800031 RDN GNH/Bishop Road 0 65 0 65 0% 0 0 0%800032 RDN Guildford Parking Infrastructu 50,000 794 0 794 2% 0 0 0%800033 RDN Haddrill Road 4,100,000 721,553 570,466 1,292,020 32% 661,080 388,277 59%800037 RDN Helena River Footbridge 0 34,087 119,608 153,695 0% 0 30,000 0%800038 RDN Henley Brook Avenue 3,545,000 2,764,510 107,040 2,871,550 81% 1,630,000 652,000 40%800039 RDN Isodoon St (Ex Lord Street) Dayton 64,870 10,120 52,501 62,621 97% 0 0 0%800045 RDN Investigation, Design Projects 300,000 271,579 174,545 446,123 149% 0 0 0%800051 RDN Lord Street Midland 350,000 214,587 69,852 284,439 81% 0 0 0%800053 RDN Local Roads Program - Testing 300,000 93,651 44,672 138,323 46% 0 0 0%800054 RDN Daviot RD (Ex Lord Street) Caversham 3,700,000 8,441 100 8,541 0% 0 0 0%800056 RDN Maralla Road 70,000 21,242 115,902 137,143 196% 0 0 0%800058 RDN Marshall Road 2,208,690 476,295 240,283 716,578 32% 413,870 163,139 39%800061 RDN Midland Parking 50,000 0 0 0 0% 0 0 0%800065 RDN Morrison Road 815,000 194,484 574,329 768,813 94% 254,130 100,338 39%800073 RDN O'Brien Road 200,000 148,896 0 148,896 74% 0 0 0%800074 RDN Oxleigh Drive 0 2,700 0 2,700 0% 0 75,013 0%800088 RDN Street Lighting Upgrades 11,500 3,496 3,542 7,038 61% 0 0 0%800090 RDN Brabham & Dayton - Henley Brook Ave 35,000 68,587 1,000 69,587 199% 0 0 0%800096 RDN Traffic Safety Minor Projects 75,000 521 30,821 31,342 42% 0 0 0%800103 RDN West Swan / Millhouse Road Roundabout 0 112,444 29,265 141,709 0% 0 18,005 0%800104 RDN West Swan Road 75,000 0 0 0 0% 0 0 0%800142 RDN Military Road, Midland 0 768 0 768 0% 0 0 0%

Page 4 of 5
YTD Capital Projects Summary ReportFor the Period Ending 31 March 2021
Expenses RevenueCode Description FY Budget YTD Actual Commitments YTD Total % of Budget FY Budget YTD Actual % of Budget
800146 RDN Losino BVD, Henleybrook 0 44 0 44 0% 0 0 0%800149 RDN Ashmere Drive, Bullsbrook 0 65 0 65 0% 0 0 0%800158 RDN Hillside Grove, Ballajura 0 182 0 182 0% 0 0 0%800166 RDN Railway Prade, Bullsbrook 793,880 715,884 222,545 938,429 118% 785,000 314,000 40%800173 RDN Apple Street, Upper Swan 2,214,520 785,509 65,909 851,418 38% 0 0 0%800174 RDN Lloyd Street Extension MRWA 3,337,000 2,454,279 452,355 2,906,635 87% 3,337,000 3,428,958 103%800175 RDN Lord/Bennett Street Intersection 0 4,195 0 4,195 0% 0 0 0%800176 RDN Stock Road extension, Bullsbrook 20,961,070 965,445 148,373 1,113,818 5% 7,397,140 0 0%800177 RDN The Broadway, Ellenbrook 2,200,000 3,523,541 247,804 3,771,345 171% 2,200,000 5,039,140 229%800178 RDN Lloyd Street Hazelmere Industrial Area 712,090 121,798 73,106 194,903 27% 0 0 0%800179 RDN Stirling Crescent Hazelmere Industrial Area 3,812,640 18,078 195,561 213,639 6% 0 0 0%800182 RDN Gumnuts Community Centre Carpark 0 27 0 27 0% 0 0 0%800185 RDN Suffolk between Lord St & West Swan Rd 80,000 92,931 0 92,931 116% 0 0 0%800196 RDN Clayton Street Rason Parade to Henkin Stree 0 24,807 0 24,807 0% 0 40,933 0%800200 RDN New Junction The Avenue 0 13,696 0 13,696 0% 0 0 0%800204 RDN Clayton Street Bellvue 180,000 150,882 6,169 157,051 87% 0 0 0%800209 RDN Lilydale Road Gidgegannup 85,000 0 0 0 0% 0 0 0%800212 RDN Clayton / Cowie Roundabout 891,000 508,205 74,913 583,118 65% 0 0 0%800216 RDN SP Swan Valley Tourism Signage 100,000 0 84,038 84,038 84% 0 0 0%800217 RDN SP Roland Road 9,220 0 0 0 0% 0 0 0%800218 RDN SP Morrison Road Crossing (east of railway l 50,000 14,602 20,211 34,814 70% 0 0 0%800219 RDN The Workshop Ave 5,100,810 92,352 8,767 101,119 2% 0 0 0%800220 RDN Bellefin/ Hepburn Intersection 10,000 0 0 0 0% 0 0 0%800221 RDN Marangaroo/Hepburn Intersection 10,000 0 0 0 0% 0 0 0%800222 RDN Pelican/Bellefin Intersection 10,000 0 0 0 0% 0 0 0%800223 RDN Malaga Drive 570,000 424,882 274,545 699,427 123% 281,600 220,502 78%800224 RDN Beringarra Avenue, Malaga 895,000 481,289 244,439 725,728 81% 0 0 0%800225 RDN Charles Street, Midland 450,000 27,200 9,405 36,605 8% 0 0 0%800227 RDN Coolga Road, Koongamia 85,000 50,333 19,193 69,526 82% 0 0 0%800228 RDN Dance Drive, Middle Swan 120,000 14,441 7,618 22,058 18% 0 0 0%800229 RDN Kirby Road, Bullsbrook 80,000 63,297 3,517 66,814 84% 0 0 0%800231 RDN Mulgul Road, Malaga 100,000 75,645 0 75,645 76% 0 0 0%800232 RDN Sefton Ave Viveash 90,000 0 0 0 0% 0 0 0%800233 RDN Spring Ave Midland 210,000 32,432 137,170 169,602 81% 0 0 0%800234 RDN Toodyay Rd, Middle Swan 250,000 192,415 14,966 207,381 83% 0 0 0%800235 RDN Wagoora Pl Koongamia 100,000 92,606 4,048 96,654 97% 0 0 0%800236 RDN Woollcott Ave West Swan 1,254,540 37,888 154,754 192,642 15% 0 0 0%800237 RDN Clayton St/Military Rd Intersection 20,000 0 0 0 0% 0 0 0%800238 RDN Dulwich/Marshall Rd Roundabout 675,000 776,250 0 776,250 115% 0 0 0%800239 RDN Midland Rd 3,500,000 541,337 660,708 1,202,045 34% 1,323,480 0 0%800240 RDN Administration Building Parking 144,000 74,691 7,395 82,086 57% 0 0 0%800247 RDN Bushby Street South 20,000 0 2,470 2,470 12% 0 0 0%800253 RDN Arthur Street Caversham 591,680 951,832 0 951,832 161% 0 0 0%800256 RDN Talbot Road Hazelmere Industrial Area 524,800 0 113,628 113,628 22% 0 0 0%800257 RDN Barbera Lane 20,000 14,812 0 14,812 74% 0 453 0%800258 RDN Chittering/Meadowbrook Road 28,000 20,089 1,500 21,589 77% 0 0 0%800259 RDN Clayton Street and Jinda Road 24,000 0 2,100 2,100 9% 0 0 0%800260 RDN Cope Street 65,000 10,911 0 10,911 17% 0 0 0%800261 RDN Ferguson Street 24,000 7,852 0 7,852 33% 0 0 0%800262 RDN James Street 35,000 22,977 0 22,977 66% 0 0 0%800263 RDN Main Street 170,000 135,183 6,266 141,449 83% 0 0 0%800264 RDN CSP Rural Road, Gidgegannup 400,000 183,806 217,797 401,604 100% 0 0 0%800265 RDN CSP Glenbrook Drive, Ballajura 400,000 239,444 672 240,116 60% 0 0 0%800266 RDN CSP Gartrell Street, Midland 250,000 197,091 0 197,091 79% 0 0 0%800267 RDN CSP Millhouse Road Aveley 100,000 0 0 0 0% 0 0 0%800268 RDN CSP Lilydale Road Gidgegannup 200,000 209,731 0 209,731 105% 0 0 0%800269 RDN CSP Reserve Road Gidgegannup 321,380 218,219 0 218,219 68% 0 0 0%800270 RDN CSP Neaves Road Bullsbrook 50,000 49,986 0 49,986 100% 0 0 0%800271 RDN Maroubra Ave, Bullsbrook 34,710 202 30,748 30,950 89% 0 0 0%800273 RDN Bullsbrook Transfer Station 150,000 170,979 0 170,979 114% 0 0 0%
RDN - Roads 68,922,870 20,135,580 5,648,285 25,783,865 37% 20,004,680 11,331,448 57%
LND - Land
912005 LND Dayton Land Acquisition 0 6,706 0 6,706 0% 0 0 0%912078 LND Paradise Quays 0 2,527 4,210 6,737 0% 0 0 0%912082 LND - New Junction Planning 100,000 77,694 27,939 105,633 106% 0 0 0%912084 LND 4 The Avenue 0 50,874 0 50,874 0% 0 0 0%912086 LND 45 Sayer Street, Midland 0 6,002 0 6,002 0% 0 0 0%912087 LND 41 Moore St, Herne Hill 0 204 0 204 0% 0 0 0%912088 LND New Junction L19 The Crescent Midland 0 256,000 0 256,000 0% 0 0 0%
LND - Land 100,000 400,006 32,149 432,155 432% 0 0 0%
VEH - Vehicles
912802 MVE Community Care Vehicles Replacement 290,000 0 0 0 0% 0 0 0%912803 MVE Light Fleet Vehicles - Replacement 2,422,450 557,083 917,497 1,474,580 61% 0 0 0%912805 MVE Light Fleet Vehicle: New 30,000 0 37,362 37,362 125% 0 0 0%
VEH - Vehicles 2,742,450 557,083 954,859 1,511,942 55% 0 0 0%
PEQ - Plant and Equipment
600006 PEQ Fire Fighting Assets 25,000 3,300 13,559 16,859 67% 0 0 0%600024 PEQ Security Systems - CCTV - Software/Equipm 50,000 24,417 0 24,417 49% 0 0 0%600032 PEQ Trailers 43,540 11,734 956 12,690 29% 0 0 0%600033 PEQ CCTV Mobile Units 250,000 0 0 0 0% 250,000 0 0%800075 PEQ Parking Technology 100,000 0 0 0 0% 0 0 0%912703 PEQ Plant & Equipment - Replacement 2,399,160 496,612 161,144 657,755 27% 0 0 0%

Page 5 of 5
YTD Capital Projects Summary ReportFor the Period Ending 31 March 2021
Expenses RevenueCode Description FY Budget YTD Actual Commitments YTD Total % of Budget FY Budget YTD Actual % of Budget
912706 PEQ Waste Management - Replacement 2,036,000 49,193 1,172,300 1,221,493 60% 0 0 0%PEQ - Plant and Equipment 4,903,700 585,255 1,347,959 1,933,214 39% 250,000 0 0%
FFE - Office Furniture, Fittings and Equipment
943200 FFE Altone Library 20,000 13,860 1,834 15,694 78% 0 0 0%943300 FFE Ballajura Library 20,000 11,050 0 11,050 55% 0 0 0%943400 FFE Bullsbrook Library 20,000 6,889 3,846 10,735 54% 0 0 0%943500 FFE Ellenbrook Library 20,000 0 4,878 4,878 24% 0 0 0%943600 FFE Guilford Library 5,000 4,800 0 4,800 96% 0 0 0%943700 FFE Midland Library 20,000 17,831 7,960 25,791 129% 0 0 0%945120 FFE Midland Sports Complex 13,000 0 0 0 0% 0 0 0%945201 FFE Swan Active Beechboro 82,400 28,802 0 28,802 35% 0 0 0%945312 FFE Swan Active Ballajura 40,500 8,746 5,590 14,336 35% 0 0 0%945513 FFE Swan Active Midland 111,000 0 0 0 0% 0 0 0%945516 FFE Ellenbrook District Open Space 8,200 3,780 3,459 7,239 88% 0 0 0%971400 FFE Administration Building 57,000 6,828 360 7,188 13% 0 0 0%
FFE - Office Furniture, Fittings and Equipment 417,100 102,586 27,927 130,513 31% 0 0 0%
Total Funded Capital Works 148,833,810 57,672,176 16,828,635 74,500,811 50% 27,127,220 13,671,648 50%
In-Kind Assets contributed by DevelopersRoad, Drainage and Footpaths
960000 INK DCP Roads Dayton 989,120 0 0 0 0% 0 0 0%960002 INK DCP Roads - Caversham 2,896,010 0 0 0 0% 0 0 0%960003 INK DCP Road Works - Other 8,000,000 0 0 0 0% 0 0 0%960004 INK DCP Stormwater Drainage - Other 2,500,000 0 0 0 0% 0 0 0%960008 INK DCP Cycleways/Footpaths - Other 2,250,000 0 0 0 0% 0 0 0%
Total Road, Drainage and Footpaths 16,635,130 0 0 0 0% 0 0 0%
Recreation/Parks960007 INK Other 1,250,000 0 0 0 0% 0 0 0%
Total Recreation/Parks 1,250,000 0 0 0 0% 0 0 0%
In-Kind Assets contributed by Developers 17,885,130 0 0 0 0% 0 0 0%
Total Capital Works Program 166,718,940 57,672,176 16,828,635 74,500,811 45% 27,127,220 13,671,648 50%

On 11 March 2020, the World Health Organisation declared Coronavirus (COVID-19) as a pandemic. In response, the Government of Western Australia has declared a State of Emergency and a Public Health Emergency under the Emergency Management Act 2005 section 56.
The City has responded swiftly through multiple measures designed to stimulate the economy and assist community and business to respond and recover through the pandemic. Those measures were endorsed by Council at the Special Council Meeting of 15 April 2020.
On 31 January 2021, a 5-day lockdown was imposed on Perth metropolitan area, Peel region and the South West region, which ended on 5 February 2021. It was followed by another 8-day restrictions for the Perth and Peel regions, which was lifted at 12am on 14 February 2021. WA has since returned to the pre-lockdown life, masks are no longer required in most places while the controlled interstate border and certain capacity restrictions are still in place. For most businesses and venues, contact registers are still mandatory to assist contact tracing if it is required.
To date, the State Government has successfully managed to keep WA community from any major COVID-19 outbreak through the implementation of its hard and controlled interstate border. Interstate travel is permitted into and around WA, depending on where travelers have come from and who they’ve had contact with in the 14 days prior to travel. They are also subject to conditions, including completing a G2G PASS declaration prior to entry.
The Australian Government commenced the roll-out of the COVID-19 vaccination program on 22 February 2021. The first shipment of 5000 doses of the Pfizer/BioNTech vaccine arrived on Sunday, 21 February 2021, ahead of the launch of COVID-19 vaccination in WA. The program is free and voluntary, and is being implemented in a phased priority approach as increasing supply becomes available in WA. At-risk and vulnerable populations including quarantine and border workers, high-risk frontline health care workers, and aged care & disability care staff are the first group, named Phase 1a, to be eligible for the vaccine.
The rollout will be expanded to other priority groups at the end of March 2021 and most West Australians are expected to be vaccinated by the end of October 2021.
The City supports its staff to make informed decisions on COVID-19 vaccination by encouraging them to read the information on the program available from the Australian Government, and seek medical professorial opinion for any questions.
In total, the WA Department of Health has administered 50,731 COVID-19 vaccinations, including 6,700 people who have received both doses.
WA remains in a State of Emergency, which has been extended until 12am on 9 April 2021.
5.0 Council response to COVID-19

Council at the Special Council Meeting 15 April 2020 resolved to provide an Economic Stimulus Package (ESP) of $8.8m to increase local investment, encourage job creation and inject money quickly into the local economy through the provision of ‘shovel ready’ capital works and major maintenance programs. Budgeted value of projects delivered in 2019/20 $567k and balance of $8.2m budgeted in 2020/21.
The City is continuing to progress a number of capital works projects under the stimulus package. 79% of the 2020/21 budget has been spent to date.
Comments
The Building Capital works budgeted at $1.5m incurred $791k actual cost, comprising Men’s Shed($18k), Rabbitohs Storage Shed ($33k), Administration Building ($73k), Ellenbrook Resource Centre($78k), Baskerville Pavilion ($3.2k), Gidgegannup Country Womens Association ($7k),Midland/Guildford Cricket Club ($76k), PA Percy Cullen Pavilion ($26k) and West Swan Hall ($478k).$282k has been committed primarily against Swan Valley Sporting Club ($25k), Rabbitohs StorageShed ($1.7k), West Swan Hall ($206k), Gidgegannup Country Womens Association ($6.3k) and BusShelters New City Wide ($43k). 70% of budget has been spent to date.
Drainage works budgeted at $180k shows $17k commitments against Gidgegannup Showgrounds.
Footpath budgeted at $953k has expended $734k, attributed to Railway Parade Footpath ($389k),Illawarra Crescent ($211k), Minor Footpath works ($52k), Drumpellier Drive ($48k), and WistfulWetlands Footpath ($31k). Total commitments of $15k were recorded for Railway Parade Footpathand Minor Footpath works. Actuals and commitments total 78% of budget.
Park and Reserves budgeted at $5.2m incurred total cost of $4.5m ($2.0m commitments). Thesecomprises projects such as Central Lakes ($224k), Maguire Oval ($171k), Alta Laguna Tennis CourtPlayground ($162k), Natham Square Park ($159k), Ron Jose Oval ($147k) and Lloyd Penn Park($384k). Sandown Park has been cancelled and has been approved by the recent OMC on 17 Feb2021. Out of a total of 49 projects, 20 of these projects have reached completion. These completedprojects made up of $1.6m incurred total cost. In total, 86% of the budget has been spent to date.
$159k was budgeted for Roads with Swan Valley Tourism Signage incurring $84k and MorrisonRoad Crossing $40k.
The total Operating Expenditure funded by stimulus package recorded $3k expenditure to datewith budget of $135k.
$- $1,000 $2,000 $3,000 $4,000 $5,000 $6,000
Building Drainage Footpaths Parks &Reserves
Roads Operating
"000
Stimulus Projects Expenditure by Asset Class
Budget Actual
5.1 COVID-19 Stimulus Package Projects

ExpensesCode Description FY Budget YTD Actual Commitments YTD Total % of Budget
BCW - Building Capital Works
200127 BCW SP Men's Shed Sea Container Storage 39,970 18,072 0 18,072 45%200128 BCW SP Rabbitohs Storage Shed 37,410 33,122 1,730 34,852 93%200129 BCW SP Swan Valley Sporting Club 21,190 0 25,000 25,000 118%200130 BCW SP Valley Bowls 50,000 0 0 0 0%200131 BCW SP Admin building 67,410 72,591 0 72,591 108%200132 BCW SP Baskerville Pavilion 620 3,177 0 3,177 512%200133 BCW SP PA Percy Cullen Pavillion 55,560 25,762 0 25,762 46%200134 BCW SP Ellenbrook Resource Centre 193,940 78,458 0 78,458 40%200135 BCW SP Gidgegannup Country Womens Association 200,000 6,981 6,250 13,231 7%200136 BCW SP Guildford Heritage Buildings 35,000 0 0 0 0%200137 BCW SP Bus Shelters New City Wide 100,000 0 42,673 42,673 43%200138 BCW SP Midland/Guilford Cricket Club 50,000 75,743 0 75,743 151%200139 BCW SP Swan Active Beechboro 30,000 0 0 0 0%200140 BCW SP West SwanHall 648,840 477,574 206,075 683,649 105%
BCW - Building Capital Works 1,529,940 791,480 281,728 1,073,208 70%
DRN - Drainage
300054 DRN SP Other Drainage Upgrades 80,000 0 0 0 0%300055 DRN SP Gidgegannup Showgrounds Drainage 100,000 0 16,500 16,500 17%
DRN - Drainage 180,000 0 16,500 16,500 9%
FTP - Footpaths
400013 FTP SP Ellenbrook/Aveley Footpath 47,820 3,142 0 3,142 7%400014 FTP SP Illawarra Crescent 192,410 210,594 0 210,594 109%400015 FTP SP Minor Footpath works 50,000 51,661 4,500 56,161 112%400016 FTP SP Drumpellier Drive 150,000 48,220 0 48,220 32%400017 FTP SP Railway Parade Footpath 484,800 389,355 10,124 399,479 82%400018 FTP SP Wistful Wetlands Footpath 28,500 30,533 0 30,533 107%
FTP - Footpaths 953,530 733,505 14,624 748,129 78%
PRK - Parks and Reserves
700108 PRK SP Sandown Park 150,000 25,863 0 25,863 17%700109 PRK SP Dayton Dog Park 150,000 29,664 0 29,664 20%700110 PRK SP Dulcie Liddlelow 56,000 61,716 9,809 71,525 128%700111 PRK SP Hamelin Park 25,000 15,954 0 15,954 64%700112 PRK SP Jenna Pulin Crescent 7,000 10,675 0 10,675 153%700113 PRK SP Jungle Park 35,000 44,590 0 44,590 127%700114 PRK SP Lighting and shade structures at SRRP 100,000 121,698 0 121,698 122%700115 PRK SP Livvi's Playground 52,000 46,480 0 46,480 89%700116 PRK SP Lowrey Park 15,000 9,401 0 9,401 63%700117 PRK SP Upper Swan Primary School 16,500 0 0 0 0%700118 PRK SP Valley Bowls - Artificial Turf Replacement 150,000 135,026 0 135,026 90%700119 PRK SP Altone Park Oval 244,970 120,851 0 120,851 49%700121 PRK SP Aveley Central Park - Shade Sails 210,000 57,321 24,421 81,742 39%700122 PRK SP Percy Cullen Oval 30,000 28,463 0 28,463 95%700123 PRK SP Kingfisher AFL Oval Kingfisher Oval - Drainage 115,000 0 0 0 0%700124 PRK SP Drumpellier Drive 116,000 114,797 476 115,273 99%700126 PRK SP Swan Active Ballajura 43,010 43,010 0 43,010 100%700127 PRK SP Swan Active Beechboro 46,990 43,125 0 43,125 92%700130 PRK SP Woodlake Park 30,000 27,502 0 27,502 92%700148 PRK SP Almeria Park 120,000 91,059 18,596 109,655 91%700149 PRK SP Alta Laguna Tennis Court Playground 140,000 17,368 144,634 162,002 116%700150 PRK SP Altone Park Rec Centre 100,000 19,223 95,129 114,352 114%700151 PRK SP Anna Plains 114,000 118,887 0 118,887 104%700152 PRK SP Baskerville Hall 100,000 16,752 91,415 108,167 108%700153 PRK SP Bluegum Park 100,000 95,799 0 95,799 96%700154 PRK SP Brilliant Rise Park 100,000 124,058 0 124,058 124%700155 PRK SP Caloria Park 30,000 31,395 0 31,395 105%700156 PRK SP Carew Park 104,630 102,401 1,586 103,987 99%700157 PRK SP Central Lakes 170,000 224,012 0 224,012 132%700158 PRK SP Coonawarra Park 120,000 18,775 120,186 138,961 116%700159 PRK SP Corti Park 60,000 0 49,900 49,900 83%700160 PRK SP Fountain Park 139,000 146,136 0 146,136 105%700161 PRK SP Grassdale Wetland 100,000 15,657 77,888 93,545 94%700162 PRK SP Holmesdale Park 126,390 129,236 5,608 134,844 107%700163 PRK SP Kingsmeadow Oval 140,000 878 0 878 1%700164 PRK SP Kulungar Park 100,000 9,298 84,598 93,896 94%700165 PRK SP Lockridge Family Centre 20,000 12,496 0 12,496 62%700166 PRK SP Maguire Oval 160,000 171,380 0 171,380 107%700167 PRK SP Natham Square Park 120,000 21,231 138,144 159,375 133%700168 PRK SP Ron Jose Oval 130,000 20,586 126,027 146,613 113%700169 PRK SP Sacramento Park 100,000 17,396 102,459 119,855 120%700170 PRK SP Saint Elias Place Park 100,000 9,796 91,803 101,599 102%700171 PRK SP Simla Park 100,000 11,996 84,239 96,235 96%700172 PRK SP Stirling Square 120,000 0 125,037 125,037 104%
City of SwanStimulus Package Project List
Page 1 of 2

ExpensesCode Description FY Budget YTD Actual Commitments YTD Total % of Budget
700174 PRK SP Delapre Park 51,930 56,052 0 56,052 108%700175 PRK SP Oakhill Park 119,440 17,046 76,743 93,789 79%700176 PRK SP Warnock Park 100,000 19,271 84,559 103,830 104%700178 PRK SP Lloyd Penn Park 560,000 40,566 343,259 383,825 69%700181 PRK SP Bottlebrush POS 100,000 13,769 111,530 125,299 125%
PRK - Parks and Reserves 5,237,860 2,508,655 2,008,046 4,516,701 86%
RDN - Roads
800216 RDN SP Swan Valley Tourism Signage 100,000 0 84,038 84,038 84%800217 RDN SP Roland Road 9,220 0 0 0 0%800218 RDN SP Morrison Road Crossing (east of railway line) 50,000 14,602 25,407 40,009 80%
RDN - Roads 159,220 14,602 109,445 124,047 78%
Total Capital Works Program 8,060,550 4,048,242 2,430,343 6,478,585 80%
CAM - Construction & Maint Admin
197148 FAM SP Fleet Office 60,000 0 0 0 0%197188 INM SP Walter Day Park 15,000 3,238 0 3,238 22%
CAM - Construction & Maint Admin 75,000 3,238 0 3,238 4%
FAM - Facilities Management
197186 FAM SP Ballajura Oval Pavilion - Painting 30,000 0 0 0 0%197187 FAM SP Kingfisher Oval Pavilion - Painting 30,000 0 0 0 0%
FAM - Facilities Management 60,000 0 0 0 0%
Total Operating Works Program 135,000 3,238 0 3,238 2%
Total Stimulus Package 8,195,550 4,051,480 2,430,343 6,481,823 79%
Legend<75%75% - 100%> 100%Completed
Since the adoption of the Economic Stimulus Package of $8.8m on the 15 April 2020, $7.4m or 80.4% has been delivered. This is made up of $4.6m of actual cost and $2.4m commitments. $567k was delivered in FY2019/20.
Note that Budget has decreased by $79k from $8.3m. This was due to the 20 January 2021 Council endorsed budget adjustment accounting for the 2019/20 carry forward reconciliation.
Page 2 of 2

At the Special Council Meeting (SCM) on April 15, 2020, Council approved comprehensive measures designed to support City’s residents, ratepayers and businesses during their time of greatest financial need. These measures and the effects of COVID-19 have led to a number of impacts across the City's business units/services.
Since the first COVID-19 lockdown back in March 2020, the City’s CIMT (Critical Incident Management Team) has been working with managers to update Business Continuity Plans in anticipation of another lockdown scenario. This has allowed the City to act swiftly to protect the community and staff from the potential spread of COVID-19 with the key focus to reduce the number of staff going to work while continuing to provide essential services to the community, following Premier Mark McGowan’s announcement of hard 5-day lockdown as of 6pm 31 January 2021.
Some other relief measures that was undertaken by the City due to COVID-19 includes cost incurred associates with additional cleaning/hygiene supplies such as disposal gloves, hand sanitizers, disposable coveralls and face mask (YTD March spent of $43.5k), fees and charges waiver and activities performed to directly assist the community.
The State Government’s recent announcement regarding increasing capacities at certain types of venues throughout the state has warranted CIMT to consider an increase of staffing numbers in the administration offices. The City has now returned to the pre-lockdown position of Phase 5 of COVID-19 on 29 March 2021 and allowing up to 100% of staff to return to approved workstation. City employees will still need to continue to adhere to COVID safe practices including maintaining 1.5 metres where practicable, washing hands regularly, covering coughs and stay home if unwell.
Most services and facilities including Libraries, Swan Active Centres, indoor and outdoor sporting facilities, bookable halls and venues, playgrounds, skate parks, BMX parks, Midland Junction Arts Centre, Ellenbrook Arts, Bullsbrook Recycling Centre, youth centres and the Swan Valley Visitor Centre have resumed to pre lock down position. Occupational Safety and Health are also currently reviewing capacity limits for the City’s bookable facilities.
The penalty interest on outstanding rates for City’s rate payers has been waived for 2020/21. The cumulative impact by the end of March 2021 is as per below. There has been no change since July 2020.
Number of Assessments Total of Loss of interest revenue
41 $1,677.31
Swan Active Leisure Centres have recovered from the impacts of COVID-19 since July 2020, though the overall revenue was still impacted negatively due to the closure of services during the lockdown and restrictions.
5.2 COVID-19 Response and Impacts

The above graph and the table below provide the Year on Year monthly revenue comparison since the first lockdown in April 2020.
Leisure Service Revenue 2019/20 Actual 2020/21 Actual Variance % Var
April 596,747 1,377 (595,371) (100%) May 533,934 12,207 (521,727) (98%) June 499,599 112,110 (387,489) (78%) July 496,069 430,227 (65,842) (13%) Aug 632,882 588,948 (43,934) (7%) Sep 451,076 598,899 147,823 33% Oct 581,726 847,489 265,763 46% Nov 784,331 693,449 (90,882) (12%) Dec 437,576 594,441 156,865 36% Jan 546,508 595,610 49,102 9% Feb 834,701 525,209 (309,492) (37%) Mar 507,836 763,030 255,194 50% Total 6,902,985 5,762,995 (1,139,990) (17%)
Leisure Services Revenue in March 2021 returned a favourable position comparative to the same period last year. The upward trend is anticipated to continue in the following months as WA consumer confidence stays high after the successful COVID-era economic management.
0
100,000
200,000
300,000
400,000
500,000
600,000
700,000
800,000
900,000
April May June July Aug Sep Oct Nov Dec Jan Feb Mar
Leisure Services Revenue
2019/20 Actual 2020/21 Actual

5.7
Just a day after WA entered into the full lockdown, residents in northeast of Perth were forced to flee their homes on Monday, 1 February 2021 as a blaze started in Wooroloo was quickly out of control due to hot, dry and windy conditions. A large part of the City including the metropolitan area has been impacted. The devastating fire claimed many homes and burnt 10,900 hectares. By 6 February 2021 DFES Commissioner announced that the firefighters had contained the bushfire and that they were downgrading it to an advice level only.
City of Swan supported the Department of Communities by opening Swan Active Midland and Swan Active Beechboro as additional evacuation centres to Brown Park Recreation Complex in Swan View while a Bushfire Community Recovery Centre was setup at Percy Cullen Oval and Pavilion in Gidgegannup on 8 February 2021. The City has also been working with the State Government and Shire of Mundaring Rangers along with a team of vets to check on animal welfare in safe areas.
Approximate loss of income is estimated at $126,210 for 190 properties which is subject to change as the number of damaged and destroyed properties is yet to be finalised.
Financial support from communities, corporate sectors and governments was activated immediately:
The Lord Mayor’s Distress Relief Fund (LMDRF) was established in conjunction with the StateGovernment to provide financial assistance to individuals for the alleviation and relief ofdistress, suffering and personal hardships, brought about by any disaster or emergency withinWA declared by the Western Australian Government or for which the LMDRF Board considersassistance is warranted. The City of Swan Finance sub team and an established Emergencygroup is administering this program, in collaboration with the City of Perth.
Department of the Premier and Cabinet Bushfire Relief Payments (DPC) – funded by StateGovernment and administered by the City of Swan. Emergency funding of $4,000 to those whohave lost their homes, and $2,000 to people whose houses have been damaged.
Federal Government, through Services Australia announced Disaster Recovery Payments andAllowance of up to $1,000 per eligible adult and $400 per child as well as a short termallowance for a maximum of 13 weeks.
Disaster Recovery Funding Arrangements of Western Australia (DRFAWA) – Local Government can claim financial assistance from the Commonwealth, for the purpose of disaster relief and recovery. Different funding options are available and referred to as assistance measures, which are broken down into four main categories. More detail provided below. Lord Mayor's Distress Relief Fund
As at 30 March 2021 over $16.2m was donated to LMDRF, with administration costs being in kind from the City of Perth, ensuring 100% of donations goes directly to those in need.
The categories of grants are as follows and are subject to specific criteria. For Owners / Owner Occupiers of properties impacted by the bushfire there are three levels of LMDRF grant assistance available as follows:
Level One shall apply in those instances where the place of residence and contents have been totally destroyed;
5.3 Wooroloo and Hills Bushfire Emergency

5.
Level Two shall apply in those instances where the place of residence has sustained structural damage and contents have been damaged (e.g. verandah, gutters/downpipes, outdoor decking);
Level Three shall apply in those instances where there has been other property damage / loss that is personal property (e.g. sheds, fencing, water tanks, power poles, telecommunications, pumps, machinery, tools and other equipment).
For Occupiers (those renting) of properties impacted by the bushfire there are two levels of LMDRF grant assistance available as follows:
Level Four shall apply in those instances where the house contents have been totally destroyed as a consequence of the house being totally destroyed; Level Five shall apply in those instances where there has been partial damage/loss of house contents (e.g. contents of shed, tools, machinery, and other equipment).
The City’s Finance team as a sub-group of the Emergency team is involved in receiving and assessing applications, and making a formal recommendation to the LMDRF Board. The City of Perth coordinates LMDRF Board meetings to approve payments.
LMDRF applications City of Swan Applications received 210 Applications recommended to City of Perth for payment 123
Applications yet to be processed 87 * Data is changing daily
Department of the Premier and Cabinet Grant - Bushfire Relief Payments
Individuals located in the City of Swan whose principal private residence was destroyed (permanently uninhabitable) are eligible for a payment of $4,000 and residents whose principal private residence was damaged but remains habitable, are eligible for $2,000 under the DPC subject to eligibility criteria.
Department of the Premier and Cabinet (DPC) - Bushfire Relief Payments City of Swan Value processed $ Applications received 228 Applications processed 129 Applications yet to be processed 99 Number of people receiving $4,000 grant 67 $268,000 Number of people receiving $2,000 grant 62 $124,000
* Data is changing daily
Disaster Recovery Funding Arrangement Western Australia (DRFAWA)
The different funding options available under the DRFAWA are referred to as assistance measures. These are broken down into four main categories:
Category A – Emergency assistance for individuals and are generally administered by theDepartment of Communities and Local Governments (DCLG).

5.
Category B – Emergency assistance for the repair of essential public assets and to supportprimary producers and small businesses to recover from a disaster event. Not all of theassistance measures offered by the Commonwealth are provided by Western AustralianGovernment.
Category C – A community recovery package that is intended to support a holistic approach tothe recovery of regions, communities or sectors severely affected by an eligible disaster.
Category D – Covers ‘exceptional circumstances’, in the opinion of the Commonwealth, toalleviate distress or damage.
Under Western Australian emergency management arrangements, Department of Communities and Local Governments is responsible for coordinating the provision of welfare support services to people affected by an emergency or disaster. This includes emergency accommodation, catering, clothing and personal items, support services, financial assistance etc. This may be linked with DRFAWA funding above.
The City’s Finance sub team is working closely with the DRFAWA to ascertain what is eligible/ineligible through this scheme and will be responsible for ensuring a coordinated approach to lodging claims. Finance staff will review all claims before formally submitting requests to DRFAWA.
Category C - Clean Up - A2A City of Swan Number of properties contacted (i.e. A2A forms distributed) 125 Number of interviews scheduled 5 Number of interviews completed 5 Number of A2A forms completed that required face to face interview (and if available, average time taken for interviews) 5
Number of A2A forms completed that required telephone/minimal support 31 Number of A2A forms completed and submitted independently 70 Number of A2A forms accepted and processed by LG* and sent to DWER** 127 Number of properties opting out of program 4 * LG - Local Government** DWER - Department of Water and Environmental Regulation
Rate Relief
As additional assistance, a proposal under section 6.47 ‘Concessions’ of the Local Government Act 1995 (the Act), subject to the Rates and Charges (Rebates and Deferments) Act 1992 is being presented at the next Ordinary Council Meeting on the 14 April 2021. It was recommended that the Council resolve to;
1. Apply one-off pro-rata credit to 2020/21 Council rates for City of Swan ratepayers impactedby the Wooroloo bushfire (when confirmed as per the City’s verified register) for the periodfrom 1 February to 30 June 2021. Note that the City cannot approve any credit for ESL as thischarge is not under the City’s control.
2. Any outstanding balance (including arrears), after the credit is applied, staff to communicatewith ratepayers and arrange extended repayment period if needed.

5.
Fencing Subsidy
There is an additional assistance measure relating to fencing for primary producers that the WA Government provides. This assistance reimburses the primary producer 100 per cent of the costs associated with any of the following and is only available where fencing adjoins a major road/rail transport corridor and where the roaming of livestock may present a danger to the travelling public (i.e. the aim being to preserve public safety):
Restoration/replacement of fencing (to pre-disaster standard) where the fencing has beendeliberately dismantled or damaged due to counter disaster operations activities undertakenin order to combat the eligible natural disaster event, and/orReimbursement of the costs of materials only (to pre-disaster standard) to repair/replace'boundary' fencing, damaged/lost fencing as a direct result of the eligible natural disasterevent.
For a claim to be considered, it must be demonstrated to the Department of Primary Industries and Regional Development (DPIRD) satisfaction that at the time of the eligible disaster, the property was at that time being used to hold or against livestock. A property that was used solely for cropping purposes at the time of the incident resulting in the claim would not be eligible for assistance under the DRFAWA.
As the intent of this measure is to ensure public safety, to be eligible, all works must be undertaken as soon as practical after the impact of the natural disaster event. It must also be noted that where a claimant has insurance and the insurance policy includes fencing, in these circumstances the claim must be lodged with the insurer and not via DRFAWA.
Country Women’s Association Rapid Response Funding
The Country Women’s Association’s Community Fund is offering quick grants of up to $500 for individuals/families who have had losses as a result of the bushfires.
Midlas
Midlas have free financial counsellors available to assist people impacted by the bushfires: Assistance and information on Insurance mattersAssistance with hardship grants and paymentsAccessing crisis accommodation
Rural West
Financial counselling for individuals and families experiencing financial distress as a result of the Wooroloo bushfire is available through Rural West.
This service is an extension of what is already available to regional small businesses and primary production enterprises. The experienced Rural West team will work with clients to manage both immediate and underlying issues for a positive and sustainable future.
Coordinated Residential Clean-up Program
The State Government will be working closely with the City of Swan and Shire of Mundaring to roll out the Wooroloo Bushfire Coordinated Residential Clean-up Program. The Program is jointly funded through the Commonwealth-State Disaster Recovery Funding Arrangements, and forms part of a broader $18.1 million community recovery package.

5.
Residents whose homes were destroyed or damaged by the bushfire are eligible for the clean-up program whether they are fully insured, partly insured or not insured. If buildings, structures or vehicles on your residential property have been damaged or destroyed by the bushfire and require removal, you can register for the Wooroloo Bushfire Coordinated Residential Clean-up Program.
Asbestos treatment The City is engaged in treatment of asbestos on bushfire impacted private properties. Details are in the table below. The cost below will be recouped from the DRFAWA.
No. of Properties treated
Cost incurred
3 $ 64,300
Special bulk collection The City is also organising a special bulk collection in the coming weeks with the assistance from the State Government with the priority is to ensure the roads and road verges are safe and clear of debris.
Insurance Claim
Below highlights the City assets that have been damaged/affected by the Gidgegannup bushfires. Estimation of damage is yet to be assessed to enable a formal insurance claim to be lodged.
Bridges Safety Barrier Parks Roads Others• Reen Road• O’Brien Road• Tilden Drive• Tilden ParkFootbridge• Bells RapidsFootbridge
• BrennanRise (South)• BrennanRise (North)
• Noble Falls -Bollards• Noble Falls - Picnic Bench• Noble Falls - ATU Wastewater System• Revegetation worksrequired throughoutall parks andreserves, extentcurrently unknown.
• Dinsdale Road• Preedy Road• Lillie Road• Brennan Rise• Hargraves Crescent• Kooringal Vale• Quenda Glade• Reserve Road• Old Coach Road East• Mayo Road• Reen Road• Falls Heights• Tilden Drive• Higgins Road• The Eryie• Treechange Rise• O’Brien Road
• Verge Damage• Road Surface Damage - Theextent of the road surface damageis currently unknown as WesternPower have restricted access, thiswill be done in the coming weeks.Most roads have some form oflocalised surface damage.• Revegetation Works -Revegetation works requiredthroughout verges as drainage hasbeen affected, extent currentlyunknown.• Guide Posts - Estimated 1000 guide posts will requirereplacement.• Signage - Estimated 20 signs willrequire replacement.

5.
Cost of Recovery Work
The aftermath of the Bushfire has been devastating and requires remediation works. The below is a list of works that have been awarded.

6.1
4.0 DInvestments
ADI Lending Status Value Invested $Fossil Fuel lending ADI'sCommonwealth Bank of Australia 46,810,107
National Australia Bank 48,800,000
Bank of Queensland 39,400,000
Westpac Group 33,500,000
AMP Bank 10,000,000
178,510,107
Non Fossil Fuel lending ADI'sBendigo and Adelaide Bank 52,100,000
Members Equity Bank 38,800,000
Suncorp Bank 6,700,000 97,600,000
Total Cash and Cash Equivalents 276,110,107
0
40
80
120
160
200
240
280
320
Jul Aug Sep Oct Nov Dec Jan Feb Mar Apr May Jun
Mill
ions
$
Total Cash and Investment Position showing Prior Year Comparisons
2018 2019 2020 2021
0
40
80
120
160
200
240
280
Jul Aug Sep Oct Nov Dec Jan Feb Mar Apr May Jun
Mill
ions
$
Cash and Investment Mix (by Type)
24 Hour Call Cash Management Floating RateTerm Deposits Cash
6.0 Cash and Investments
19%
14%
17%14%
18%
4% 2% 12%
Investment Portfolio Exposure
Bendigo and Adelaide Bank - BENBank of Queensland - BoQCommonwealth Bank of Australia - CBA-BWAMembers Equity Bank - MEBNational Australia Bank - NABAMP Bank - AMPSuncorp Bank - SUNWestpac Group - WBC
(A-2, BBB+) BEN
(A-2, BBB+) BoQ
(A-2, BBB) MEB
(A-1+, AA-) NAB
(A-1+, AA-) CBA-BWA
(A-1+, AA-) WBC
(A-2, BBB) AMP
(A-1, A+) SUN
0% 10% 20% 30% 40% 50%
Individual Institution Exposures vs. Policy Limits
Investment Policy Limit % of Portfolio
0%
20%
40%
60%
80%
100%
0
50
100
150
200
250
300
Historical Portfolio Exposure to Non Fossil Fuel Lending ADIs
Sum(Total) Sum(Non Fossil Fuel Lending ADI (%))
Mill
ions
$

City of Swan Economic and Investment Portfolio Commentary
March 2021 Global issues:
In the US, President Biden’s US$1.9T stimulus/recovery package passed through Congress with onlymodest changes. Now, with another massive recovery package in the wings, a US$2T infrastructure plan,US interest rates continue to rise as the market anticipates the monetary and fiscal stimulus of the past 12months will rekindle inflation. Like Australia’s RBA, the US Federal Reserve is telling the market therewill be no official interest rate hikes until at least 2024.In Europe, key manufacturing indicators are showing a solid rebound despite virus-related lockdownscontinuing to hamper retail activity as the vaccine rollout remains slow on the continent.
Domestic issues: In Australia, GDP rose 3.1% off the back of strong gains in consumer spending, housing investment,equipment investment and public spending and has now recovered 84% of the fall in economic activityrecorded in the first half of last year due to the coronavirus related shutdown.With saving rates remaining high (indicating pent up demand), consumer and business confidencestrong, incentives aimed at boosting housing and business investment and vaccines set to allow a furtherreopening of the economy the recovery is expected to continue but at a slower pace than recent gains.Meanwhile, the RBA reiterated its view that there is a long way to go to meet its inflation and employmenttargets and still does not expect a rate hike until 2024.
Interest rates Monetary stimulus measures continue to keep short term market rates below the official cash rate. The 3month bank bill rate inched 1 basis point higher to 0.04% by the end of March and the RBA kept theofficial cash rate and target 3 year bond yield at 0.10%.In March, average TD rates in the 1-12 month range slipped backward by an average of 12 basis points(0.12%), primarily as a result of a couple banks slashing their unusually high rates to well below theirpeers. Meanwhile, the surge in long dated interest rates, off the back of economic optimism, continuedto ratchet up term deposit rates in the 4 & 5yr area with 5yr TDs at an average of 1.22%pa, up 0.40%pasince the end of January:
Investment Portfolio Commentary The City’s investment portfolio posted a return of 0.51%pa for the month of March versus the bank bill index benchmark return of 0.02%pa. For the past 12 months, the investment portfolio returned 0.90%pa, exceeding the bank bill index benchmark’s 0.11%pa by 0.79%pa. 35% of the portfolio was invested in non-fossil fuel lending ADIs, the same as the month prior. Investments with realised losses include:
Investment Purchase Price Realised value Crystallised Loss Kalgoorlie 500,000 432,373 67,627 Bluegum 500,000 - 500,000 Deutsche Yield Curve 1,000,000 960,000 40,000 Scarborough 1,500,000 - 1,500,000 Parkes2A 500,000 - 500,000 Torquay 500,000 - 500,000 Flinders 250,000 215,000 35,000 Coolangatta 500,000 494,877 5,123 Merimbula 500,000 480,959 19,041 Esperance 500,000 348,658 151,342 Kakadu 550,000 502,708 47,292 Parkes1A 500,000 - 500,000 Oasis 1,000,000 879,096 120,904 Lehman Brothers Global Property Note 300,000 126,797 173,203 Matured CDOs* 3,650,000 3,650,000 - Legal recovery - 3,621,784 -
Total Amount 12,250,000 11,712,252 4,159,532
Net Loss 537,748 * Beech, Blaxland, Endeavour, Federation, Henley, Lawson and Glenelg

Current AccountsFace Value Current
YieldBorrower Rating Current Value Reference
26,163,937 0.00% Commonwealth Bank of Australia A-1+ 26,163,937 Cash At Bank7,503,570 0.00% Commonwealth Bank of Australia A-1+ 7,503,570 Brabham4,835,326 0.00% Commonwealth Bank of Australia A-1+ 4,835,326 Caversham5,725,934 0.00% Commonwealth Bank of Australia A-1+ 5,725,934 Dayton1,316,322 0.00% Commonwealth Bank of Australia A-1+ 1,316,322 West Swan1,265,016 0.00% Commonwealth Bank of Australia A-1+ 1,265,016 Bullsbrook
46,810,107 0.00% 46,810,107
Term DepositsFace Value Purchase
YieldBorrower Rating Maturity
DatePurchase Price Current Value Accrued
Interest5,000,000 0.65% Bendigo and Adelaide Bank A-2 6-Apr-21 5,000,000 5,018,342 18,3421,700,000 0.54% Westpac Group A-1+ 12-Apr-21 1,700,000 1,704,980 4,9801,700,000 0.45% Bendigo and Adelaide Bank A-2 12-Apr-21 1,700,000 1,703,270 3,2703,000,000 0.95% National Australia Bank A-1+ 13-Apr-21 3,000,000 3,022,488 22,488 Brabham2,000,000 0.95% National Australia Bank A-1+ 13-Apr-21 2,000,000 2,014,992 14,992 Dayton5,000,000 0.60% Suncorp Bank A-1 19-Apr-21 5,000,000 5,016,932 16,9325,000,000 0.65% ME Bank A-2 23-Apr-21 5,000,000 5,022,082 22,0821,700,000 0.55% ME Bank A-2 26-Apr-21 1,700,000 1,703,791 3,7911,700,000 0.50% ME Bank A-2 26-Apr-21 1,700,000 1,702,981 2,9815,000,000 0.60% Westpac Group A-1+ 3-May-21 5,000,000 5,015,781 15,7811,700,000 0.45% Bank of Queensland A-2 10-May-21 1,700,000 1,702,683 2,6835,000,000 0.65% ME Bank A-2 17-May-21 5,000,000 5,017,096 17,0965,000,000 0.55% Rural Bank A-2 17-May-21 5,000,000 5,012,733 12,7335,000,000 0.55% ME Bank A-2 17-May-21 5,000,000 5,012,356 12,3561,700,000 0.45% Bank of Queensland A-2 24-May-21 1,700,000 1,702,410 2,4105,000,000 0.55% Bendigo and Adelaide Bank A-2 31-May-21 5,000,000 5,012,356 12,3565,000,000 0.45% Bendigo and Adelaide Bank A-2 31-May-21 5,000,000 5,009,185 9,1851,700,000 0.45% National Australia Bank A-1+ 7-Jun-21 1,700,000 1,702,389 2,3891,700,000 0.30% National Australia Bank A-1+ 8-Jun-21 1,700,000 1,700,419 4195,000,000 0.45% National Australia Bank A-1+ 14-Jun-21 5,000,000 5,008,384 8,3841,000,000 0.50% ME Bank A-2 15-Jun-21 1,000,000 1,001,863 1,863 Brabham1,000,000 0.50% ME Bank A-2 15-Jun-21 1,000,000 1,001,863 1,863 Brabham1,000,000 0.50% ME Bank A-2 15-Jun-21 1,000,000 1,001,863 1,863 Brabham1,000,000 0.50% ME Bank A-2 15-Jun-21 1,000,000 1,001,863 1,863 Brabham2,000,000 0.50% ME Bank A-2 15-Jun-21 2,000,000 2,003,726 3,726 Brabham1,700,000 0.32% Westpac Group A-1+ 21-Jun-21 1,700,000 1,701,177 1,1771,700,000 0.38% National Australia Bank A-1+ 21-Jun-21 1,700,000 1,701,292 1,2923,000,000 0.75% National Australia Bank A-1+ 21-Jun-21 3,000,000 3,013,500 13,500 Dayton5,000,000 0.50% Rural Bank A-2 28-Jun-21 5,000,000 5,009,315 9,3151,700,000 0.32% Westpac Group A-1+ 5-Jul-21 1,700,000 1,701,177 1,1775,000,000 0.45% Bendigo and Adelaide Bank A-2 12-Jul-21 5,000,000 5,007,890 7,8905,000,000 0.40% Bendigo and Adelaide Bank A-2 12-Jul-21 5,000,000 5,006,630 6,6305,000,000 0.40% Bendigo and Adelaide Bank A-2 12-Jul-21 5,000,000 5,006,301 6,3011,000,000 0.93% National Australia Bank A-1+ 15-Jul-21 1,000,000 1,006,625 6,625 Brabham1,000,000 0.93% National Australia Bank A-1+ 15-Jul-21 1,000,000 1,006,625 6,625 Brabham2,000,000 0.93% National Australia Bank A-1+ 15-Jul-21 2,000,000 2,013,249 13,249 Dayton3,000,000 0.93% National Australia Bank A-1+ 15-Jul-21 3,000,000 3,019,874 19,874 Dayton1,700,000 0.55% Bendigo and Adelaide Bank A-2 19-Jul-21 1,700,000 1,704,329 4,3295,000,000 0.30% National Australia Bank A-1+ 26-Jul-21 5,000,000 5,001,562 1,5621,700,000 0.32% Westpac Group A-1+ 2-Aug-21 1,700,000 1,701,177 1,1771,000,000 0.50% ME Bank A-2 4-Aug-21 1,000,000 1,001,164 1,164 Dayton5,000,000 0.50% ME Bank A-2 9-Aug-21 5,000,000 5,007,877 7,8771,000,000 0.55% Bank of Queensland A-2 9-Aug-21 1,000,000 1,002,140 2,140 Brabham2,000,000 0.50% Bendigo and Adelaide Bank A-2 9-Aug-21 2,000,000 2,003,890 3,890 Brabham1,000,000 0.55% Bank of Queensland A-2 9-Aug-21 1,000,000 1,002,140 2,140 Dayton2,000,000 0.55% Bank of Queensland A-2 13-Aug-21 2,000,000 2,004,099 4,099 Dayton2,000,000 0.55% Bank of Queensland A-2 13-Aug-21 2,000,000 2,004,099 4,099 Dayton1,700,000 0.35% Westpac Group A-1+ 16-Aug-21 1,700,000 1,701,288 1,2885,000,000 0.40% National Australia Bank A-1+ 6-Sep-21 5,000,000 5,004,603 4,6035,000,000 0.35% Bank of Queensland A-2 6-Sep-21 5,000,000 5,001,103 1,1031,000,000 0.55% Bank of Queensland A-2 13-Sep-21 1,000,000 1,001,597 1,597 Brabham2,000,000 0.55% Bank of Queensland A-2 13-Sep-21 2,000,000 2,003,195 3,195 Brabham2,000,000 0.55% Bank of Queensland A-2 13-Sep-21 2,000,000 2,003,195 3,195 Dayton5,000,000 0.40% National Australia Bank A-1+ 20-Sep-21 5,000,000 5,004,384 4,3845,000,000 0.40% Bank of Queensland A-2 20-Sep-21 5,000,000 5,000,548 5481,000,000 0.73% National Australia Bank A-1+ 21-Sep-21 1,000,000 1,003,840 3,840 Brabham2,000,000 0.73% National Australia Bank A-1+ 21-Sep-21 2,000,000 2,007,680 7,680 Dayton2,000,000 0.65% National Australia Bank A-1+ 5-Oct-21 2,000,000 2,006,340 6,340 Brabham1,000,000 0.65% National Australia Bank A-1+ 7-Oct-21 1,000,000 1,003,134 3,134 Dayton1,700,000 0.30% Suncorp Bank A-1 11-Oct-21 1,700,000 1,700,238 238

Disclaimer: The statements and opinions contained in this report are based on currently prevailing conditions in financial markets and are so contained in good faith and in the belief that such statements and opinion are not false or misleading. In preparing this report, Prudential Investment Services Corp has relied upon information which it believes to be reliable and accurate. Prudential Investment Services Corp believes that this report and the opinions expressed in this report are accurate, but no warranty of accuracy or reliability is given. Prudential Investment Services Corp does not warrant that its investigation has revealed all of the matters which a more extensive examination might disclose. This report may not be reproduced, transmitted, or made available either in part or in whole to any third party without the prior written consent of Prudential Investment Services Corp. AFS Licence No. 468145.
Term Deposits (continued...)Face Value Purchase
YieldBorrower Rating Maturity
DatePurchase Price Current Value Accrued
Interest1,000,000 0.50% National Australia Bank A-1+ 11-Oct-21 1,000,000 1,001,479 1,479 Caversham5,000,000 0.60% Bendigo and Adelaide Bank A-2 18-Oct-21 5,000,000 5,013,890 13,8905,000,000 0.55% ME Bank A-2 1-Nov-21 5,000,000 5,012,733 12,7331,700,000 0.45% ME Bank A-2 1-Nov-21 1,700,000 1,700,042 421,700,000 1.60% Bendigo and Adelaide Bank A-2 9-Nov-21 1,700,000 1,710,433 10,4335,000,000 0.65% Bank of Queensland A-2 15-Nov-21 5,000,000 5,015,048 15,0485,000,000 0.75% AMP Bank A-2 15-Nov-21 5,000,000 5,014,486 14,4865,000,000 0.60% Westpac Group A-1+ 22-Nov-21 5,000,000 5,011,671 11,6715,000,000 0.70% Westpac Group A-1+ 29-Nov-21 5,000,000 5,016,205 16,2055,000,000 0.60% Westpac Group A-1+ 13-Dec-21 5,000,000 5,011,671 11,6711,700,000 0.33% National Australia Bank A-1+ 13-Dec-21 1,700,000 1,700,261 2611,700,000 0.45% ME Bank A-2 13-Dec-21 1,700,000 1,700,356 3565,000,000 0.35% Westpac Group A-1+ 10-Jan-22 5,000,000 5,003,500 3,5005,000,000 0.75% AMP Bank BBB 16-May-22 5,000,000 5,010,274 10,2745,000,000 1.75% Bank of Queensland BBB+ 20-Jan-23 5,000,000 5,016,781 16,7815,000,000 1.75% Bank of Queensland BBB+ 2-Feb-23 5,000,000 5,013,664 13,664
229,300,000 0.60% 229,300,000 229,836,599 536,599
229,300,000 229,836,59946,810,107 46,810,107
276,110,107 276,646,706Total Face ValueCash Face Value
Investment Face Value Investment Current ValueCash Current ValueTotal Current Value

7.1
5.0 Debtors
i) Rate Debtorsii) Sundry Debtors
Notes
TABLE 7.1 Rates Debtor Breakdown by Type
Type of DebtorTotal Levied $('000)Current & Arrears
Collected YTD $('000) Outstanding $('000)Current & Arrears
Total Outstanding %
General Rates 139,970 124,814 15,156 11%Sanitation Charges 27,629 25,980 1,649 6%Drainage Charges 3,096 2,827 270 9%Security Charges 445 424 21 5%Other 309 293 15 5%
171,449$ 154,338$ 17,111$ 10%GRAPH 7.2 Rates Debtor Position with Prior Year Comparisons
As at 31 March 2021
Each year Rates are levied in July. When this occurs the City recognises the Rates owed as an asset on the balance sheet. Ratenotices are printed and distributed to the public. As these are paid the Rates Debtor position reduces over the course of the year.Graph 7.2 below shows the progress in collecting these funds over the financial year including a comparison to prior yearcollection.
The outstanding balance at the end of March 2021 reduced by $18m or 51% comparing to the end of February. Please note totaloutstanding ESL Balance reduced to $2.4m and was not included in total outstanding balance (excl Deferred).
Deferred rates and drainage amount at the end of March was $2.3m (excluding ESL deferred $0.4m). Arrears excluding deferredrates from 2019/20 dropped by 39% from previous month. This significant decrease is mainly due to the 4th Instalment andInterims payments due and payable on 19 March 2021. A further decrease is expected due to a final interim issue sent in April2021 with a due date in May 2021.
There has been no instalment or penalty interest levied in 2020/21 as per Council resolution due to COVID-19.
The City's Debtors can be divided into two types:
0
25
50
75
100
125
150
Jul Aug Sep Oct Nov Dec Jan Feb Mar Apr May Jun
$ M
illio
ns
201920202021
A substantial amount of rates wascollected by the due date for the first instalment, being 28 August 2020.
Outstanding rates balance reduced significantly due to payments received for the third instalment with a due date of 15 January 2021.
Current Position
Rate Debtors in Arrears outstanding
$3.7m (includes $2.3m in deferred rates)Current Debtors
outstanding$13.4m
Total Debtors $17.1m
7.0 Debtors
Significant reduction is due to 4th instalment collected on 19 March
2021.

7.2
ii) Sundry Debtors Notes
Table 7.3 shows a summary of the City's top 10 debtors 90 Days plus by dollar value divided by periods. Table 7.4 shows debt recovery comments for the top 10 debtors over 90 days. Graph 7.5 shows sundry debtors outstanding as a percentage based on payment period.
TABLE 7.3 Summary of the City's Top Ten Debtors over 90 days
Current 30 Days 60 Days 90 Days plus Total
$ $ $ $ $
1 4,256 56,639 4,256 208,133 273,283 20.22% 18.99%2 127,700 127,700 12.41% 8.87%3 52,736 52,736 5.12% 3.66%4 36,410 36,410 3.54% 2.53%5 35,000 35,000 3.40% 2.43%6 31,813 31,813 3.09% 2.21%7 24,447 24,447 2.37% 1.70%8 23,580 23,580 2.29% 1.64%9 23,000 23,000 2.23% 1.60%
10 20,141 20,141 1.96% 1.40%Other Debtors 258,966 32,588 53,184 446,413 791,151 43.37% 54.97%
Total 263,222 89,226 57,440 1,029,373 1,439,261 100.00% 100.00%
TABLE 7.4 Progress on Debt Recovery. Comments for top 10 over 90 days from table above
Top Ten Debtors123456789
10
GRAPH 7.5 Outstanding Debtors as a percentage
Progress for the recovery of Funds Comment
Referred to Fines Enforcement Registry for enforcement.
Sundry debtors include all monies owed to the City other than those relating to Rates. This includes but is not limited to invoicesraised for grants, leasing of City's premises and recovery of costs for services provided to developers. The City issues invoiceswith 7 day payment terms.
Referred to Fines Enforcement Registry for enforcement.
Disputed invoice awaiting confirmation.
Referred to Fines Enforcement Registry for enforcement.
Referred to Fines Enforcement Registry for enforcement.Referred to Fines Enforcement Registry for enforcement.
Debt has progressed to Legal proceedings.
Referred to Fines Enforcement Registry for enforcement.
As % of 90 Days Plus Debtors
As % of Total DebtorsTop Ten > 90 Day
Debtors
Disputed invoices currently under review.
Referred to Fines Enforcement Registry for enforcement.
Current13%
30 Days9%
60 Days3%
90 Days plus75%

8.1
A Local Government is to prepare each month a statement of financial activity as prescribed by Regulation (34) of the Local Government (Financial Management) Regulations 1996. The statement of financial activity must report on the revenue and expenditure, as set out in the annual budget under FM Regulation 22(1)(d), taking into account any expenditure incurred for an additional purpose under section 6.8(1)(b) or (c). It includes original budget estimates to the end of the month to which the statement relates and actual amounts of expenditure and revenue to the end of the month. The statement must include material variances between the comparable amounts in ytd budget and ytd actual and an explanation of each. The net current assets at the end of each month have to be shown within the statement of financial activity.
The report calculates variances based on the Original Budget. The actual figures for the year to date are compared to the year to date original budget to present a monetary variance as well as the variance shown as a percentage of the budget.
The composition of net current assets is also required to be presented as support to the statement and this is presented showing funds at the end of the current month, those at the previous 30 June and also those at the end of the corresponding month in the previous year. A graph is also included that identifies the monthly movement in funds for the current year and the previous two years.
Report on Significant Variances of 10% of Original Budget and greater than $50,000 in value
Income from Operating Activities
Grants and Other Contributions 16% Unfavourable Variance of $868,555The unfavourable variance of $868k is mostly due to low Interest earnings. Interest rates have been kept at a historically low level by the Reserve Bank since November 2020. Following the Mid-year budget review, a budget adjustment is pending.
Governance 13% Favourable Variance of $220,660Majority of this favourable variance is as a result of higher Subdivision Fees and Charges driven by the State and Federal Government stimulus building grant. The additional revenue will be recognised by a budget adjustment as part of the Mid-year budget review, pending Council approval.
Law, Order, Public Safety 18% Favourable Variance of $187,185The favourable variance is due to Animal Registration Fees which has exceeded the COVID-19 conservative annual budget. A budget adjustment, as part of Mid-year budget review is pending.
Education & Welfare 13% Unfavourable Variance of $380,03Following a Council resolution at OCM 6 May 2020, Community Aged Care have ceased. As a result, budgeted grants amounting to $313k will not be received, largely causing the unfavourable variance within Education and Welfare.
Recreation & Culture 76% Favourable Variance of $2,506,686Leisure Services reflected a positive variance of $2,5m. Swan Active Midland $894k, Beechboro $1.1m and Ballajura $502k were over budget.
Transport 82% Favourable Variance of $964,334Transport reflected a favourable variance of $964k, comprising of $482k from Western Power for Lloyd Street Extension project. Also contributing to the variance was Higher Property Rental $230k and Fees and Charges 211k.
1.0 Income Statement 8.0 Statement of Financial Activity

8.2
Capital grants, subsidies & contributions 18% Unfavourable Variance of $3,051,065
Developers Contributions: Cash Contribution 671% Favourable Variance of $16,598,042
Economic Services 116% Favourable Variance of $1,125,688Federal and State Government Building grant initiatives have driven new dwelling construction to a historic new level leading to an increase in Building Application Fees, causing a favourable variance of $1.1m. A budget adjustment to address this variance will be reflected as part of the Mid-year budget review.
Other Property and Services 13% Favourable Variance of $207,656The positive variance was a result of Higher Property Rental revenue $78K and Fuel Rebate $65k, with the balance made up of small variances.
Expenditure from Operating Activities
Governance 24% Favourable Variance of $2,189,832Governance ended the period with a favourable variance of 24% or $2.2m. Employee Cost, largely due to vacant positions, were under budget by $1.8m. This was partly offset by Insurance Expenses $978k mostly related to the Wooroloo Bushfire having a major impact on expenses. The remainder of the variance $1.1m is directly linked to the Lifespan Services restructure which came into effect on the 8th of February 2021.
Recreation & Culture 10% Favourable Variance of $2,785,096Recreation & Culture recorded a 10% favourable variance, caused by lower Employee Cost of $728k within Leisure Services & Library Services, lower Utility Charges $479k, Maintenance Costs $384k, Advertising $118k, and Projects $114k.
Economic Services 13% Favourable Variance of $782,181Employee Cost $64k, Contracts costs $100k and Projects, Studies & Surveys $507k contribute significantly to the variance within Economic Services. Underspent projects were Environmental Management System $30k, Guildford Tourism Development $83k and City Business Support Program $31k.
Non Cash Items
Movement in Deferred Rates (Non Current) % Unfavourable Variance of $180,316The favourable variance is expected to reduce when rates payments are received during the latter part of the year.
Provisions and Other Accruals 1 % Favourable Variance of $108,978This variance is anticipated to reduce when Leave Provisions are adjusted during the year end process.
Capital Income & Expenditure
The unfavourable variance of $3.1m in Capital Grants, Subsidies & Contributions was mainly due to grants yet to be received for Parks $1.5m and Buildings $1.4m. The variance is expected to reduce as grants are received.
Favourable variance to budget of $16.6m is directly linked to the Federal Government Building Bonus Grant and WA Government HomeBuilder Grant which expired on the 31 March 2021. $19.1m was collected for Developer Contributions YTD, $6.6m was attributed to Brabham, $2.4m to Caversham, $9.2m to Dayton, $131k to West Swan West, $88k to Ellenbrook Bridge and $596k to Bullsbrook Residential.

8.3
Purchase of Property, Plant and Equipment 21% Favourable Variance of $4,907,584
Purchase or Construction of Infrastructure 51% Favourable Variance of $41,852,101
Other Non Operating Items
Proceeds from New Loans 100% Unfavourable Variance of $13,585,965
Other Funding Sources
Transfer to Reserves 56% Unfavourable Variance of $11,992,563
Transfer from Reserves 40% Unfavourable Variance of $13,010,104
Transfer from Trust Funds 100% Unfavourable Variance of $681,818
Opening Net Current Assets July 1 B/Fwd. 93% Favourable Variance of $30,546,558
The favourable variance of $41.9m within Purchase or Construction of Infrastructure is as a result of lower spending in Roads $34m, Parks & Reserves $6.4m, Drainage $1.0m and Footpaths $0.5m in particular the following projects: Stock Road Extension Bullsbrook $14.7m, The Workshop Ave $3.7m, Stirling Crescent Hazelmere Industrial Area $2.8m, Daviot Road Caversham $2.8m, Haddrill Road $2.4m, Midland Road $2.1m, New Junction Public Open Space $1.3m, and Dayton Neighbourhood Park $0.9m.
This favourable variable variance is largely related to Information Technology $1.7m, Plant and Equipment $1.7m, Building Works $1.0m and Light Fleet $0.5m. It is anticipated that this variance will align to budget as the year progresses.
Funds will be transferred from trust once further work progresses on the New Junction Public Open Space (playground) which was funded from trust to the value of $909,090.
This variance was a result of the 2019/20 year end finalisation which included the carry forward of uncompleted capital works of $41.5m.
Due to the deferral and lower delivery on multiple capital projects, the proposed loan of $18.1m is not expected to be fully required this financial year. Borrowing levels have been significantly reduced as part of the Mid year Budget Review.
Higher than expected Developer Contributions received resulted in higher than expected transfers to reserves.
This unfavourable variance is expected to reduce in the coming months, in line with planned activities.

Original Revised YTD Original YTD Actual $ Variance VAR% VarianceBudget Budget Budget Note / Original
2020/21 2020/21 @31 March @31 March Budget2021 2021
Operating ActivitiesIncome
132,671,220 132,671,220 Rates 132,635,061 135,709,946 3,074,8857,272,340 7,272,340 Grants and Other Contributions 5,264,627 4,396,072 (868,555) U (16%)
139,943,560 139,943,560 Total General Purpose Funding 137,899,688 140,106,018 2,206,3302,205,120 2,205,120 Governance 1,688,560 1,909,220 220,660 F 13%1,152,360 1,152,360 Law, Order, Public Safety 1,016,770 1,203,955 187,185 F 18%
325,000 325,000 Health 306,250 330,579 24,3293,845,790 3,845,790 Education and Welfare 2,884,341 2,504,311 (380,030) U (13%)
50,000 50,000 Housing 37,500 26,003 (11,497) U (31%)29,310,000 29,310,000 Community Amenities 28,412,272 27,988,037 (424,235)4,393,460 4,393,460 Recreation and Culture 3,295,095 5,801,781 2,506,686 F 76%1,356,750 1,401,350 Transport 1,177,562 2,141,897 964,334 F 82%1,205,000 1,326,600 Economic Services 973,750 2,099,438 1,125,688 F 116%2,121,300 2,121,300 Other Property and Services 1,590,975 1,798,631 207,656 F 13%
185,908,340 186,074,540 Subtotal Income 179,282,763 185,909,869 6,627,105
Expenditure(3,262,070) (3,260,440) General Purpose Funding (2,281,054) (2,203,949) 77,105
(11,754,810) (11,805,080) Governance (9,218,586) (7,028,753) 2,189,832 F (24%)(6,023,670) (6,023,670) Law, Order, Public Safety (4,517,754) (4,145,918) 371,835(2,205,190) (2,205,440) Health (1,653,891) (1,612,302) 41,590
(10,070,030) (10,072,950) Education and Welfare (7,276,556) (7,100,926) 175,630(106,220) (106,220) Housing (79,665) (68,407) 11,258 F (14%)
(29,279,700) (33,280,790) Community Amenities (21,934,524) (23,010,192) (1,075,669)(38,739,940) (38,716,040) Recreation and Culture (29,022,834) (26,237,738) 2,785,096 F (10%)(66,285,730) (66,306,390) Transport (49,670,048) (47,648,109) 2,021,939(7,790,370) (7,920,380) Economic Services (5,842,777) (5,060,596) 782,181 F (13%)(2,814,600) (2,814,990) Other Property and Services (1,681,213) (1,575,054) 106,160
(178,332,329) (182,512,389) Sub Total Expenses (133,178,900) (125,691,945) 7,486,955
7,576,010 3,562,150 Net Operating Profit / (Loss) 46,103,863 60,217,924 14,114,061
Add Non Cash items44,669,250 44,669,250 Depreciation 33,501,938 31,286,662 (2,215,275)
(334,200) (334,200) Movement in Deferred Rates (Non Current) (250,650) (70,334) 180,316 F (72%)- - Income in Advance - - - -
833,080 833,080 Provisions and Other Accruals 624,810 515,832 (108,978) F (17%)45,168,130 45,168,130 Sub Total Non Cash Items 33,876,098 31,732,160 (2,143,937)
52,744,140 48,730,280 Net Operating Surplus / (Deficit) 79,979,961 91,950,084 11,970,123
Less Capital Income & Expenditure22,654,270 27,940,980 Capital Grants, Subsidies & Contributions 16,990,703 13,939,637 (3,051,065) U (18%)3,296,600 3,296,600 Developers Contributions: Cash Contribution 2,472,450 19,070,492 16,598,042 F 671%3,885,130 3,885,130 Developers Contributions: In Kind Contribution - - -
14,000,000 14,000,000 In Kind Developer Contributions: Other - - -1,603,620 1,603,620 Proceeds from Sale of Assets 1,202,715 1,162,373 (40,342)
(30,770,930) (34,814,430) Purchase of Plant and Equipment (23,078,198) (18,170,613) 4,907,584 F (21%)(16,896,010) (16,896,010) Assets Contributed by Developers - - -
(108,936,770) (114,256,590) Purchase or Construction of Infrastructure (81,702,578) (39,850,477) 41,852,101 F (51%)(989,120) (989,120) Land Ceded to the Crown - - - -
(112,153,210) (116,229,820) Subtotal Capital Income and Expenditure (84,114,907) (23,848,588) 60,266,320
Less Other Non Operating Items(7,479,110) (7,479,110) Loan Principal Repayments (5,609,333) (5,262,524) 346,808 F (6%)18,114,620 18,114,620 Proceeds from New Loans 13,585,965 - (13,585,965) U (100%)
64,220 64,220 Self Supporting Loans Repayments 48,165 31,597 (16,568) U (34%)10,699,730 10,699,730 Subtotal Other Non Operating Items 8,024,798 (5,230,927) (13,255,724)
Other Funding Sources(28,331,906) (28,331,906) Transfer to Reserves (21,248,930) (33,241,492) (11,992,563) U 56%43,278,226 51,368,696 Transfer from Reserves 32,458,670 19,448,566 (13,010,104) U (40%)
909,090 909,090 Transfer from Trust Funds 681,818 - (681,818) U (100%)- - Profit on Impairment of Investments - - -
32,904,980 32,904,980 Opening Net Current Assets July 1 b/fwd 32,904,980 63,451,538 30,546,558 U 93%48,760,390 56,850,860 Subtotal Other Funding Sources 44,796,538 49,658,611 4,862,074
51,050 51,050 Closing Net Current Assets YTD 48,686,387 112,529,181 63,842,793
City of SwanStatement of Financial Activity
For the Period Ended 31 March 2021

8.5
Actual Actual ActualMarch 2021 June 2020 March 2020
Current AssetsUnrestricted Cash and Cash Equivalents 106,997,979 67,471,669 76,725,279Restricted Cash and Cash Equivalents 143,112,128 142,981,605 151,887,551Other Financial Assets 32,623 64,220 30,604
Assets Held for Sale 5,810,269 5,810,269 5,810,269
Rates Debtors Current - - -Trade and Other Receivables 21,656,932 17,077,450 24,532,270Prepayments 1,058,161 1,590,278 794,204Inventory 911,128 572,883 550,432
Total Current Assets 279,579,219 235,568,374 260,330,609
Less Current LiabilitiesIncome in Advance 0Contract Liabilities (25,616,232) (25,899,466) (3,642,886)Lease Liabilities (83,295) (83,295) -Accounts Payable (16,279,695) (21,794,852) (7,930,680)
Provisions - Employee Entitlements (17,621,588) (16,947,501) (14,267,005)
Loan Repayments (1,807,022) (7,069,546) (1,518,355)Total Current Liabilities (61,407,832) (71,794,660) (27,358,926)
Net Current Assets 218,171,387 163,773,714 232,971,683
Add Back Restricted LiabilitiesLSL Reserve 10,700,008 10,092,121 12,695,121
Contract Liabilities 25,616,232 25,899,466 -
Lease Liabilities 83,295 83,295 -Loan Repayments 1,807,022 7,069,546 1,518,355Self Supporting Loan Contributions (32,623) (64,220) (30,604)
Adjusted Net Assets 256,345,321 206,853,922 247,154,555
Add: Non-current Financial Assets that back Reserves 26,000,000 11,700,000
Reserves: Cash Backed (159,435,066) (145,642,139) (148,233,497)Bond Monies (4,570,806) (3,649,976) (3,654,054)Assets Classified as Held for Sale (5,810,269) (5,810,269) (5,810,269)
Closing Funds 112,529,181 63,451,538 89,456,735
City of SwanNet Current Funding Position
As At 31 March 2021
10
60
110
160
210
Jul Aug Sep Oct Nov Dec Jan Feb Mar Apr May Jun
Mill
ion
$
Liquidity Over Three Years
2020/21
2019/20
2018/19

1. STATEMENT OF CASH FLOW
Cash flow information provides users of financial reports with a basis to assess the ability of an entity to generatecash and cash equivalents and the needs of the entity to utilize those cash flows. The cash flow statement shallreport flows during the period classified by operating, investing and financing activities. The key objective of a cashflow forecast is to predict the period in which cash inflows and outflows will occur.
2. RATE SETTING STATEMENT
It is essential that local governments have meaningful and accurate financial information on which to base decisions.The starting point for sound financial management is the preparation of the Rate Setting Statement. This statementis a crucial component of the budget process and shows how much rates are required to pay for the localgovernment's operations. The Rate Setting Statement is a statutory requirement and is unique to local governmentin that it contains values of opening funds and closing funds. Opening funds refer to 'net current assets less restrictedfunds and committed cash and amounts already reflected in the current year budget'. The opening fund forms partof the calculation of the amount of the deficiency to be raised from rates as referred to in s 6.2(2)(C) of the LocalGovernment Act.
.1

Original Revised YTD Actual @ Actual @Budget Budget 31 March 2021 30 June 2020
2020/21 2020/21Cash Flows from Operating ActivitiesReceipts
132,641,743 132,641,743 Rates 127,640,910 137,251,7506,016,150 6,060,750 Operating grants, subsidies and contributions 5,272,355 22,339,809
38,547,020 38,668,620 Fees and charges 40,038,287 39,513,753410,000 410,000 Service charges 423,693 413,979
4,045,280 4,045,280 Interest earnings 2,381,572 6,662,8604,305,407 4,305,407 Goods and services tax 1,684,261 6,572,6982,864,070 2,864,070 Other revenue 3,504,538 3,999,219
188,829,670 188,995,870 Total Receipts 180,945,616 216,754,068
Payments(83,440,190) (83,680,970) Employee costs (59,935,648) (76,114,077)(37,619,943) (36,559,223) Materials and contracts (31,787,686) (28,513,768)(7,030,750) (7,030,750) Utility charges (3,754,207) (6,751,443)(1,525,770) (1,525,770) Interest expenses (908,242) (1,499,700)(2,437,650) (2,437,650) Insurance expenses (1,703,302) (2,423,215)(4,852,023) (4,852,023) Goods and Services Tax (961,638) (6,654,422)(1,470,900) (1,470,900) Other Expenditure (880,821) (1,447,895)
(138,377,226) (137,557,286) Total Payments (99,931,545) (123,404,520)50,452,444 51,438,584 Net cash provided by (used in) operating activities 81,014,071 93,349,548
Cash Flows from Investing Activities(35,006,816) (35,205,506) Purchase / Construction of Property, Plant & Equipment (18,170,613) (25,475,727)
(111,686,411) (118,038,141) Purchase / Devlopment of Infrastructure (39,850,477) (66,815,682)3,296,600 3,296,600 Developers Contributions (Cash) 19,070,492 5,885,855
- -Proceeds from Financial Assets at amortised cost - Term Deposits (50,000,000) (11,500,000)
- - Dividends Received - 1,953,643- - Bonds and Deposits Movements 920,830 (519,850)
22,654,270 27,536,105 Capital Grants, Subsidies & Contributions 13,939,637 18,048,201- - Proceeds from Disposal of Financial Assets - 555,704
1,603,620 1,603,620 Proceeeds from Sale of Fixed Assets 1,162,373 1,666,574(119,138,737) (120,807,322) Net cash provided by (used in) investment activities (72,927,758) (76,201,282)
Cash Flows from Financing Activities18,114,620 18,114,620 Proceeds from Loan Borrowings - 9,606,000(7,479,110) (7,479,110) Repayment of Borrowings (5,262,524) (6,768,036)
- - Payments for principal portion of lease liabilities - (157,816)64,220 64,220 Self Supporting Loan Repayments 31,597 71,205
250,000 250,000 ESL Movements 1,101,445 (16,632)10,949,730 10,949,730 Net Cash Provided by (used In) Financing Activities (4,129,482) 2,734,721(57,736,563) (58,419,008) Net Increase (Decrease) in Cash Held 3,956,832 19,882,987195,191,468 195,191,468 Cash at Beginning of Year 42,853,275 22,970,288
137,454,905 136,772,460 Cash and cash equivalents at the end of the year 46,810,107 42,853,275
City of SwanStatement of Cash Flow
For the Period Ended 31 March 2021

Original Revised YTD Original YTD ActualBudget Budget Budget @ @
2020/21 2020/21 31 March 2021 31 March 2021
Operating Revenue410,000 410,000 Service Charges 410,000 423,693
38,547,020 38,668,620 Fees & Charges 35,549,787 39,372,7252,842,180 2,842,180 Specified Area Rates 2,842,180 2,843,1977,370,750 7,415,350 Operating Grants, Subsidies & Contributions 5,688,061 5,555,5894,045,280 4,045,280 Interest Earnings 2,817,082 1,365,0512,864,070 2,864,070 Other Revenue 2,182,773 3,482,865
56,079,300 56,245,500 49,489,883 53,043,120
Operating Expenses(84,273,270) (84,514,050) Employee Costs (62,586,202) (59,454,285)(36,924,740) (40,864,020) Materials & Contracts (27,862,056) (25,880,127)(7,030,750) (7,030,750) Utility Charges (5,273,065) (4,559,607)
(44,669,250) (44,669,250) Depreciation on Non-Current Assets (33,501,937) (31,286,662)(1,525,770) (1,525,770) Interest Expenses (1,024,229) (908,242)(2,437,650) (2,437,650) Insurance Expenses (1,828,237) (2,722,095)(1,470,900) (1,470,900) Other Expenses (1,103,173) (880,927)
(178,332,330) (182,512,390) (133,178,900) (125,691,945)
Non Cash ItemsIncome In Advance
44,669,250 44,669,250 Depreciation on Non-Current Assets 33,501,937 31,286,662(334,200) (334,200) Movement in Deferred Rates (Non-Current) (250,650) (70,334)833,080 833,080 Provisions and Other Accruals 624,810 515,830
45,168,130 45,168,130 33,876,097 31,732,158
Capital Works22,654,270 27,940,980 Capital Grants, Subsidies & Contributions 16,990,703 13,939,637
(108,936,770) (114,256,590) Purchase / Construction of Infrastructure Assets (81,702,578) (39,850,477)(16,896,010) (16,896,010) Developer Contributions - Infrastructure - -(30,770,930) (34,814,430) Purchase / Construction of Other Capital Assets (23,078,198) (18,170,613)
1,603,620 1,603,620 Proceeds from Sale of Fixed Assets 1,202,715 1,162,3733,296,600 3,296,600 Developer Contributions Plans: Cash 2,472,450 19,070,4923,885,130 3,885,130 Developer Contributions Plans: In Kind - -
14,000,000 14,000,000 In Kind Developer Contributions: Other - -(989,120) (989,120) Land Ceded to the Crown - -
(112,153,210) (116,229,820) (84,114,907) (23,848,588)Debt Management
18,114,620 18,114,620 Proceeds from New Loans 13,585,965 -(7,479,110) (7,479,110) Repayment of Loans (5,609,333) (5,262,524)
64,220 64,220 Contributions to Debt 48,165 31,59710,699,730 10,699,730 8,024,798 (5,230,927)
Other Funding Transactions(28,331,906) (28,331,906) Transfers to Reserves (21,248,930) (33,241,492)43,278,226 51,368,696 Transfers from Reserves 32,458,670 19,448,566
909,090 909,090 Transfers from Trust Funds 681,818 -15,855,410 23,945,880 11,891,558 (13,792,927)
32,904,980 32,904,980 Opening Funds 1 July - Net Current Assets 32,904,980 63,451,540(51,050) (51,050) Less Closing Funds 30 June Net Current Assets (48,686,388) (112,529,181)
32,853,930 32,853,930 Net Current Assets (Less Restricted) (15,781,408) (49,077,641)
129,829,040 129,829,040 Shortfall to be made up from Rates 129,792,881 132,866,748
City of SwanRate Setting Statement
For the Period Ended 31 March 2021
Note:The amount shown as Rates Revenue in this statement is less than that shown in the Statement of Financial Activity as it does not include Specified Area Rates which are shown seperately in this statement.