Bell Ringer: –DO THE FOLLOWING: Analyze political cartoons: –1. Observe- write down concrete...
28
Bell Ringer: – DO THE FOLLOWING: •Analyze political cartoons: –1. Observe- write down concrete items you see for both pictures. –2. Infer- write down what you can infer about each cartoon from the concrete items you found. –3. Compare- Explain the different opinions portrayed by the 2 cartoons.
-
Upload
sharon-holt -
Category
Documents
-
view
215 -
download
1
Transcript of Bell Ringer: –DO THE FOLLOWING: Analyze political cartoons: –1. Observe- write down concrete...

Bell Ringer:
– DO THE FOLLOWING:•Analyze political cartoons:
–1. Observe- write down concrete items you see for both pictures.
–2. Infer- write down what you can infer about each cartoon from the concrete items you found.
–3. Compare- Explain the different opinions portrayed by the 2 cartoons.


What is immigration?
Immigration is the movement of people from
one country or region to another in order to
make a new home.
Immigrate = enter Emigrate = leave
Salad Bowl Theory Melting Pot Theory

What is an immigrant?
An immigrant is a person who moves fromone country or region to another in order
tomake a new home.
Picture from: http://www.hmongstudies.org/HmongCulturalCenterESLProgramPhotos05.html

Brainstorm the difference:
• Write: –Brainstorm the difference
between the melting pot theory of immigration and the salad bowl theory of immigration.

Some Statistics

Immigration to US 1820-2000
0
1,000,000
2,000,000
3,000,000
4,000,000
5,000,000
6,000,000
7,000,000
8,000,000
9,000,000
10,000,000
1820-3
0
1831-4
0
1841-5
0
1851-6
0
1861-7
0
1871-8
0
1881-9
0
1891-0
0
1901-1
0
1911-2
0
1921-3
0
1931-4
0
1941-5
0
1951-6
0
1961-7
0
1971-8
0
1981-9
0
1991-0
0
Period Total1820-30 151,8241831-40 599,1251841-50 1,713,2511851-60 2,598,2141861-70 2,314,8241871-80 2,812,1911881-90 5,246,6131891-00 3,687,5641901-10 8,795,3861911-20 5,735,8111921-30 4,107,2091931-40 528,4311941-50 1,035,0391951-60 2,515,4791961-70 3,321,6771971-80 4,493,3141981-90 7,338,0621991-00 9,095,417
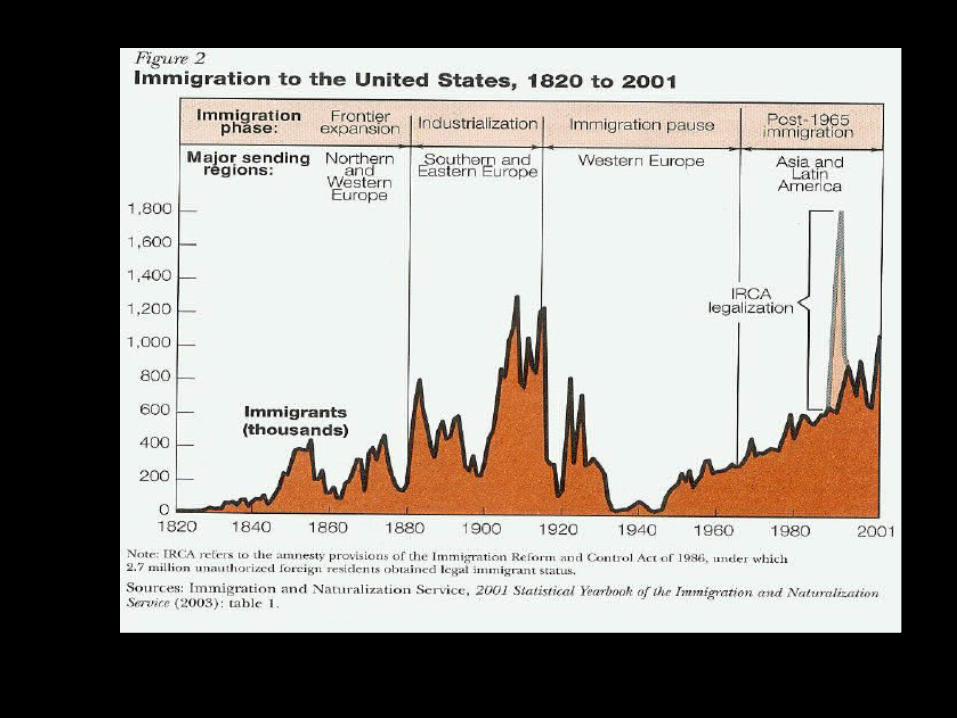
This chart and table show the number of immigrants that came to the United States from 1820-2000. What three time periods experienced the highest number of immigrants?Source of data: Immigration and Naturalization Service, US Department of Justice
Immigration to the United States 1820-
2000

1820-1880 Main Sources of Immigration
• In this period of time almost 10.2 million immigrants came to the United States
• The main countries the immigrants came from were in
Northern and Western Europe “Old Immigrants”

1820-1880 Main Sources of Immigration
The three main countries that immigrantscame from in 1820-1880
Germany 3.0 million

1820-1880 Main Sources of Immigration
The three main countries that immigrantscame from in 1820-1880
Ireland 2.8 million

1820-1880 Main Sources of Immigration
The three main countries that immigrantscame from in 1820-1880
United Kingdom 1.9 million

1881-1920 Main Sources of Immigration
• In this period of time almost 23.5 million immigrants came to the United States
• The main countires the immigrants came from were in Southern and Eastern Europe
• New Immigrants
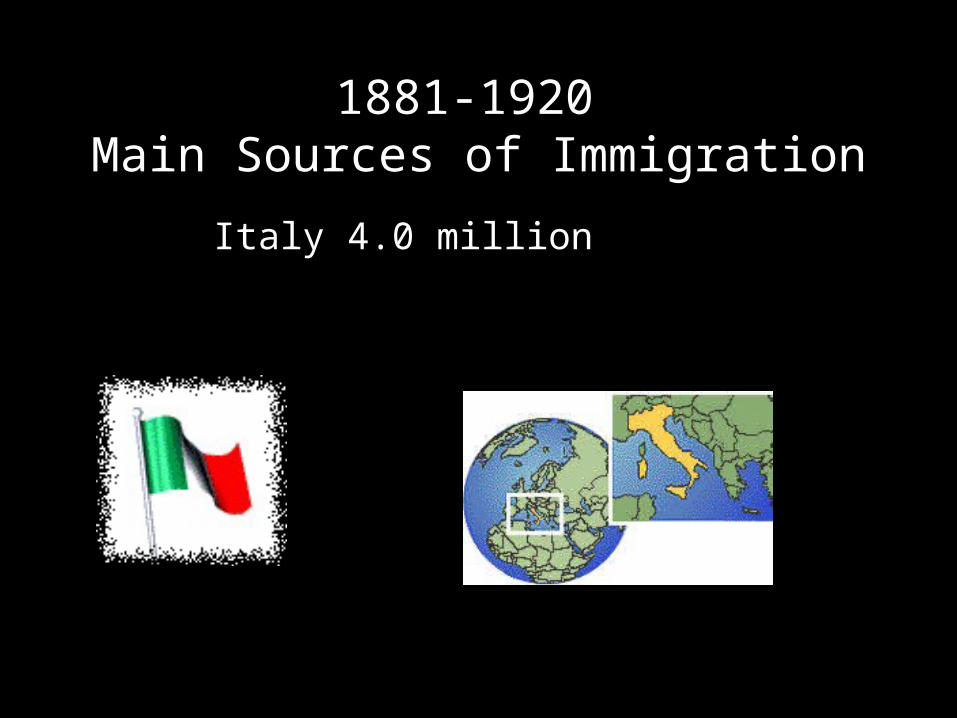
1881-1920 Main Sources of Immigration
Italy 4.0 million

1881-1920 Main Sources of Immigration
Austria Hungary 4.0 million (Austria and Hungary are now separate countries. The maps below show
each of them)
Austria Hungary

The three main countriesthat immigrants came from in 1881-1920
Soviet Union: 4.0 million The Union of the Soviet Social Republics (Soviet Union) was formed in 1917 and ended in 1991. The 15 states of the Soviet Union are now each their own country which are shown on this map. They are Russia, Estonia, Lithuania, Latvia, Kazakhstan, Kyrgystan, Tajikistan, Uzbekistan, Turkmenistan, Georgia, Armenia, Azerbaijan, Ukraine, Belarus, and Moldava.

New Immigrants and Nativism
• Nativism is the extreme dislike of immigrants by native-born people.
• Nativists feared Irish, Italian, Polish and Russian Catholic and Jewish people.
• Congress attempted to limit their entrance
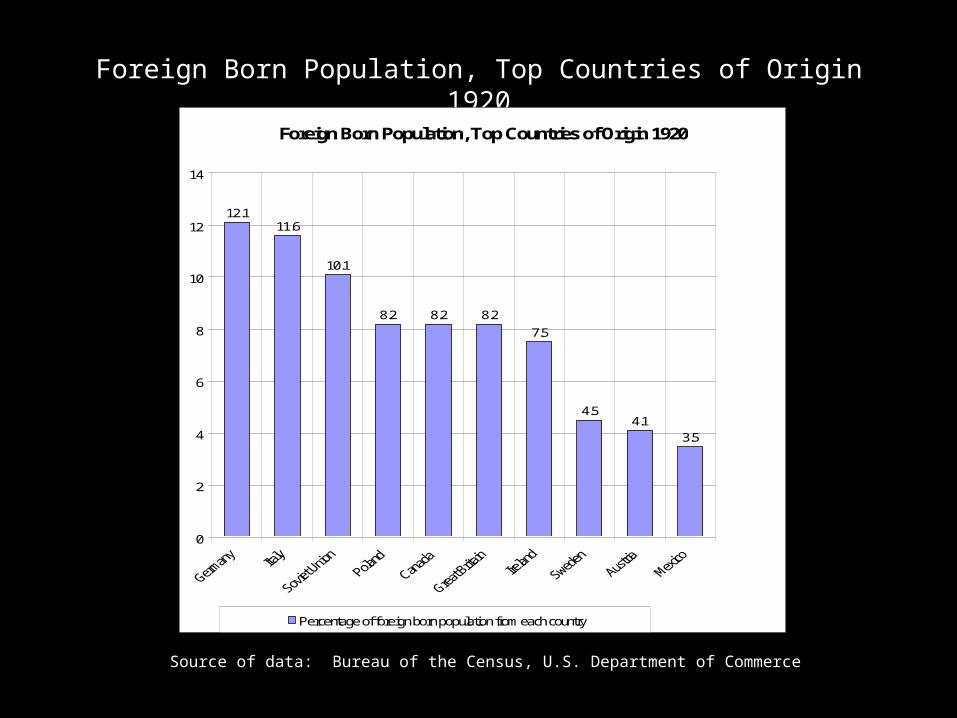
Foreign Born Population, Top Countries of Origin 1920
Foreign Born Population, Top Countries of Origin 1920
12.111.6
10.1
8.2 8.2 8.2
7.5
4.54.1
3.5
0
2
4
6
8
10
12
14
Percentage of foreign born population from each country
Source of data: Bureau of the Census, U.S. Department of Commerce

Foreign Born Population, Top Countries of Origin 1960
Source of data: Bureau of the Census, U.S. Department of Commerce
Foreign Born Population, Top Countries of Origin 1960
12.9
10.29.8
7.9 7.77.1
5.9
3.53.1
2.5
0
2
4
6
8
10
12
14
Percentage of foreign born population from each country

Foreign Born Population, Top Countries of Origin 2000
Source of data: Bureau of the Census, U.S. Department of Commerce
Foreign Born Population, Top Countries of Origin 2000
27.6
4.3 3.8 3.5 3.4 3 2.7 2.5 2.4 2.4
0
5
10
15
20
25
30
Percentage of foreign born population from each country


Immigration 1820-1996 Top Ten Countries of Last Residence
Germany18%
Mexico13%
Italy13%
United Kingdom13%
Ireland12%
Canada11%
Soviet Union, former
9%
Austria4%
Hungary4%
Philippines3%
GermanyMexicoItalyUnited KingdomIrelandCanadaSoviet Union, formerAustriaHungaryPhilippines
Source of data: Immigration and Naturalization Service, US Department of Justice

Immigration 1981-1996 Top 10 Countries of Birth
Mexico42%
Philippines11%
Vietnam9%
China7%
Dominican Republic7%
India6%
Korea6%
El Salvador5%
Jamaica4%
Cuba3%
Mexico
Philippines
Vietnam
China
Dominican Republic
India
Korea
El Salvador
Jamaica
Cuba
Source of data: Immigration and Naturalization Service, US Department of Justice

Push and Pull Factors!• Activity:
– Brainsorm 5 Push Factors: Reasons that would convince you to leave the U.S. to another country, where a better life would be possible for you and your family-> What would “push” you to immigrate to another country from the U.S.
– Brainstorm 5 Pull Factors: Pick a country you would immigrate to if you had to leave the U.S. What are the reasons you would go to this particular country?->What “pulls” you there.

-Push and Pull Factors
-New Immigrants in America

Ellis Island
• 1st View of America
• 6-Second Medical Exam
• Complete Medical Exams by 1917
• Legal Inspection• 1921-Visa and
Literacy Test
Angel Island
• Asian Immigrants arrived on the West coast, where they settled mainly in cities.
• Many were discriminate against by the Chinese Exclusion Act of 1882 - barred most Chinese immigration until repealed in 1943

Problems of Urbanization
• Lack of Housing and open areas of land
• Lack of safe and efficient transportation
• Fire Hazards• Crime• Lack of Sanitation• Water