BELGIUM-FRANCE INTERCONNECTION SPLIT OF THE CAPACITY BETWEEN THE DIFFERENT...
25
BELGIUM-FRANCE INTERCONNECTION SPLIT OF THE CAPACITY BETWEEN THE DIFFERENT TIMEFRAMES MINUTES OF THE CONSULTATION MEETING 1 OCTOBER 2007 Presents : M. Erwin GUIZOUARN AIR LIQUIDE M. James MATTHYS-DONNADIEU BELPEX M. Christophe GENCE-CREUX CRE M. Alain MARIEN CREG M. Vincent BASLÉ EDF TRADING M. Didier GRALL EGL Mme Marieke PIETERS ELECTRABEL M. Bruno MARQUES ENDESA TRADING M. Simone TRIPEPI ENEL TRADE M. René Pierre JACCARD EOS M. Jean-Pierre BÉCRET GABE M. Brieuc RASKIN MORGAN STANLEY M. Benjamin AMSELLEM MORGAN STANLEY M. Geert MEYNCKENS NYRSTAR BELGIUM NV M. Gilles MICHEL NUON M. Brahim HABEDDINE POWEO Mme Audrey MAHUET POWERNEXT M. Thomas ULRICH RWE M. Ryan STUTZKE SEMPRA ENERGY TRADING M. Bruno BLANCHARD SPE M. Frank SCHOONACKER SPE M. Raphael MORCOM TOTAL GAS & POWER M. FENN VATTENFALL ELIA : Frank VANDENBERGHE, Walter AERTSENS, Cécile PELLEGRIN, Erik DE SCHRIJVER RTE : Jean VERSEILLE, Jean-Gabriel VALENTIN, Sabine BOURDON, Nicolas BARBANNAUD, Bruno VINTENAT, Nathalie DELACROIX-VAUBOIS
Transcript of BELGIUM-FRANCE INTERCONNECTION SPLIT OF THE CAPACITY BETWEEN THE DIFFERENT...

BELGIUM-FRANCE INTERCONNECTION SPLIT OF THE CAPACITY BETWEEN THE DIFFERENT TIMEFRAMES
MINUTES OF THE CONSULTATION MEETING
1 OCTOBER 2007 Presents :
M. Erwin GUIZOUARN AIR LIQUIDE M. James MATTHYS-DONNADIEU BELPEX M. Christophe GENCE-CREUX CRE M. Alain MARIEN CREG M. Vincent BASLÉ EDF TRADING M. Didier GRALL EGL Mme Marieke PIETERS ELECTRABEL M. Bruno MARQUES ENDESA TRADING M. Simone TRIPEPI ENEL TRADE M. René Pierre JACCARD EOS M. Jean-Pierre BÉCRET GABE M. Brieuc RASKIN MORGAN STANLEY M. Benjamin AMSELLEM MORGAN STANLEY M. Geert MEYNCKENS NYRSTAR BELGIUM NV M. Gilles MICHEL NUON M. Brahim HABEDDINE POWEO Mme Audrey MAHUET POWERNEXT M. Thomas ULRICH RWE M. Ryan STUTZKE SEMPRA ENERGY TRADING M. Bruno BLANCHARD SPE M. Frank SCHOONACKER SPE M. Raphael MORCOM TOTAL GAS & POWER M. FENN VATTENFALL
ELIA :
Frank VANDENBERGHE, Walter AERTSENS, Cécile PELLEGRIN, Erik DE SCHRIJVER RTE :
Jean VERSEILLE, Jean-Gabriel VALENTIN, Sabine BOURDON, Nicolas BARBANNAUD, Bruno VINTENAT, Nathalie DELACROIX-VAUBOIS

01/10/07 FR-BE Interconnection: Split of the capacity between the different timeframes
1. Introduction Mr Jean Verseille (RTE) introduces the meeting and sets its objective: to consult the market participants about RTE and Elia’s joint proposal concerning the split of capacity between the different timeframes for 2008. In the first part of the meeting, RTE and Elia will present the experience gathered on the different allocations (yearly, monthly and daily) for the first eight months of 2007 and their proposals concerning the split of capacity between the different timeframes for 2008. In a second part, the objective is to discuss these proposals and collect the opinion of the participants in the aim to decide the rules to be applied for 2008.
N.Barbannaud (RTE) reminds that in the consultation invitation, RTE and Elia have opened the possibility for written contributions, to be sent before the meeting, and informs that contributions to the present meeting have been sent by Energiened (Federation of Energy Companies in the Netherlands) and by EFET (European Federation of Energy Traders). These two contributions defend the same point of view; a short presentation of EFET will illustrate their position to open the discussion.
2. Presentation by Elia and RTE Mrs Pellegrin (Elia) and Mrs Bourdon (RTE) present the detailed results of the analyses jointly made by Elia and RTE, and explain the proposals for capacity split in 2008 (see the presentation in appendix and the documents sent in preparation of the consultation meeting). This presentation also introduces further developments such as Financial Transmission Rights.
3. Discussions 3.1. Presentation by EFET
The slides presented by EFET are available in appendix of the present minutes.
When presenting these slides, EFET points out that they share the final common objective of a flow based market coupling associated with Financial Transmission Rights. On the other side, in the meantime, they do not share the point of view concerning the need of guaranteeing a sufficient minimum daily ATC by the reservation of capacities for market coupling, since they consider that only an increase of the global NTC will have an impact on prices convergence and stability. Their “ideal” split of capacity transmission rights is presented in their slide 3.
3.2. Factual comments on the first part of the presentation: “analyses and observations”
A participant asks some questions about the realized simulations and gives its wondering about their relevance. He also points out the short duration of the studied period and the special conditions of markets within 2007.

01/10/07 FR-BE Interconnection: Split of the capacity between the different timeframes
3.3. Opinion of the assembly and discussion on further developments and on the proposed scenarios
Before starting the discussion, the Belgian regulator (CREG) wishes to point out the importance to maximize the total capacity and insists on the fact that TSOs should publish as soon as possible the minimum volumes that will be guaranteed for 2008. He also expresses its wish that the discussion within the present consultation meeting, as already illustrated by EFET’s presentation, takes into account more possibilities than the two presented scenarios.
In complement, he indicates that, in opposition of Elia News, the auction rules on the Belgium-Netherlands interconnection for 2008 have not been approved: their use for 2008 has been authorized but some amendments will still be needed in the future. It appears that this error in Elia’s communication comes from a translation problem from Dutch to French. A correction will be done.
Similarly, the French regulator (CRE) indicates that the present split rules have not been approved by the regulators: the implementation of these split rules have been authorized since no counter-proposal had been submitted by the market participants during the previous consultation meeting.
A participant (representing Belgian industrial electricity consumers) indicates that NTC values are a critical information for the market and that he’s therefore surprised not to find in the communicated documents more information and studies on this subject. RTE indicates that capacity calculations are still on-going and involve other stakeholders than TSOs. The results of these calculations should be communicated at the latest by end November.
Another participant indicates that a maximum of long term products, in complement of day-ahead markets, are necessary to increase competition and allow risk hedging. He requests the start of studies to implement Financial Transmission Rights (FTRs) and would wish their implementation before 2011. In the meanwhile, the application of the “Use it or sell it (UIOSI)” rule would be an important improvement.
The French regulator (CRE) observes that contrary to the first consultation in March 2007, market participants propose this time other scenarios than the ones presented by Elia and RTE; these counter-propositions have to be considered. He shares the view that total capacity (NTC) is the main means to bring more competition. He also indicates that the application of the UIOSI rule in 2009 would be an improvement but strongly suggests that studies concerning FTRs are started as soon as possible.
Elia indicates that they are actively working with RTE to increase the total capacity (NTC) on the France-Belgium interconnection. The placement of phase shifters transformers (PST) should probably allow increasing the capacity for 2008 based on a learning process and out of a maintenance period. However, due to the imperfection of the market, allocating a too large part of this capacity in the long term horizons includes the risk, based on individual decisions, that the market convergence will be lower. A participant indicates that their will be no risk when netting will be implemented as it would correct the possible market participants mistakes.
The TSOs acknowledge the importance of FTR that would, in particular, solve the dilemma between yearly and daily capacities but indicates that, since this issue was not mentioned in the regulator action plan or the MOU, the TSOs resources have been put in priority on other issues up to now.

01/10/07 FR-BE Interconnection: Split of the capacity between the different timeframes
Another participant says that he is also in favor of a maximum of yearly capacities and considers that with secondary market, we are already very near to UIOSI. He’s surprised therefore that resales of capacities to the daily allocation is not used more.
Elia points out the risk that these UIOLI and resales volumes could reduce in the context of a real winter or summer, what would constitute a significant volatility risk for a small market.
In this context, a participant insists on the implementation of FTR or, as a first step UIOSI.
Elia reminds that the present situation results from a compromise between the positions of the different market participants. RTE completes that UIOSI was proposed in April 2006 but that explicit resales to the daily allocations, which has been implemented, was preferred at that time. At the present, the discussion needs to be made within CWE coordination. RTE also points out that the experience of Nordic countries has shown the necessity for TSOs to get actively involved in FTRs (FTR volumes have to be based on physical underlying) and that confusion can be made between Financial Transmission Rights and Firm Transmission Rights.
A participant confirms that majority of the capacity should be allocated to the yearly and monthly products. He would like a confirmation of NTC values in comparison with other sources. He also indicates that consumers are not in favor of FTRs and would rather like that the introduction of products such as Obligatory Use, associated with anticipated netting, would be studied.
In answer to the NTC question, Elia indicates that different data are considered: value on one interconnection vs. global impact for Belgium, daily NTC values vs. medium NTC values. Elia also points out that Obligatory use product would only bring a reduction of flexibility on the actual products and that FTR would have a positive impact on the price convergence. Finally, Elia indicates that netting of yearly and monthly nominations will be done next year and that netting of daily nominations is already implicitly done through Market Coupling. This netting of yearly and monthly nominations will only have an influence in the atypical situations where long term and daily nominations do not go in the same direction.
The difference between PTR (Physical Transmission Right) and FTR (Financial Transmission Right) is further discussed. The Belgian regulator (CREG) concludes that the design of FTRs should be discussed as soon as possible.
A participant suggests that the TSOs should give the advantage to the more useful products (such as yearly products) and that the TSOs should consider splitting the yearly allocation into different slices on different dates. RTE replies that split of yearly auction in several rounds have been refused by the stakeholders in the past. Elia adds that during a recent meeting in the CWE-framework, the market parties took a formal position against the two rounds yearly auctions at the borders of the Netherlands.
Finally, the question of the monthly capacity volume is discussed. A participant points out that monthly capacities should not be suppressed, since this would introduce a non-acceptable gap between yearly and daily allocation. Regarding the volume to be allocated at the monthly auction, different positions are expressed. However, the majority of them are in favor of allocating the majority of the capacity to the yearly and daily allocation.
All participants confirm that the yearly capacity should not be reduced in comparison to 2007.

01/10/07 FR-BE Interconnection: Split of the capacity between the different timeframes
3.4. Proposals for 2008 and conclusion After a short interruption, based on the active debate that took place, RTE and Elia summarize following proposals:
- The implementation of the netting of yearly and monthly nominations before the calculation of daily ATC is foreseen and should be introduced by mid-2008;
- UIOSI should be put in place for 2009;
- The possibility to introduce FTRs will be studied and promoted by RTE and Elia in the context of CWE;
- Concerning the split of capacities between the different timeframes, it’s proposed to apply the current split rules for 2008. This means that for the direction France to Belgium 1300 MW could be allocated in the yearly auction and for the direction Belgium to France 400 MW.
Different participants give explicitly their agreement on this proposition. The consultation meeting is therefore concluded by the agreement to apply the present rules for the split of capacities between the different timeframes within 2008. It is reminded that the minimum guaranteed capacity for 2008 is not yet fixed (which means that it can be higher or lower than 1700 MW).
In complement to this conclusion, the French regulator (CRE) insists that studies and discussions on FTRs are started as soon as possible as they’ll have probably to face a lot of inertia. Elia indicates that RTE and Elia will make a proposal on FTR in the CWE platform framework and do not exclude, if necessary and possible, the creation of a pilot project on one interconnection. However, no engagement can be taken in this meeting, before consultation of the CWE partners. Regulators’ support is also needed.
Concerning multi-year products, the interest of their study is reminded. It is pointed out that a well-functioning centralized anonymous secondary market is, in this case, necessary and that the opinion of EU on this product should be considered. The link with the regional assessment of capacity is also pointed out.

01/10/07 FR-BE Interconnection: Split of the capacity between the different timeframes
Appendix : Presentations
1. Presentation by Elia and RTE
Slide 1
France-Belgium Interconnection
Split of the capacity between the different timeframes
Consultation of 1st of October 2007
Slide 2
2
Introduction
Analyses and observations
Proposals
Further developments
Agenda

01/10/07 FR-BE Interconnection: Split of the capacity between the different timeframes
Slide 3
3
Introduction
1st consultation on March 2007New split rules applicable from May 2007 on
New consultation on split rules For 2008 : France-Belgium interconnectionTarget : discussions in the framework of CWE
Observations and analyses on the first 8 months of 2007
Proposition of new rules for 2008 to be discussed today
Slide 4
4
Current applied rules:In the direction F->B:
• Guaranteed : 1700 MW
• Y : 1300 MW
• M : 100 MW +/- 25% of complementary volume
• D : 400 MW+/- 75% of complementary volume
In the direction B->F:• Guaranteed: 600 MW
• Y : 400 MW
• M : 100 MW + 50% of complementary volume
• D : 100 MW+ 50% of complementary volume
IntroductionSplit rules applied for the direction France to Belgium
0
500
1000
1500
2000
2500
3000
3500
Yearly ATC Montly ATC (out of resales) Reserved for Daily ATC
Split rules applied for the direction Belgium to France
0
500
1000
1500
2000
2500
Yearly ATC Montly ATC (out of resales) Reserved for Daily ATC

01/10/07 FR-BE Interconnection: Split of the capacity between the different timeframes
Slide 5
5
Introduction
Analyses and observationsAllocations within 2007SimulationsConclusions
Proposals
Further developments
Agenda
Slide 6
6
Available capacity and use
⇒ Total available capacity and nomination by types
⇒ In particular in the direction B->F : higher utilization in the 1st part of the studied period
Analyses and observations

01/10/07 FR-BE Interconnection: Split of the capacity between the different timeframes
Slide 7
7
Availability and split of capacity (F->B)
Analyses and observations
Monthly capacities:• Between 88 and 400 MW
• Resales Y->M : only in June
Daily capacities:• On average : 1584 MW (663 -> 2992)
• Resales Y/M->D : on average 411.4 MW> (0 -> 675)
NB : Resales by a limited number of participants
Slide 8
8
Availability and split of capacity (B->F)
Analyses and observations
Monthly capacities:• Between 100 and 400 MW
• Resales Y->M : only in June
Daily capacities:• On average : 955 MW (460 -> 1500)
• Resales Y/M->D : on average 407.4 MW> (300 -> 650)
NB : Resales by a limited number of participants

01/10/07 FR-BE Interconnection: Split of the capacity between the different timeframes
Slide 9
9
Availability and split of daily capacity (%)
Analyses and observations
In the direction F->B:• Reserved : on average 43.4%
> (19.4 -> 94.5 (or 62.6 out of 01/07))• Reserved + ΔNTC : on average 61.5%
> (35.9 -> 99.2 (or 77.1 out of 01/07))
In the direction B->F:• Reserved : on average 18.5%
> (7 -> 53.8 (or 39.2 out of 01/07))• Reserved + ΔNTC : on average 40.2%
> (16.7 -> 72.2 (or 72.2 out of 01/07))
Slide 10
10
Auction results
Analyses and observations
Prices (€/MWh)Jan-07 Feb-07 Mar-07 Apr-07 May-07 Jun-07 Jul-07 Aug-07
From France to Belgium
Year 2.06 2.06 2.06 2.06 2.06 2.06 2.06 2.06
Month 0.92 0.60 0.44 0.65 1.84 4.73 3.01 3.50
Day (weighted average) 1.86 0.00 0.00 0.00 18.70 0.72 1.10 1.63
From Belgium to France
Year 0.25 0.25 0.25 0.25 0.25 0.25 0.25 0.25
Month 0.77 0.15 0.27 0.52 0.68 0.33 0.06 0.12
Day (weighted average) 0.81 0.01 1.53 1.01 0.27 0.00 0.23 0.77
Volumes (MW)Jan-07 Feb-07 Mar-07 Apr-07 May-07 Jun-07 Jul-07 Aug-07
From France to Belgium
Year 1,299 1,299 1,299 1,299 1,299 1,299 1,299 1,299
Month 400 400 400 400 113 325 88 88
Day (average) 359 285 565 238 660 558 527 596
From Belgium to France
Year 400 400 400 400 400 400 400 400
Month 400 400 100 300 100 400 100 100
Day (average) 231 222 105 243 51 20 55 54
0.76 €/MWh
on average : 3.70 €/MWh
(0.22 -> 8.00 €/MWh)
2006 (J->A)
0.11 €/MWh
on average : 0.32 €/MWh
(0.25 -> 0.41 €/MWh)

01/10/07 FR-BE Interconnection: Split of the capacity between the different timeframes
Slide 11
11
Market coupling results
Analyses and observations
⇒ Price convergences (B=F) in 89.66% of the time (B>F in 7.12% and F>B in 3.22%)
⇒ In particular in the direction B->F : higher utilization in the 1st part of the studiedperiod
Slide 12
12
Analyses and observations
[01/01/07 -> 31/03/07]
2.13%
0.83%
64.72%
32.04%
0.28%
0.00%
NL=B>F
NL=B<F
NL=B=F
NL<>B=F
NL<>B>F
NL<>B<F
Peak load : 8h-20h
[01/01/07 -> 31/03/07]
0.00%
83.89%
10.09%
0.00%
0.93%
5.09%NL=B>F
NL=B<F
NL=B=F
NL<>B=F
NL<>B>F
NL<>B<F
Off Peak load : 0h-8h + 20h-24h
[01/04/07 -> 30/06/07]
10.71%
4.85%
38.46%
44.61%
1.37%
0.00%NL=B>F
NL=B<F
NL=B=F
NL<>B=F
NL<>B>F
NL<>B<F
Peak load : 8h-20h
[01/04/07 -> 30/06/07]
3.66%
4.67%
51.74%
39.01%
0.92%
0.00%
NL=B>F
NL=B<F
NL=B=F
NL<>B=F
NL<>B>F
NL<>B<F
Off Peak load : 0h-8h +20h-24h
[01/07/07 -> 31/08/07]
19.09%
0.27%
54.70%
24.86%
1.08%0.00%
NL=B>F
NL=B<F
NL=B=F
NL<>B=F
NL<>B>F
NL<>B<F
Peak load : 8h-20h
[01/07/07 -> 31/08/07]
6.32%
1.08%
65.73%
25.53%
1.34%
0.00%
NL=B>F
NL=B<F
NL=B=F
NL<>B=F
NL<>B>F
NL<>B<F
Off Peak load : 0h-8h +20h-24h
Market coupling results
01/10/07 FR-BE Interconnection: Split of the capacity between the different timeframes
Slide 13
13
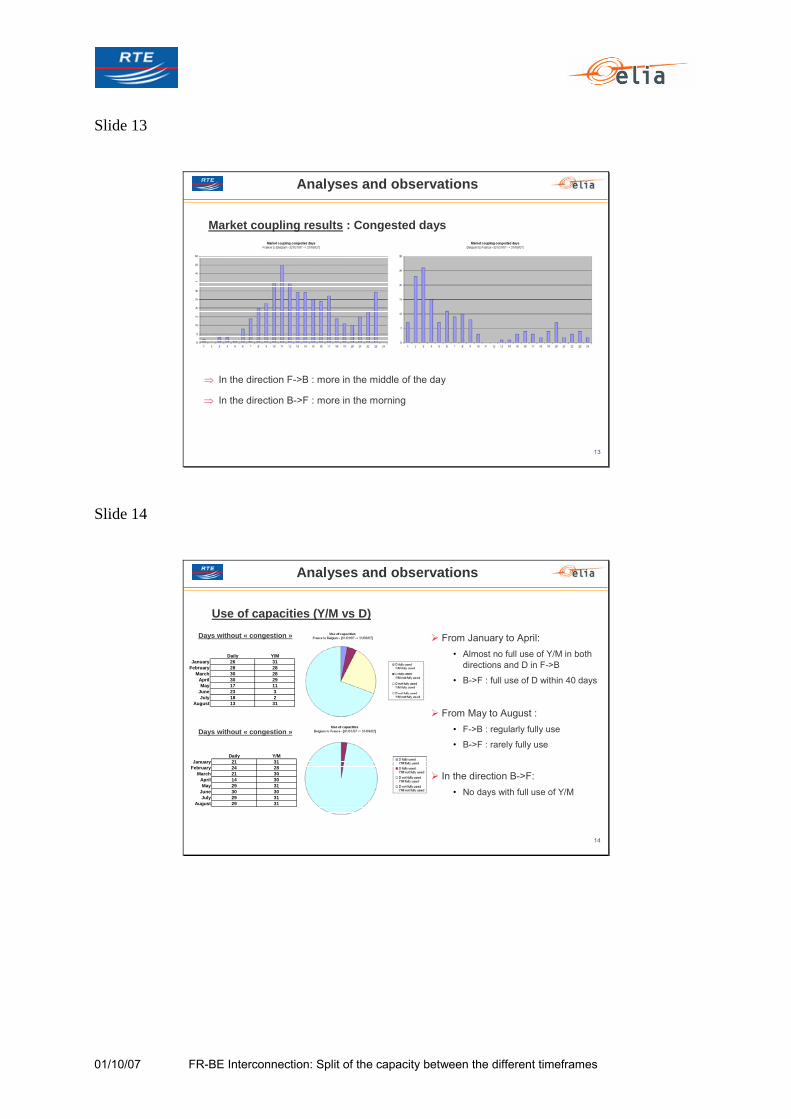
Market coupling results : Congested days
Analyses and observations
⇒ In the direction F->B : more in the middle of the day
⇒ In the direction B->F : more in the morning
Slide 14
14
Use of capacities (Y/M vs D)
Analyses and observations
Daily Y/MJanuary 26 31
February 28 28March 30 28
April 30 29May 17 11
June 23 3July 18 2
August 13 31
Daily Y/MJanuary 21 31
February 24 28March 21 30
April 14 30May 29 31
June 30 30July 29 31
August 29 31
From January to April:• Almost no full use of Y/M in both
directions and D in F->B
• B->F : full use of D within 40 days
From May to August :• F->B : regularly fully use
• B->F : rarely fully use
In the direction B->F:• No days with full use of Y/M
Days without « congestion »
Days without « congestion »

01/10/07 FR-BE Interconnection: Split of the capacity between the different timeframes
Slide 15
15
Analyses and observations
Efficiency of the Market coupling:Efficiency of the Market Coupling could be seen in the use of daily capacities and good convergence as in:
The quality of the economical value of the daily capacity
The better stability of the market prices
The well functionning of market coupling has acquired a large impact on:Purchase of energy
Purchase of explicit capacity
Sufficient minimum daily capacity allows an independance of each local market thatenables to avoid prices spikes and to find reasonable last resource. As illustration, import reached :
1500 MW to Belgium on 19/09/07
1340 MW to France on 23/02/07
Slide 16
16
Introduction
Analyses and observationsAllocations within 2007SimulationsConclusions
Proposals
Further developments
Agenda

01/10/07 FR-BE Interconnection: Split of the capacity between the different timeframes
Slide 17
17
Simulated daily ATC (MW)
Analyses and observations
⇒ With a fix value of 400 MW for the monthly allocations : reduction of the daily ATC of 25.9% on average (47.1% at the maximum)
⇒ With a fix value of 200 MW for the daily allocations : reduction of the daily ATC of 29.4% on average 76.5% at the maximum)
Slide 18
18
Market coupling simulations : Impact on prices
Analyses and observations
0% 10% 20% 40% 0% 10% 20% 40% 0% 10% 20% 40%
January 0% 0.0% -0.1% -0.2% 0% 0.6% 1.5% 4.3% 0% 0.5% 1.2% 3.5%May 0% -0.5% -0.9% -1.9% 0% 9.1% 13.7% 29.1% 0% 8.1% 11.8% 25.1%July 0% -0.2% -0.3% -0.8% 0% 0.7% 1.7% 3.1% 0% 0.4% 1.1% 2.5%
January 0% -0.1% -0.2% -0.4% 0% 1.0% 2.3% 6.6% 0% 0.7% 1.7% 5.0%May 0% -0.6% -1.1% -2.2% 0% 10.6% 15.7% 33.2% 0% 9.5% 13.7% 29.2%July 0% -0.2% -0.3% -0.8% 0% 0.9% 1.9% 3.4% 0% 0.4% 1.2% 2.6%
January 0% 0.2% 0.3% 1.0% 0% -0.9% -2.0% -5.1% 0% -0.5% -0.9% -3.2%May 0% -0.1% -0.2% -0.8% 0% 1.4% 2.9% 6.8% 0% 0.9% 1.7% 3.7%July 0% -0.1% -0.3% -0.7% 0% 0.3% 0.8% 2.1% 0% 0.3% 0.7% 2.0%
Powernext Belpex APX
Bas
ePe
akO
ff-P.

01/10/07 FR-BE Interconnection: Split of the capacity between the different timeframes
Slide 19
19
Market coupling simulations : Impact on convergence
Analyses and observations
0% 10% 20% 40%
Baseload 13.8% 18.5% 25.2% 38.8%Peak 16.3% 21.8% 29.2% 43.1%Off-Peak 8.7% 11.8% 17.2% 30.2%
Baseload 22.0% 19.1% 15.7% 10.6%Peak 22.7% 19.3% 15.5% 10.6%Off-Peak 20.4% 18.7% 16.0% 10.8%
Percentage of congested periods for all three months
FR-B
EB
E-N
L
⇒ On F-B, as expected, the number of congested periods increase with the scenarios
⇒ On B-NL, the number of congested periods decreases
Slide 20
20
Market coupling simulations : Impact on net utility
Analyses and observations
flow1 flow0
mcp1
Amcp0
A
mcp0
B
mcp1
B
10% 20% 40% FR-BE 1,226 2,671 6,754 BE-NL -6 -31 -152 Total 1,220 2,640 6,602

01/10/07 FR-BE Interconnection: Split of the capacity between the different timeframes
Slide 21
21
Conclusions from these analyses :Monthly auctions seems not to be badly impacted by the new split rules.
The minimum level of daily capacity contributed to ensure the good functionning of market coupling.
There has been a good convergence in 2007 thanks to sufficient daily ATCs, including in the summer.
Simulations of reduction of daily ATC show important impacts on prices.
The present split rules have not been experimented within the winter.
Volume of resales and UIOLI remains insufficient to count only on it; resales depend on a limited number of participants.
Analyses and observations
Slide 22
22
Introduction
Analyses and observations
ProposalsBasic principlesProposals for 2008
Further developments
Agenda

01/10/07 FR-BE Interconnection: Split of the capacity between the different timeframes
Slide 23
23
Basic principles :
As in the current applied rules:A certain volume will be guaranteed all year long, without prejudice of the
way this volume is split between the different timeframes
Splitting is applied on this guaranteed volume and on the complementaryvolume calculated each month
Minimum volume for 2008 will be known later on
Proposed adaptations:Part reserved for the daily allocation : Slight re-inforcement of the minimum
(in MW) and reduction of the % of the complementary volume
In complement, possibility of a better equilibrium between yearly and monthly capacity
Proposals
Slide 24
24
Proposals for 2008 (F->B) :
Scenario 1 : Yearly auction : 1100 MW
Expected guaranteed volume : 50 MW for M & 450 MW for D
Complementary volume : 50% for M & 50% for D
Scenario 2 : Yearly auction : 900 MW
Expected guaranteed volume : 250 MW for M & 450 MW for D
Complementary volume split : 60% for M & 40% for D
Proposals

01/10/07 FR-BE Interconnection: Split of the capacity between the different timeframes
Slide 25
25
F B : scenario 1
F B : scenario 2
Split rules to be applied for the direction France to Belgium
0
500
1000
1500
2000
2500
3000
3500
Yearly ATC Montly ATC (out of resales) Reserved for Daily ATC
Split rules to be applied for the direction France to Belgium
0
500
1000
1500
2000
2500
3000
3500
Yearly ATC Montly ATC (out of resales) Reserved for Daily ATC
Proposals
Monthly NTC Yearly ATC Monthly
ATC Minimum Daily ATC
Y+M ATC (%)
Minimum Daily ATC
(%) 1600 1100 50 450 72% 28% 1700 1100 100 500 71% 29% 1900 1100 200 600 68% 32% 2100 1100 300 700 67% 33% 2300 1100 400 800 65% 35%
Monthly NTC Yearly ATC Monthly
ATC Minimum Daily ATC
Y+M ATC (%)
Minimum Daily ATC
(%) 1600 900 250 450 72% 28% 1700 900 310 490 71% 29% 1900 900 430 570 70% 30% 2100 900 550 650 69% 31% 2300 900 670 730 68% 32%
Slide 26
26
Proposals
Proposals for 2008 (B->F) :
Scenario 1 : Yearly auction : 400 MW
Expected guaranteed volume : 50 MW for M & 150 MW for D
Complementary volume : 50% fo M & 50% for D
Scenario 2 : Yearly auction : 300 MW
Expected guaranteed volume : 150 MW for M & 150 MW for D
Complementary volume : 50% for M & 50% for D

01/10/07 FR-BE Interconnection: Split of the capacity between the different timeframes
Slide 27
27
B F : scenario 1
B F : scenario 2
Split rules to be applied for the direction Belgium to France
0
500
1000
1500
2000
2500
Yearly ATC Montly ATC (out of resales) Reserved for Daily ATC
Split rules to be applied for the direction Belgium to France
0
500
1000
1500
2000
2500
Yearly ATC Montly ATC (out of resales) Reserved for Daily ATC
Proposals
Monthly NTC Yearly ATC Monthly
ATC Minimum Daily ATC
Y+M ATC (%)
Minimum Daily ATC
(%) 600 400 50 150 75% 25% 800 400 150 250 69% 31%
1000 400 250 350 65% 35%
Monthly NTC Yearly ATC Monthly
ATC Minimum Daily ATC
Y+M ATC (%)
Minimum Daily ATC
(%) 600 300 150 150 75% 25% 800 300 250 250 69% 31%
1000 300 350 350 65% 35%
Slide 28
28
Introduction
Analyses and observations
Proposals
Further developments
Agenda

01/10/07 FR-BE Interconnection: Split of the capacity between the different timeframes
Slide 29
29
Split rules for 2009 will have to be discussed in the CWE context:Flow-based market coupling
Single CWE regional auction platform
Single CWE regional set of rules (UIOSI ?)
Regional assessment of capacities
Financial Transmission Rights (FTR) are to be considered as a forthcoming step in this regional approach
FTR replaces Long Term auctioned PTR (Physical Transmission Rights)
All physical capacity is attributed to the daily allocation
They will maximize daily capacity and price convergence
They have in any case to be based on a physical underlying corresponding to Transmission capacity
Further developments
Slide 30
30
Different questions yet to be treated:• Product characteristics (option vs. obligation, firmness, …)
• Legal and Regulatory aspects (interaction with the financial authorities, impact on accountability, …)
• Impacts on the stakeholders
• …
In the mean time, UIOSI could be considered as an intermediate step in the transition between PTR and FTR
Further developments

01/10/07 FR-BE Interconnection: Split of the capacity between the different timeframes
Slide 31
31
Proposals
Thank youfor your attention
2. Presentation by EFET
Slide 1
ELIA & RTE consultation meeting1st Oct 2007 – PARIS
Split of capacity between the different time-frames on the France-Belgium interconnection

01/10/07 FR-BE Interconnection: Split of the capacity between the different timeframes
Slide 2
2008: DECISION NOW
• yearly capacity F->B should at least be equal to current levels of 1300 MW, but preferably higher since 1700 MW can be guaranteed
• The monthly capacity allocation should be going back to the higher levels seen before May 2007
• TSOs should already now allocate capacity for 2009, 2010, 2011, etc.
2009: START DISCUSSION
• Flow-based• FTR’S
Slide 3
unwished practice
usual current practice
wished realistic practice
SPLIT OF CAPACITY TRANSMISSION RIGHTS
in EFET position paper (key principles on Transmission Rights - June 2007)
⇒ Capacity rights’ maturities should be similar to those found commonly on the electricity market

01/10/07 FR-BE Interconnection: Split of the capacity between the different timeframes
Slide 4
LONG-TERM / SECONDARY MARKET /SHORT-TERM
Monthly/Quarterly Intraday market20082010 2009 AnnualC
apac
ity
H-15
Capacity used OTC
Time
Periodic capacity salesharmonised withenergy market
Use or sell (give up) capacity to
PX
Options tradable in secondary market
Obligationstradable in Intra-day market
H+30
Intradaymarket starts
Daily
“extra”
Use it
Capacity used
implicitly
H
Multi-Annual
Sell it
(get paid for it)
H
D-1 implicit allocation
Capacity allocation at D-1: Market coupling linked to explicit auctions
in EFET position paper (key principles on Transmission Rights - June 2007)
Slide 5
WHY ALLOCATE MORE LONG-TERM CAPACITY
• Increase of amount + stability of available cross-border capacity expected• Cross-border capacity is an asset, similarly to generation capacity
• increases competition, particularly in less liquid markets• creates markets relative to more liquid trading hubs• allows producers and consumers to hedge their exposures
• Why limit capacity allocation to 1 year? ~ e.g. to 2012-2020• Long term capacity allocation leads to:
• competition enhancement
• correct price signals and visibility
• liquidity for hedging risks
• LT investment signals and security of supply2.783.96D
4.615.42M
3.464.70Y
20072006
€/MWh
B->NL
1.483.36D
2.274.29M
2.060.76Y
20072006
€/MWh
F->B
Evolution of cross-border Prices Belgium

01/10/07 FR-BE Interconnection: Split of the capacity between the different timeframes
Slide 6
RECONCILING LONG TERM VISIBILITY WITH PHYSICAL OPTIMISATION ⇒ No need to arbitrarily split physical capacity allocation between long term and short term
LONG TERMvisibility and
investment signals
SHORT TERMoptimal physical
optimisation
MAXImplicit market-
coupling
MAXExplicit capacity
auction
NTC (net available cross-border capacity)
FinancialTransmission rights (FTRs)(multi-)years / quarters / months
PhysicalTransmission rights (PTRs)day-ahead / intraday
All NTC (available cross-border capacity) will be optimized efficiently through market-coupling
Market participants
Grid Operators
Coupled Exchanges
Buy FTR at auctio
n price
Sell PTR
Pay for the PTR at the remaining price difference between 2 exchanges
Pay for the FTR at
the remaining price
difference between
2 exchanges
Buy/Sell Power on
exchanges
e.g. yearly
e.g. day-ahead
– Price differences should reflect real congestion
– For the short term, market-coupling has been proved very efficient to optimize flows • Incorrect flows e.g. DE-NL or
DE-FR• Spikes on exchanges lead to
higher risk margin on forward products
– For the long term, FTR’s(Financial Transmission Rights) will prove the most efficient since they allow for the physical flows to run through market-coupling
FTRs are the solution
Slide 7
EVOLUTION OF CROSS-BORDER CAPACITY BELGIUM
– F->B avg NTC:• 2003: 1737 MW• 2004: 1829 MW• 2005: 1939 MW• 2006: 2589 MW• 2007: 2479 MW
– B->NL avg NTC:• 2003: 1217 MW• 2004: 1285 MW• 2005: 1280 MW• 2006: 1263 MW• 2007: 1297 MW
– Further increase expected with new phase shifters, flow-based capacity allocation and grid investments
NTC and nominations F->B and B->NL (+: import, -: export) in MW (until 18 Sep 2007)
Source : RTE, Elia and Tennet websites, Morgan Stanley Commodities
Belgian cross-border 2006
-1500
-1000
-500
0
500
1000
1500
2000
2500
3000
3500
01/0
1/20
06
08/0
1/20
0615
/01/
2006
22/0
1/20
0629
/01/
2006
05/0
2/20
0612
/02/
2006
19/0
2/20
06
26/0
2/20
0605
/03/
2006
12/0
3/20
06
19/0
3/20
0626
/03/
2006
02/0
4/20
0609
/04/
2006
16/0
4/20
0623
/04/
2006
30/0
4/20
0607
/05/
2006
14/0
5/20
0621
/05/
2006
28/0
5/20
0604
/06/
2006
11/0
6/20
06
18/0
6/20
0625
/06/
2006
02/0
7/20
06
09/0
7/20
0616
/07/
2006
23/0
7/20
0630
/07/
2006
06/0
8/20
0613
/08/
2006
20/0
8/20
06
27/0
8/20
0603
/09/
2006
10/0
9/20
06
17/0
9/20
0624
/09/
2006
01/1
0/20
0608
/10/
2006
15/1
0/20
0622
/10/
2006
29/1
0/20
06
05/1
1/20
0612
/11/
2006
19/1
1/20
06
26/1
1/20
0603
/12/
2006
10/1
2/20
06
17/1
2/20
0624
/12/
2006
31/1
2/20
06
-1500
-1000
-500
0
500
1000
1500
2000
2500
3000
3500NTC F->BNTC B->NLnominated F->Bnominated B->NLNet import
Belgian cross-border 2007
-1500
-1000
-500
0
500
1000
1500
2000
2500
3000
3500
01/0
1/20
0708
/01/
2007
15/0
1/20
07
22/0
1/20
0729
/01/
2007
05/0
2/20
0712
/02/
2007
19/0
2/20
07
26/0
2/20
0705
/03/
2007
12/0
3/20
0719
/03/
2007
26/0
3/20
07
02/0
4/20
0709
/04/
2007
16/0
4/20
0723
/04/
2007
30/0
4/20
07
07/0
5/20
0714
/05/
2007
21/0
5/20
0728
/05/
2007
04/0
6/20
07
11/0
6/20
0718
/06/
2007
25/0
6/20
07
02/0
7/20
0709
/07/
2007
16/0
7/20
0723
/07/
2007
30/0
7/20
07
06/0
8/20
0713
/08/
2007
20/0
8/20
0727
/08/
2007
03/0
9/20
07
10/0
9/20
0717
/09/
2007
24/0
9/20
0701
/10/
2007
08/1
0/20
07
15/1
0/20
0722
/10/
2007
29/1
0/20
0705
/11/
2007
12/1
1/20
07
19/1
1/20
0726
/11/
2007
03/1
2/20
0710
/12/
2007
17/1
2/20
07
24/1
2/20
0731
/12/
2007
-1500
-1000
-500
0
500
1000
1500
2000
2500
3000
3500NTC F->BNTC B->NLnominated F->Bnominated B->NLNet import

01/10/07 FR-BE Interconnection: Split of the capacity between the different timeframes
Slide 8
PRICE CONVERGENCE FRANCE-BELGIUM
⇒ Improvement of price convergence is not obvious !
⇒ What actually matters is OVER-ALL CAPACITY
⇒ Dedicated day-ahead capacity must not be increased