Fagroninvestors.fagron.com/sites/arseus.com/files/Berenberg Belgian... · dispensing registration...
28
Fagron Berenberg Belgian Conference London, 12 March 2018 Constantijn van Rietschoten Chief Communications Officer
Transcript of Fagroninvestors.fagron.com/sites/arseus.com/files/Berenberg Belgian... · dispensing registration...

Fagron
Berenberg Belgian Conference
London, 12 March 2018
Constantijn van Rietschoten
Chief Communications Officer

Fagron at a glance
FArmaceutische GRONdstoffen was founded in
Rotterdam in 1990
2016 2017
Turnover € 421.8m € 436.9m
REBITDA € 90.6m € 95.7m
Active in 34 countries on 5 continents
2,000 FTE, incl. >200 pharmacists
Leading pharmaceutical compounding company,
bringing personalized pharmaceutical care to
hospitals, pharmacies, clinics and patients
Listed on Euronext Brussels and Amsterdam
since 5 October 2007

Fagron global presence
FCS Essentials & Brands Office or repacking only facility Combination FCS / Essentials & Brands

Strategy

Pharmaceutical raw materials,
excipients, and equipment &
supplies used in compounding
Personalized ready-to-use
medication that is prepared in
compounding facilities
Innovative products and
concepts for pharmaceutical
compounding
Our business - segments
Fagron
Essentials BrandsCompounding Services
4

Our business - geographical
Europe North AmericaSouth America
58% of sales 18% of sales24% of sales
Essentials
FCS - sterile
FCS - non-sterile
Brands
Essentials
FCS - sterile
FCS - non-sterile
Brands
Essentials
FCS - non-sterile (FACO)
Brands
Fagron
5

FCS facility in Wichita (US)Operational since March 2017
6
State-of-the-art FDA 503B outsourcing facility supplying medication to hospitals and ASCs
12,000 sf of clean rooms, 11 isolated clean rooms, automated filling equipment, chemistry and
microbiological testing laboratory and the ability to produce high and medium risk medication
Facility will play a role in the ongoing process of hospitals outsourcing their sterile compounding
due to increased efficiency, higher quality and less waste

FCS facility in Hoogeveen (NL)Operational since July 2017
7
Specializes in the production of prefilled glass syringes with a long shelf life for the hospital
market
Syringes have unique features incl. colour coding, Tall Man lettering and 2D coding for
dispensing registration
Facility contributes to optimal medication safety

Fagron Brands
8
Innovative concepts, delivery vehicles and
formulations for pharmaceutical compounding
Developed by Fagron, in close collaboration with
prescribers, pharmacists and universities
Brands are produced in GMP compliant facilities
to ensure the highest quality
Increasing interest for Fagron Brands by
pharmaceutical industry

Fagron Essentials
9
2,500 pharmaceutical raw materials, such as amino
acids, antibiotics, corticosteroids, hormones,
opiates, vitamins, alcohol and excipients
Fagron has sourcing and audit offices in
Minneapolis, Rotterdam, São Paulo and Shanghai
All raw materials must pass an acceptance and
quality check according to the most recent
pharmacopeia
Repacking in GMP-compliant clean rooms and
distribution of pharmaceutical raw materials,
supplies and equipment for compounding
Global reach helps to efficiently audit, qualify and
source raw materials. This results in full traceability
and a high quality standard
Repacking of raw materials in a clean room of Fagron Europe
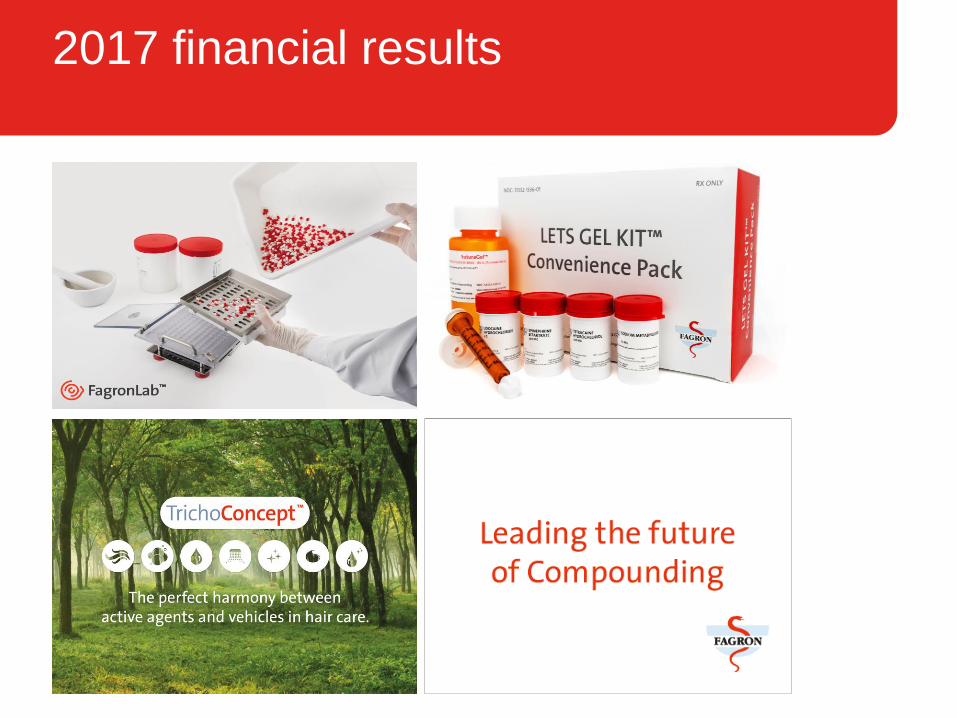
2017 financial results

2017 headlines
Financial
• Turnover increased 3.6% to € 436.9m
• REBITDA1 increased 5.7% to € 95.7m or 21.9% of turnover
• EBIT increased 317.2% to € 74.6m or 17.1% of turnover
• Strong operational cash flow of € 84.2m
• Net financial debt/REBITDA ratio declined from 3.18 to 2.48
Strategic and operational
• Active buy-and-build strategy
• Acquisition of Croatian Kemig in August
• Acquisition of Brazilian All Chemistry in October
• Appointments
• Rafael Padilla appointed to CEO and co-opted as member of the Board of Directors
• Ivan Marostica succeeded Rafael Padilla as Area General Manager of Fagron South
America
• Blake Keller succeeded Rita Hoke as President of Fagron North America
• Marcello Bergamini appointed Area General Manager of Fagron Europe (excl. Benelux)
1. EBITDA before non-recurrent result.

Consolidated turnover
12
(x € 1,000) 2017 2016 Total growth Total growth
CER
Organic
growth
Organic
growth CER
Fagron 430,132 414,180 +3.9% +2.4% +4.5% +2.9%
HL Technology 6,802 7,659 -11.2% -9.5% -11.2% -9.5%
Total 436,934 421,839 +3.6% +2.1% +4.2% +2.7%
CER = constant exchange rates
Organic turnover growth of 4.2% (+2.7% CER)
Growth driven by positive turnover developments in Europe, North- and South America

Turnover developmentExcluding HL Technology (in € 1,000)
13
414.180430.132
4.7374.219 3.173 6.218 3.343 5.739
Turnover 2016 Europe* South America North America Currency effect Acquisitions Disposals Turnover 2017
* The Europe segment consists of the operations of Fagron in Europe, South Africa and Australia.

Fagron Europe
14
(x € 1,000) H2-2017 H2-2016 Δ 2017 2016 Δ
Turnover 120,195 121,558 -1.1% 249,082 246,904 +0.9%
REBITDA 30,577 32,218 -5.1% 63,301 63,138 +0.3%
REBITDA margin 25.4% 26.5% 25.4% 25.6%
CER = constant exchange rates
Organic turnover growth of 2.4% (+1.9% CER)
REBITDA increases 0.3%; margin decreases 20bps to 25.4%
Growth in H2-2017 curbed by limited product availability and delivery delays
Backlog expected to be largely cleared in April 2018
Marcello Bergamini appointed Area General Manager Fagron Europe (excl. Benelux)

Fagron South America
15
(x € 1,000) H2-2017 H2-2016 Δ 2017 2016 Δ
Turnover 53,784 48,896 +10.0% 103,282 91,130 +13.3%
REBITDA 10,761 9,331 +15.3% 20,815 18,072 +15.2%
REBITDA margin 20.0% 19.1% 20.2% 19.8%
Organic turnover growth of 11.9% (+4.6% CER)
REBITDA increases 15.2%; margin increases 40bps to 20.2%
Strong volume growth in 2017:
• Majority of raw materials purchases are in US-dollar
• Lower purchase prices, due to strengthening BRL/USD, fully passed on to customers
• Decrease of prices in BRL had a negative impact on turnover growth at CER
Ivan Marostica appointed Area General Manager Fagron South America
CER = constant exchange rates

Fagron North America
16
(x € 1,000) H2-2017 H2-2016 Δ 2017 2016 Δ
Turnover 37,888 38,049 -0.4% 77,769 76,147 +2.1%
REBITDA 6,009 3,867 +55.4% 11,461 8,912 +28.6%
REBITDA margin 15.9% 10.2% 14.7% 11.7%
Organic turnover growth of 2.1% (+4.2% CER)
REBITDA increases 28.6%; margin increases 300bps to 14.7%
Sterile activities are performing in line with expectations
• Turnover growth of 15.5% (+17.8% CER)
• Wichita facility obtained 48 licenses
Raw materials activities
• Turnover decline of 24.3% (-22.8% CER)
• Turnover decline of 7.1% CER in Q4-17; stable compared to previous quarters in 2017
Blake Keller appointed President Fagron North America
CER = constant exchange rates

2017 financial review

Financial review
Turnover
(in € million)
436.9
Gross margin
(in € million)
269.8
Operating costs
(in € million)
-174.1
Turnover increases 3.6% or 2.1% at CER
Organic increase of 4.2% or 2.7% at CER
Gross margin increases by € 4.7m (+1.8%)
Gross margin as percentage of turnover decreases by 110bps to 61.8%
compared to 2016
Operating costs decrease 0.3% to € 174.1m
Operating costs as percentage of turnover decrease by 150bps to 39.8%
Operating costs in H2-2017 decreased by 3.5%, mainly due to cost savings
in Europe and in the raw materials activities in the US and to the sale of the
facility in France18

Financial review
REBITDA*
(in € million)
95.7
Non-recurring
(in € million)
-3.6
EBITDA
(in € million)
92.2
REBITDA increases 5.7% to € 95.7m
REBITDA as percentage of turnover increases by 40bps to 21.9%
Non-recurring result amounted to -€ 3.6m compared to -€ 3.2m in 2016
EBITDA increases 5.5% to € 92.2m
EBITDA as percentage of turnover increases by 40bps to 21.3%
* REBITDA is EBITDA before non-recurring result.
19

Financial review
DA
(in € million)
-17.6
EBIT
(in € million)
74.6
Fin. result*
(in € million)
-19.4
D&A amounted to € 17.6m compared to € 21.1m in 2016
The decrease was mainly due to the accelerated depreciation of assets in
2016 (in US and Switzerland)
EBIT increases 317.2% to € 74.6m
The increase was largely caused by the recognition of an impairment of
€ 48.4m in 2016
Financial results amount to € 19.4m, an improvement of 24.2%
• Financial costs decrease by € 15.4m due to lower interest expenses and
non-recurring costs in 2016 related to the refinancing
• The financial income decreases by € 9.3m due to the non-recurring
recognition of an income item in 2016 as a result of the received waivers* Financial result excl. revaluation financial derivatives. 20

Financial review
Taxes
(in € million)
-8.9
Net profit
(in € million)
47.0
Taxes decreased by 24.1% to € 8.9m
Effective tax rate as a percentage of the profit before taxes was 15.9%
Net profit amounts to € 47.0m, an increase of € 65.2m compared to 2016
21

Net financial debt
22
285.408
236.197
6.93384.24728.560
13.410
31 December 2016 Net interest paid Investment activities Exchange ratedifferences
Operating cash fllow 31 December 2017
Net debt decreases € 49.2m to € 236.2m
Net debt/REBITDA-ratio of 2.48, significantly below the level
of 3.25 as agreed in the RCF and Note Purchase agreement

2017 summary
23
Strong results driven by growth in core countries
Operating costs well under control
Profitability increasing faster than turnover
Focus remains on
• Strong organic growth through development of
innovative products and concepts
• Targeted acquisitions in our core markets
Further growth of turnover and profitability expected
in 2018
Dividend proposal of € 0.10 per share

Q&A

What is compounding?
Patient
Personalized
medication
Produced in pharmacies or by GMP outsourcing facilities based on
scientific pharmaceutical knowledge
The designing, developing, producing
and marketing of personalized
pharmaceutical products Alternative dosage
forms
Alternative dosage
strengths
Combination
therapy
25

Benefits of compounding
Patient
Less side effects
More individualized approach
Customized medication
Enhance patient compliance
Drug shortages
Discontinued drugs
High-quality and cost effective alternative
New and unavailable therapeutic needs
Full pharmaceutical service
26

Disclaimer
Important information about forward-looking statements
Certain statements in this presentation may be considered “forward-looking”. Such
forward-looking statements are based on current expectations, and, accordingly, entail
and are influenced by various risks and uncertainties. The Company therefore cannot
provide any assurance that such forward-looking statements will materialize and does
not assume an obligation to update or revise any forward-looking statement, whether as
a result of new information, future events or any other reason.
27