
TAMÁS NOVÁK Global Business Environment Global problems: crisis.
Upload
aliyah-limeCategory
view
216download
2

Béla NovákBéla NovákMolecular Network Dynamics Research Molecular Network Dynamics Research GroupGroup
Hungarian Academy of Sciences and Hungarian Academy of Sciences and
Budapest University of Technology and Budapest University of Technology and EconomicsEconomics
Béla NovákBéla NovákMolecular Network Dynamics Research Molecular Network Dynamics Research GroupGroup
Hungarian Academy of Sciences and Hungarian Academy of Sciences and
Budapest University of Technology and Budapest University of Technology and EconomicsEconomics
Collaborator:Collaborator:John J. TysonJohn J. TysonDepartment of BiologyDepartment of BiologyVirginia Polytechnic Institute andVirginia Polytechnic Institute andState UniversityState University
Collaborator:Collaborator:John J. TysonJohn J. TysonDepartment of BiologyDepartment of BiologyVirginia Polytechnic Institute andVirginia Polytechnic Institute andState UniversityState University
The Eukaryotic Cell Cycle: molecules, mechanisms, modulesand mathematical models
The Eukaryotic Cell Cycle: molecules, mechanisms, modulesand mathematical models

DNA
mRNA
protein
The central dogma

DNA
mRNA
protein
cell physiology
protein network A B C D
Beyond the central dogma

Hanahan & Weinberg, 2000

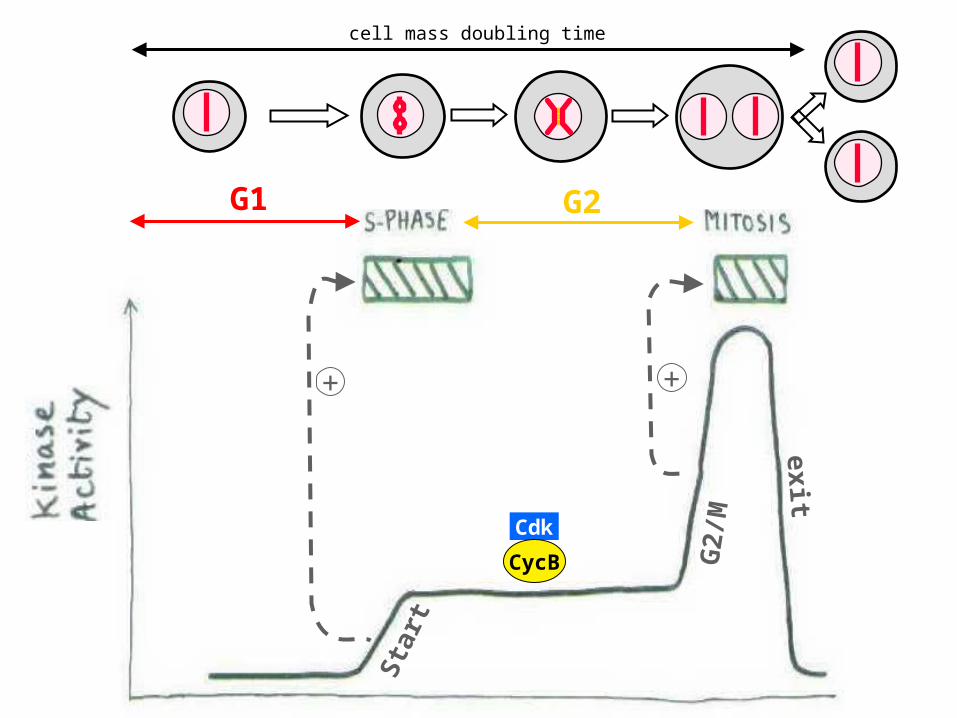
The cell cycle
S M
The cell cycle is thesequence of events wherebya growing cell replicates allits components and dividesthem more-or-less evenly
between two daughter cells...

G1 G2
Cdk
CycB
Cdk
CycB
G1 G2
cell mass doubling time
+ +Sta
rt
G2/M
exit

G1 G2
+
Cdk
CycB
pheromone
-

Cdk
CycB
G1 G2
inhibitor-
Sta
rt
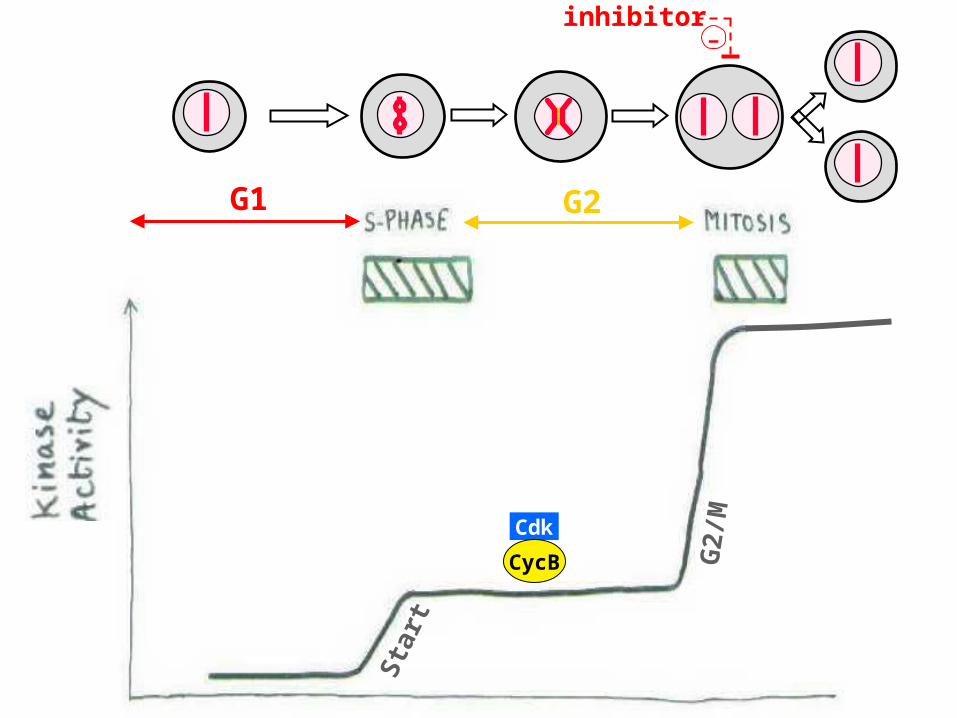
Cdk
CycB
G1 G2
inhibitor-
Sta
rt
G2/M

Sta
rtCK
I
Cdk
CycB
CK
I
P
CK
I
AA
Exit
APCM
Cdk
G2/M
P
Cdc25
Wee1Cdk
CycB
APCG1
Cdk
CycB
AA
Cdk
CycB

Regulatory feedback loopsRegulatory feedback loops
X Y
-
-
X Y
+
+
Positive feedback loop
X Y
+
-
Negative feedback loop
X Y
+
-

Sta
rtCK
I
Cdk
CycB
CK
I
P
CK
I
AA
Exit
APCM
Cdk
G2/M
P
Cdc25
Wee1Cdk
CycB
APCG1
Cdk
CycB
AA
Cdk
CycB
inactive
Wee1P
inactive
Cdc25
P
inactive
APCM
delay
inactive
APCG1inactive

?
fission yeast budding yeast

Mutants in Fission Yeastgene viability trait
cdc2- no block in G1 and G2cdc13- no endoreplicationrum1- yes sterileste9- yes sterilewee1- yes small cellscdc25- no block in G2
cdc2op yes wtcdc13op yes wtrum1op no endoreplicationste9op no endoreplicationwee1op yes large cellscdc25op yes small cells
wee1- rum1 no extremely smallwee1- cdc25 yes quantized cycleswee1- cdc25op no mitotic catastrophe

0 50 100 1500.0
0.5
1.0
0.0
0.2
0
1
0
1
1
2
period of oscillation= cycle time= doubling time (tD)
tD
mass (m)
period
dm/dt = m where = ln2/tD
rate ~ mass
APCM
Cdk
CycB
APCG1
CK
I
S/G2G1M
time (min)
M
CycB

0 50 100 1500.0
0.5
1.0
0.0
0.2
0
1
0
1
1
2
tD
mass (m)
period
dm/dt = m where = ln2/tD
APCG1
Cdk
CycB
APCM
CycB
CK
I
S/G2G1M
time (min)
M
mass
Size control over the cell cycleSize control over the cell cycle
rate ~ mass

Inside view ?

Sta
rtCK
I
Cdk
CycB
CK
I
P
CK
I
AA
Exit
APCM
CdkP
Cdc25
Wee1Cdk
CycB
APCG1
Cdk
CycB
AA
Cdk
CycB
Wee1P
Cdc25
P
APCG1
APCM
delay
cell mass
Cdk/C
ycB
cell mass
Cdk/C
ycB
cell mass
Cdk/C
ycB
G2/M

0 1 2
0.0
0.2
0.4
1.4
1.6 stable s.s.unstable s.s.min/max
Cd
k/C
ycB
G1
S/G2
M
cell mass
Bifurcation diagram of the cell cycle control networkBifurcation diagram of the cell cycle control networkBifurcation diagram of the cell cycle control networkBifurcation diagram of the cell cycle control network

0 1 2
0.0
0.2
0.4
1.4
1.6 stable s.s.unstable s.s.min/max
Cd
k/C
ycB
G1
S/G2
M
cell mass
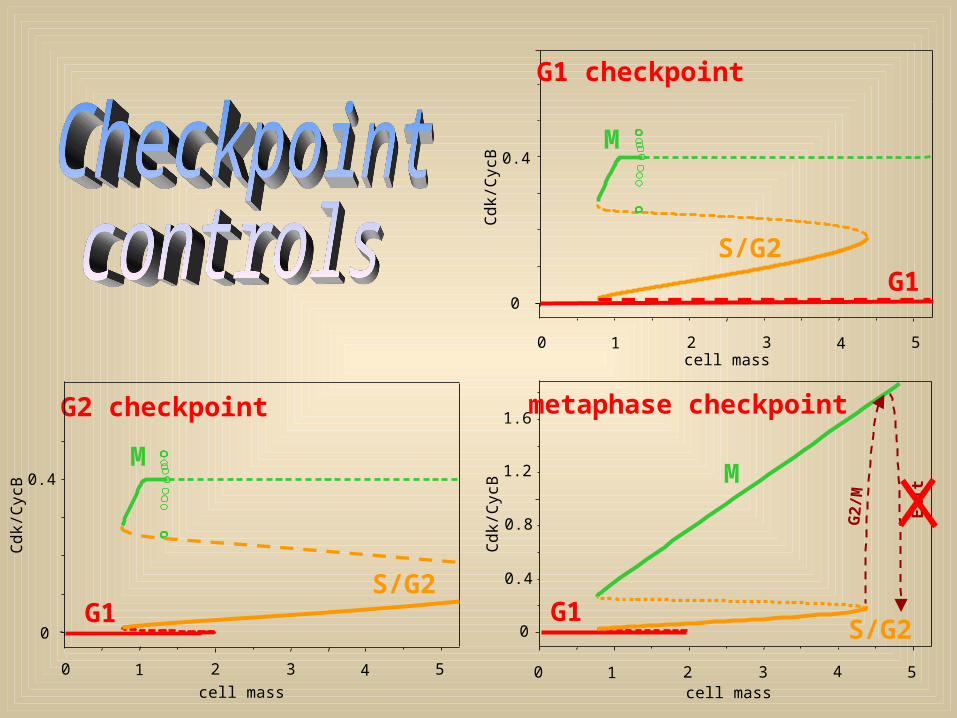
Cell cycle regulation on the bifurcation diagram Cell cycle regulation on the bifurcation diagram Cell cycle regulation on the bifurcation diagram Cell cycle regulation on the bifurcation diagram
dividingcellnewborn
cellS
tart
G2/M
Exit
G1S/G2
M
0
0.4
0 2 431 5
G1 checkpoint
cell mass
Cdk/C
ycB
G1S/G2
0.4
0
0.8
1.2
1.6
0 2 431 5
M
metaphase checkpoint
cell mass
Cdk/C
ycB
G2
/M
Exit
G1S/G2
M
0
0.4
G2 checkpoint
cell mass
Cdk/C
ycB
0 2 431 5

JohnTyson
AttilaCsikász-Nagy
BélaGyőrffy
ÁkosSveiczer
KathyChen
AttilaTóth
LaurenceCalzone
AndreaCiliberto
JasonZwolak
ChrisHong

Homepage:Homepage: http://www.cellcycle.bme.hu/http://www.cellcycle.bme.hu/
Homepage:Homepage: http://www.cellcycle.bme.hu/http://www.cellcycle.bme.hu/
Hungarian Academy of Sciences
Supporting agencies:Supporting agencies:

Béla NovákBéla NovákMolecular Network Dynamics Research Molecular Network Dynamics Research GroupGroup
Hungarian Academy of Sciences and Hungarian Academy of Sciences and
Budapest University of Technology and Budapest University of Technology and EconomicsEconomics
Béla NovákBéla NovákMolecular Network Dynamics Research Molecular Network Dynamics Research GroupGroup
Hungarian Academy of Sciences and Hungarian Academy of Sciences and
Budapest University of Technology and Budapest University of Technology and EconomicsEconomics
Modelling the cell division cycle
Modelling the cell division cycle
Paul NurseFrank Uhlmann


