Beirut - May 2009 The Human Impact: Measuring Changes in Clients’ Lives Jeff Toohig Deputy...
22
Beirut - May 2009 The Human Impact: Measuring Changes in Clients’ Lives Jeff Toohig Deputy Director, PPI Deployment Sanabel 6 th Annual Conference Grameen Foundation on Behalf of Grameen Jameel
-
Upload
erika-poole -
Category
Documents
-
view
215 -
download
2
Transcript of Beirut - May 2009 The Human Impact: Measuring Changes in Clients’ Lives Jeff Toohig Deputy...
Beirut - May 2009
The Human Impact: Measuring Changes in Clients’ Lives
Jeff ToohigDeputy Director, PPI Deployment
Sanabel 6th Annual Conference
Grameen Foundation on Behalf of Grameen Jameel

1. Social Performance Management
2. What’s the Progress out of Poverty
Index?
3. What does PPI Data look like?
4. How can PPI data be used?
2

Social Performance Management
3
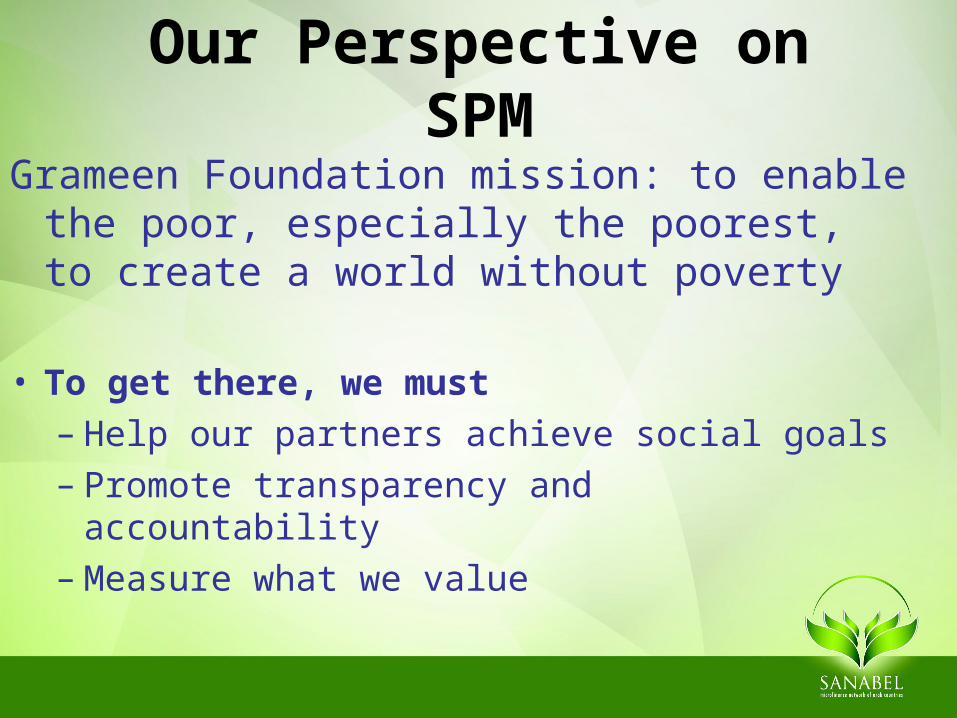
Our Perspective on SPMGrameen Foundation mission: to enable
the poor, especially the poorest, to create a world without poverty
• To get there, we must– Help our partners achieve social goals – Promote transparency and accountability– Measure what we value

Progress Out of Poverty Index™ (PPI)
An objective client poverty assessment and targeting tool, which:– Provides social performance data – Enables MFIs to manage social performance
An inexpensive and easy to collect scorecard– Derived from representative national household
income and expenditure surveys – Comprised of simple, non-financial indicators
5

PPI within SPM Context• By tracking poverty levels against other client data,
make key decisions about mission and how to carry it out
• Managing social performance is based on – 1) setting clear social goals and objectives– 2) collecting information to monitor progress
towards these objectives– 3) using information to improve operational and
strategic decision-making.
• Part of a social performance management system that helps advance an the mission.
6

7
Objectives of PPI Use
• Understand poverty levels of clients…
• …And change in those levels• Measure outreach• Use poverty level data to improve
products and services

What does the PPI look like?
8
Indicator Values Points How many people in the family are aged 0 to 17? ≥5 3 or 4 1 or 2 Zero 0 7 16 27
Does the family own a gas stove or gas range? No Yes 0 13 How many television sets does the family own? Zero 1 ≥2 0 9 18 What are the house's outer walls made of? Light (cogon, nipa, or sawali, bamboo,
anahaw) Strong (iron, aluminum, tile, concrete, brick,
stone, wood, asbestos) 0 4 How many radios does the family own? Zero 1 ≥2 0 3 10 Does the family own a sala set? No Yes 0 9 What is the house's roof made of? Light (Salvaged, makeshift, cogon,
nipa, or anahaw) Strong (Galvanized iron, aluminum tile,
concrete, brick, stone, or asbestos) 0 2 What kind of toilet facility does the family have? None, open pit, closed pit,
or other Water sealed
0 3 Do all children in the family of ages 6 to 11 go to school? No Yes No children ages 6-11 0 4 6 Do any family members have salaried employment? No Yes 0 6
Source: Calculations based on the 2002 APIS. Total:
SAMPLE

PPI in Action
9

Indicator Possible response Points Total
1. How many people aged 0 to 17 are in the household?
Five or more 0
Four 4Three 8Two 13One 20None 27
2. What is the household's principal occupation?
A. Labourers (agricultural, plantation, other farm), hunters, tobacco preparers and tobacco product makers, and other labourers
0
B. Others 8
C. Professionals, technicians, clerks, administrators, managers, executives, directors, supervisors, and teachers
14
PPI Fundamentals: Basic use
10
Client Response
8
0
Indicators Points

Indicator Possible response Points Total
1. How many people aged 0 to 17 are in the household?
Five or more 0
Four 4Three 8Two 13One 20None 27
2. What is the household's principal occupation?
A. Labourers (agricultural, plantation, other farm), hunters, tobacco preparers and tobacco product makers, and other labourers
0
B. Others 8
C. Professionals, technicians, clerks, administrators, managers, executives, directors, supervisors, and teachers
14
3. Is the residence all pucca (burnt bricks, stone, cement, concrete, jackboard/cement-plastered reeds, timber, tiles, galvanised tin or asbestos cement sheets)?
A. No 0
B. Yes 4
4. What is the household's primary source of energy for cooking?A. Firewood and chips, charcoal, or none 0
B. Others 5
C. LPG 17
5. Does the household own a television?A. No 0
B. Yes 6
6. Does the household own a bicycle, scooter, or motor cycle?A. No 0
B. Yes 5
7. Does the household own a almirah/dressing table?A. No 0
B. Yes 3
8. Does the household own a sewing machine?A. No 0
B. Yes 6
9. How many pressure cookers or pressure pans does the household own?
A. None 0
B. One 5C. Two or more 9
10. How many electric fans does the household own?A. None 0
B. One 5C. Two or more 9
Total:
PPI Fundamentals: PPI score
8
0
4
5
6
0
3
0
0
531

PPI Fundamentals: Poverty likelihood
12
PPI score of 31
Poverty Likelihood
The client interviewed has a 78% likelihood of falling below the national poverty line and a 22% likelihood of being above it.
PPI ScoreTotal Below
National Poverty Line
Total Above National Poverty
Line
0-4 99.3% 0.7%
5-9 92.5% 7.5%
10-14 91.9% 8.1%
15-19 93.4% 6.6%
20-24 77.6% 22.4%
25-29 76.8% 23.2%
30-34 77.8% 22.2%
35-39 48.6% 51.4%
40-44 48.3% 51.7%
45-49 33.6% 66.4%
50-54 34.4% 65.6%
55-59 22.6% 77.4%
60-64 10.1% 89.9%
65-69 10.1% 89.9%
70-74 6.9% 93.1%
75-79 3.8% 96.2%
80-84 2.1% 97.9%
85-89 0.0% 100.0%
90-94 0.0% 100.0%
95-100 0.0% 100.0%
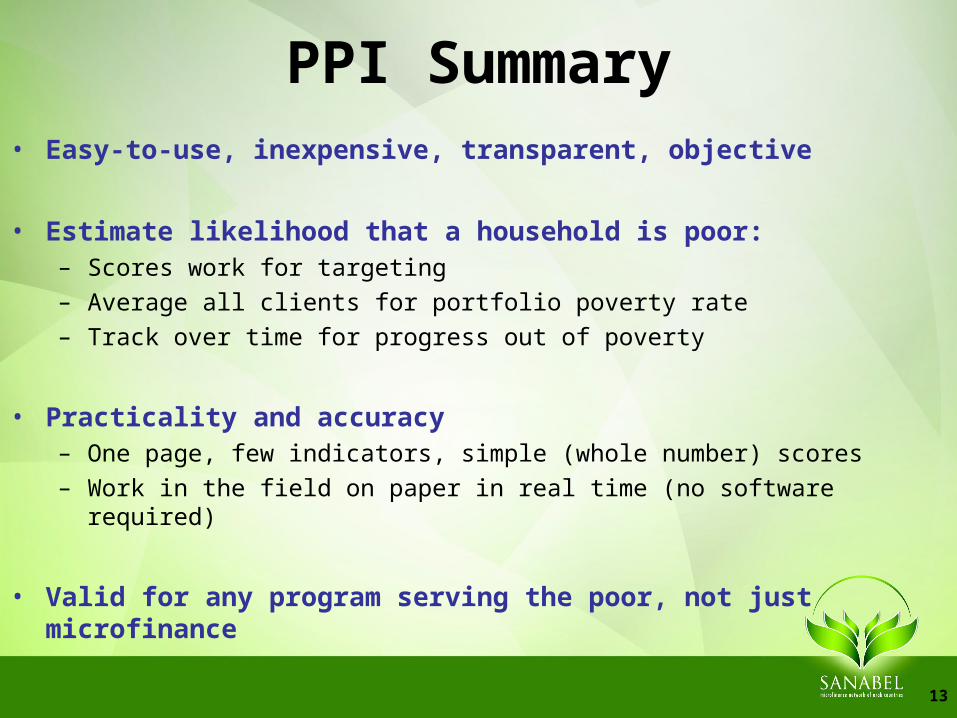
PPI Summary• Easy-to-use, inexpensive, transparent, objective
• Estimate likelihood that a household is poor:– Scores work for targeting– Average all clients for portfolio poverty rate– Track over time for progress out of poverty
• Practicality and accuracy – One page, few indicators, simple (whole number) scores– Work in the field on paper in real time (no software required)
• Valid for any program serving the poor, not just microfinance
13
How are PPI data used?
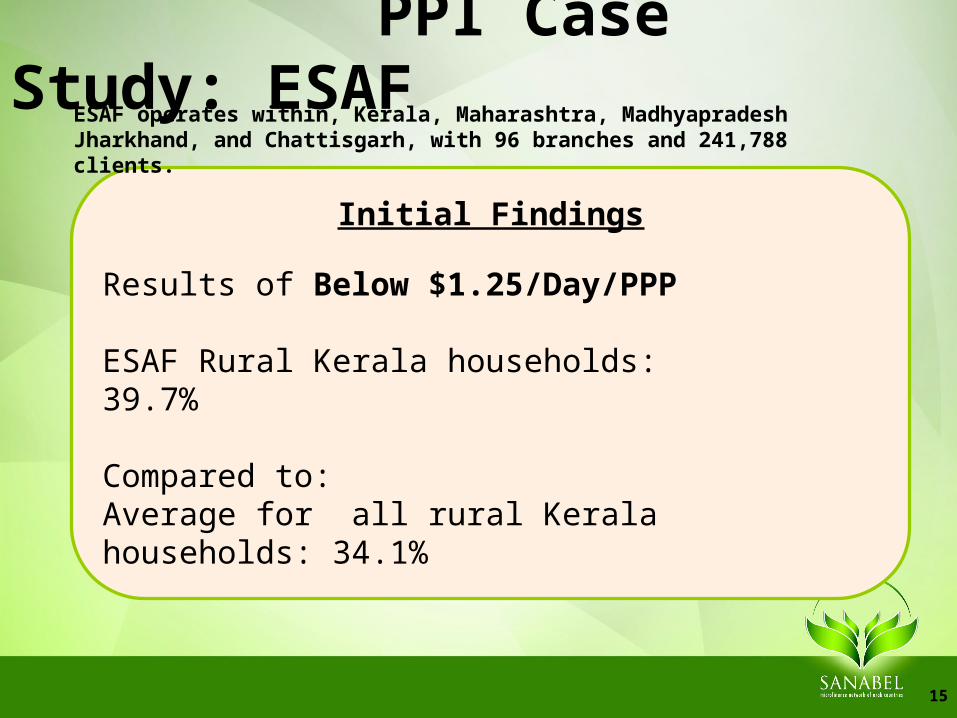
PPI Case Study: ESAF
15
Initial Findings
Results of Below $1.25/Day/PPP
ESAF Rural Kerala households: 39.7%
Compared to:Average for all rural Kerala households: 34.1%
ESAF operates within, Kerala, Maharashtra, Madhyapradesh Jharkhand, and Chattisgarh, with 96 branches and 241,788 clients.
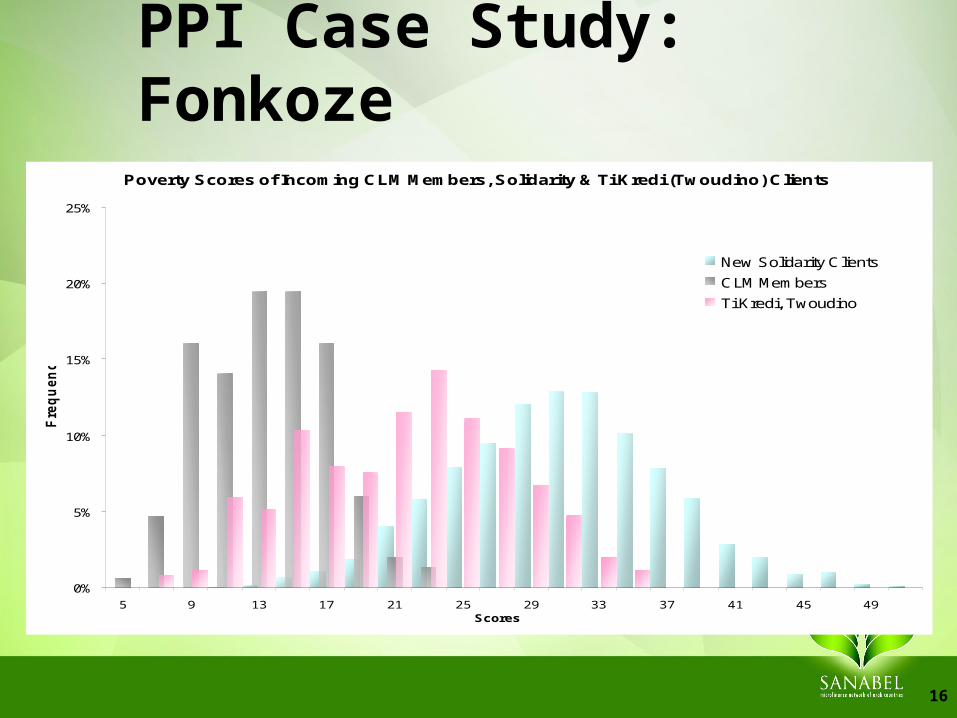
PPI Case Study: Fonkoze
16
Poverty Scores of Incoming CLM Members, Solidarity & Ti Kredi (Twoudino) Clients
0%
5%
10%
15%
20%
25%
5 9 13 17 21 25 29 33 37 41 45 49Scores
Fre
qu
en
cy
New Solidarity Clients
CLM Members
Ti Kredi, Twoudino

Rural Vs UrbanEntering Clients
Urban/Rural Sample Below National Below $1/Day/PPP
Below $2/Day/PPP
Rural 316 30% 45% 92%
Urban 100 12% 17% 75%
Grand Total 416 26% 38% 88%
State Average (Rural) 20% 25% 85%
State Average (Urban) 20% 16% 57%

Age and PovertyEntering Clients
Age Range NumBelow
$1/Day/PPPBelow
$2/Day/PPP
18<Age<24 63 42% 89%
25<Age<34 212 42% 90%
35<Age<44 106 33% 85%
Age > 45 35 27% 81%
Grand Total 416 38% 88%

PPI Case Study: NWTF• NWTF in the Philippines
– PPI collected in all branches, every client– Collects additional indicators to refines outreach
and products and services– Compares data by branch to understand what
products and services are most effective
• Outcomes– Changed targets to admit 90% below poverty line
new clients– Adjusted loan size, loan cycle period and possible
pre-payment options
19

Data Use and Future Opportunities– Link Social and Financial performance assessment
– Demonstrate ‘blended’ results to donors and investors
– Market to Social Investors
– Disseminate results at all internal levels
– Disseminate results to the industry
– Potential staff incentives input
20
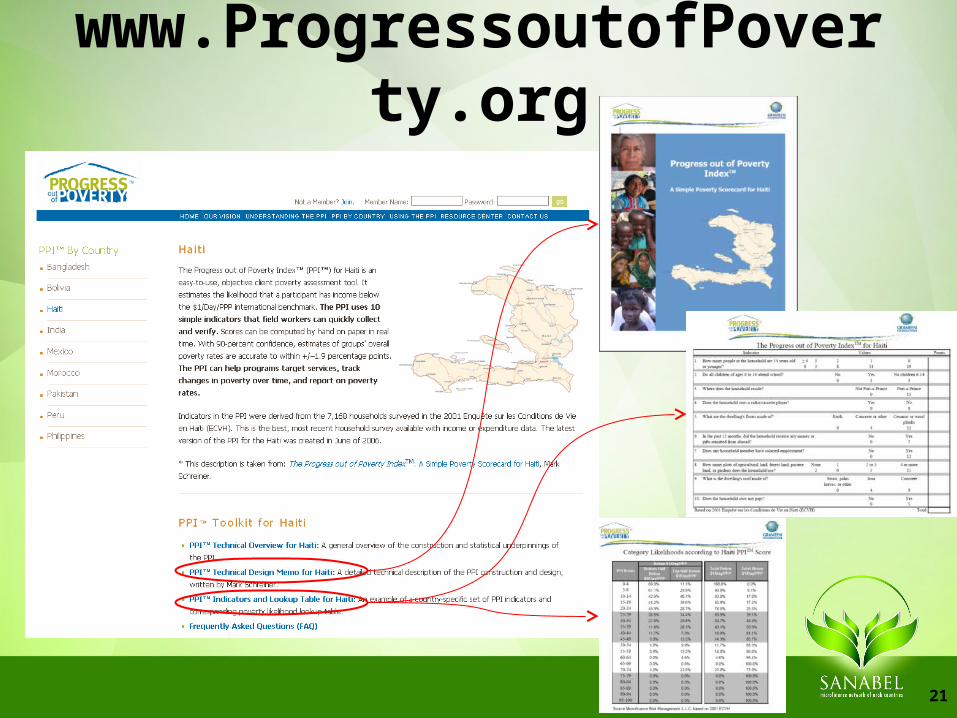
www.ProgressoutofPoverty.org
21
Progress Out of Poverty Index™