Behold: Einthoven's Triangle! Each of the 6 frontal plane leads has a negative and positive...
60
-
Upload
rosanna-morton -
Category
Documents
-
view
214 -
download
1
Transcript of Behold: Einthoven's Triangle! Each of the 6 frontal plane leads has a negative and positive...


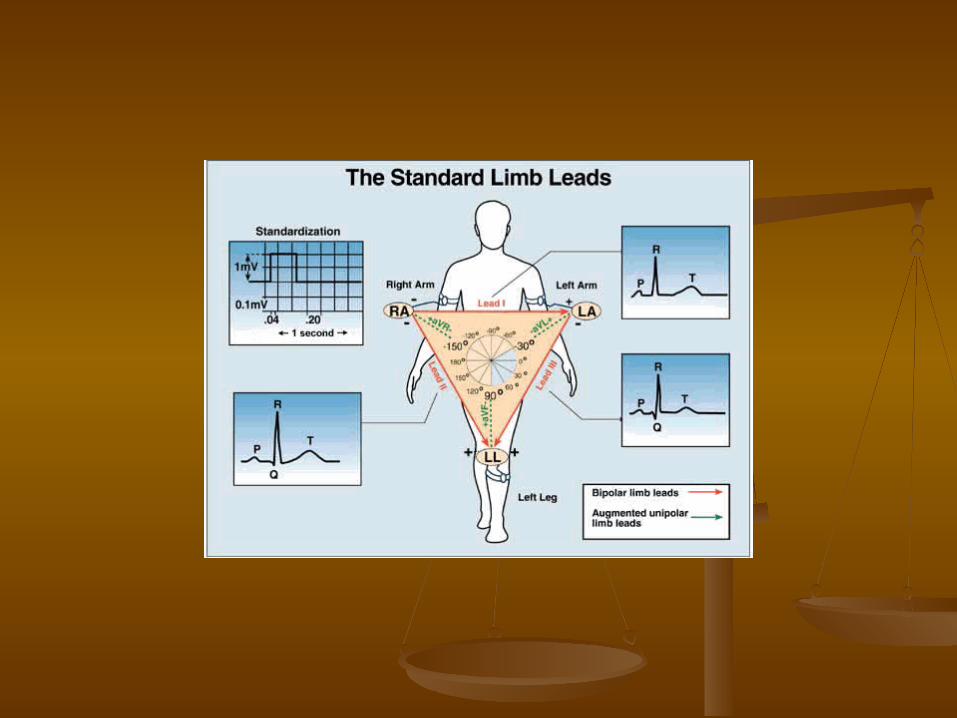
Behold: Einthoven's Triangle! Each of the 6 frontal plane leads has a negative and positive orientation (as indicated by the '+' and '-' signs). It is important to recognize that Lead I (and to a lesser extent Leads aVR and aVL) are right Ûleft in orientation.
Also, Lead aVF (and to a lesser extent Leads II and III) are superior Ûinferior in orientation. The diagram below further
illustrates the frontal plane hookup.

LOCATION OF CHEST ELECTRODES IN 4TH AND 5TH INTERCOSTAL SPACES:
V1: right 4th intercostal spaceV2: left 4th intercostal spaceV3: halfway between V2 and V4V4: left 5th intercostal space, mid-clavicular lineV5: horizontal to V4, anterior axillary lineV6: horizontal to V5, mid-axillary line


1. ECG Waves and Intervals:What do they mean?
P wave: the sequential activation (depolarization) of the right and left atria
QRS complex: right and left ventricular depolarization (normally the ventricles are activated simultaneously)
ST-T wave: ventricular repolarization
U wave: origin for this wave is not clear - but probably represents "afterdepolarizations" in the ventricles
PR interval: time interval from onset of atrial depolarization (P wave) to onset of ventricular depolarization (QRS complex)
QRS duration: duration of ventricular muscle depolarization
QT interval: duration of ventricular depolarization and repolarization
RR interval: duration of ventricular cardiac cycle (an indicator of ventricular rate)
PP interval: duration of atrial cycle (an indicator of atrial rate)

Orientation of the 12 Lead ECG

It is important to remember that the 12-lead ECG provides spatial information about the heart's electrical activity in 3 approximately orthogonal directions:
Right Left
Superior Inferior
Anterior Posterior
Each of the 12 leads represents a particular orientation in space, as indicated below (RA = right arm; LA = left arm, LF = left foot):

Bipolar limb leads (frontal plane):
Lead I: RA (-) to LA (+) (Right Left, or lateral)
Lead II: RA (-) to LF (+) (Superior Inferior)
Lead III: LA (-) to LF (+) (Superior Inferior)

Augmented unipolar limb leads (frontal plane): Lead aVR: RA (+) to [LA & LF] (-) (Rightward)
Lead aVL: LA (+) to [RA & LF] (-) (Leftward)
Lead aVF: LF (+) to [RA & LA] (-) (Inferior)

Unipolar (+) chest leads (horizontal plane):
Leads V1, V2, V3: (Posterior Anterior)
Leads V4, V5, V6:(Right Left, or lateral)

Measurements (usually made in Measurements (usually made in frontal plane leads): frontal plane leads):
Heart rate (state atrial and ventricular, if different)
PR interval (from beginning of P to beginning of QRS)
QRS duration (width of most representative QRS)
QT interval (from beginning of QRS to end of T)
QRS axis in frontal plane (go to: "How To Determine Axis")

The frontal plane QRS axis represents only the average direction of ventricular activation in the frontal plane. As such this measure can inform the ECG reader of changes in the sequence of ventricular activation (e.g., left anterior fascicular block), or it can be an indicator of myocardial damage (e.g., inferior myocardial infarction).

In the diagram below the normal range is identified (-30o to +90o). Left axis deviation (i.e., superior and leftward) is defined from -30o to -90o, and right axis deviation (i.e., inferior and rightward) is defined from +90o to +150o.
QRS Axis Determination QRS Axis Determination First find the First find the isoelectric isoelectric lead if there is one; i.e., the lead with equal lead if there is one; i.e., the lead with equal
forces in the positive and negative direction. Often this is the lead forces in the positive and negative direction. Often this is the lead with the smallest QRS. with the smallest QRS.
The QRS axis is The QRS axis is perpendicularperpendicular to that lead's orientation (see to that lead's orientation (see above diagram). above diagram).
Since there are two perpendiculars to each isoelectric lead, chose Since there are two perpendiculars to each isoelectric lead, chose the perpendicular that best fits the direction of the other ECG the perpendicular that best fits the direction of the other ECG leads. leads.
If there is no isoelectric lead, there are usually If there is no isoelectric lead, there are usually twotwo leads that are leads that are nearly isoelectric, and these are always 30nearly isoelectric, and these are always 30oo apart. Find the apart. Find the perpendiculars for each lead and chose an approximate QRS axis perpendiculars for each lead and chose an approximate QRS axis within the 30within the 30oo range. range.
Occasionally each of the 6 frontal plane leads is small and/or Occasionally each of the 6 frontal plane leads is small and/or isoelectric. The axis cannot be determined and is called isoelectric. The axis cannot be determined and is called indeterminateindeterminate. This is a normal variant. . This is a normal variant.

Examples of QRS Axis Examples of QRS Axis
Axis in the Axis in the normal normal rangerange
Lead aVF is the Lead aVF is the isoelectric lead isoelectric lead
The two The two perpendiculars to aVF perpendiculars to aVF are 0 o and 180 o. are 0 o and 180 o.
Lead I is positive (i.e., Lead I is positive (i.e., oriented to the left). oriented to the left).
Therefore, the axis Therefore, the axis has to be 0 o. has to be 0 o.

Axis in the Axis in the left axis deviationleft axis deviation (LAD) (LAD) range range
Lead aVR is the smallest Lead aVR is the smallest and isoelectric lead and isoelectric lead
The two perpendiculars The two perpendiculars are -60 o and +120 o are -60 o and +120 o
Leads II and III are mostly Leads II and III are mostly negative (i.e., moving negative (i.e., moving away from the + left leg) away from the + left leg)
The axis, therefore, is -60 The axis, therefore, is -60 o o

Axis in the Axis in the right axis deviationright axis deviation (RAD) range (RAD) range
Lead aVR is closest to Lead aVR is closest to being isoelectric (slightly being isoelectric (slightly more positive than more positive than negative) negative)
The two perpendiculars The two perpendiculars are -60 o and +120 o are -60 o and +120 o
Lead I is mostly negative; Lead I is mostly negative; lead III is mostly positive. lead III is mostly positive.
Therefore the axis is close Therefore the axis is close to +120 o. Because aVR is to +120 o. Because aVR is slightly more positive, the slightly more positive, the axis is slightly beyond axis is slightly beyond +120 o (i.e., closer to the +120 o (i.e., closer to the positive right arm for aVR). positive right arm for aVR).

Frontal Plane QRS Axis Frontal Plane QRS Axis
Normal: -30 degrees to +90 degreesNormal: -30 degrees to +90 degrees Abnormalities in the QRS Axis Abnormalities in the QRS Axis
1.1. Left Axis Deviation (LAD): Left Axis Deviation (LAD): >> -30 -30oo (i.e., lead II is mostly 'negative') (i.e., lead II is mostly 'negative')
2.2. Right Axis Deviation (RAD): Right Axis Deviation (RAD): >> +90 +90oo (i.e., lead I is mostly 'negative') (i.e., lead I is mostly 'negative')
3.3. Bizarre QRS axis: +150Bizarre QRS axis: +150oo to -90 to -90oo (i.e., (i.e., lead I lead I andand lead II are both negative) lead II are both negative)

Left Axis Deviation (LAD): Left Axis Deviation (LAD): >> -30 -30oo (i.e., lead II is mostly 'negative') (i.e., lead II is mostly 'negative')
Left Anterior Fascicular Block (LAFB): rS complex Left Anterior Fascicular Block (LAFB): rS complex in leads II, III, aVF, small q in leads I and/or aVL, in leads II, III, aVF, small q in leads I and/or aVL, and axis -45and axis -45oo to -90 to -90oo
Some cases of inferior MI with Qr complex in lead Some cases of inferior MI with Qr complex in lead II (making lead II 'negative')II (making lead II 'negative')
Inferior MI + LAFB in same patient (QS or qrS Inferior MI + LAFB in same patient (QS or qrS complex in lead II)complex in lead II)
Some cases of LVHSome cases of LVH Some cases of LBBBSome cases of LBBB Ostium primum ASD and other endocardial Ostium primum ASD and other endocardial
cushion defects cushion defects Some cases of WPW syndrome (large negative Some cases of WPW syndrome (large negative
deltadelta wave in lead II) wave in lead II)
Right Axis Deviation (RAD): Right Axis Deviation (RAD): >> +90 +90oo (i.e., lead I is mostly 'negative') (i.e., lead I is mostly 'negative')
Left Posterior Fascicular Block (LPFB): rS complex Left Posterior Fascicular Block (LPFB): rS complex in lead I, qR in leads II, III, aVF in lead I, qR in leads II, III, aVF (however, must (however, must first exclude, on clinical basis, causes of right first exclude, on clinical basis, causes of right heart overload; these will also give same ECG heart overload; these will also give same ECG picture of LPFBpicture of LPFB
Many causes of right heart overload and Many causes of right heart overload and pulmonary hypertensionpulmonary hypertension
High lateral wall MI with Qr or QS complex in High lateral wall MI with Qr or QS complex in leads I and aVLleads I and aVL
Some cases of RBBB Some cases of RBBB Some cases of WPW syndromeSome cases of WPW syndrome Children, teenagers, and some young adults Children, teenagers, and some young adults

Bizarre QRS axis: +150Bizarre QRS axis: +150oo to -90 to -90oo (i.e., (i.e., lead I lead I andand lead II are both negative) lead II are both negative)
Consider limb lead error (usually Consider limb lead error (usually right and left arm reversal)right and left arm reversal)
DextrocardiaDextrocardia Some cases of complex congenital Some cases of complex congenital
heart disease (e.g., transposition)heart disease (e.g., transposition) Some cases of ventricular Some cases of ventricular
tachycardia tachycardia

Rhythm Analysis Rhythm Analysis
State basic rhythm (e.g., "normal State basic rhythm (e.g., "normal sinus rhythm", "atrial fibrillation", sinus rhythm", "atrial fibrillation", etc.)etc.)
Identify additional rhythm events if Identify additional rhythm events if present (e.g., "PVC's", "PAC's", etc)present (e.g., "PVC's", "PAC's", etc)
Consider all rhythm events from Consider all rhythm events from atria, AV junction, and ventricles atria, AV junction, and ventricles

Conduction Analysis Conduction Analysis
"Normal" conduction implies normal "Normal" conduction implies normal sino-atrial (SA), atrio-ventricular (AV), sino-atrial (SA), atrio-ventricular (AV), and intraventricular (IV) conduction.and intraventricular (IV) conduction.
The following conduction abnormalities are The following conduction abnormalities are
to be identified if presentto be identified if present SA SA blockblock:: 2nd degree (type I vs. type 2nd degree (type I vs. type
II)II) AV AV blockblock ( (lessonlesson VI): VI): 1st, 2nd (type I 1st, 2nd (type I
vs. type II), and 3rd degreevs. type II), and 3rd degree IV IV blocksblocks ( (lessonlesson VI): VI): bundle branch, bundle branch,
fascicular, and nonspecific blocksfascicular, and nonspecific blocks Exit blocks: blocks just distal to ectopic Exit blocks: blocks just distal to ectopic
pacemaker sitepacemaker site

Waveform Description Waveform Description Carefully analyze the 12-lead ECG for abnormalities Carefully analyze the 12-lead ECG for abnormalities
in each of the waveforms in the order in which they in each of the waveforms in the order in which they appear: P-waves, QRS complexes, ST segments, T appear: P-waves, QRS complexes, ST segments, T waves, and... Don't forget the U waveswaves, and... Don't forget the U waves
P P waveswaves are they too wide, too tall, look funny are they too wide, too tall, look funny (i.e., are they ectopic), etc(i.e., are they ectopic), etc
QRS complexes: look for QRS complexes: look for pathologicpathologic Q Q waveswaves ( (abnormalabnormal voltagevoltage, etc, etc
ST ST segmentssegments look for abnormal ST elevation and/or look for abnormal ST elevation and/or depressiondepression
T T waveswaves look for abnormally inverted T waveslook for abnormally inverted T waves U U waveswaves ( (lessonlesson XII) XII): look for prominent or : look for prominent or
inverted U waves inverted U waves

ECG Interpretation ECG Interpretation
This is the conclusion of the above This is the conclusion of the above analyses. Interpret the ECG as analyses. Interpret the ECG as "Normal", or "Abnormal". "Normal", or "Abnormal". Occasionally the term "borderline" is Occasionally the term "borderline" is used if unsure about the significance used if unsure about the significance of certain findings. List all of certain findings. List all abnormalities. Examples of abnormalities. Examples of "abnormal" statements are "abnormal" statements are

Inferior MI, probably acute Inferior MI, probably acute Old anteroseptal MIOld anteroseptal MI Left anterior fascicular block (LAFB) Left anterior fascicular block (LAFB) Left ventricular hypertrophy (LVH) Left ventricular hypertrophy (LVH) Nonspecific ST-T wave abnormalities Nonspecific ST-T wave abnormalities Any rhythm abnormalities Any rhythm abnormalities

Left Anterior Fascicular Block (LAFB)-KH
HR=72bpm; PR=0.16s; QRS=0.09s; QT=0.36s; QRS axis = -70o (left axis deviation)
Normal sinus rhythm; normal SA and AV conduction; rS in leads II, III, aVF
Interpretation: Abnormal ECG: 1)Left anterior fascicular block

Comparison with previous ecg Comparison with previous ecg
If there is a previous ECG in the If there is a previous ECG in the patient's file, the current ECG should patient's file, the current ECG should be compared with it to see if any be compared with it to see if any significant changes have occurred. significant changes have occurred. These changes may have important These changes may have important implications for clinical management implications for clinical management decisions. decisions.

Measurements Measurements
Heart Rate: 60 - 90 bpm Heart Rate: 60 - 90 bpm

How to calculate the heart rate on How to calculate the heart rate on ECG paper ECG paper
Because ECG paper moves at a Because ECG paper moves at a standardized 25mm/sec, the vertical standardized 25mm/sec, the vertical lines can be used to measure time. lines can be used to measure time. There is a 0.20 sec between 2 of the There is a 0.20 sec between 2 of the large lines. Therefore, if you count the large lines. Therefore, if you count the number of heart beats (QRS number of heart beats (QRS complexes) in between 30 large boxes complexes) in between 30 large boxes (6 seconds) and multiply by 10, you (6 seconds) and multiply by 10, you have beats per minute. Conveniently, have beats per minute. Conveniently, ECG paper usually has special ECG paper usually has special markings every 3 seconds so you don't markings every 3 seconds so you don't have to count 30 large boxes. have to count 30 large boxes.
There is, however, an easier and There is, however, an easier and quicker way to estimate the heart rate. quicker way to estimate the heart rate. As seen in the diagram below, when As seen in the diagram below, when QRS complexes are 1 box apart the QRS complexes are 1 box apart the rate is 300 bpm. 2 boxes apart...150 rate is 300 bpm. 2 boxes apart...150 bpm, etc. So if you memorize these bpm, etc. So if you memorize these simple numbers you can estimate the simple numbers you can estimate the heart rate at a glance heart rate at a glance

PR Interval: 0.12 - 0.20 sec PR Interval: 0.12 - 0.20 sec QRS Duration: 0.06 - 0.10 sec QRS Duration: 0.06 - 0.10 sec QT Interval (QTQT Interval (QTcc << 0.40 sec) 0.40 sec) 1.1. Bazett's FormulaBazett's Formula: QT: QTcc = (QT)/SqRoot RR (in = (QT)/SqRoot RR (in
seconds)seconds)2.2. Poor Man's GuidePoor Man's Guide to upper limits of QT: For HR to upper limits of QT: For HR
= 70 bpm, QT= 70 bpm, QT<<0.40 sec; for every 10 bpm 0.40 sec; for every 10 bpm increase above 70 subtract 0.02 sec, and for increase above 70 subtract 0.02 sec, and for every 10 bpm decrease below 70 add 0.02 sec. every 10 bpm decrease below 70 add 0.02 sec. For example For example
QT QT << 0.38 @ 80 bpm 0.38 @ 80 bpm QT QT << 0.42 @ 60 bpm 0.42 @ 60 bpm Frontal Plane QRS Axis: +90 Frontal Plane QRS Axis: +90 oo to -30 to -30 oo (in the (in the
adult) adult)

Rhythm Rhythm
Normal sinus rhythmNormal sinus rhythm
The P waves in leads I and II must be The P waves in leads I and II must be upright (positive) if the rhythm is upright (positive) if the rhythm is coming from the sinus node. coming from the sinus node.

Conduction Conduction
Normal Sino-atrial (SA), Atrio-Normal Sino-atrial (SA), Atrio-ventricular (AV), and Intraventricular ventricular (AV), and Intraventricular (IV) conduction(IV) conduction
Both the PR interval and QRS Both the PR interval and QRS duration should be within the limits duration should be within the limits specified above. specified above.

Waveform Description Waveform Description

P WaveP Wave
It is important to remember that the P It is important to remember that the P wave represents the wave represents the sequentialsequential activation activation of the right and left atria, and it is common of the right and left atria, and it is common to see notched or biphasic P waves of right to see notched or biphasic P waves of right and left atrial activationand left atrial activation
P duration < 0.12 sec P duration < 0.12 sec P amplitude < 2.5 mm P amplitude < 2.5 mm Frontal plane P wave axis: 0Frontal plane P wave axis: 0oo to +75 to +75oo May see notched P waves in frontal plane May see notched P waves in frontal plane

QRS ComplexQRS Complex The QRS represents the The QRS represents the simultaneoussimultaneous activation activation
of the right and left ventricles, although most of of the right and left ventricles, although most of the QRS waveform is derived from the larger left the QRS waveform is derived from the larger left ventricular musculature. QRS duration ventricular musculature. QRS duration << 0.10 0.10 sec sec
QRS amplitude is quite variable from lead to QRS amplitude is quite variable from lead to lead and from person to person. Two lead and from person to person. Two determinates of QRS voltages are: Size of the determinates of QRS voltages are: Size of the ventricular chambers (i.e., the larger the ventricular chambers (i.e., the larger the chamber, the larger the voltage) chamber, the larger the voltage)
Proximity of chest electrodes to ventricular Proximity of chest electrodes to ventricular chamber (the closer, the larger the voltage) chamber (the closer, the larger the voltage)

Frontal plane leads Frontal plane leads The normal QRS axis range (+90 The normal QRS axis range (+90 oo to -30 to -30
oo ); this implies that the QRS be mostly ); this implies that the QRS be mostly positive (upright) in leads II and I.positive (upright) in leads II and I.
Normal q-waves reflect normal septal Normal q-waves reflect normal septal activation (beginning on the LV septum); activation (beginning on the LV septum); they are narrow (<0.04s duration) and small they are narrow (<0.04s duration) and small (<25% the amplitude of the R wave). They (<25% the amplitude of the R wave). They are often seen in leads I and aVL when the are often seen in leads I and aVL when the QRS axis is to the QRS axis is to the leftleft of +60 of +60oo, and in leads , and in leads II, III, aVF when the QRS axis is to the II, III, aVF when the QRS axis is to the rightright of +60of +60oo. Septal q waves should not be . Septal q waves should not be confused with the pathologic Q waves of confused with the pathologic Q waves of myocardial infarction myocardial infarction

Precordial leads Precordial leads Small r-waves begin in V1 or V2 and progress in size Small r-waves begin in V1 or V2 and progress in size
to V5. The R-V6 is usually smaller than R-V5.to V5. The R-V6 is usually smaller than R-V5.
In reverse, the s-waves begin in V6 or V5 and In reverse, the s-waves begin in V6 or V5 and progress in size to V2. S-V1 is usually smaller than S-progress in size to V2. S-V1 is usually smaller than S-V2.V2.
The usual transition from S>R in the right precordial The usual transition from S>R in the right precordial leads to R>S in the left precordial leads is V3 or V4.leads to R>S in the left precordial leads is V3 or V4.
Small "septal" q-waves may be seen in leads V5 Small "septal" q-waves may be seen in leads V5 and V6. and V6.
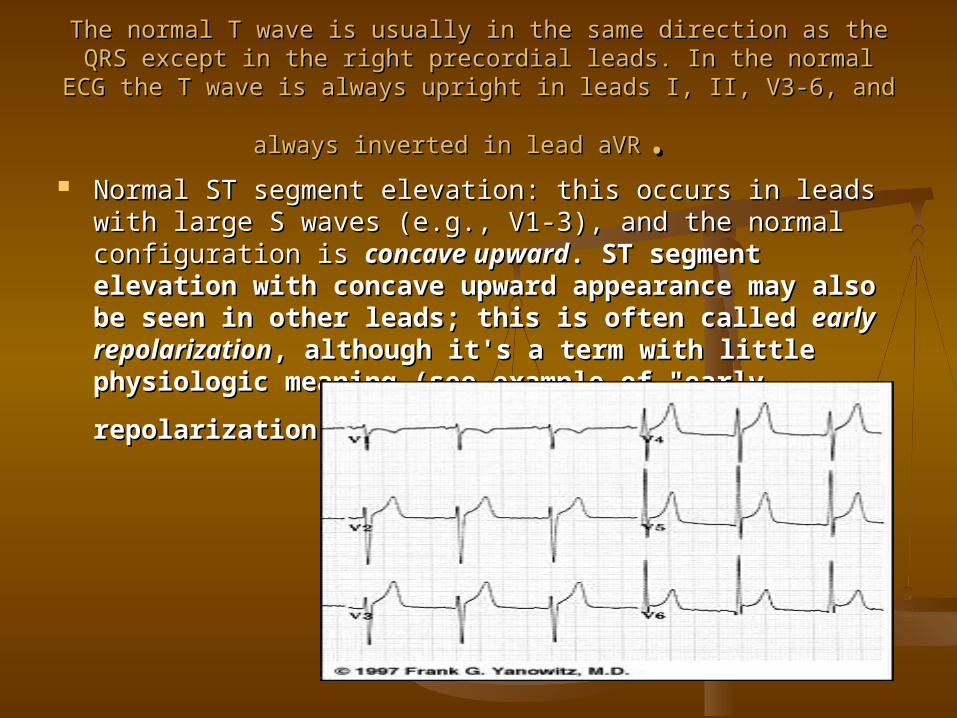
The normal T wave is usually in the same direction as the QRS except in the The normal T wave is usually in the same direction as the QRS except in the right precordial leads. In the normal ECG the T wave is always upright in leads right precordial leads. In the normal ECG the T wave is always upright in leads
I, II, V3-6, and always inverted in lead aVRI, II, V3-6, and always inverted in lead aVR. . Normal ST segment elevation: this occurs in leads with Normal ST segment elevation: this occurs in leads with
large S waves (e.g., V1-3), and the normal configuration is large S waves (e.g., V1-3), and the normal configuration is concave upwardconcave upward. ST segment elevation with concave . ST segment elevation with concave upward appearance may also be seen in other leads; upward appearance may also be seen in other leads; this is often called this is often called early repolarizationearly repolarization, although it's , although it's a term with little physiologic meaning (see example a term with little physiologic meaning (see example
of "early repolarization" in leads V4-6):of "early repolarization" in leads V4-6):
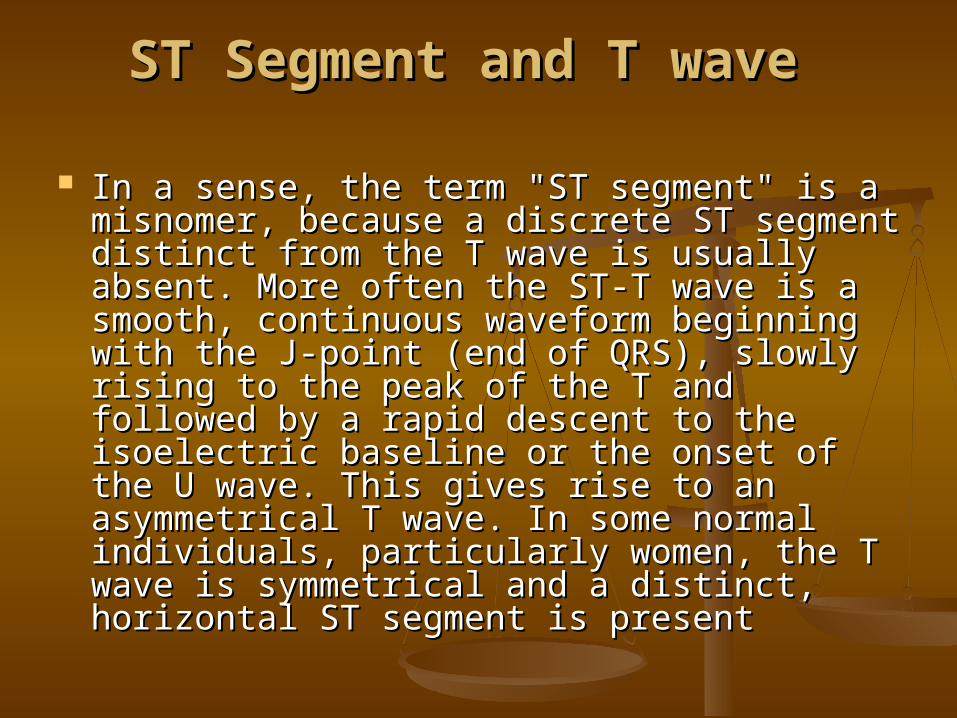
ST Segment and T waveST Segment and T wave
In a sense, the term "ST segment" is a In a sense, the term "ST segment" is a misnomer, because a discrete ST segment misnomer, because a discrete ST segment distinct from the T wave is usually absent. distinct from the T wave is usually absent. More often the ST-T wave is a smooth, More often the ST-T wave is a smooth, continuous waveform beginning with the J-continuous waveform beginning with the J-point (end of QRS), slowly rising to the point (end of QRS), slowly rising to the peak of the T and followed by a rapid peak of the T and followed by a rapid descent to the isoelectric baseline or the descent to the isoelectric baseline or the onset of the U wave. This gives rise to an onset of the U wave. This gives rise to an asymmetrical T wave. In some normal asymmetrical T wave. In some normal individuals, particularly women, the T individuals, particularly women, the T wave is symmetrical and a distinct, wave is symmetrical and a distinct, horizontal ST segment is presenthorizontal ST segment is present

Convex or straight upward Convex or straight upward ST segment elevation (e.g., leads II, III, ST segment elevation (e.g., leads II, III,
aVF) is abnormal and suggests transmural injury or infarctionaVF) is abnormal and suggests transmural injury or infarction

ST segment depression is always an abnormal ST segment depression is always an abnormal finding, although often nonspecific (see ECG finding, although often nonspecific (see ECG
below)below)
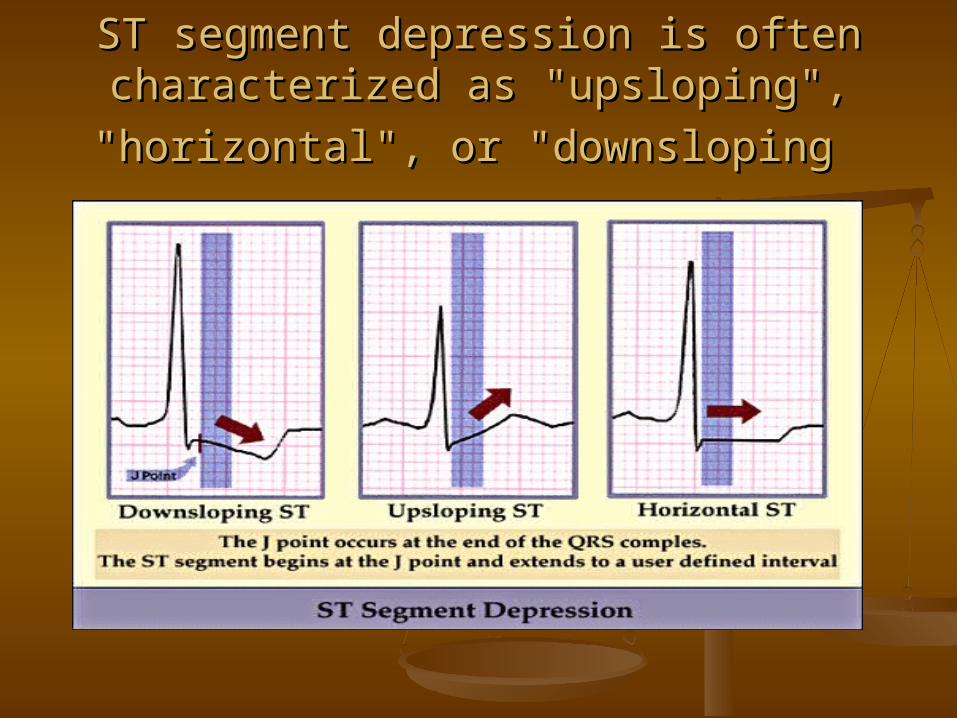
ST segment depression is often ST segment depression is often characterized as "upsloping", "horizontal", or characterized as "upsloping", "horizontal", or
"downsloping"downsloping

The normal U Wave: (the most The normal U Wave: (the most neglected of the ECG waveforms) neglected of the ECG waveforms)
U wave amplitude is usually < 1/3 T wave U wave amplitude is usually < 1/3 T wave amplitude in same lead amplitude in same lead
U wave direction is the same as T wave U wave direction is the same as T wave direction in that lead direction in that lead
U waves are more prominent at slow U waves are more prominent at slow heart rates and usually best seen in the heart rates and usually best seen in the right precordial leads. right precordial leads.
Origin of the U wave is thought to be Origin of the U wave is thought to be related to related to afterdepolarizations afterdepolarizations which which interrupt or follow repolarization interrupt or follow repolarization

Heart Rate Heart Rate
In normal sinus rhythm, a resting In normal sinus rhythm, a resting heart rate of below 60 bpm is called heart rate of below 60 bpm is called bradycardia and a rate of above 90 bradycardia and a rate of above 90 bpm is called tachycardia bpm is called tachycardia
PR Interval PR Interval measured from beginning of P to measured from beginning of P to
beginning of QRS in the frontal plane)beginning of QRS in the frontal plane) Normal: 0.12 - 0.20s Normal: 0.12 - 0.20s
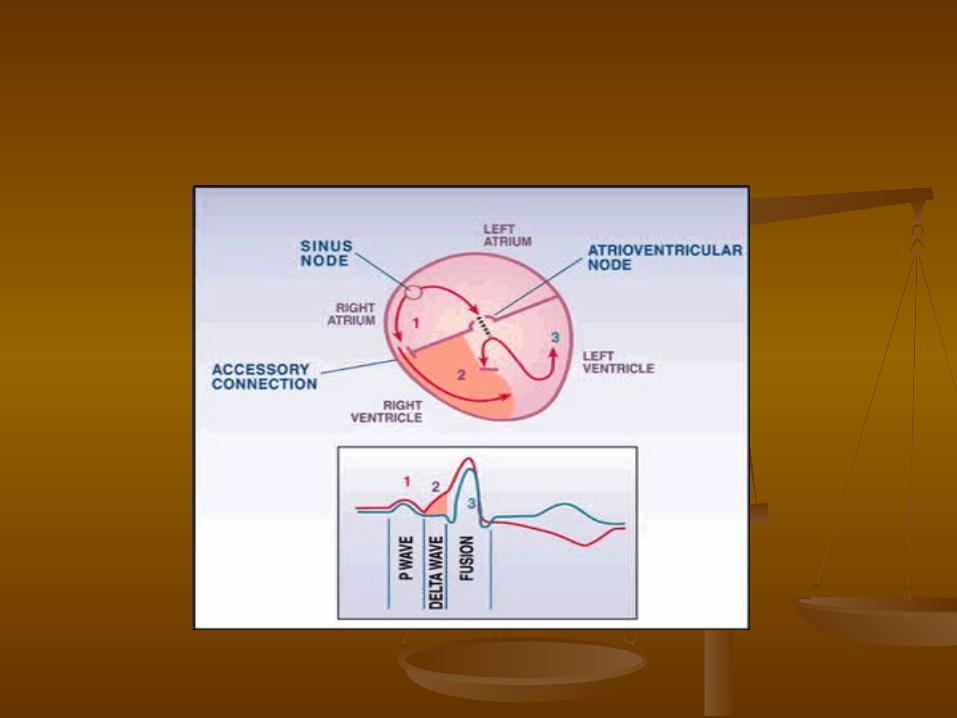
Short PR: < 0.12s Preexcitation Short PR: < 0.12s Preexcitation syndromes: WPW (Wolff-Parkinson-White) syndromes: WPW (Wolff-Parkinson-White) Syndrome: An accessory pathway (called Syndrome: An accessory pathway (called the "Kent" bundle) connects the right the "Kent" bundle) connects the right atrium to the right ventricle (see diagram atrium to the right ventricle (see diagram below) below) oror the left atrium to the left the left atrium to the left ventricle, and this permits early activation ventricle, and this permits early activation of the ventricles (of the ventricles (deltadelta wave) and a short wave) and a short PR intervalPR interval

LGL (Lown-Ganong-Levine): An AV LGL (Lown-Ganong-Levine): An AV nodal bypass track into the His nodal bypass track into the His bundle exists, and this permits early bundle exists, and this permits early activation of the ventricles without a activation of the ventricles without a deltadelta-wave because the ventricular -wave because the ventricular activation sequence is normal activation sequence is normal
AV Junctional Rhythms with AV Junctional Rhythms with retrograde atrial activation (inverted retrograde atrial activation (inverted P waves in II, III, aVF): Retrograde P P waves in II, III, aVF): Retrograde P waves may occur waves may occur beforebefore the QRS the QRS complex (usually with a short PR complex (usually with a short PR interval), interval), inin the QRS complex (i.e., the QRS complex (i.e., hidden from view), or hidden from view), or afterafter the QRS the QRS complex (i.e., in the ST segment). complex (i.e., in the ST segment).

Ectopic atrial rhythms originating Ectopic atrial rhythms originating near the AV node (the PR interval is near the AV node (the PR interval is short because atrial activation short because atrial activation originates close to the AV node; the P originates close to the AV node; the P wave morphology is different from wave morphology is different from the sinus P) the sinus P)

Normal variant Normal variant

Prolonged PR: >0.20sProlonged PR: >0.20s First degree AV block (PR interval usually constant) First degree AV block (PR interval usually constant) 1.1. Intra-atrial conduction delay (uncommon)Intra-atrial conduction delay (uncommon)2.2. Slowed conduction in AV node (most common site)Slowed conduction in AV node (most common site)3.3. Slowed conduction in His bundle (rare)Slowed conduction in His bundle (rare)4.4. Slowed conduction in bundle branch (when contralateral Slowed conduction in bundle branch (when contralateral
bundle is blocked)bundle is blocked) Second degree AV block (PR interval may be normal or Second degree AV block (PR interval may be normal or
prolonged; some P waves do not conduct)prolonged; some P waves do not conduct)1.1. Type I (Wenckebach): Increasing PR until nonconducted P Type I (Wenckebach): Increasing PR until nonconducted P
wave occurswave occurs2.2. Type II (Mobitz): Fixed PR intervals plus nonconducted P Type II (Mobitz): Fixed PR intervals plus nonconducted P
waveswaves
AV dissociation: Some PR's may appear prolonged, but AV dissociation: Some PR's may appear prolonged, but the P waves and QRS complexes are dissociated (i.e., not the P waves and QRS complexes are dissociated (i.e., not married, but strangers passing in the night married, but strangers passing in the night

QRS Duration QRS Duration
Normal: 0.06 - 0.10s Normal: 0.06 - 0.10s Prolonged QRS Duration (>0.10s) Prolonged QRS Duration (>0.10s)

QRS duration 0.10 - 0.12s QRS duration 0.10 - 0.12s
Incomplete Incomplete rightright or or leftleft bundle bundle branch blockbranch block
Nonspecific intraventricular Nonspecific intraventricular conduction delay (IVCD)conduction delay (IVCD)
Some cases of left Some cases of left anterioranterior or or posteriorposterior fascicular block fascicular block

QRS duration QRS duration >> 0.12s 0.12s
Complete RBBB or LBBB Complete RBBB or LBBB Nonspecific IVCDNonspecific IVCD Ectopic rhythms originating in the Ectopic rhythms originating in the
ventricles (e.g., ventricular ventricles (e.g., ventricular tachycardia, pacemaker rhythm) tachycardia, pacemaker rhythm)

QT Interval QT Interval measured from beginning of QRS to end of measured from beginning of QRS to end of
T wave in the frontal plane T wave in the frontal plane Normal: heart rate dependent (corrected Normal: heart rate dependent (corrected
QTQT = = QTQTcc = measured QT ¸ sq-root RR in = measured QT ¸ sq-root RR in seconds; upper limit for QTseconds; upper limit for QTcc = 0.44 sec) = 0.44 sec)
Long QT Syndrome - "LQTS" (based on Long QT Syndrome - "LQTS" (based on upper limits for heart rate; QTupper limits for heart rate; QTcc >> 0.47 sec 0.47 sec for males and for males and >> 0.48 sec in females is 0.48 sec in females is diagnostic for diagnostic for hereditaryhereditary LQTS in absence LQTS in absence of other causes of increased QT)of other causes of increased QT)

This abnormality may have important clinical implications This abnormality may have important clinical implications since it usually indicates a state of increased vulnerability since it usually indicates a state of increased vulnerability to malignant ventricular arrhythmias, syncope, and to malignant ventricular arrhythmias, syncope, and sudden death. The prototype arrhythmia of the sudden death. The prototype arrhythmia of the Long QT Long QT Interval Syndromes (LQTS)Interval Syndromes (LQTS) is is Torsade-de-pointesTorsade-de-pointes, a , a polymorphic ventricular tachycardia characterized by polymorphic ventricular tachycardia characterized by varying QRS morphology and amplitude around the varying QRS morphology and amplitude around the isoelectric baseline. Causes of isoelectric baseline. Causes of LQTSLQTS include the following include the following
1.1. Drugs (many antiarrhythmics, tricyclics, phenothiazines, Drugs (many antiarrhythmics, tricyclics, phenothiazines, and others)and others)
2.2. Electrolyte abnormalities ( KElectrolyte abnormalities ( K++, Ca, Ca++++, Mg, Mg++++))3.3. CNS disease (especially subarrachnoid hemorrhage, CNS disease (especially subarrachnoid hemorrhage,
stroke, trauma)stroke, trauma)4.4. Hereditary LQTS (e.g., Romano-Ward Syndrome)Hereditary LQTS (e.g., Romano-Ward Syndrome)5.5. Coronary Heart Disease (some post-MI patients) Coronary Heart Disease (some post-MI patients)