Fluorogenic and Chromogenic Substrates Used in Bacterial Diagnostics


Challenging Glass 3 – Conference on Architectural and Structural Applications of Glass, Bos, Louter, Nijsse, Veer (Eds.), IOS Press,2012.
© The authors and IOS Press. All rights reserved. Doi:10.3233/978-1-61499-061-1-957
Behaviour of the electrochromic glass in the Mediterranean area
Gianraffaele Loddo, Daniela Ludoni, Marco Pittaluga, Gian Piero Cossu Civil and Environment Engineering and Architecture Department, Cagliari University,
Italy, [email protected]
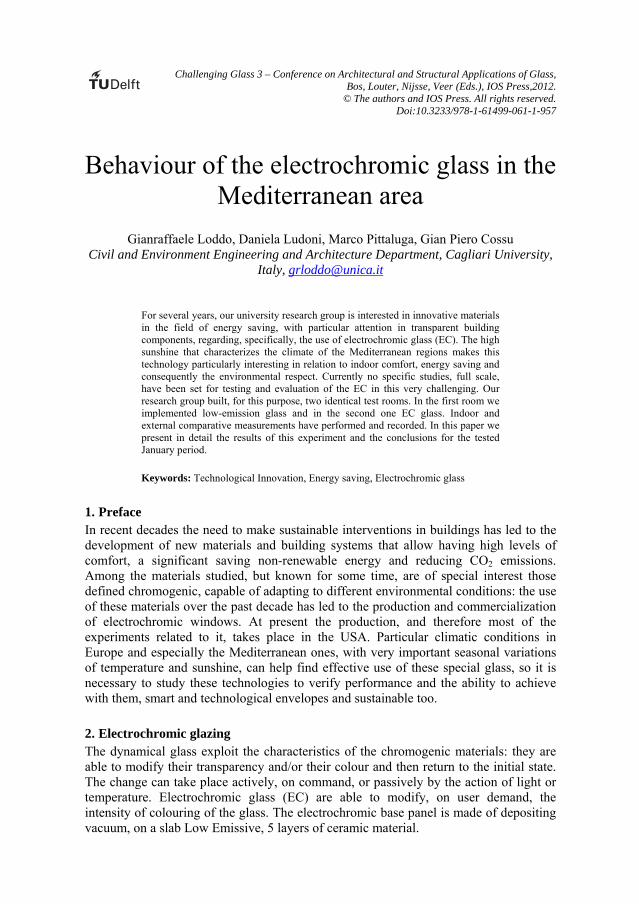
For several years, our university research group is interested in innovative materials in the field of energy saving, with particular attention in transparent building components, regarding, specifically, the use of electrochromic glass (EC). The high sunshine that characterizes the climate of the Mediterranean regions makes this technology particularly interesting in relation to indoor comfort, energy saving and consequently the environmental respect. Currently no specific studies, full scale, have been set for testing and evaluation of the EC in this very challenging. Our research group built, for this purpose, two identical test rooms. In the first room we implemented low-emission glass and in the second one EC glass. Indoor and external comparative measurements have performed and recorded. In this paper we present in detail the results of this experiment and the conclusions for the tested January period.
Keywords: Technological Innovation, Energy saving, Electrochromic glass
1. Preface In recent decades the need to make sustainable interventions in buildings has led to the development of new materials and building systems that allow having high levels of comfort, a significant saving non-renewable energy and reducing CO2 emissions. Among the materials studied, but known for some time, are of special interest those defined chromogenic, capable of adapting to different environmental conditions: the use of these materials over the past decade has led to the production and commercialization of electrochromic windows. At present the production, and therefore most of the experiments related to it, takes place in the USA. Particular climatic conditions in Europe and especially the Mediterranean ones, with very important seasonal variations of temperature and sunshine, can help find effective use of these special glass, so it is necessary to study these technologies to verify performance and the ability to achieve with them, smart and technological envelopes and sustainable too.
2. Electrochromic glazing The dynamical glass exploit the characteristics of the chromogenic materials: they are able to modify their transparency and/or their colour and then return to the initial state. The change can take place actively, on command, or passively by the action of light or temperature. Electrochromic glass (EC) are able to modify, on user demand, the intensity of colouring of the glass. The electrochromic base panel is made of depositing vacuum, on a slab Low Emissive, 5 layers of ceramic material.

Challenging Glass 3
The panel is then assembled and integrated in a unit which consists of:
• External Slab of tempered Low-E glass (called LE), with a thickness of 6 mm, on whose inner surface is applied a film of metal oxides;
• Internal Slab of laminated or tempered glass, thickness of 6 mm; • Air gap filled with argon gas thickness of 12.7 mm; • Stainless Steel Spacer.
The activation of a low electric field produces a reaction of oxidation-reduction, in which lithium ions, migrate of layers. By reversing the polarity is obtained reverse switching. In the fully tinted state ions prevent the passage of part of the visible light, of UV and by more than 91% of incoming solar radiation. The increase in colouring intensity keeps the visibility and the outdoor relationship and, in the same time, prevents the vision from outdoor to indoor. The variation occurs in a period of time ranging from 3' up to 5', depending on the size of the glass and air temperature, and can be activated manually or by automated system. The variation of the coloration is able to significantly change the g value (Solar Heat Gain Coefficient). In a Low-Emissivity glass (LE), values of SHGC and the Transmission of the visible field are respectively 0.42 and 71, while in an EC these values are in the fully tinted state 0.09 and 3. The transmittance (U) is 1.30 W/m² K for the LE and 1.49 W/m² K for the EC. The electrochromic glazings have exceeded 100,000 hours of durability testing and are certified for 50,000 hours (NREL Test E-2141). Currently the EC is produced in various colours including green, blue and gray. The consumption of electricity necessary to activation is 2.8 W/m² during the passage of colouring, and 1.0 W/ m² to system.
3. Experimental set The studies were conducted in two phases: a simulation and testing. The test is performed on two identical rooms for geometric features, construction and orientation, built on the roof of the Department Architecture, University of Cagliari. The two phases are important both to verify the reliability of the software to accurately evaluate the behaviour of windows EC and LE in different climatic conditions.
3.1. Simulation The simulation was performed on two pairs of rooms: the first one in a cellular brick bearing wall and the other one with balloon frame wood: no evident difference was noted. In the two versions has been simulated and compared the use of LE and EC glass. The results showed very similar values in the two construction types. For the real test, therefore, has been chosen the second system, which offers the advantage of the rapid implementation and easy disassembly and recycling of the material used at the end of experiment. [1] The team did several studies regarding the envelope, to found the best solution conforming to the Italian rules. So that one chosen is simply not a box to experimentation; it has all energetic behaviour performances requested to the actually buildings.
3.2. The construction of test rooms Construction work started in late June 2011. Two rooms are identical; the only difference is the type of glazing. The external dimension is 400x400 cm in plan with an internal height of 275 cm. The orientation is north-south axis along a diagonal so that
Behaviour of the electrochromic glass in the Mediterranean area
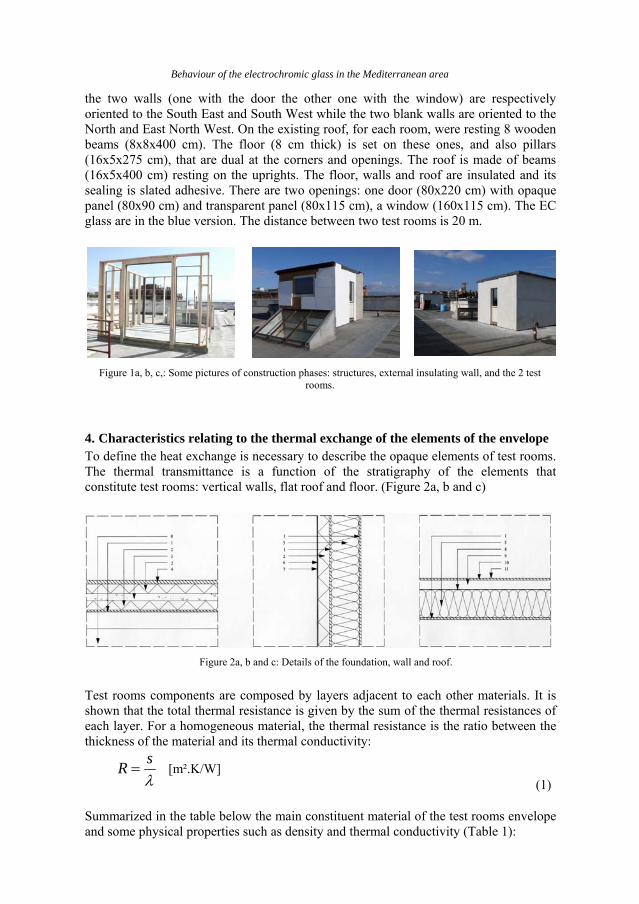
the two walls (one with the door the other one with the window) are respectively oriented to the South East and South West while the two blank walls are oriented to the North and East North West. On the existing roof, for each room, were resting 8 wooden beams (8x8x400 cm). The floor (8 cm thick) is set on these ones, and also pillars (16x5x275 cm), that are dual at the corners and openings. The roof is made of beams (16x5x400 cm) resting on the uprights. The floor, walls and roof are insulated and its sealing is slated adhesive. There are two openings: one door (80x220 cm) with opaque panel (80x90 cm) and transparent panel (80x115 cm), a window (160x115 cm). The EC glass are in the blue version. The distance between two test rooms is 20 m.
Figure 1a, b, c,: Some pictures of construction phases: structures, external insulating wall, and the 2 test rooms.
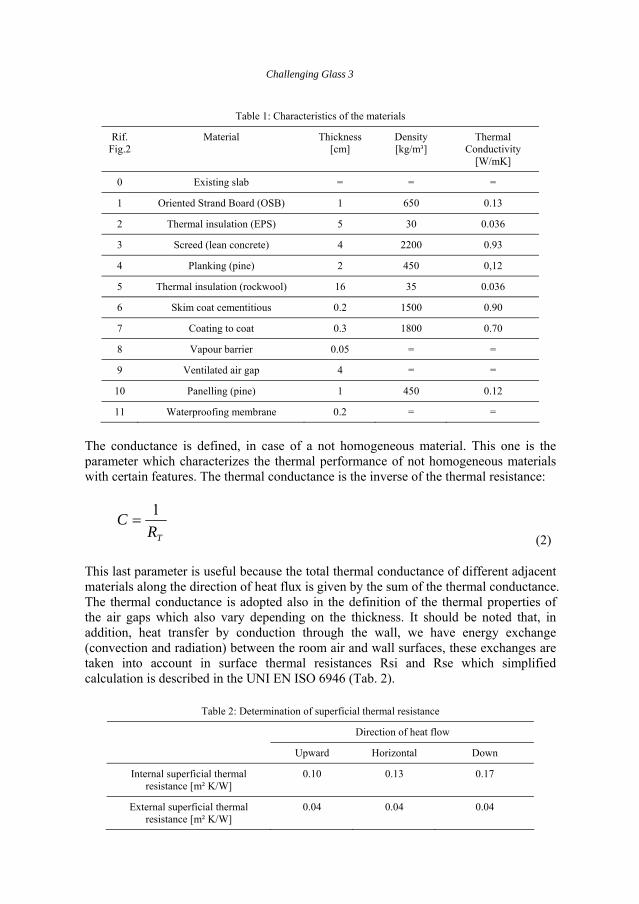
4. Characteristics relating to the thermal exchange of the elements of the envelope To define the heat exchange is necessary to describe the opaque elements of test rooms. The thermal transmittance is a function of the stratigraphy of the elements that constitute test rooms: vertical walls, flat roof and floor. (Figure 2a, b and c)
Figure 2a, b and c: Details of the foundation, wall and roof.
Test rooms components are composed by layers adjacent to each other materials. It is shown that the total thermal resistance is given by the sum of the thermal resistances of each layer. For a homogeneous material, the thermal resistance is the ratio between the thickness of the material and its thermal conductivity:
λsR =
[m².K/W]
(1)
Summarized in the table below the main constituent material of the test rooms envelope and some physical properties such as density and thermal conductivity (Table 1):
Challenging Glass 3
Table 1: Characteristics of the materials
Rif. Fig.2
Material Thickness [cm]
Density [kg/m³]
Thermal Conductivity
[W/mK]
0 Existing slab = = =
1 Oriented Strand Board (OSB) 1 650 0.13
2 Thermal insulation (EPS) 5 30 0.036
3 Screed (lean concrete) 4 2200 0.93
4 Planking (pine) 2 450 0,12
5 Thermal insulation (rockwool) 16 35 0.036
6 Skim coat cementitious 0.2 1500 0.90
7 Coating to coat 0.3 1800 0.70
8 Vapour barrier 0.05 = =
9 Ventilated air gap 4 = =
10 Panelling (pine) 1 450 0.12
11 Waterproofing membrane 0.2 = =
The conductance is defined, in case of a not homogeneous material. This one is the parameter which characterizes the thermal performance of not homogeneous materials with certain features. The thermal conductance is the inverse of the thermal resistance:
TRC 1=
(2)
This last parameter is useful because the total thermal conductance of different adjacent materials along the direction of heat flux is given by the sum of the thermal conductance. The thermal conductance is adopted also in the definition of the thermal properties of the air gaps which also vary depending on the thickness. It should be noted that, in addition, heat transfer by conduction through the wall, we have energy exchange (convection and radiation) between the room air and wall surfaces, these exchanges are taken into account in surface thermal resistances Rsi and Rse which simplified calculation is described in the UNI EN ISO 6946 (Tab. 2).
Table 2: Determination of superficial thermal resistance
Direction of heat flow
Upward Horizontal Down
Internal superficial thermal resistance [m² K/W]
0.10 0.13 0.17
External superficial thermal resistance [m² K/W]
0.04 0.04 0.04
Behaviour of the electrochromic glass in the Mediterranean area
The phenomenon of heat transmission between two rooms makes reference to the temperatures of the air contained in the two rooms, in accordance with the following equation:
)( eitot TTAUq −⋅⋅=•
(3)
Where U is the thermal transmittance of the wall, A the surface of the wall; Ti and Te, respectively, the indoor and outdoor air temperature. U, thermal transmittance of the wall or global heat transfer coefficient [W/(m².K)] is:
∑ ∑∑= ==
++++= m
jse
l
y yj
n
k k
ksi R
CCs
RU
1 11
111
λ (4)
Where:
• Rsi = Internal superficial thermal resistance [(m².K)/W]; • λk = Thermal conductivity of the k-th homogeneous layer [W/(m.K)]; • sk = Thickness of the k-th homogeneous layer[m]; • n = Number of homogeneous layers; • Cj = Thermal conductance of the j-th layer not homogeneous [W/( m².K)]; • m = Number of layers for which the thermal conductance is known; • Cy = Thermal conductance of the y-th air gap [W/( m².K)]; • l = Number of air gaps; • Rse = External superficial thermal resistance [(m².K)/W];
The average thermal transmittance is equal to the weighted average of the different elements transmittances (along the direction of heat flow) in which the weight is represented by the surface (in the perpendicular direction to the heat flow). Following values of average transmission are obtained applying the general equation (4) for the calculation of the transmittance to elements of test rooms’ envelope (Figures 2a, b, c) and to other special elements; and using the properties of Table 1 and 2.
Table 3: Average Transmittance values and legal limit transmittance value for the envelope elements
Element Average transmittance [W/m² K]
Legal limit Transmittance [W/m² K]
Vertical walls 0.17 0.40
Flat roof 0.26 0.38
Floor 0.36 0.42

Challenging Glass 3
The averages calculated transmittances are compared with the limit values prescribed by the Legislative Ordinance 311/2006 for the municipalities such as Cagliari, sited at climate zone C (Daily Degree = 990), the transmittance values are all lower than limit values, vertical walls have a thermal transmittance value of less than 58% of limit values.
5. Collecting Data
5.1. Survey instruments In each of two rooms is a microclimatic station consists of sensors, connected to a data logger capable to measure: dry and wet bulb temperature, relative humidity, solar radiation and transmittance. The combined sensors of temperature and humidity work in a range between -20°C and +80°C and between 5% and 98% RH. The accuracy is ± 0.30°C for temperature and ± 2% for humidity. The pyranometer measures the solar radiation between 305 and 2000 nm, with an accuracy of 10 microvolt/W/m².
Figure 3: Instruments in the EC room.
5.2. Method of survey and working of test rooms The detection covers 24 hours with the recording of the internal data. The outside meteorological data are quoted daily. In January 2012 in the room with EC glass, the activation of electrochromic panel is from 7.15 to 15.20 for door (South-East), and from 8.40 to 16.55 for window (South-West). During the first week of February 2012 the EC glazing were kept in the Off position to audit the behaviour of windows in these conditions. In continuation of the trial period, activation (ON) or not (OFF) of the EC windows will be modified in relation to the solar duration, intensity and inclination.
Figure 4a, b and c: Room with EC glazing: in state Off (indoor) and state On (indoor and outdoor).
Behaviour of the electrochromic glass in the Mediterranean area
6. Data for January 2012
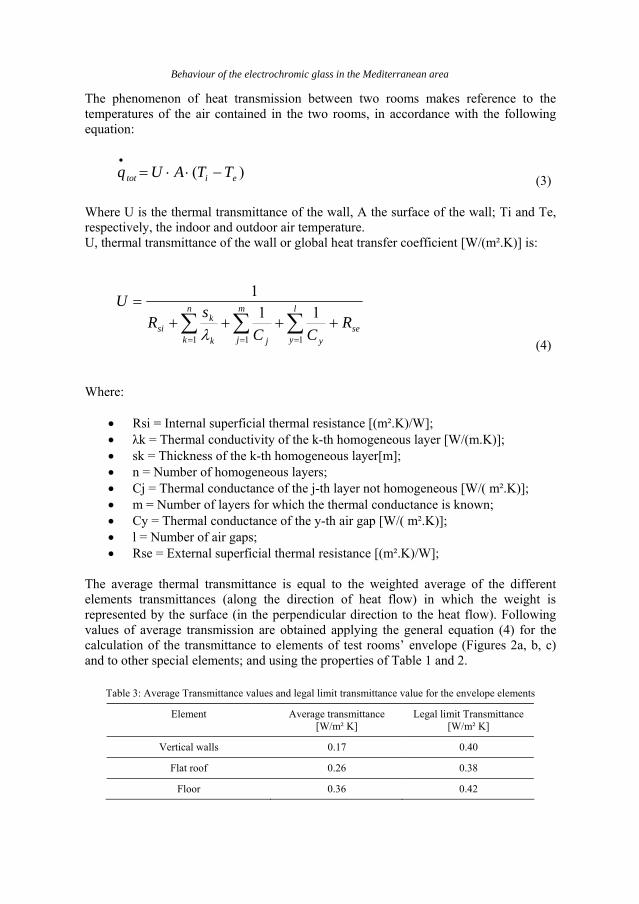
6.1. Outside temperatures In January 2012, the meteorological data of Cagliari (Lat. 39°13'N - Long. 09°7'E) were varied in a limited range: the temperature had a minimum of 0°C (18th Jan.) and a maximum of 18°C (2th Jan.) with an minimum average daily of 6°C (18th Jan.) and a maximum of 14°C (22th Jan.), relative humidity between 51% (6th Jan.) 84% (29th Jan.).
-5,000,005,00
10,0015,0020,00
1-ge
n
3-ge
n
5-ge
n
7-ge
n
9-ge
n
11-g
en
13-g
en
15-g
en
17-g
en
19-g
en
21-g
en
23-g
en
25-g
en
27-g
en
29-g
en
31-g
en
T min
T max
T average
Graph 1: January 2012, Temperatures of Cagliari (minimum, average, maximum).
The analysis data shows that, in January, the days of 2th (hottest day), 6th (minimum humidity), 18th (coldest and minimum average temp.), 22th (maximum average temp.) and 29th (maximum humidity) are considered most significant in the period.
6.2. Inside collected data (temperatures) The data collection occurred on 01th, every 5' from 0.00 hours until 12.00 of 19th , and was followed every 15', from 12.00 of 19th until 24.00 of 31th. The new range was considered sufficient to evaluations while the previous one was overly, and unnecessarily closes. The collected data in the rooms LE and EC were detected by identifying, in each day, the time to maximum and minimum temperature and maximum and minimum internal solar radiation. These data are summarized as follows:
Table 4: Detecting outdoor temperature range in significant days of January 2012
Date 02 06 18 22 29
Ext. Temp. av.ge [°C]
12 13 6 14 8
Ext. Temp. min [°C]
6 8 0 13 6
Ext. Temp. max [°C]
18 16 14 17 10
Challenging Glass 3
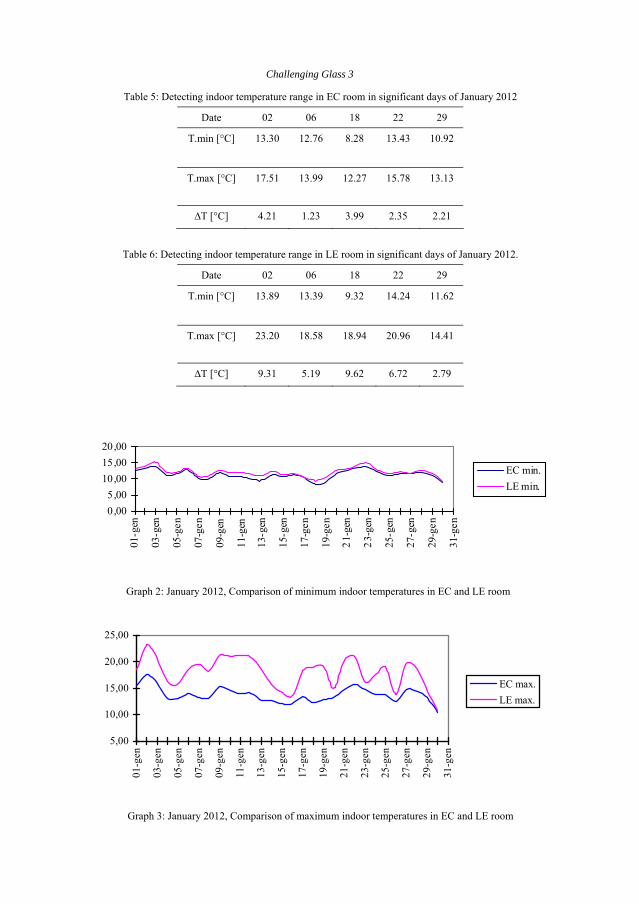
Table 5: Detecting indoor temperature range in EC room in significant days of January 2012
Date 02 06 18 22 29
T.min [°C] 13.30 12.76 8.28 13.43 10.92
T.max [°C] 17.51 13.99 12.27 15.78 13.13
∆T [°C] 4.21 1.23 3.99 2.35 2.21
Table 6: Detecting indoor temperature range in LE room in significant days of January 2012.
Date 02 06 18 22 29
T.min [°C] 13.89 13.39 9.32 14.24 11.62
T.max [°C] 23.20 18.58 18.94 20.96 14.41
∆T [°C] 9.31 5.19 9.62 6.72 2.79
0 ,005,00
10,0015,0020,00
01-g
en
03-g
en
05-g
en
07-g
en
09-g
en
11-g
en
13-g
en
15-g
en
17-g
en
19-g
en
21-g
en
23-g
en
25-g
en
27-g
en
29-g
en
31-g
enEC min.LE min.
Graph 2: January 2012, Comparison of minimum indoor temperatures in EC and LE room
5,00
10,00
15,00
20,00
25,00
01-g
en
03-g
en
05-g
en
07-g
en
09-g
en
11-g
en
13-g
en
15-g
en
17-g
en
19-g
en
21-g
en
23-g
en
25-g
en
27-g
en
29-g
en
31-g
en
EC max.LE max.
Graph 3: January 2012, Comparison of maximum indoor temperatures in EC and LE room

Behaviour of the electrochromic glass in the Mediterranean area
The comparison between the Graphs 2 and 3 shows, in an evident way, as in the rooms of test, while it is negligible the difference between the minimum temperatures (it has been found, in the month, a daily average ∆T of 0.782°C favourable for the room LE) the difference between the maximum temperature is considerable (measured in months, a daily average ∆T of 4.184°C for the LE room, even with daily peaks of 9°C). It's very interesting to note how minimum and maximum temperature peaks occur with the same hourly frequency. The most critical hours were 8.00 (95%) for the minimum temperature and 16.00 (80%) for the maximum one.
6.3. Inside data collected (incoming solar radiation) Similarly incoming solar radiation data were detected. We show those ones for 2th (max external temp. = 18°C and clear sky) and January 18th (external temp min = 0°C and external average min temp. = 6°C and clear sky). During on 2th the global solar radiation in the room EC (expressed as [μW/cm²= 10-
6W/104m²]) had a low value close to 0 with two maximum around 10.30 with 201 μW/cm² and at 15.35 with 251 μW/cm² (see graph 4)
050
100150200250300
0.00
1.30
3.00
4.30
6.00
7.30
9.00
10.3
0
12.0
0
13.3
0
15.0
0
16.3
0
18.0
0
19.3
0
21.0
0
22.3
0
0.00
Graph 4: 02 th January 2012 (hottest day), incoming solar radiation in the EC room
The same day 2th global solar radiation in the room LE had a value close to 0 at night and evening and grew up between 8.00 and 8.30 going from 95 μW/cm² to 571 μW/cm² and continuing to grow until at 11:00 when it reached the maximum of 16,520 μW/cm² (see graph 5).
0300060009000
120001500018000
0.00
1.30
3.00
4.30
6.00
7.30
9.00
10.3
0
12.0
0
13.3
0
15.0
0
16.3
0
18.0
0
19.3
0
21.0
0
22.3
0
0.00
Graph 5: 02th January 2012 (hottest day), incoming solar radiation in the LE room
Challenging Glass 3
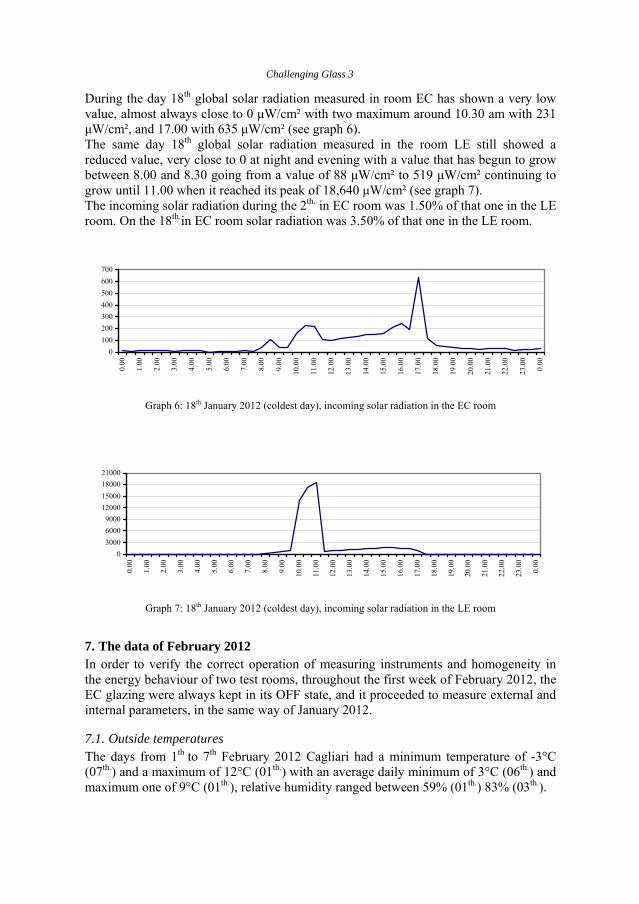
During the day 18th global solar radiation measured in room EC has shown a very low value, almost always close to 0 μW/cm² with two maximum around 10.30 am with 231 μW/cm², and 17.00 with 635 μW/cm² (see graph 6). The same day 18th global solar radiation measured in the room LE still showed a reduced value, very close to 0 at night and evening with a value that has begun to grow between 8.00 and 8.30 going from a value of 88 μW/cm² to 519 μW/cm² continuing to grow until 11.00 when it reached its peak of 18,640 μW/cm² (see graph 7). The incoming solar radiation during the 2th. in EC room was 1.50% of that one in the LE room. On the 18th.in EC room solar radiation was 3.50% of that one in the LE room.
0100200300400500600700
0.00
1.00
2.00
3.00
4.00
5.00
6.00
7.00
8.00
9.00
10.0
0
11.0
0
12.0
0
13.0
0
14.0
0
15.0
0
16.0
0
17.0
0
18.0
0
19.0
0
20.0
0
21.0
0
22.0
0
23.0
0
0.00
Graph 6: 18th January 2012 (coldest day), incoming solar radiation in the EC room
0300060009000
12000150001800021000
0.00
1.00
2.00
3.00
4.00
5.00
6.00
7.00
8.00
9.00
10.0
0
11.0
0
12.0
0
13.0
0
14.0
0
15.0
0
16.0
0
17.0
0
18.0
0
19.0
0
20.0
0
21.0
0
22.0
0
23.0
0
0.00
Graph 7: 18th January 2012 (coldest day), incoming solar radiation in the LE room
7. The data of February 2012 In order to verify the correct operation of measuring instruments and homogeneity in the energy behaviour of two test rooms, throughout the first week of February 2012, the EC glazing were always kept in its OFF state, and it proceeded to measure external and internal parameters, in the same way of January 2012.
7.1. Outside temperatures The days from 1th to 7th February 2012 Cagliari had a minimum temperature of -3°C (07th.) and a maximum of 12°C (01th.) with an average daily minimum of 3°C (06th.) and maximum one of 9°C (01th.), relative humidity ranged between 59% (01th.) 83% (03th.).
Behaviour of the electrochromic glass in the Mediterranean area
-4,00-2,000,002,004,006,008,00
10,0012,0014,00
2.01
2.02
2.03
2.04
2.05
2.06
2.07
T minT maxT average
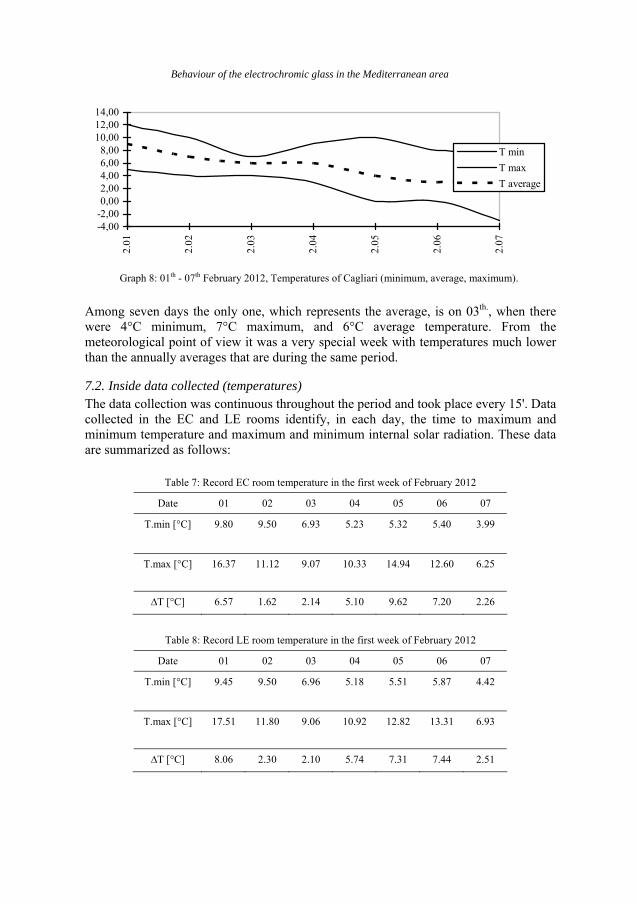
Graph 8: 01th - 07th February 2012, Temperatures of Cagliari (minimum, average, maximum).
Among seven days the only one, which represents the average, is on 03th., when there were 4°C minimum, 7°C maximum, and 6°C average temperature. From the meteorological point of view it was a very special week with temperatures much lower than the annually averages that are during the same period.
7.2. Inside data collected (temperatures) The data collection was continuous throughout the period and took place every 15'. Data collected in the EC and LE rooms identify, in each day, the time to maximum and minimum temperature and maximum and minimum internal solar radiation. These data are summarized as follows:
Table 7: Record EC room temperature in the first week of February 2012
Date 01 02 03 04 05 06 07
T.min [°C] 9.80 9.50 6.93 5.23 5.32 5.40 3.99
T.max [°C] 16.37 11.12 9.07 10.33 14.94 12.60 6.25
∆T [°C] 6.57 1.62 2.14 5.10 9.62 7.20 2.26
Table 8: Record LE room temperature in the first week of February 2012
Date 01 02 03 04 05 06 07
T.min [°C] 9.45 9.50 6.96 5.18 5.51 5.87 4.42
T.max [°C] 17.51 11.80 9.06 10.92 12.82 13.31 6.93
∆T [°C] 8.06 2.30 2.10 5.74 7.31 7.44 2.51
Challenging Glass 3
6
8
0.00
1.00
2.00
3.00
4.00
5.00
6.00
7.00
8.00
9.00
10.0
0
11.0
0
12.0
0
13.0
0
14.0
0
15.0
0
16.0
0
17.0
0
18.0
0
19.0
0
20.0
0
21.0
0
22.0
0
23.0
0
0.00
T intern. ECT intern. LE
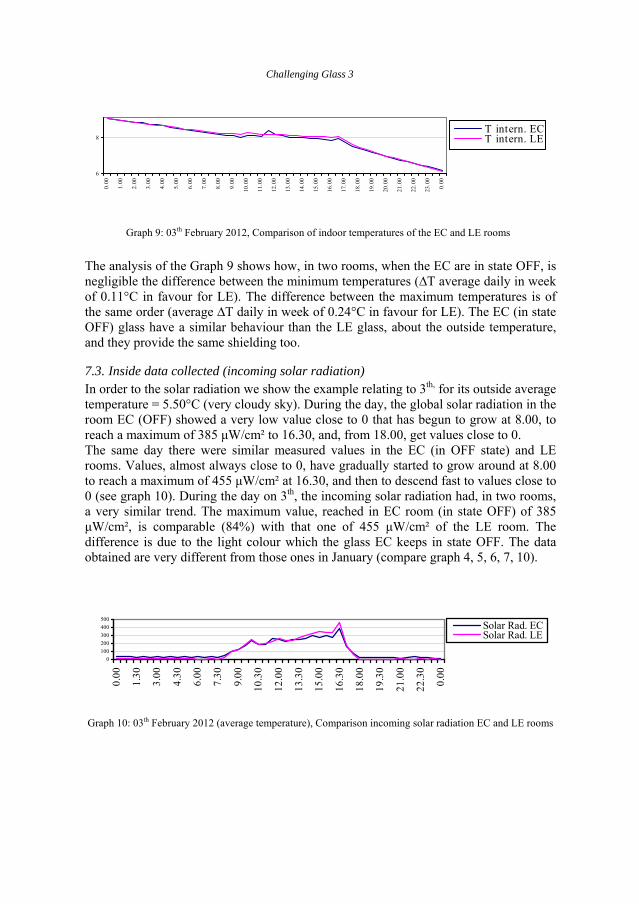
Graph 9: 03th February 2012, Comparison of indoor temperatures of the EC and LE rooms
The analysis of the Graph 9 shows how, in two rooms, when the EC are in state OFF, is negligible the difference between the minimum temperatures (∆T average daily in week of 0.11°C in favour for LE). The difference between the maximum temperatures is of the same order (average ∆T daily in week of 0.24°C in favour for LE). The EC (in state OFF) glass have a similar behaviour than the LE glass, about the outside temperature, and they provide the same shielding too.
7.3. Inside data collected (incoming solar radiation) In order to the solar radiation we show the example relating to 3th, for its outside average temperature = 5.50°C (very cloudy sky). During the day, the global solar radiation in the room EC (OFF) showed a very low value close to 0 that has begun to grow at 8.00, to reach a maximum of 385 μW/cm² to 16.30, and, from 18.00, get values close to 0. The same day there were similar measured values in the EC (in OFF state) and LE rooms. Values, almost always close to 0, have gradually started to grow around at 8.00 to reach a maximum of 455 μW/cm² at 16.30, and then to descend fast to values close to 0 (see graph 10). During the day on 3th, the incoming solar radiation had, in two rooms, a very similar trend. The maximum value, reached in EC room (in state OFF) of 385 μW/cm², is comparable (84%) with that one of 455 μW/cm² of the LE room. The difference is due to the light colour which the glass EC keeps in state OFF. The data obtained are very different from those ones in January (compare graph 4, 5, 6, 7, 10).
0100200300400500
0.00
1.30
3.00
4.30
6.00
7.30
9.00
10.3
0
12.0
0
13.3
0
15.0
0
16.3
0
18.0
0
19.3
0
21.0
0
22.3
0
0.00
Solar Rad. ECSolar Rad. LE
Graph 10: 03th February 2012 (average temperature), Comparison incoming solar radiation EC and LE rooms
Behaviour of the electrochromic glass in the Mediterranean area
8. Conclusions This first phase of experimentation, with this configuration of test rooms, will last through 2012 and it allows making interesting observations: as expected, but now we can quantify with precision, the EC glass, even in OFF, are slightly disadvantageous in the short cold period that characterizes the Mediterranean climate. The advantage, in the warm months, compared to LE of EC windows is already announced by the great power that the shielding EC have been shown to have. The goals for the search are not simply a quantification of the performance of the EC but also their relationship with the building envelope both in terms of typology and material of the relationship between quantity of glass surface and blank wall. The special conditions in the Mediterranean (in Cagliari there are over 2,600 hours of sunshine per year) and the redevelopment of the rich historical buildings are the most important variables in research.
9. Acknowledgements The research team wishes to thank the partners: eng. Ubaldo Carlini, Laborvetro Srl (Cagliari - Italy); Casa Extra Clima sas (Cagliari - Italy).
10. References [1] Loddo, Gianraffaele; Ludoni, Daniela; Cossu, Gian Piero; Pittaluga, Marco; Pinna, Maria Laura,
Experimenting and testing the use of electrochromic windows in the Mediterranean climate, Proceedings of International Conference on Glass and Solar in Sustainable Development (Glass Performance Days), Tampere, Finland, 2011.