Behaviour of H-section purlin connections in resisting ...
39
1 1 Behaviour of H-section purlin connections in resisting progressive collapse of roofs 2 3 Shen Yan 1,2 , Kim J.R. Rasmussen 2 , Xinlu Liu 1 , Liusi Dai 3 , Xianzhong Zhao 1 4 5 1. College of Civil Engineering, Tongji University, China 6 2. School of Civil Engineering, the University of Sydney, Australia 7 3. School of Civil Engineering, Shanghai University, China 8 9 10 Abstract: 11 When a truss roof is subjected to sudden local damage, purlins are capable of bridging the damaged planar 12 truss unit, thereby increasing the robustness of the integrated roof system. To investigate the bridging 13 capacity that purlins can provide, experiments were carried out on the bolted fin plate connections that join 14 thin-walled H-section purlins to the main truss, investigating their behaviour under a main truss-removal 15 scenario. Eight specimens with varied connection details were tested. Results of all experiments are 16 provided in detail, including the full-range vertical resistance-displacement curves, the collapse-resisting 17 mechanisms, and the failure modes, being either bolt shear failure or combined bolt bearing and net-section 18 tensile failure. Meanwhile, a theoretical model is proposed to predict the vertical resistance-displacement 19 response of the purlin-to-connection assembly. This model is capable of capturing the slip of bolts, and the 20 gradual yielding and failure of the connection components, and thus gives predictions that are in reasonably 21 good agreement with the experimental results. 22 23 Keywords: 24 progressive collapse; purlin connection; experiments; bolt slip; component model 25
Transcript of Behaviour of H-section purlin connections in resisting ...

1
1 Behaviour of H-section purlin connections in resisting progressive collapse of roofs
2
3 Shen Yan1,2, Kim J.R. Rasmussen2, Xinlu Liu1, Liusi Dai3, Xianzhong Zhao1
4
5 1. College of Civil Engineering, Tongji University, China
6 2. School of Civil Engineering, the University of Sydney, Australia
7 3. School of Civil Engineering, Shanghai University, China
8
9
10 Abstract:
11 When a truss roof is subjected to sudden local damage, purlins are capable of bridging the damaged planar
12 truss unit, thereby increasing the robustness of the integrated roof system. To investigate the bridging
13 capacity that purlins can provide, experiments were carried out on the bolted fin plate connections that join
14 thin-walled H-section purlins to the main truss, investigating their behaviour under a main truss-removal
15 scenario. Eight specimens with varied connection details were tested. Results of all experiments are
16 provided in detail, including the full-range vertical resistance-displacement curves, the collapse-resisting
17 mechanisms, and the failure modes, being either bolt shear failure or combined bolt bearing and net-section
18 tensile failure. Meanwhile, a theoretical model is proposed to predict the vertical resistance-displacement
19 response of the purlin-to-connection assembly. This model is capable of capturing the slip of bolts, and the
20 gradual yielding and failure of the connection components, and thus gives predictions that are in reasonably
21 good agreement with the experimental results.
22
23 Keywords:
24 progressive collapse; purlin connection; experiments; bolt slip; component model
25
78195
打字机
This manuscript has been published by the Engineering Structure 2019, Vol. 201, pp.109849. doi.org/10.1016/j.engstruct.2019.109849
78195
打字机
This manuscript has been published by the Engineering Structure 2019, Vol. 201, pp.109849. doi.org/10.1016/j.engstruct.2019.109849

2
26 1. Introduction
27 The last several decades have witnessed plenty of progressive collapse incidents of building structures,
28 leading to a growing interest in both the academic and engineering communities in this disproportional
29 failure phenomenon. As a result, a great number of studies have been conducted to investigate the
30 progressive collapse resistance of multi-storey frame structures [1-3] and, more recently, roof structures [4-
31 6].
32 Among the various types of roof structures, trusses have received the most attention in the research of
33 progressive collapse. It is already known that a planar truss unit has two mechanisms for stopping the spread
34 of the initial damage inside the planar truss unit, i.e., arch action and catenary action [7-9]. When multiple
35 planar truss units are tied into an integrated roof system, the tying members such as purlins are capable of
36 bridging the initially damaged truss unit [10]. This is readily understandable because a good analogy can
37 be found in frame structures, in which the catenary behaviour of beams bridges the initially damaged
38 column. However, what remains unknown is the actual bridging capacity a purlin can provide, which
39 primarily relies on the resistance and ductility of the purlin-to-main truss connection.
40 Compared to thin-walled C-shaped and Z-shaped cross-sections, thin-walled H-shaped cross-sections
41 (either hot-rolled or welded) have higher flexural stiffness and better bi-axial bending performance, and
42 thus are increasingly being used as purlins bridging long spans. In practical engineering applications, H-
43 section purlins are normally connected to the main truss by bolting the purlin web to a connector that is
44 welded onto the top surface of the main truss, as shown in Fig. 1. The connector can be either an angle cleat
45 (Fig. 1a) or a stiffened fin plate (Fig. 1b), of which the latter has greater lateral flexural resistance and also
46 enables convenient adjustment of the vertical position of the purlin, facilitating the engineer to create
47 freeform surfaces of the roof, and thus is usually preferred. Therefore, this paper specifically investigates
48 the behaviour of bolted fin-plate purlin connections.
49 In terms of constructional details and the load-transferring mechanism, the investigated fin-plate purlin
50 connection is very similar to the fin-plate beam-to-column connection, the progressive collapse resistance
51 of which has already been examined in [11]. However, purlin connections are usually designed with a

3
52 combination of non-preloaded bearing-type bolts and bolt holes with a comparatively larger clearance,
53 which makes the slip of bolts a prominent phenomenon in the context of resisting progressive collapse. This
54 constitutes a significant difference from the beam-to-column connections. In actuality, under a column (or
55 main truss) removal scenario, the connections are subjected to internal forces that are beyond their design
56 loads. Thus, even if a connection adopts slip-resistant bolts, on most occasions the slip of bolts is still
57 inevitable, as observed in the tests reported in [11]. The bolt-slip behaviour in a connection postpones the
58 activation of the catenary action, a major collapse-resisting mechanism, thereby affecting the overall
59 bridging capacity provided by the purlins, which however was paid insufficient attention.
60 This study investigates the performance of the bolted fin-plate purlin connections under a main truss-
61 removal scenario. Eight specimens with varied connection details are tested, through which the collapse-
62 resisting mechanisms are assessed, as are the failure modes of the purlin connections. As will be shown in
63 the tests, in different specimens the vertical displacements at which catenary action is activated show
64 considerable difference, indicating the presence of different bolt-slip behaviour and its significant influence
65 on the connection resistance. Furthermore, a theoretical model is developed to predict the behaviour of the
66 purlin-to-connection assembly under a main truss-removal scenario, and is validated against the
67 experimental results.
68
69 2. Test specimens and setup
70 2.1 Test specimens
71 Conventionally, a progressive collapse test of a beam-to-column connection takes the connection
72 above the removed column as the experimental object. In this experimental programme, however, the purlin
73 connection adjacent to the removed main truss (Joint A in Fig. 2), instead of the purlin connection right
74 above the removed main truss (Joint B in Fig. 2), is to be examined. This choice is made because: a) the
75 deformation of the bolted fin-plate connection concentrates on the bolts, the purlin web and the fin plate
76 around and between the bolt holes, the locations of which are symmetric relative to the horizontal axis
77 passing through the centre of the bolt group, and therefore, seeing Joint A and Joint B are subjected to anti-

4
78 symmetric internal forces and deformations after the removal of the main truss, they behave anti-
79 symmetrically, such that the behaviour of one joint can be evaluated through the investigation on the other
80 joint; and b) for certain connection configurations, e.g., a wide top chord of the main truss combined with
81 a small gap between the bottom flange of the purlin and the top chord of the main truss, the purlin may
82 come into contact with the main truss at Joint A, which can complicate the connection behaviour and make
83 Joint A more critical, as schematically illustrated in Fig. 2.
84 The test specimens were designed as a symmetric “purlin-to-connection-to-purlin” assembly being
85 loaded at the connections, the equivalent of which in a beam-to-column connection test, i.e., “beam-to-
86 connection-to-beam” assembly, has been widely adopted in experimental investigations [11-14]. In addition,
87 because the testing facilities preferred convenient application of a downward load, the test specimens were
88 designed to be rotated 180 degrees in the vertical plane, as shown in Fig. 2. This does not alter the internal
89 forces at the purlin connection because the dead load of the purlins was negligible compared to the applied
90 load. Therefore, as shown in Fig. 2, in the case of presence of contact between the main truss and the purlin,
91 the test specimens represent Joint A, while in the case of no contact, the test specimens can also represent
92 Joint B without any need for translation of experimental results.
93 After the removal of a main truss, the inflection points are assumed to be located at the middle of the
94 purlin span. Therefore, the specimen was pinned at both ends, as shown in Fig. 3, and the length between
95 the connection and each end was equal to half of the span between the main trusses. Eight specimens were
96 designed and tested, among which Specimen S1 was considered as the baseline model, and the other
97 specimens featured differences in height of bolt group, location of centre of bolt group, gap between purlin
98 and main truss, bolt grade, bolt diameter, number of bolts, and preloading force, as listed in Table 1. In
99 Specimen S5, the gap between the purlin and the main truss (modelled as a loading column in the test) was
100 only 5 mm, and the previously mentioned purlin-to-main truss contact could be anticipated and thus
101 investigated.
102 In all specimens, the purlins featured the same radio-frequency-welded thin-walled H-section,
103 H300x150x4.5x6, and the fin plates had the same thickness of 6 mm. Table 2 shows the material properties

5
104 of the purlins and the fin plates, which were obtained from coupon tests. The bolt holes in the purlin web
105 and in the fin plate were designed with a 2-mm clearance, i.e., the diameter of each bolt hole was 2 mm
106 larger than the nominal diameter of the bolt, which is in accordance with the allowable maximum size of
107 standard bolt holes in AISC 360 [15]. Moreover, although the bolts were designed as non-preloaded
108 bearing-type bolts, the bolt installation process using a wrench automatically generated preloading forces
109 in the bolts. The preloading force was evaluated based on the wrench torque, and was found to be about 20
110 kN for all specimens except for Specimen S7, in which the preloading force was increased to be about 30
111 kN.
112
113 2.2 Test setup
114 Figure 4 presents an overview of the test setup. Both ends of a specimen were pinned-connected to the
115 horizontal supports, and the vertical load was applied through a loading column using a hydraulic jack that
116 was supported by a loading reaction frame. The horizontal supports and the loading reaction frame were
117 stiff enough and were firmly attached to the strong floor to resist any noticeable deformation. A lateral
118 brace constructed with a vertical sliding support was adopted to make sure that the applied load remained
119 vertical during entire loading process. Similar sliding support can also be found in the tests reported in [12].
120 The hydraulic jack had a travel distance of 500 mm which was sufficient for this experimental programme.
121 The displacement rate was set as 2 mm/sec.
122
123 2.3 Instrumentation
124 All tests were instrumented as illustrated in Fig. 5. Ten displacement transducers (D1 to D10 in Fig.
125 5) were arranged on the top surface of the purlins to measure the deflection of the specimen. Another four
126 displacement transducers (D11 to D14 in Fig. 5) were also arranged to monitor any possible movement of
127 the pin support rollers at both specimen ends.
128 Strain gauges were arranged on three cross-sections along the length of each purlin (L1 to L3, and R1
129 to R3). At each selected cross-section, seven or seventeen strain gauges were arranged, as shown in Fig. 5.

6
130 The strain measurements were used to calculate the internal forces at these cross-sections, and then to
131 calculate the load resistance provided by the specimen.
132
133 3. Test results
134 3.1 General behaviour and failure modes
135 Figure 6(a) shows the vertical load-displacement response of Specimen S1, where the displacement
136 was taken as the average of the displacements measured by displacement transducers D1 and D2. The
137 applied load increased linearly until the displacement reached 3 mm, producing a very short initial linear
138 range on the load-displacement curve. The vertical deflection at this stage was too small to generate
139 catenary action in the specimen, such that the vertical load resistance was derived from the flexural
140 resistance of the connection. The flexural resistance resulted from the force couple of the static friction
141 forces at the bolts, which were limited in magnitude due to the small preloading forces, and were soon
142 overcome, leading to slip deformation at the bolts, as marked by Point “A” in Fig. 6(a). Static friction turned
143 to kinetic friction, which was largely constant in value, and thus the flexural resistance remained nearly
144 constant as slip deformation progressed, as demonstrated by the nearly horizontal plateau in the load-
145 displacement curve between Point “A” and Point “B”. Afterwards, the bottom bolt began to bear on the
146 bolt holes in the purlin web and in the fin plate along the purlin length, and thus catenary action was
147 activated considering the specimen had already undergone significant deflection. When the displacement
148 reached 228 mm, i.e., Point “B(R)” on the load-displacement curve, the bottom bolt on the right-hand-side
149 (RHS) purlin fractured, causing a steep drop in vertical load from 12.9 kN to 5.4 kN. This was then followed
150 by the rapid recovery of the vertical load to another peak load of 11.3 kN at a displacement of 260 mm,
151 Point “T(R)” on the load-displacement curve, when the top bolt on the RHS purlin fractured as well,
152 resulting in the total loss of resistance. Therefore, in general, the Specimen S1 purlin connection failed in a
153 failure mode marked by the fracture of bolts in shear. Photos showing the key components at the two peak
154 loads can be found in Fig. 6(b). It is observed that the bolt holes on the purlin web experienced noticeable

7
155 plastic elongation approximately in the lengthwise direction of the purlin, while the bolt holes on the fin
156 plate underwent smaller plastic deformation.
157 In Specimens S2 and S3, the height of bolt group was increased to 150 mm. In addition, in Specimen
158 S3, on each side of the connection, four grade 4.8 bolts were adopted to replace the two grade 8.8 bolts.
159 Seeing the total shear strength of the four grade 4.8 bolts is the same as that of the two grade 8.8 bolts,
160 Specimens S2 and S3 are collectively compared with Specimen S1 in Fig. 7(a). At the initial stage of loading,
161 both specimens showed a linear flexural response similar to Specimen S1. However, different limits were
162 observed for the initial linear ranges, with Specimens S3 and S1 having the largest and the smallest limits,
163 respectively. This is readily understandable considering the force couple of the static friction forces at the
164 bolts was affected by both the height of bolt group and the number of bolts. From the initial linear range
165 onwards, each of Specimens S2 and S3 had a near plateau that was less apparent and also much shorter than
166 that of Specimen S1. The reason for the different plateau lengths can be found in Section 4.1, in which a
167 theoretical model is developed to characterise the bolt-slip behaviour. For both specimens, the near plateau
168 stage was followed by a rapid increase in the vertical load as a result of catenary action. Specimen S2
169 reached the first peak load of 9.75 kN at a displacement of 155 mm when the RHS bottom bolt fractured in
170 shear. Afterwards, the specimen regained its vertical resistance to 8.0 kN at a displacement of 234 mm,
171 which was interrupted by the fracture of the left-hand-side (LHS) bottom bolt. The latter fracture was
172 unexpected because normally the first failure in a connection propagates on the same side of the connection
173 instead of on the opposite side. Specimen S2 reached its final and the largest peak load of 9.75 kN at a
174 displacement of 314 mm. At this time, the RHS top bolt fractured in shear. Specimen S3 failed as a result
175 of the progressive failure of the four bolts on the RHS side, leading to four peak loads on the vertical load-
176 displacement curve. The premature first peak load was only 4.9 kN, while the ultimate resistance of the
177 specimen was reached at the third peak load of 9.5 kN, which was close to that of Specimen S2. The above
178 description of the experimental phenomena is depicted in Fig. 7(b).
179 Specimens S4 and S5 were designed to have the centres of the bolt groups moved towards the loading
180 column by 45 mm. In specimen S5, the gap between the purlin flange and the loading column was further

8
181 decreased by 25 mm, to only 5 mm. Specimen S4 performed very similarly to Specimen S1 in terms of both
182 the vertical load-displacement response and the failure mode, as shown in Fig. 8, except that in Specimen
183 S4 the fractured bolts were on the LHS rather than on the RHS as in Specimen S1, which is unsurprising
184 seeing a symmetric specimen can fail on either side under symmetric loading. In addition, at the later stage
185 of loading, Specimen S4 had slightly lower stiffness and larger deformation. The ultimate resistance was
186 about 12.5 kN, which was reached at a displacement of 240 mm. In Specimen S5, the expected contact
187 between the purlin flange and the loading column occurred at a displacement of 31 mm, curtailing the slip
188 of bolts and the plateau on the load-displacement curve, as shown in Fig. 8. From then onwards, the vertical
189 load increased rapidly and reached an ultimate value of 13.0 kN at a displacement of only 157 mm.
190 Compared to Specimens S1 and S4, the purlin-to-loading column contact in Specimen S5 did not affect the
191 ultimate resistance, but effectively shifted the vertical load-displacement curve leftwards.
192 Specimens S6, S7 and S8 featured different properties of the bolts. In Specimen S6, both bolt grade
193 and bolt size were changed, from grade 8.8 M12 bolts in Specimen S1 to grade 4.8 M18 bolts, but the shear
194 strength of a single bolt remained approximately unchanged, with the latter being slightly larger by 13%.
195 As a whole, Specimen S6 performed similarly to Specimen S1, but the plateau on the load-displacement
196 curve was shorter by a small margin of about 20 mm, thereby shifting the later part of the curve leftwards
197 by this margin, as shown in Fig. 9 (a). The ultimate resistance was slightly larger than that of Specimen S1,
198 i.e., 13.9 kN vs. 13.2 kN, which was most likely due to the larger bolt shear strength in Specimen S6. In
199 Specimen S7, all bolts were installed with the larger preloading force of 30 kN, 10 kN larger than the bolt
200 preloading force used for other specimens including Specimen S1. This resulted in a greater initial flexural
201 resistance for the specimen, as demonstrated by the higher plateau on the force-displacement curve, as
202 shown in Fig. 9(a). The length of the plateau was shortened by about 20 mm, but the ultimate resistance of
203 the specimen was not altered, which was 13.1 kN reached at a displacement of 202 mm.
204 Specimen S8 replaced the grade 8.8 M12 bolts used for Specimen S1 with larger bolts, i.e., grade 8.8
205 M18 bolts. The larger bolts did not alter the initial linear response of the specimen, but shortened the bolt
206 slip-induced plateau on the vertical load-displacement curve, as shown in Fig. 10 (a). The enlarged bolt size

9
207 increased the bolt shear strength to a value that was more than twice the bolt shear strength in Specimen
208 S1, and is also greater than both the purlin-to-bolt bearing strength and the fin plate-to-bolt bearing strength.
209 Therefore, under the growing axial force developed in each purlin, remarkable bearing plastic deformation
210 was observed between the bolt holes and the end of the purlin web, as depicted by Stage “A” in Fig. 10. On
211 the vertical load-displacement curve, there are several points where the applied load transiently unloaded
212 by a very small amount and instantaneously recovered, forming a series of fluctuations on the curve. This
213 was generated by the deformation of the washers and their interaction with the bolt heads and the nuts
214 during the rotation of bolts, as shown in Fig. 10. The significant plasticity around the bolt holes subsequently
215 led to a transverse crack in the web of the purlin at a displacement of 400 mm, at which the ultimate
216 resistance of 61.1 kN was reached. The crack initiated at the upper edge of the RHS bottom bolt hole and
217 immediately propagated through the net-section to the top bolt hole, forming a through crack between the
218 two bolt holes, as depicted by Stage “B” in Fig. 10. The formation of the transverse crack halved the
219 resistance to 28.2 kN, which then recovered slightly to 29.8 kN when a longitudinal crack formed between
220 the RHS bottom bolt hole and the end section of the purlin web, marking the final failure of the connection,
221 as depicted by Stage “C” in Fig. 10. The failure mode of Specimen S8 was characterised by bolt bearing
222 failure combined with net-section tensile failure, and was completely different from that of the previous
223 seven specimens.
224 A summary of the test results is provided in Table 3, including the failure mode, the resistance and
225 vertical displacement at the first peak load, as well as the ultimate resistance and the corresponding vertical
226 displacement. It is observed that all specimens except for Specimens S2 and S3 reached the ultimate
227 resistance at the first peak load. Moreover, although different specimens had an identical span, the vertical
228 displacements required to activate the catenary action were different because of the different bolt-slip
229 behaviours caused by the different connection details. For each specimen, the bolt slip-induced vertical
230 displacement is also provided in Table 3, which is taken as the displacement corresponding to the
231 commencement of the rapid load increase.
232

10
233 3.2 Resistance mechanisms
234 It is well known that flexural action and catenary action are the two major collapse-resisting
235 mechanisms for frame structures subjected to a sudden column loss. In this section, to further investigate
236 the collapse resisting mechanisms possessed by the purlin connection, the axial force and the bending
237 moment being developed in each purlin are calculated, as are the vertical resistances respectively
238 contributed by the flexural action and the catenary action. All recorded strains were far smaller than the
239 strain to cause the initial yielding of the material, indicating that the purlins behaved in the elastic range
240 during the entire loading process. Therefore, the internal forces in a purlin can be calculated based on the
241 strain measurements at any cross-section. Sections L2 and R2 were used in this study.
242 At Sections L2 and R2, plane cross-sections could be assumed to remain plane under combined
243 bending and axial tension, and therefore, the axial force, N, and the bending moment, M, can be calculated
244 by Eq. (1) and Eq. (2), respectively.
245 (1)N EA
246 (2)t bM EIh
247 where E is the elastic modulus; A is the section area of the purlin; I is the second moment of area of the
248 purlin; and are respectivley the axial strain at the top and the bottom flanges, and are calculated by 𝜀t 𝜀b
249 averaging the strain measurements on the top and the bottom flanges, respectively; is the axial strain of 𝜀
250 the section, which can be calculated by averaging the strains measured at evenly and symmetrically spaced
251 locations along the height of the purlin, i.e., taking an average of , and all strains measured on the 𝜀t 𝜀b
252 purlin web; and h is the height of purlin.
253 Further, the recorded displacements along the purlin length suggested that the purlins roughly
254 remained straight during the entire loading process, which is consistent with many other beam-to-column
255 connection tests under the column removal scenario [12]. Therefore, the shear force in the purlin at Section
256 L2 or R2 can be calculated by:

11
257 (3)2 2
MVl
258 where l is the distance from the pin support to Sections L2 or R2, and δ is the deflection at the section.
259 The vertical resistance of the specimen that was contributed by the flexural action, , and by the 𝐹f
260 catenary action, , can thus be determined by employing Eq. (4) and Eq. (5), respectively.𝐹c
261 (4)f L2 L2 R2 R2cos cosF V V
262 (5)c L2 L2 R2 R2sin sinF N N
263 where , and are the shear force, the axial force and the rotation of Section L2, respectively; , 𝑉L2 𝑁L2 𝜃L2 𝑉R2
264 and are the shear force, the axial force and the rotation of Section R2, respectively. The rotation 𝑁R2 𝜃R2
265 of a section, θ, is evaluated by . Finally, the total vertical resistance provided by the 𝜃 = tan ‒ 1 (𝛿/𝑙)
266 specimen, F, combines and , i.e.:𝐹f 𝐹c
267 (6)f cF F F
268 Figure 11 shows the axial force and bending moment developed in Section L2 of Specimen S1. As
269 soon as the test started, the bending moment increased linearly with the deflection of the specimen. After
270 the bolt began to slip at a vertical displacement of 3 mm, the bending moment went through a stage of very
271 slow increase, denoted as the “bolt slip” stage in Fig. 11. During this stage, until 86 mm, the axial force
272 remained almost zero. Between 86 mm and 145 mm, the axial tension increased slowly to 6.57 kN,
273 indicating that certain degree of catenary action was developing. However, this stage is also regarded as the
274 bolt-slip stage because, as will be explained later in Section 4.1, during the dynamic process of bolt slip
275 there was always factual contact between the bolt shaft and the bolt holes, resulting in the slow increase in
276 axial tension force in the purlin.
277 The slip of bolts would stop only when the bottom bolt shafts and bolt holes had built effective contact
278 along the longitudinal direction of the purlin, which occurred at about 145 mm in the case of Specimen S1,
279 leading to the rapid increase of axial tension. Therefore, the specimen behaviour after 145 mm is regarded
280 as the “catenary action” range, as illustrated in Fig. 11. The bending moment during this range generally

12
281 remained at around the same level as the flexural action range, experiencing two temporary decreases as a
282 result of the suddenly growing contribution of the catenary action in carrying the vertical load. The fracture
283 of a bottom bolt at the displacement of 229 mm terminated the fast increase in axial tension, causing a
284 drastic decrease of both the axial force and the bending moment. There was even a transient period when
285 the bending moment reversed direction. As the displacement kept increasing, the axial force started to
286 recover until the final failure of the connection (after the RHS bottom bolt fractured, the bending moment
287 in the LHS purlin was able to recover somewhat).
288 In summary, the bolted fin-plate purlin connection investigated in this study only allowed very limited
289 bending moment to develop in the purlin. The maximum value of the bending moment was 1.16 kN∙m,
290 which only generated a bending stress of 3.64 MPa at the outer fibre of the purlin flange. The significant
291 deflection generated a fairly large axial tension force in the purlin with a maximum value of 80.2 kN,
292 resulting in an axial stress of 25.9 MPa in the purlin, which is much larger than the maximum bending
293 stress. However, seeing the purlin material had a yield stress of 300 MPa, the purlin behaved well within
294 the elastic range under the combined action of axial tension and bending.
295 Having obtained the internal forces in the purlin, the contribution of the flexural action and the catenary
296 action in providing the vertical resistance can be assessed, as shown in Fig. 12. The flexural action
297 accounted for almost all the resistance in the early flexural-action range up until the displacement of 86
298 mm, when the catenary action started to have a role, corresponding to the gradually growing axial tension
299 as shown in Fig. 11. At the displacement of 145 mm, the catenary action equalled the flexural action with
300 respect to providing vertical resistance. Henceforth, the resistance contributed by the catenary action
301 increased rapidly and accounted for over 90% of the total resistance, as shown in Fig. 12. Therefore, for the
302 purlin connection investigated in this study, under a main truss-removal scenario, the vertical load
303 resistance depends primarily on the development of an effective catenary action. In addition, the total
304 resistance calculated by Eq. (6) was in close agreement with the applied load over the entire loading process,
305 demonstrating that the test was well organised and performed, and the experimental results were accurately
306 recorded.

13
307 With respect to the development of flexural action and catenary action, and their contribution to the
308 total vertical resistance, other specimens behaved similarly to Specimen S1. Specimens S3 and S8 are
309 chosen as examples herein for further elaboration, because Specimen S3 had four bolts on each side of the
310 connection, and thus was able to develop greater flexural action and present a more pronounced progressive
311 connection failure, while Specimen S8 had a failure mode different from all the other specimens. As shown
312 in Fig. 13(a), although the connection details allowed Specimen S3 to develop greater bending moment,
313 catenary action still contributed to over 70% of the total resistance in the catenary-action range, and
314 contributed to about 95% of the total resistance when the specimen reached its first peak load. In Specimen
315 S8, the catenary action provided all the vertical resistance after its full development, as demonstrated in
316 Fig. 13(b).
317 Several conclusions can be drawn based on the above observations. Firstly, the response of the purlin
318 can be divided into two distinct ranges, i.e., the flexural action range and the catenary action range, the
319 transition between which is marked by the end of bolt slip. Secondly, flexural action and catenary action
320 contribute to the major vertical resistance in the flexural range and the catenary range, respectively. Thirdly,
321 the ultimate vertical resistance is controlled by the resistance of the catenary action.
322
323 3.3 Comparison and discussion
324 From the perspective of preventing progressive collapse, Specimens S2 and S3 showed inferior
325 performance to Specimen S1. Firstly, the two specimens had smaller ultimate resistances than Specimen
326 S1, by about 25%. Secondly, both specimens experienced much earlier first failure in the connection, i.e.,
327 the displacements corresponding to the first peak loads of Specimens S2 and S3 were only 38% and 72%
328 of that of Specimen S1, respectively. Thirdly, overall, the ductility of the two specimens were not improved.
329 Comparing to Specimen S1, Specimen S3 had a smaller ultimate displacement. As for Specimen S2,
330 although it had a larger displacement when reaching the ultimate load, this was mostly because of its
331 unusual failure mode, i.e., both bottom bolts fractured and thereby increased the deformability of the
332 specimen. If Specimen S2 had failed on just one side, as all the other specimens did, similar ductilities

14
333 would be expected for Specimens S2 and S1. Therefore, a preliminary suggestion for the design of bolted
334 fin-plate purlin connections is to reduce the height of the bolt group. The reasons for this are multiple.
335 Firstly, a large height of the bolt group may be beneficial to the flexural resistance of the connection, which
336 however has very limited contribution to the overall resistance because it is the catenary action that provides
337 the most of the vertical resistance. Secondly, a larger height of bolt group allows greater bending moment
338 at the connection, which generates extra shear force at the bottom bolt, leading to its earlier failure. Thirdly,
339 as will be shown later, increasing the height of bolt group reduces the bolt slip-induced vertical
340 displacement, and thus reduces the total deflection of the assembly, impairing the development of the
341 catenary action.
342 Comparing Specimen S4 to Specimen S1, it is shown that moving the vertical location of the bolt
343 group had little influence on the performance of the purlin-to-connection assembly. However, comparison
344 between Specimens S5 and S1 shows that, as expected, a small gap between the purlin flange and the main
345 truss (the loading column in the test) creates contact at the early stage of loading. This helped reduce the
346 bolt slip-induced vertical displacement, rendering earlier activation of the catenary action, but was
347 detrimental on the other hand as it reduced the ductility of the connection. In the context of resisting
348 progressive collapse, whether purlin-to-truss contact should be considered as an advantageous factor
349 depends on the collapse-resisting behaviour of the initially damaged planar truss unit. If the planar truss
350 resists progressive collapse through catenary action [7, 9], a large amount of ductility is desired from the
351 purlin connection, while if the collapse-resisting mechanism of the damaged planar truss is the arch action
352 [8], which is a mechanism without recourse to deflection, it is preferable to have an early development of
353 vertical resistance.
354 Comparing Specimens S6 and S7 to Specimen S1, it is observed that, for a given height of bolt group,
355 the ultimate resistance and the corresponding vertical displacement of the assembly are primarily controlled
356 by the bolt shear strength, and depend less on the bolt size and the preloading force. However, Specimen
357 S7 demonstrated that a higher bolt preloading force enhances the development of flexural action in the early

15
358 loading stage, and therefore, is recommended for truss-removal scenarios where considerable vertical
359 resistance is required under a small deflection.
360 Specimen S8 clearly demonstrated that, comparing to the bolt shear failure mode, the failure mode
361 characterised by combined bolt bearing failure and net-section tensile failure was much more ductile,
362 thereby significantly increasing the ductility and the ultimate resistance of the purlin connection. The
363 ultimate resistance and the corresponding vertical displacement of Specimen S8 were 370% and 75% larger
364 than those possessed by Specimen S1, respectively. Therefore, in the context of resisting progressive
365 collapse, it is recommended that bolts being used have sufficient shear strength to achieve the more ductile
366 bolt bearing failure mode. Moreover, to further improve the ultimate resistance, a larger end distance (i.e.,
367 the distance between bolt hole and purlin end) can be adopted to reduce the bearing plastic deformation,
368 thereby postponing the initiation of the transverse crack.
369
370 4. Theoretical model
371 4.1 Bolt-slip model
372 The presence of bolt slip directly affects the activation of the catenary action as well as the total
373 deflection of the purlin-to-connection assembly, and thus has an influence on the vertical load-displacement
374 response. In this section, a mathematical model is developed to predict the bolt slip-induced vertical
375 displacement of the assembly, by capturing the slip behaviour of each bolt inside its corresponding bolt
376 hole.
377 It is observed that the slip of bolts is a process that the bolt-to-bolt hole contact changes direction from
378 the vertical to the purlin length direction, and each bolt slips in a direction that is determined by the force
379 applied on it, and is also confined by the bolt hole. When a purlin is installed by bolting to the fin plate, the
380 dead load of the purlin generates an upward contact force on the upper edge of the bolt holes on the purlin
381 web. Ideally, this aligns the bolt holes on the purlin web, the bolts, and the bolt holes on the fin plate in the
382 vertical direction, as shown in Fig. 14(a), which is the starting point of the bolt slip. Then, the purlins tilt
383 downwards in a test under the vertical load, or in a real structure following a sudden damage in the main

16
384 truss. When the friction forces between the purlin web and the fin plate are overcome, to be compatible
385 with this deformation, the top and bottom bolts start to move rightwards and leftwards, respectively, but
386 are confined to remain within the bolt holes, as shown in Fig. 14(b). Therefore, the slip of bolts is a dynamic
387 process, during which there is always contact between each bolt shaft and its corresponding bolt holes on
388 the purlin web and on the fin plate. As the load increases, the bottom bolt gradually moves to a position
389 where the bolt-to-bolt holes contact forces are acting in the longitudinal direction of the purlin. No further
390 slip will occur once the position has been reached, as shown in Fig. 14(c).
391 To analytically characterise the above bolt-slip behaviour, a reference two-dimensional Cartesian
392 coordinate system is established with its origin at the centre of the bottom bolt hole on the fin plate, its x-
393 axis directed rightwards, and its y-axis directed upwards, as shown in Fig. 15. Then, the coordinates of the
394 centres of the bolt holes on the fin plate are (0, 0) and (0, H), respectively, in which H is the height of the
395 bolt group. From the previous discussion related to Fig. 14, it is known that the top (or bottom) bolt hole
396 centre on the purlin web is always located on a circle centred at the top (or bottom) bolt hole centre on the
397 fin plate, with the radius of this circle being equal to the actual clearance between the bolt and the bolt
398 holes, C1, as shown in Fig. 15. Due to random installation error, C1 is always smaller than the design
399 clearance, C, and is estimated to be 75% of C in this study, i.e., C1=0.75C. Moreover, the assumed rigid-
400 body movement of the purlin during the slip of bolts allows the assumption to be made that the distance
401 between the centres of the two bolt holes on the purlin web remains unchanged, equal to H.
402 It follows that the coordinates of the top and bottom bolt holes on the purlin web, (xT, yT) and (xB, yB),
403 respectively, can be obtained from the equations:
404 ( 7 )2 2 2B B 1x y C
405 ( 8 ) 22 2T T 1x y H C
406 ( 9 ) 2 2 2T B T Bx x y y H
407 Herein the purlin is assumed to be on the LHS of the connection, making the purlin rotate clockwise.
408 Thus the leftward movement of the bottom bolt gives xB a negative sign, and from Eq. (7), we get:

17
409 ( 1 0 )2 2B 1 Bx C y
410 Back-substitute Eq. (10) into Eq. (8) and Eq. (9), and solve xT and yT:
411 ( 1 1 ) 2 2 2 2
1 1 BT 2 2
B 12H C C y
xH y H C
412 ( 1 2 ) 2 2
1 BT 2 2
B 12H C H y
yH y H C
413 The length of the purlin is far greater than its height, implying that the rotational of the purlin is small.
414 Thus the rotation of the purlin can be approximated through:
415 ( 1 3 ) 2 2
B 1 BT B2 2 2
T B B B 1
22 2
H y C yx xy y H Hy y C
416 Let φ be the angle between the line connecting the centres of the bottom bolt holes on the purlin web
417 and on the fin plate, as shown in Fig. 15, the rotation of the purlin becomes:
418 ( 1 4 )2
1 12 2
1 1
2 cos sin 22 sin cos 2
HC CH HC C
419 According to the previous discussion, the slip of bolts terminates when the line connecting the bottom
420 bolt holes is in the longitudinal direction of the purlin. As the rotation of the purlin is small, it is reasonable
421 to assume that the slip of bolts terminates at φ=0. Thus:
422 ( 1 5 )12 2
1
2HCH C
423 This rotation angle corresponds to a bolt slip-induced vertical displacement, ds, of:
424 ( 1 6 )sd L
425 where L is the distance between the pin support and the connection.
426
427 4.2 Flexural action range
428 Having obtained the bolt slip-induced vertical displacement, the vertical load-displacement response
429 in the flexural action range can be obtained. Based on the experimental observation and discussion, two

18
430 assumptions are made to simplify the calculation. Firstly, the initial stiffness of the purlin-to-connection
431 assembly is evaluated by considering the assembly as a simply supported beam, ignoring the deformation
432 within the connection. Secondly, the vertical resistance during the bolt-slip stage is only contributed by the
433 flexural action, ignoring the contribution of the catenary action in the later flexural-action range.
434 According to the simple beam theory, the initial stiffness of the assembly is:
435 ( 1 7 )e 3
6EIKL
436 The ultimate resistance provided by the flexural action, Ff-u, is reached when the maximum static
437 friction forces between the purlin web and the fin plate are overcome, and is calculated as:
438 ( 1 8 )sf-u
2MFL
439 where Ms is the slip-resisting moment of a bolt group, and is equal to Fs∙H for a connection with only two
440 bolts on each side of the connection, in which Fs is the slip resistance of a bolt for given preloading force
441 and friction coeeficient.
442 Therefore, the bolt-slip plateau starts from the displacement of Ff-u/Ke, and finishes at the displacement
443 of ds.
444
445 4.3 Catenary action range
446 A component-based spring model is developed for determining the vertical load-displacement
447 response of the purlin-to-connection assembly in the catenary-action range. An assumption is made herein
448 that the vertical resistance in the catenary range is solely provided by the catenary action, which is
449 reasonable because the flexural resistance contributes to a very small percentage of the total resistance in
450 this range. Thus, the spring model only accounts for the axial behaviour of the purlin-to-connection
451 assembly. Moreover, the symmetry of the assembly permits modelling only half of the assembly. Figure 16
452 presents the spring model developed for an assembly with two bolts on each side of the connection, i.e., all
453 the specimens tested in this study except for Specimen 3. In this model, the axial behaviour of the purlin is

19
454 modelled with an elastic spring, (p), while the bolt in shear, the purlin-to-bolt in bearing, and the fin plate-
455 to-bolt in bearing components are modelled with bilinear springs, (bs), (pb) and (fb), respectively, in order
456 to capture the gradual yielding and failure characteristic of these components.
457 Normally, the same components in the top and bottom spring series, for example, the two bolt in shear
458 components, follow an identical force-displacement rule. This however is not true for this catenary action
459 model, because when the catenary action starts, the previous bolt-slip behaviour has created different
460 contact conditions for the bolts at different bolt rows, as shown in the box in Fig. 16. At the bottom bolt,
461 pairs of longitudinal contact have already been established. At the top bolt, to establish similar pairs of
462 contact, the purlin has to travel a distance of C2, which is smaller than 2C1, the diameter of the circle forming
463 the moving path of the bolt hole centre on the purlin web. For the sake of simplicity, but without loss of
464 generality, C2 is assumed to have a constant value of of the circle diameter, i.e., C2= C1=C. Therefore, 23
43
465 all components at the top bolt row are only activated when a displacement of C2 is reached, as shown in
466 Fig. 16.
467 Having determined the force-displacement rule for each component, using experimental data or
468 provisions in design codes of Eurocode 3 Part 1-8 [16], the axial force-displacement (Fa-Δa) relationship of
469 the spring model can be obtained by simply assembling the springs, i.e., springs in parallel are subject to
470 an identical displacement, while springs in series are subject to an identical force. When a component fails
471 by reaching the ultimate strength, the resistance contributed by the bolt row where the failed component
472 belongs to is subtracted from the total resistance, and the calculation proceeds until the failure of all bolt
473 rows.
474 Then, the vertical displacement d, and the vertical resistance, F, can be calculated from Eq. (19) and
475 Eq. (20), respectively, which are based on the simplified geometrical relationship shown in Fig. 17.
476 (19)2 2 2 22s a a sd d L d
477 ( 2 0 )2 2
2 adF F
d L

20
478
479 5. Model validation
480 For the purpose of validation, the above proposed theoretical model is applied to the tests reported in
481 Sections 2 and 3, except for Specimen S5 in which contact occurred between the purlin and the loading
482 column, creating a bolt-slip behaviour which was quite different from the theoretical model.
483 Seeing the bolt in shear, purlin-to-bolt in bearing and fin plate-to-bolt in bearing components all
484 contribute to the plastic deformation, these three components are all modelled with springs with full-range
485 bi-linear force-displacement relationships, as shown in Fig. 16. The initial stiffness, Ke, and the ultimate
486 strength, Pu, of each component are calculated according to Eurocode 3 Part 1-8 [16], and the elastic limit
487 strength, Py, is estimated by using the same equations for calculation of Pu, in which however the ultimate
488 tensile strength (fu) is replaced with the yield stress (fy). The plastic stiffness of a component is assumed to
489 be a fixed percentage of the initial stiffness, which is adopted as γ=5% for all three components. This
490 percentage value is close to that used in [17, 18]. The purlin is modelled with an elastic spring, the stiffness
491 of which is determined as =EA/L. Table 4 summarises the properties of each component. 𝐾pe
492 Using the above component properties, the axial force-displacement relationship of the connection can
493 be determined, as shown in Figure 18 in which Specimen S1 is taken as an example. Note that the forces
494 that cause the yielding of the purlin-to-bolt in bearing component and the yielding of the fin plate-to-bolt
495 in bearing component are very close, and therefore, for simplicity, these two components are approximated
496 to yield under the same force of 38.1 kN.
497 Figure 19 shows the model predictions as well as the comparisons against the experimental results. It
498 is observed the proposed model is capable of capturing the experimental phenomena, including the slip of
499 bolts, the yielding and failure of components, and thus gives reasonably good predictions on the force-
500 displacement curves, the failure modes and the failure loads. Some discrepancy is observed for Specimens
501 S3 and S8. However, the response of Specimen S3 prior to the first failure is well captured, and the
502 discrepancy for Specimen S8 most likely results from a less accurate force-displacement assumption for

21
503 the bolt in bearing components derived from Eurocode 3. Thus, the presented model is considered adequate
504 for the design of purlin connections against progressive collapse.
505
506 6. Conclusion
507 This paper presents a comprehensive investigation of the bolted fin-plate purlin connections, studying
508 their performance under a main truss removal scenario.
509 Eight purlin-to-connection assemblies with varied connection details were tested. The specimens
510 showed several common characteristics. An elastic initial response was observed, which was contributed
511 by the flexural action of the assembly. As the flexural action grew, it generated slip-resistance demands
512 greater than the maximum static friction forces at the bolts, leading to the slip of bolts. During this period,
513 the flexural action remained almost unchanged and negligible catenary action developed. After effective
514 contact was established between the bolt shaft and the bolt holes along the purlin length, catenary action
515 was activated, leading to a rapid increase of the axial tension force, which contributed to the major vertical
516 resistance.
517 Differences in response were observed in the specimens due to the varied connection details. Most
518 importantly, different failure modes were resulted from the use of bolts with different shear strengths. If the
519 bolt shear strength was smaller than the bolt bearing strength, the connection failed in a bolt shear failure
520 mode. Otherwise, the connection showed a failure mode that was characterised by the bolt bearing failure
521 combined with the net-section tensile failure. The latter failure mode provided much greater ductility and
522 was capable of sustaining considerably greater vertical load. Meanwhile, the height and location of the bolt
523 group, the gap between the purlin flange and the main truss, as well as the preloading force in the bolts, all
524 influenced the performance of the purlin connection. From the standpoint of increasing the bridging
525 capacity of the purlin, it is recommended to adopt relatively larger diameter bolts, reduce the height of the
526 bolt group, apply higher preloading force when installing the bolts, and increase the end distance for the
527 bolt holes.

22
528 A theoretical model is proposed to predict the behaviour of the purlin-to-connection assembly. The
529 initial elastic response is obtained using simple beam theory and the equilibrium of moment. The bolt slip-
530 induced vertical displacement is evaluated through a mathematical bolt-slip model, which characterises the
531 slip of bolts inside the corresponding bolt holes. The catenary action is estimated using a spring-based
532 model, in which the connection components, including the bolt in shear, the purlin-to-bolt in bearing, and
533 the fin plate-to-bolt in bearing components, are modelled with bi-linear force-displacement relationships,
534 such that the catenary model is capable of capturing the gradual yielding and failure of the connection
535 components. Fairly good agreement is observed between the model predictions and the experimental results,
536 in terms of both the vertical resistance-displacement curves and the failure modes, as well as the failure
537 loads.
538
539 Acknowledgement
540 The work presented in this paper was funded by the National Natural Science Foundation of China
541 through Grant No. 51678432, and by the Australian Research Council through Discovery Project Grant No.
542 DP150104873.
543
544 References
545 [1] Izzuddin BA, Vlassis AG, Elghazouli AY, Nethercot DA. Progressive collapse of multi-storey buildings
546 due to sudden column loss - Part I: Simplified assessment framework. Eng Struct 2008, 30(5): 1308–
547 1318.
548 [2] Yi W, He Q, Xiao Y, Kunnath SK. Experimental study on progressive collapse-resistant behavior of
549 reinforced concrete frame structures. ACI Struct J 2008, 105(4): 433–439.
550 [3] Kim J, Kim T. Assessment of progressive collapse-resisting capacity of steel moment frames. J Constr
551 Steel Res 2009, 65(1): 169–179
552 [4] Zhao X, Yan S, Chen Y. Comparison of progressive collapse resistance of single-layer latticed domes
553 under different loadings. J Constr Steel Res 2017, 129: 204-214.

23
554 [5] Xu Y, Han Q, Parke GAR, Liu Y. Experimental study and numerical simulation of the progressive
555 collapse resistance of single-layer latticed domes. J Struct Eng 2017, 143(9): 04017121.
556 [6] Yan S, Zhao X, Rasmussen KJR, Zhang H. Identification of critical members for progressive collapse
557 analysis of single-layer latticed domes. Eng Struct 2019, 188: 111-120.
558 [7] Zhao X, Yan S, Chen Y, Xu Z, Lu Y. Experimental study on progressive collapse-resistant behavior of
559 planar trusses. Eng Struct 2017, 135: 104-116.
560 [8] Yan S, Zhao X, Lu Y. Collapse-resisting mechanisms of planar trusses following sudden member loss.
561 J Struct Eng, 2017, 143(9): 04017114.
562 [9] Yan S, Zhao X, Chen Y, Xu Z, Lu Y. A new type of truss joint for prevention of progressive collapse.
563 Eng Struct 2018, 167: 203-213.
564 [10] Chen Y, Zhao X, Wang L, Yan S. Progressive collapse of large span truss-beam structures induced by
565 initial member break. IABSE Workshop on Safety, Robustness and Condition Assessment of Structures,
566 Helsinki, Finland, 2015: 112-119.
567 [11] Yang B, Tan KH. Experimental tests of different types of bolted steel beam-columns joints under a
568 central-column-removal scenario. Eng Struct 2013, 54: 112–130.
569 [12] Li L, Wang W, Chen Y, Lu Y. Experimental investigation of beam-to-tubular column moment
570 connections under column removal scenario. J Constr Steel Res 2013, 88: 244–255.
571 [13] Gong Y. Test, modeling and design of bolted-angle connections subjected to column removal. J Constr
572 Steel Res 2017, 139: 315–326.
573 [14] Liu C, Tan KH, Fung TC. Investigations of nonlinear dynamic performance of top-and-seat with web
574 angle connections subjected to sudden columns removal. Eng Struct 2015, 99: 449–461.
575 [15] ANSI/AISC 360-10. Specification for structural steel buildings. American Institute of Steel
576 Construction; 2010.
577 [16] CEN Comité Européen de Normalisation. 1993-1-8: Eurocode 3: design of steel structures – part 1–8:
578 Design of joints. Brussels (Belgium): CEN; 2010.

24
579 [17] Simões Da Silva L, Santiago A, Vila Real P, Post-limit stiffness and ductility of endplate beam-to-
580 column steel joints. Comput Struct 2002, 80: 515–531.
581 [18] Zhu C, Rasmussen KJR, Yan S. Generalised component model for structural steel joints. J Constr Steel
582 Res 2019, 153: 330–342.

Figures
(a) (b)
Fig. 1. Purlin connection. (a) using angle; (b) using stiffened fin plate.
Fig. 2. Specimen design considerations.
Purlin
Angle
Angle
Main truss
Purlin
Stiffened fin plate Stiffened fin plate
Main truss
Removed roof trussContact may occur
Joint AJoint B
N
M
M
N
Load
Test specimenLoad
Purlin-to-connection-to-purlin assembly

Fig. 3. Geometry of test specimens.
Fig. 4 Test setup.
215 21510
Purlin
Fin plate
H
S
GLoading column
6000
H300x150x4.5x6
60
30 42 42 30
6150
Stiffener

Fig.5. Experimental instrumentation arrangement.
Fig. 6. Behaviour of Specimen S1. (a) Vertical load-connection displacement curve; (b) experimental
phenomena.
900
D1D3 D2 D4D5D6D7 D4 D5 D6D11
D12
D13
D14
L1
L1
L2 L3
L2 L3
R1
R1
R2
R2
R3
R3
600 600 600 600 600 600 900
200 200 200
900 1700 200 400 200 1700 90035 80 35
35 80 35
7575
7575
L1-L1L3-L3R1-R1R2-R2R3-R3
L2-L2
20 8020 20 20
2080
20 2020
30x1
0
Strain gauges

Fig. 7. Behaviour of Specimens S2 and S3. (a) Vertical load-connection displacement curves; (b)
experimental phenomena.
Fig. 8. Behaviour of Specimens S4 and S5. (a) Vertical load-connection displacement curves; (b)
experimental phenomena.

Fig. 9. Behaviour of Specimens S6 and S7. (a) Vertical load-connection displacement curves; (b)
experimental phenomena.
Fig. 10. Behaviour of Specimens S8. (a) Vertical load-connection displacement curves; (b) experimental
phenomena.
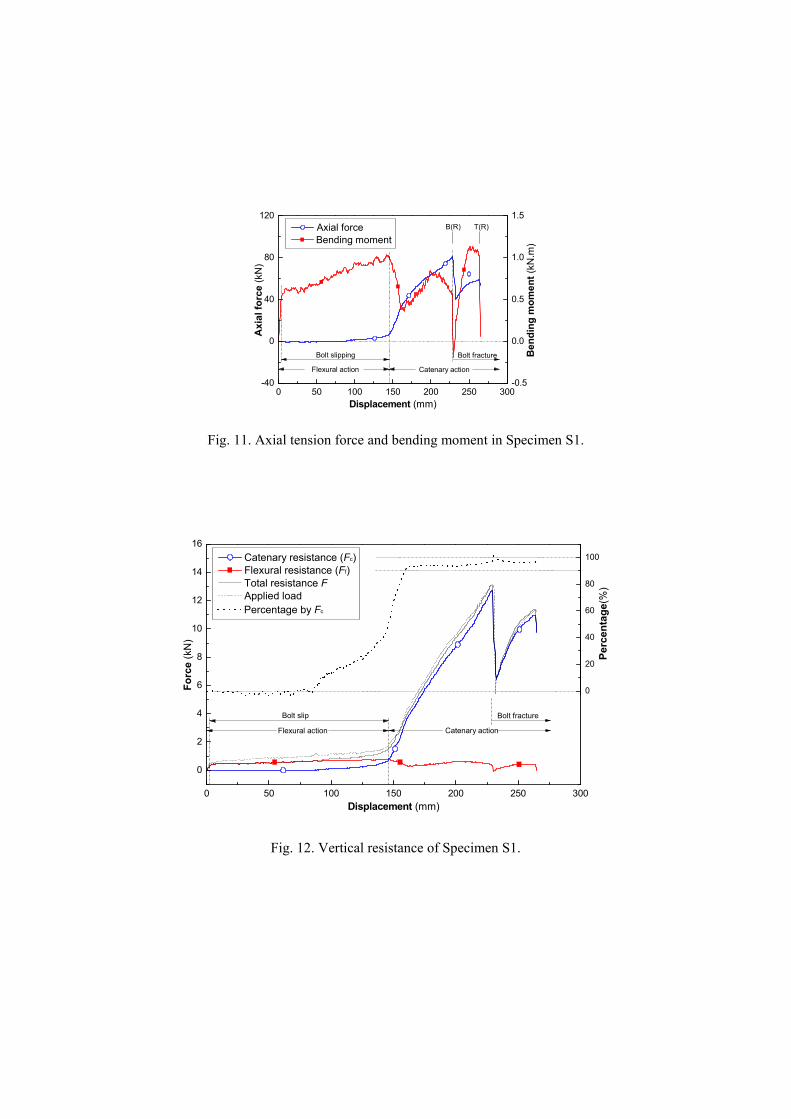
Fig. 11. Axial tension force and bending moment in Specimen S1.
Fig. 12. Vertical resistance of Specimen S1.
0 50 100 150 200 250 300-40
0
40
80
120 Axial force
A
xia
l fo
rce
(kN
)
Displacement (mm)
-0.5
0.0
0.5
1.0
1.5
Bolt slipping
Catenary actionFlexural action
Bending moment
Ben
din
g m
om
ent
(kN
.m)
T(R)B(R)
Bolt fracture
0 50 100 150 200 250 300
0
2
4
6
8
10
12
14
16
Catenary resistance (Fc) Flexural resistance (Ff) Total resistance F Applied load
F
orc
e (k
N)
Displacement (mm)
Bolt slip
Catenary actionFlexural action
Bolt fracture
-60
-40
-20
0
20
40
60
80
100
Percentage by FcP
erce
nta
ge
(%)

(a) (b)
Fig. 13. Vertical resistance of specimens S3 and S8. (a) S3; (b) S8.
Fig. 14. Slip of bolts in bolt holes.
0 50 100 150 200 250 300
0
2
4
6
8
10 Fc
Ff
F
orc
e (
kN)
Displacement (mm)
-40
-20
0
20
40
60
80
100
120
Pct. by Fc
Per
cen
tag
e (
%)
0 50 100 150 200 250 300 350 400 450
0
10
20
30
40
50
60
70
Fc
Ff
F
orc
e (
kN)
Displacement (mm)
-40
-20
0
20
40
60
80
100
120
Pct. by Fc
Per
cen
tag
e (
%)
Bolt
Bolt hole on fin plate
Bolt hole on purlin web
α
Centre of bolt hole on fin plate
Centre of bolt
Centre of bolt hole on purlin web
Contact force on purlin web Contact force
on purlin web
(a) (b) (c)
Contact force on purlin web
Contact force on purlin web
Contact force on purlin web
Contact force on purlin web
Contact force on purlin web

Fig. 15. Calculation model of bolt-slip behaviour.
α
(xT, yT)
(xB, yB) (0, 0)
(0, H)
C1
C1
Path of
Centre of bolt hole on fin plate, position fixed
Centre of bolt hole on purlin web, position moving
Path of
H
x
y
φ
x
φ
y

Fig. 16. Spring model for axial tension of purlin-to-connection assembly.
(bs,1) (pb,1) (fb,1)(p)
(bs,2) (pb,2) (fb,2)
ke
bsFy
F
Δ
ke
bs
bsγbs
bsFu
ke
pbFy
F
Δ
ke
pb
pbγpb
pbFu
ke
fbFy
F
Δ
ke
fb
fbγ fb
fbFu
ke
bsFy
F
Δ
ke
bs
bsγbs
bsFu
C2
ke
pbFy
F
Δ
ke
pb
pbγpb
pbFu
C2
ke
fbFy
F
Δ
ke
fb
fbγ fb
fbFu
C2
Fa, Δa
Purlin web in bearing
Gap to fill before bearing occurs
Path of
Definition of C2
ke
F
Δ
p
Centre of bolt hole on fin plateCentre of bolt hole on purlin web
p: purlinbs: bolt in shearpb: purlin-bolt in bearingfb: fin plate-bolt in bearing
C2 < 2C1

Fig. 17. Calculation of vertical displacement d.
Fig. 18. Force-displacement relationship for Specimen S1 connection.
L
ds
d-ds
F(kN)
1.13 2.10
38.633.6
4.40
42.0
Δ(mm)
F(kN)
3.13 4.10
38.633.6
6.40
42.0
Δ(mm)2.00
F(kN)
38.633.6
73.9
Δ(mm)
80.480.7
Spring series of the top bolt row
Spring series of the bottom
bolt row
Connection

(a) (b)
(c) (d)
(e) (f)
0 50 100 150 200 250 300 3500
2
4
6
8
10
12
14
16
I - Top bolt fractures
I
H
G,H - Bottom bolt fracturesF - Top bolt holes yield under bearingE - Top bolt yields in shearD - Bottom bolt holes yield under bearingC - Top bolt "contact" with bolt holeB - Bottom bolt yields in shearA - Bottom bolt "contacts" with bolt hole
GF
E
DCB
A
(213,11.0)
(229,13.1)
Test Model
F
orc
e (k
N)
Displacement (mm)0 50 100 150 200 250 300 350
0
2
4
6
8
10
12
14
16
I
H
I - Top bolt fractures(180,9.3)(160,9.4)
Test Model
F
orc
e (k
N)
Displacement (mm)
A BC
D
E
FG
G,H - Bottom bolt fracturesF - Top bolt holes yield under bearingE - Top bolt yields in shearD - Bottom bolt holes yield under bearingC - Top bolt "contact" with bolt holeB - Bottom bolt yields in shearA - Bottom bolt "contacts" with bolt hole
0 50 100 150 200 250 300 3500
2
4
6
8
10
12
14
16
O - Top bolt fracturesM,N - 3rd bolt from bottom fracturesK,L - 2nd bolt from bottom fracturesJ - Top bolt yields in shear
ON
M
L
KJ
I
G - 3rd bolt from bottom yields in shearF - Top bolt "contacts" with bolt holeE - 2nd bolt from bottom yields in shearD - 3rd bolt from bottom "contacts" with bolt holeC - Bottom bolt yields in shear
H(136,5.2)
(132,5.0)
Test Model
F
orc
e (
kN)
Displacement (mm)
H,I - Bottom bolt fractures
B - 2nd bolt from bottom "contacts" with bolt holeA - Bottom bolt "contacts" with bolt hole
A
B C DE
FG
0 50 100 150 200 250 300 3500
2
4
6
8
10
12
14
16
(207,11.2)
(239,12.5)
Test Model
F
orc
e (
kN)
Displacement (mm)
A
CD
B
E
FG
G,H - Bottom bolt fracturesF - Top bolt holes yield under bearingE - Top bolt yields in shearD - Bottom bolt holes yield under bearingC - Top bolt "contact" with bolt holeB - Bottom bolt yields in shearA - Bottom bolt "contacts" with bolt hole
HI
I - Top bolt fractures
0 50 100 150 200 250 300 3500
2
4
6
8
10
12
14
16(235,14.5)
(207,13.9)
Test Model
F
orc
e (k
N)
Displacement (mm)
A
BDC
EF
G
G,H - Bottom bolt fracturesF - Top bolt holes yield under bearingE - Top bolt yields in shearD - Bottom bolt holes yield under bearingC - Top bolt "contact" with bolt holeB - Bottom bolt yields in shearA - Bottom bolt "contacts" with bolt hole
H
I
I - Top bolt fractures
0 50 100 150 200 250 300 3500
2
4
6
8
10
12
14
16
(213,11.0)
(204,13.1)
Test Model
F
orc
e (k
N)
Displacement (mm)
A
BD
C
E
FG
G,H - Bottom bolt fracturesF - Top bolt holes yield under bearingE - Top bolt yields in shearD - Top bolt "contact" with bolt holeC - Bottom bolt holes yield under bearingB - Bottom bolt yields in shearA - Bottom bolt "contacts" with bolt hole
I - Top bolt fractures
H
I

(g)
Fig. 19. Vertical force-displacement response predicted by the proposed model. (a) Specimen S1; (b)
Specimen S2; (c) Specimen S3; (d) Specimen S4; (e) Specimen S6; (f) Specimen S7; (g) Specimen S8.
0 50 100 150 200 250 300 350 400 4500
10
20
30
40
50
60
70
(289,23.4)
(400,61.3)
Test Model
F
orc
e (k
N)
Displacement (mm)
AB C
D
E
A - Bottom bolt "contacts" with bolt holeB - Bottom bolt holes yield under bearingC - Top bolt "contact" with bolt holeD - Top bolt holes yield under bearingE - Bottom bolt holes fracture

Tables
Table 1. General feature of specimens (refer Fig.3 for nomenclature).
Height of bolt group
Location of centre of bolt group
Gap between purlin and loading column
Bolt grade
Bolt diameter
Number of bolts Preload
H S GSpecimen
(mm) (mm) (mm) (mm) (kN)
S1 70 150 30 8.8 12 2 20
S2 150 150 30 8.8 12 2 20
S3 150 150 30 4.8 12 4 20
S4 70 105 30 8.8 12 2 20
S5 70 105 5 8.8 12 2 20
S6 70 150 30 4.8 18 2 20
S7 70 150 30 8.8 12 2 30
S8 70 150 30 8.8 18 2 20
Table 2 Material properties
Yield stress Tensile strength Elongation
fy (MPa) fu (MPa) δ (%)
Purlin flange 374 472 39%
Purlin web 296 468 42%
Fin plate 300 484 46%

Table 3. Summary of experimental results.
First peak UltimateResistance Displacement Resistance Displacement
Displacement induced by bolt slipSpecimen Failure mode
(kN) (mm) (kN) (mm) (mm)
S1 BSF 13.1 229 13.1 229 144
S2 BSF 9.40 160 9.89 316 70
S3 BSF 5.02 132 9.65 213 101
S4 BSF 12.5 239 12.5 239 136
S5 BSF 13.0 157 13.0 157 31
S6 BSF 13.9 207 13.9 207 118
S7 BSF 13.1 204 13.1 204 127
S8 BBF & NTF 61.3 400 61.3 400 106
Note: BSF – bolt shear failure; BBF – bolt bearing failure; NTF – net-section tensile failure.

Table 4. Summary of component properties.
Component Ke(N/mm) γ Fy
(kN)Fu
(kN)
Purlin 212,000 − − −
Bolt in shear 120,000 0.05 33.6 42.0
Purlin-bolt in bearing 71,100 0.05 38.1 60.2Grade 8.8 M12 bolt
Fin plate-bolt in bearing 88,200 0.05 38.6 62.2
Bolt in shear 60,500 0.05 17.0 21.2
Purlin-bolt in bearing 71,100 0.05 35.9 56.7Grade 4.8 M12 bolt
Fin plate-bolt in bearing 88,200 0.05 38.6 62.2
Bolt in shear 269,000 0.05 76.5 95.6
Purlin-bolt in bearing 90,000 0.05 40.0 63.2Grade 8.8 M18 bolt
Fin plate-bolt in bearing 108,000 0.05 40.5 65.3
Bolt in shear 136,000 0.05 38.7 48.4
Purlin-bolt in bearing 90,000 0.05 40.0 63.2Grade 4.8 M18 bolt
Fin plate-bolt in bearing 108,000 0.05 40.5 65.3