BEHAVIOUR OF DEBT: AN EMPIRICAL...
10
Volume 4, Number 3, July – September’ 2015 ISSN (Print):2319-9059, (Online):2319-9067 PEZZOTTAITE JOURNALS SJ IF (2012): 3.946, SJ IF (2013): 5.017, SJ IF (2014): 5.912 International Journal of Trade & Global Business Perspectives© Pezzottaite Journals. 1835 | Page BEHAVIOUR OF DEBT: AN EMPIRICAL ANALYSIS Gurnam Singh Rasoolpur 10 ABSTRACT This empirical paper makes an attempt to study the behaviour of debt through a case of Dunlop India Ltd. from the tyres & tubes industry of the Indian corporate sector by studying its impact either favourable or unfavourable on the profitability of the company by comparing rate of return on net assets (ROI bt2 & ROI at2 ) with cost of debt (Kd bt & Kd at ) on before and after tax basis during the period under study which covers a time period of nine years extending from the year 1983 to 1991-92 for the purpose of our study. Thus, the present empirical study is confined to Dunlop India Ltd. from the tyres & tubes industry of the Indian corporate sector, which is lying in the top ten companies of tyres & tubes industry of the Indian corporate sector based on sales for the year 1991-92 for the purpose of our study. The study reveals that debt-equity ratio 2 has been varying from 42.97 percent in the 1985 to 22.45 percent in the year 1987-88 during the period under study, whereas, aggregate debt- equity ratio 2 of the company is worked out 30.84 percent during the period under study. It is found that cost of debt on before tax basis (Kd bt ) has been varying from 15.16 percent in year 1985 to 21 percent in the years 1987-88 while cost of debt on after tax basis (Kd at ) has been varying from 17 percent in year 1984 to 7 percent in the year 1990-91 over the period under study. It is found that rate of return on net assets on before tax basis (ROI bt2 ) has been declining over the period under study excepting for the year 1986-87 when it is 21 percent while rate of return on net assets on after tax basis (ROI at2 ) has been declining over the period under study excepting for the years 1985 and 1986-87 when it is 12.53 percent and 17 percent respectively over the study period. It is observed that rate of return on total networth on before tax basis (RON bt ) has been declining and witnessing a deep decline in the years in 1984 and 1991-92 when it is 2.92 percent and 2.07 percent, respectively, excepting for the year 1986-87 when it is 23 percent while rate of return on total networth on after tax basis (RON at ) has also been declining and witnessing a deep decline in the years in 1984, 1990-91 and 1991-92 when it is 3 percent, 2 percent and 0.96 percent, respectively, excepting for the years 1985 and 1986-87 when it is 12.21 percent and 18 percent, respectively, over the period under study. Thus, it is concluded that the company is suffering from unfavourable leverage with regard to use of debt during eight out of nine years under study. Consequently, rate of return on total networth (RON bt & RON at ) is less than from cost of debt (Kd bt & Kd at ) and rate of return on net assets (ROI bt2 & ROI at2 ) on before and after tax basis in the above said eight years under study. It means that use of debt in the capital structure of the company has negative impact on the profitability of the company during eight out of nine years under study, which consequently is not contributing to the total networth of the company, which ultimately is not benefitting to the equity shareholders of the company. However, on aggregate basis, the company has also been experiencing unfavourable leverage with regard to use of debt on before and after tax basis during the period under study. It is also found that spread and net gain are positive when leverage impact is positive and vice-versa during the period under study. KEYWORDS Return on Net Assets, Return on Total Networth, Cost of Debt etc. INTRODUCTION The primary aim of corporate management is to maximize shareholders‘ value and the value of a firm in a legal and ethical manner. So, a financial manager would consider a number of factors to set an optimal capital structure for a firm giving considerable weight to earning rate, collateral value of assets, age, cash flow coverage ratio, non-debt tax shield, size (net sales), dividend payout ratio, debt service ratio, cost of borrowing, corporate tax rate, current ratio, growth rate, operating leverage and uniqueness (selling cost/sales) etc. ―A company can finance its investments through debts/or equity. The company may also use preference capital. The rate of interest on debt is fixed irrespective of the company‘s rate of return on assets. The company has a legal binding to pay interest on debt. The rate of preference dividend is fixed, but preference dividends are paid when the company earns profits. The common shareholders are entitled to the residual income. That is, earnings after interest and taxes (less preference dividends) belong to them. The rate of equity is not fixed and depends on the dividend policy of the company.‖ (Pandey, I. M., 2010, p 317-18). The choice between debt and equity to finance a firm‘s assets involves a trade-off between risk and return (Pandey, Chotigeat & Ranjit, 2000). The excessive use of debt may endanger the survival of a firm, while a conservative use of debt may deprive the firm in leveraging return to equity owners. Therefore, in order to increase the advantage of debt capital and at the same time to save the firm from the financial and other risks, it is desirable to have a reasonable debt equity mix in the total capital structure. Thus, the decision regarding debt equity mix in the capital structure of a firm is of critical importance and has to be approached with a great care. Every time when funds have to be procured, the financial manager weighs 10 Associate Professor (Commerce), P.G. Department of Commerce & Business Management, Guru Nanak College, Punjab, India, [email protected]
-
Upload
trannguyet -
Category
Documents
-
view
217 -
download
2
Transcript of BEHAVIOUR OF DEBT: AN EMPIRICAL...

Volume 4, Number 3, July – September’ 2015
ISSN (Print):2319-9059, (Online):2319-9067
PEZZOTTAITE JOURNALS SJIF (2012): 3.946, SJIF (2013): 5.017, SJIF (2014): 5.912
International Journal of Trade & Global Business Perspectives© Pezzottaite Journals. 1835 |P a g e
BEHAVIOUR OF DEBT: AN EMPIRICAL ANALYSIS
Gurnam Singh Rasoolpur
10
ABSTRACT
This empirical paper makes an attempt to study the behaviour of debt through a case of Dunlop India Ltd. from the tyres &
tubes industry of the Indian corporate sector by studying its impact either favourable or unfavourable on the profitability of
the company by comparing rate of return on net assets (ROIbt2 & ROIat2) with cost of debt (Kdbt & Kdat) on before and after
tax basis during the period under study which covers a time period of nine years extending from the year 1983 to 1991-92 for
the purpose of our study. Thus, the present empirical study is confined to Dunlop India Ltd. from the tyres & tubes industry of
the Indian corporate sector, which is lying in the top ten companies of tyres & tubes industry of the Indian corporate sector
based on sales for the year 1991-92 for the purpose of our study. The study reveals that debt-equity ratio2 has been varying
from 42.97 percent in the 1985 to 22.45 percent in the year 1987-88 during the period under study, whereas, aggregate debt-
equity ratio2 of the company is worked out 30.84 percent during the period under study. It is found that cost of debt on before
tax basis (Kdbt) has been varying from 15.16 percent in year 1985 to 21 percent in the years 1987-88 while cost of debt on
after tax basis (Kdat) has been varying from 17 percent in year 1984 to 7 percent in the year 1990-91 over the period under
study. It is found that rate of return on net assets on before tax basis (ROIbt2) has been declining over the period under study
excepting for the year 1986-87 when it is 21 percent while rate of return on net assets on after tax basis (ROIat2) has been
declining over the period under study excepting for the years 1985 and 1986-87 when it is 12.53 percent and 17 percent
respectively over the study period. It is observed that rate of return on total networth on before tax basis (RONbt) has been
declining and witnessing a deep decline in the years in 1984 and 1991-92 when it is 2.92 percent and 2.07 percent,
respectively, excepting for the year 1986-87 when it is 23 percent while rate of return on total networth on after tax basis
(RONat) has also been declining and witnessing a deep decline in the years in 1984, 1990-91 and 1991-92 when it is 3
percent, 2 percent and 0.96 percent, respectively, excepting for the years 1985 and 1986-87 when it is 12.21 percent and 18
percent, respectively, over the period under study. Thus, it is concluded that the company is suffering from unfavourable
leverage with regard to use of debt during eight out of nine years under study. Consequently, rate of return on total networth
(RONbt & RONat) is less than from cost of debt (Kdbt & Kdat) and rate of return on net assets (ROIbt2 & ROIat2) on before and
after tax basis in the above said eight years under study. It means that use of debt in the capital structure of the company has
negative impact on the profitability of the company during eight out of nine years under study, which consequently is not
contributing to the total networth of the company, which ultimately is not benefitting to the equity shareholders of the
company. However, on aggregate basis, the company has also been experiencing unfavourable leverage with regard to use of
debt on before and after tax basis during the period under study. It is also found that spread and net gain are positive when
leverage impact is positive and vice-versa during the period under study.
KEYWORDS
Return on Net Assets, Return on Total Networth, Cost of Debt etc.
INTRODUCTION
The primary aim of corporate management is to maximize shareholders‘ value and the value of a firm in a legal and ethical
manner. So, a financial manager would consider a number of factors to set an optimal capital structure for a firm giving
considerable weight to earning rate, collateral value of assets, age, cash flow coverage ratio, non-debt tax shield, size (net sales),
dividend payout ratio, debt service ratio, cost of borrowing, corporate tax rate, current ratio, growth rate, operating leverage and
uniqueness (selling cost/sales) etc. ―A company can finance its investments through debts/or equity. The company may also use
preference capital. The rate of interest on debt is fixed irrespective of the company‘s rate of return on assets. The company has a
legal binding to pay interest on debt. The rate of preference dividend is fixed, but preference dividends are paid when the
company earns profits. The common shareholders are entitled to the residual income. That is, earnings after interest and taxes (less
preference dividends) belong to them. The rate of equity is not fixed and depends on the dividend policy of the company.‖
(Pandey, I. M., 2010, p 317-18). The choice between debt and equity to finance a firm‘s assets involves a trade-off between risk
and return (Pandey, Chotigeat & Ranjit, 2000). The excessive use of debt may endanger the survival of a firm, while a
conservative use of debt may deprive the firm in leveraging return to equity owners. Therefore, in order to increase the advantage
of debt capital and at the same time to save the firm from the financial and other risks, it is desirable to have a reasonable debt
equity mix in the total capital structure. Thus, the decision regarding debt equity mix in the capital structure of a firm is of critical
importance and has to be approached with a great care. Every time when funds have to be procured, the financial manager weighs
10
Associate Professor (Commerce), P.G. Department of Commerce & Business Management, Guru Nanak College, Punjab, India,

Volume 4, Number 3, July – September’ 2015
ISSN (Print):2319-9059, (Online):2319-9067
PEZZOTTAITE JOURNALS SJIF (2012): 3.946, SJIF (2013): 5.017, SJIF (2014): 5.912
International Journal of Trade & Global Business Perspectives© Pezzottaite Journals. 1836 |P a g e
the pros and cons of various sources of finance and selects the most advantageous sources keeping in view the target capital
structure. Thus, the capital structure decision is a continuous one and has to be taken whenever a firm needs additional finances.
As the objective of a firm should be directed towards the maximization of the value of the firm, the capital structure, or leverage,
decision should be examined from the point of view of its impact on the value of the firm. If capital structure or financing
decision, a firm can affect the value of the firm would like to have a capital structure, which maximizes the market value of the
firm. Therefore, the financial manager should plan an optimum capital structure for his company. The optimum capital structure is
obtained when the market value per share is maximum. Capital structure is the mix of debt, equity and preference securities that
are used to finance a company‘s assets. However, the choice between debt and equity from the point of view of shareholders and
lenders is an important one and it will be useful to list the special advantages of either form of capital relative to the other. The
greater use of debt, where the interest rate is lower than the average rate of return on the investment, increases the net return to
equity shareholders. Higher debt does not impair the control of shareholders over the enlarged operations of the firm. Debt is
cheaper source of finance, cost of debt is lower than cost of preference share capital as well as equity share capital because debt
holders‘ first claim on the firm‘s assets at time of its liquidation, payment of interest before any dividend is paid to preference and
equity shareholders, and interest is an item chargeable to profits of a firm. Deductibility of the interest on debt before computing
profits charge to tax, as against payment of dividends out of profits after tax, implies an effective lowering of the tax rate on a firm
more or less in proportion to the extent to which debt is substituted for equity in the company is financing pattern. However, it is
not desirable to resort to excessive debt financing because the excessive proportion of debt in the capital structure increases the
financial risks of the firm. This is because debt being a contractual obligation. The same along with interest must be paid out
ultimately. Any failure in doing so shall result in technical insolvency if not a real one. Further, the use of debt capital will not
automatically improve the overall return of the firm. It will increase the return if the firm‘s rate of return on assets is higher than
the cost of debt capital. Therefore, in order to increase the advantage of debt capital and at the same time to save the firm from the
financial and other risks, it is desirable to have a reasonable debt equity mix in the total capital structure. Thus, the decision
regarding debt equity mix in the capital structure of a firm is of critical one and has to be approached with a great care initially at
the time of promotion and, subsequently, whenever funds have to be raised to finance investments by the firm.
OBJECTIVES OF STUDY
The present study has the following objectives:
To measure the extent of debt-equity ratio of Dunlop India Ltd. from the tyres & tubes industry of the Indian corporate
sector.
To examine the impact of use and cost of debt on the profitability of Dunlop India Ltd. of tyres & tubes industry from
the Indian corporate sector.
DATA SOURCE & SAMPLE SIZE
For studying the behaviour of debt in the tyres & tubes industry of the Indian corporate sector, Dunlop India Ltd. from this
industry is selected. The study covers a time of nine years extending from the year 1983 to 1991-92 for the purpose of our
research paper. The company is lying in the top ten companies of tyres & tubes industry of the Indian corporate sector based on
sales for the year 1991-92 for the purpose of this study. For conducting the present study, data has been compiled from the
different volumes of the Bombay Stock Exchange Official Directory.
RESEARCH METHODOLOGY
In the present study, a maiden attempt has been made to make an in-depth analysis of the behaviour of debt through a case of
Dunlop India Ltd. from tyres & tubes industry of the Indian corporate sector. To analyses the results, analysis of empirical section
is organized into four parts. In the first part, analysis of debt-equity ratio is done. The second part explains the analysis of return
on investment and cost of debt on before tax basis. The third part gives details of the analysis of return on investment and cost of
debt on after tax basis. In the fourth part, impact of debt on return on total networth is presented. In this work, profitability means
return on total networth over the period under study. Return on net total assets, which is calculated and is shown in the research
methodology, is supplementary information, which further means that it is not a part for approaching and reaching to the
conclusions of the main study. To analyses the data, the following ratios along with simple statistical tools like tables, percentages,
etc. have been used for achieving the objectives of present study.
Debt-Equity Ratio: It can be calculated in the following manner
Debt-Equity Raio1 =
Debt-Equity Raio2 =

Volume 4, Number 3, July – September’ 2015
ISSN (Print):2319-9059, (Online):2319-9067
PEZZOTTAITE JOURNALS SJIF (2012): 3.946, SJIF (2013): 5.017, SJIF (2014): 5.912
International Journal of Trade & Global Business Perspectives© Pezzottaite Journals. 1837 |P a g e
Return on Total Networth: It is calculated in the following manner
Return on Total Networth on Before Tax Basis (RONbt) =
Return on Total Networth on After Tax Basis (RONat) =
Return on Net Total Assets: It is calculated in the following manner
Return on Net Total Assets on Before Tax Basis (ROIbt1) =
Return on Net Total Assets on After Tax Basis (ROIat1) = ROIbt1(1-t)
Return on Net Assets: It is calculated in the following manner
Return on Net Assets on Before Tax Basis (ROIbt2) =
Return on Net Assets on After Tax Basis (ROIat2) = ROIbt2(1-t)
Cost of Debt: The following formula is used to calculate the cost of debt
Cost Debt on Before Tax Basis (Kdbt) =
Cost of Debt on After Tax Basis (Kdat) = Kdbt(1-t)
Net Gain: The following is the formula for calculating the Net Gain
Net Gain on Before Tax Basis = Return on Total Networth (RONbt) - Return on Net Assets (ROIbt)
Net Gain on After Tax Basis = Return on Total Networth (RONat) - Return on Net Assets (ROIat)
Spread: The following is the formula for calculating the Spread
Spread on Before Tax Basis = Return on Net Assets (ROIbt) - Cost of Debt (Kdbt)
Spread on After Tax Basis = Return on Net Assets (ROIat) - Cost of Debt (Kdat)
Effective Tax Rate (t): It is calculated in the following manner
Effective Tax Rate (t) =
Here Term Debt plus Short Term Loans & Advances comprise of debentures, long-term loans and short-term loans & advances.
Total Networth includes equity share capital, preference share capital, capital reserves including share premium and other
reserves & surplus less intangible assets. Intangible Assets include preliminary expenses, expenses on issue of shares and
debentures, goodwill, technical know-how charges, drawings & designs, patents, trade-marks and copyright. While computing
total networth usually accumulated losses are deducted from the aggregate of paid up share capital plus reserves & surplus.
However, in the present study in addition to accumulated losses, goodwill, trademark, patents, & copyright have also been
deducted. It is so because separate amount of accumulated losses is not available in the Bombay Stock Exchange Official
Directory. Total networth has been also adjusted for the accounting year 1988-89 due to the change in the length of accounting
year from 1st of April to 31st of March in the next year. Depreciation, interest charges and profits and/or losses have been
changed proportionately.
Volume 4, Number 3, July – September’ 2015
ISSN (Print):2319-9059, (Online):2319-9067
PEZZOTTAITE JOURNALS SJIF (2012): 3.946, SJIF (2013): 5.017, SJIF (2014): 5.912
International Journal of Trade & Global Business Perspectives© Pezzottaite Journals. 1838 |P a g e
EMPIRICAL RESULTS
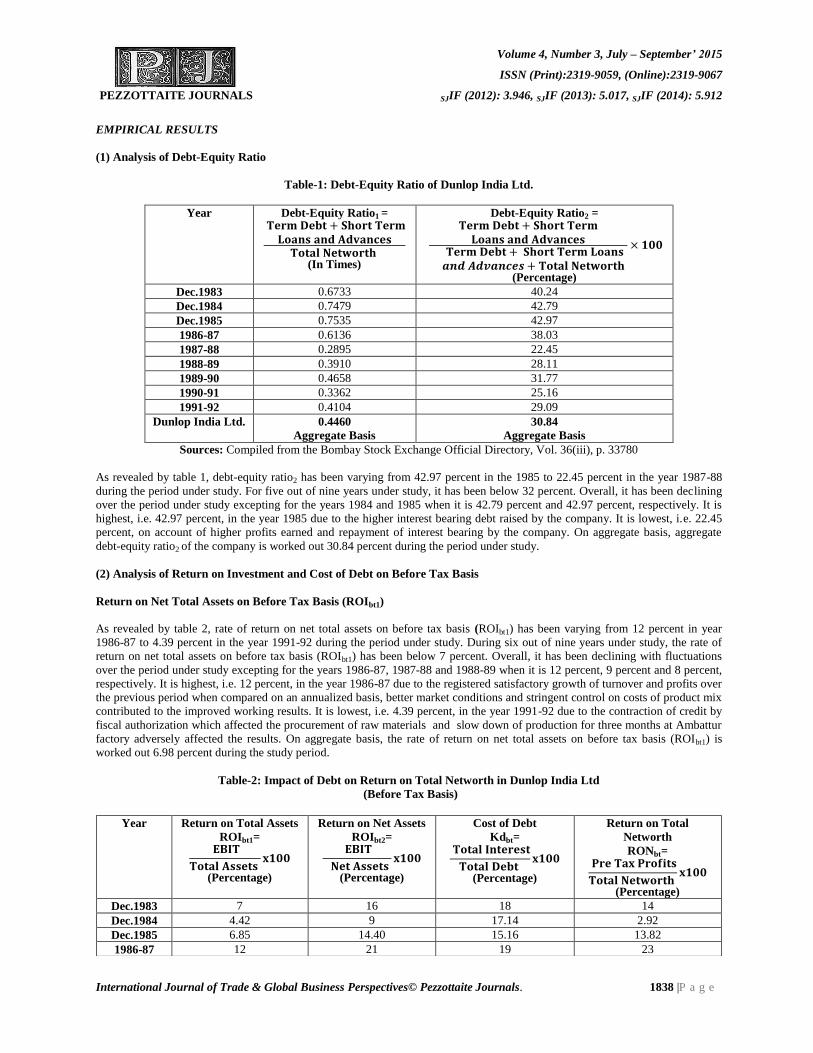
(1) Analysis of Debt-Equity Ratio
Table-1: Debt-Equity Ratio of Dunlop India Ltd.
Year Debt-Equity Ratio1 =
(In Times)
Debt-Equity Ratio2 =
(Percentage)
Dec.1983 0.6733 40.24
Dec.1984 0.7479 42.79
Dec.1985 0.7535 42.97
1986-87 0.6136 38.03
1987-88 0.2895 22.45
1988-89 0.3910 28.11
1989-90 0.4658 31.77
1990-91 0.3362 25.16
1991-92 0.4104 29.09
Dunlop India Ltd. 0.4460
Aggregate Basis
30.84
Aggregate Basis
Sources: Compiled from the Bombay Stock Exchange Official Directory, Vol. 36(iii), p. 33780
As revealed by table 1, debt-equity ratio2 has been varying from 42.97 percent in the 1985 to 22.45 percent in the year 1987-88
during the period under study. For five out of nine years under study, it has been below 32 percent. Overall, it has been declining
over the period under study excepting for the years 1984 and 1985 when it is 42.79 percent and 42.97 percent, respectively. It is
highest, i.e. 42.97 percent, in the year 1985 due to the higher interest bearing debt raised by the company. It is lowest, i.e. 22.45
percent, on account of higher profits earned and repayment of interest bearing by the company. On aggregate basis, aggregate
debt-equity ratio2 of the company is worked out 30.84 percent during the period under study.
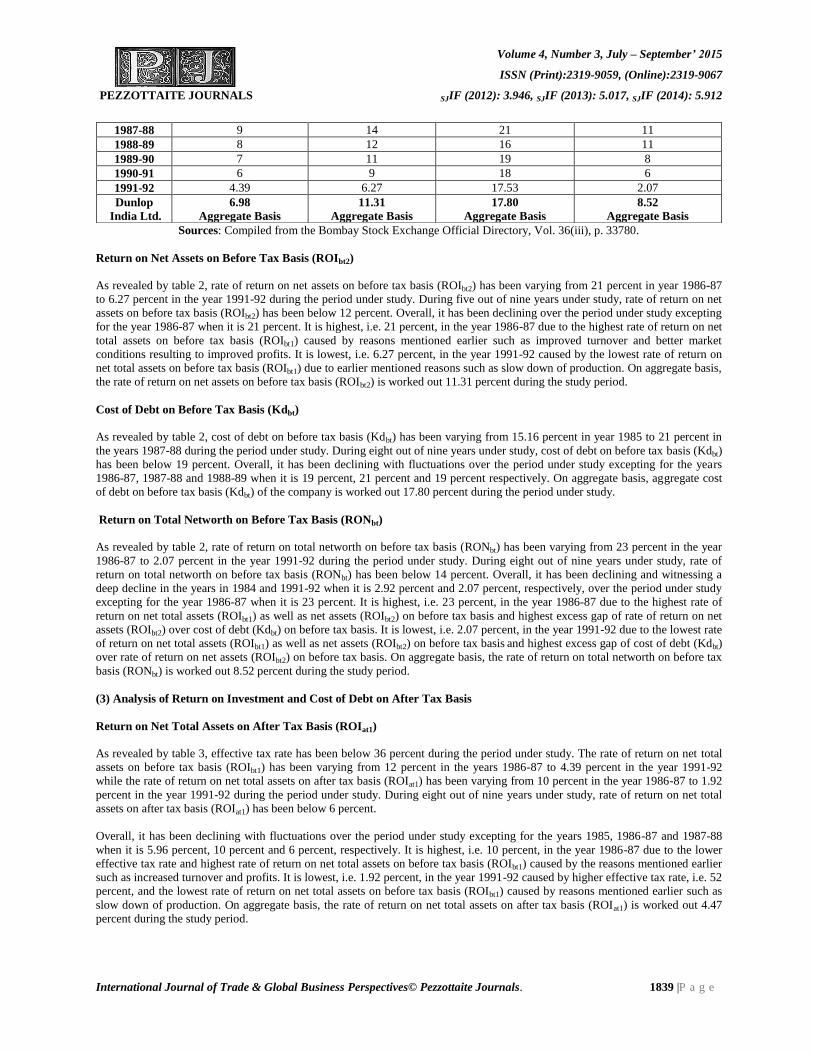
(2) Analysis of Return on Investment and Cost of Debt on Before Tax Basis
Return on Net Total Assets on Before Tax Basis (ROIbt1)
As revealed by table 2, rate of return on net total assets on before tax basis (ROIbt1) has been varying from 12 percent in year
1986-87 to 4.39 percent in the year 1991-92 during the period under study. During six out of nine years under study, the rate of
return on net total assets on before tax basis (ROIbt1) has been below 7 percent. Overall, it has been declining with fluctuations
over the period under study excepting for the years 1986-87, 1987-88 and 1988-89 when it is 12 percent, 9 percent and 8 percent,
respectively. It is highest, i.e. 12 percent, in the year 1986-87 due to the registered satisfactory growth of turnover and profits over
the previous period when compared on an annualized basis, better market conditions and stringent control on costs of product mix
contributed to the improved working results. It is lowest, i.e. 4.39 percent, in the year 1991-92 due to the contraction of credit by
fiscal authorization which affected the procurement of raw materials and slow down of production for three months at Ambattur
factory adversely affected the results. On aggregate basis, the rate of return on net total assets on before tax basis (ROIbt1) is
worked out 6.98 percent during the study period.
Table-2: Impact of Debt on Return on Total Networth in Dunlop India Ltd
(Before Tax Basis)
Year
Return on Total Assets
ROIbt1=
(Percentage)
Return on Net Assets
ROIbt2=
(Percentage)
Cost of Debt
Kdbt=
(Percentage)
Return on Total
Networth
RONbt=
(Percentage)
Dec.1983 7 16 18 14
Dec.1984 4.42 9 17.14 2.92
Dec.1985 6.85 14.40 15.16 13.82
1986-87 12 21 19 23
Volume 4, Number 3, July – September’ 2015
ISSN (Print):2319-9059, (Online):2319-9067
PEZZOTTAITE JOURNALS SJIF (2012): 3.946, SJIF (2013): 5.017, SJIF (2014): 5.912
International Journal of Trade & Global Business Perspectives© Pezzottaite Journals. 1839 |P a g e
Sources: Compiled from the Bombay Stock Exchange Official Directory, Vol. 36(iii), p. 33780.
Return on Net Assets on Before Tax Basis (ROIbt2)
As revealed by table 2, rate of return on net assets on before tax basis (ROIbt2) has been varying from 21 percent in year 1986-87
to 6.27 percent in the year 1991-92 during the period under study. During five out of nine years under study, rate of return on net
assets on before tax basis (ROIbt2) has been below 12 percent. Overall, it has been declining over the period under study excepting
for the year 1986-87 when it is 21 percent. It is highest, i.e. 21 percent, in the year 1986-87 due to the highest rate of return on net
total assets on before tax basis (ROIbt1) caused by reasons mentioned earlier such as improved turnover and better market
conditions resulting to improved profits. It is lowest, i.e. 6.27 percent, in the year 1991-92 caused by the lowest rate of return on
net total assets on before tax basis (ROIbt1) due to earlier mentioned reasons such as slow down of production. On aggregate basis,
the rate of return on net assets on before tax basis (ROIbt2) is worked out 11.31 percent during the study period.
Cost of Debt on Before Tax Basis (Kdbt)
As revealed by table 2, cost of debt on before tax basis (Kdbt) has been varying from 15.16 percent in year 1985 to 21 percent in
the years 1987-88 during the period under study. During eight out of nine years under study, cost of debt on before tax basis (Kdbt)
has been below 19 percent. Overall, it has been declining with fluctuations over the period under study excepting for the years
1986-87, 1987-88 and 1988-89 when it is 19 percent, 21 percent and 19 percent respectively. On aggregate basis, aggregate cost
of debt on before tax basis (Kdbt) of the company is worked out 17.80 percent during the period under study.
Return on Total Networth on Before Tax Basis (RONbt)
As revealed by table 2, rate of return on total networth on before tax basis (RONbt) has been varying from 23 percent in the year
1986-87 to 2.07 percent in the year 1991-92 during the period under study. During eight out of nine years under study, rate of
return on total networth on before tax basis (RONbt) has been below 14 percent. Overall, it has been declining and witnessing a
deep decline in the years in 1984 and 1991-92 when it is 2.92 percent and 2.07 percent, respectively, over the period under study
excepting for the year 1986-87 when it is 23 percent. It is highest, i.e. 23 percent, in the year 1986-87 due to the highest rate of
return on net total assets (ROIbt1) as well as net assets (ROIbt2) on before tax basis and highest excess gap of rate of return on net
assets (ROIbt2) over cost of debt (Kdbt) on before tax basis. It is lowest, i.e. 2.07 percent, in the year 1991-92 due to the lowest rate
of return on net total assets (ROIbt1) as well as net assets (ROIbt2) on before tax basis and highest excess gap of cost of debt (Kdbt)
over rate of return on net assets (ROIbt2) on before tax basis. On aggregate basis, the rate of return on total networth on before tax
basis (RONbt) is worked out 8.52 percent during the study period.
(3) Analysis of Return on Investment and Cost of Debt on After Tax Basis
Return on Net Total Assets on After Tax Basis (ROIat1)
As revealed by table 3, effective tax rate has been below 36 percent during the period under study. The rate of return on net total
assets on before tax basis (ROIbt1) has been varying from 12 percent in the years 1986-87 to 4.39 percent in the year 1991-92
while the rate of return on net total assets on after tax basis (ROIat1) has been varying from 10 percent in the year 1986-87 to 1.92
percent in the year 1991-92 during the period under study. During eight out of nine years under study, rate of return on net total
assets on after tax basis (ROIat1) has been below 6 percent.
Overall, it has been declining with fluctuations over the period under study excepting for the years 1985, 1986-87 and 1987-88
when it is 5.96 percent, 10 percent and 6 percent, respectively. It is highest, i.e. 10 percent, in the year 1986-87 due to the lower
effective tax rate and highest rate of return on net total assets on before tax basis (ROIbt1) caused by the reasons mentioned earlier
such as increased turnover and profits. It is lowest, i.e. 1.92 percent, in the year 1991-92 caused by higher effective tax rate, i.e. 52
percent, and the lowest rate of return on net total assets on before tax basis (ROIbt1) caused by reasons mentioned earlier such as
slow down of production. On aggregate basis, the rate of return on net total assets on after tax basis (ROIat1) is worked out 4.47
percent during the study period.
1987-88 9 14 21 11
1988-89 8 12 16 11
1989-90 7 11 19 8
1990-91 6 9 18 6
1991-92 4.39 6.27 17.53 2.07
Dunlop
India Ltd.
6.98
Aggregate Basis
11.31
Aggregate Basis
17.80
Aggregate Basis
8.52
Aggregate Basis

Volume 4, Number 3, July – September’ 2015
ISSN (Print):2319-9059, (Online):2319-9067
PEZZOTTAITE JOURNALS SJIF (2012): 3.946, SJIF (2013): 5.017, SJIF (2014): 5.912
International Journal of Trade & Global Business Perspectives© Pezzottaite Journals. 1840 |P a g e
Sources: Compiled from the Bombay Stock Exchange Official Directory, Vol. 36(iii), p. 33780.
Note: *No tax liability has been occurred for the year 1984.
Return on Net Assets on After Tax Basis (ROIat2)
As revealed by table 3, rate of return on net assets on before tax basis (ROIbt2) has been varying from 21 percent in the year 1986-
87 to 6.27 percent in the year 1991-92 while the rate of return on net assets on after tax basis (ROIat2) has been varying from 17
percent in the year 1986-87 to 2.88 percent in the year 1991-92 during the period under study. During seven out of nine years
under study, rate of return on net assets on after tax basis (ROIat2) has been below 11 percent. Overall, it has been declining over
the period under study excepting for the years 1985 and 1986-87 when it is 12.53 percent and 17 percent respectively. It is
highest, i.e. 17 percent, in the year 1986-87 due to the lower effective tax rate and the highest rate of return on net assets on before
tax basis (ROIbt2) caused by reasons mentioned earlier such as increase turnover and exports. It is lowest, i.e. 2.88 percent, in the
year 1991-92 due to the higher effective tax rate, i.e. 52 percent, and lowest rate of return on net assets on before tax basis (ROIbt2)
on account of reasons mentioned earlier such as slow down of production. On aggregate basis, the rate of return on net assets on
after tax basis (ROIat2) is worked out 7.24 percent during the study period.
Cost of Debt on After Tax Basis (Kdat)
As revealed by table 3, cost of debt on before tax basis (Kdbt) has been varying from 15.16 percent in year 1985 to 21 percent in
the years 1987-88 while cost of debt on after tax basis (Kdat) has been varying from 17.14 percent in year 1984 to 7 percent in the
years 1990-91 over the period under study. Overall, it has been declining by witnessing rising trend during the first half and
declining trend in the remaining second and final half over the period under study. During eight out of nine years under study, cost
of debt on after tax basis (Kdat) has been below 15 percent. On aggregate basis, aggregate cost of debt on after tax basis (Kdat) of
the company is worked out 11.39 percent during the period under study.
Return on Total Networth on After Tax Basis (RONat)
As revealed by table 3, rate of return on total networth on before tax basis (RONbt) has been varying from 23 percent in the year
1986-87 to 2.07 percent in the year 1991-92 while rate of return on total networth on after tax basis (RONat) has been varying
from 18 percent in the year 1986-87 to 0.96 percent in the year 1991-92 during the period under study. During six out of nine
years under study, rate of return on total networth on after tax basis (RONat) has been below 7 percent. Overall, it has been
declining and witnessing a deep decline in the years in 1984, 1990-91 and 1991-92 when it is 3 percent, 2 percent and 0.96
percent, respectively, over the period under study excepting for the years 1985 and 1986-87 when it is 12.21 percent and 18
percent respectively. It is highest, i.e. 18 percent, in the year 1986-87 due to the lower effective tax rate, highest rate of return on
net total assets (ROIat1) as well as net assets (ROIat2) on after tax basis and highest excess gap of rate of return on net assets
(ROIat2) over cost of debt (Kdat) on after tax basis. It is lowest, i.e. 0.96 percent, in the year 1991-92 caused by higher effective tax
rate, lowest rate of return on net total assets (ROIat1) as well as net assets (ROIat2) on after tax basis and highest excess gap of cost
of debt (Kdat) over rate of return on net assets (ROIat2) on after tax basis. On aggregate basis, the rate of return on total networth
on after tax basis (RONat) is worked out 5.45 percent during the study period.
Table-3: Impact of Debt on Return on Total Networth in Dunlop India Ltd
(After Tax Basis)
Year Return on Total
Assets
ROIat1=ROIbt1(1-t)
(Percentage)
Return on Net Assets
ROIat2=ROIbt2(1-t)
(Percentage)
Cost of Debt
Kdat=Kdbt(1-t)
(Percentage)
Return on Total Networth
RONat=
(Percentage)
Dec.1983 7(1-.32)=5 16(1-.32)=12.53 18(1-.32)=13.19 10
Dec.1984* 4.42=4.42 9=9 17.14=17.14 3
Dec.1985 6.85(1-.13)=5.96 14.40(1-.13)=12.53 15.16(1-.13)=13.19 12.02
1986-87 12(1-.20)=10 21(1-.20)=17 19(1-.20)=15 18
1987-88 9(1-.32)=6 14(1-.32)=10 21(1-.32)=14 7
1988-89 8(1-.47)=4.24 12(1-.47)=6.36 16(1-.47)=8.48 5.83
1989-90 7(1-.42)=4 11(1-.42)=6 19(1-.42)=11 5
1990-91 6(1-.63)=2 9(1-.63)=3 18(1-.63)=7 2
1991-92 4.39(1-.52)=1.92 6.27(1-.52)=2.88 17.53(1-.52)=8.64 .96
Dunlop
India Ltd.
6.98(1-.36)=4.47
Aggregate Basis
11.31(1-.36)=7.24
Aggregate Basis
17.80(1-.36)=11.39
Aggregate Basis
8.52(1-.36)=5.45
Aggregate Basis

Volume 4, Number 3, July – September’ 2015
ISSN (Print):2319-9059, (Online):2319-9067
PEZZOTTAITE JOURNALS SJIF (2012): 3.946, SJIF (2013): 5.017, SJIF (2014): 5.912
International Journal of Trade & Global Business Perspectives© Pezzottaite Journals. 1841 |P a g e
(4) Impact of Debt on Return on Total Networth
Tables 2, 3 and 4 also show the effect of use and cost of debt (Kdbt & Kdat) on rate of return on total networth (RONbt & RONat)
on before and after tax basis for a period of nine years from the year 1983 to 1991-92. Comparison of cost of debt (Kdbt & Kdat)
with rate of return on net assets (ROIbt2 & ROIat2) on before and after tax basis shows that former is higher than latter for all the
years under study excepting for the year 1986-87. This leads to conclude that the company has been suffering from unfavourable
leverage with regard to use of debt during eight out of nine years under study. Consequently, rate of return on total networth
(RONbt & RONat) is less than from cost of debt (Kdbt & Kdat) and rate of return on net assets (ROIbt2 & ROIat2) on before and after
tax basis in the above said eight years under study. It means that use of debt in the capital structure of the company has negative
impact on the profitability of the company during eight out of nine years under study, which consequently is not contributing to
the total networth of the company, which ultimately is not benefitting to the equity shareholders of the company. On aggregate
basis, the company has also been experiencing unfavourable leverage with regard to use of debt on before and after tax basis
during the period under study. Further details regarding spread and net gain on before and after basis have been in table 4. Due to
unfavourable impact of leverage by using debt in the capital structure of the company, spread between rate of return on net assets
(ROIbt2 & ROIat2) and cost of debt (Kdbt & Kdat) on before and after tax basis, and net gain calculated by deducting rate of return
on net assets (ROIbt2 & ROIat2) from rate of return on total networth (RONbt & RONat) on before and after basis have been
negative in the above said eight years under study. Spread and net gain are positive when leverage impact is positive during the
remaining one year under study.
Sources: Compiled from the Bombay Stock Exchange Official Directory, Vol. 36(iii), p. 33780.
Supplementary Information: Figures in brackets in column 2 & 6 indicate Spread between Rate of Return on Net Total Assets
& Cost of Debt on before & after tax basis and figures in brackets in column 4 & 8 indicate Net Gain on before & after tax basis
on Net Total Assets respectively.
SUMMARY AND CONCLUSIONS
In the present study, a maiden attempt has been made to make an in-depth analysis of the behaviour of debt through a case of
Dunlop India Ltd. from tyres & tubes industry of the Indian corporate sector which covers a time period of nine years extending
from the year 1983 to 1991-92 where the company is lying in the top ten companies of tyres & tubes industry of the Indian
corporate sector on the basis of sales for the year 1991-92 for the purpose of our study. The following are the conclusions and
findings of the present study.
It is observed that debt-equity ratio2 has been varying from 42.97 percent in the 1985 to 22.45 percent in the year 1987-
88 during the period under study, whereas, aggregate debt-equity ratio2 of the company is worked out 30.84 percent
during the period under study.
It is found that cost of debt on before tax basis (Kdbt) has been varying from 15.16 percent in year 1985 to 21 percent in
the year 1987-88 while cost of debt on after tax basis (Kdat) has been varying from 17 percent in year 1984 to 7 percent
in the year 1990-91 over the period under study. Overall, cost of debt on before tax basis (Kdbt) has been declining with
Table-4: Analysis of Spread and Gain In Dunlop India Ltd
(1)
Before Tax Basis
(2) (3) (4)
(5)
After Tax Basis
(6) (7) (8)
Year
Spread between
ROIbt2 & Kdbt
(ROIbt2-Kdbt)
(%age)
Debt
Impact
Net Gain
(RONbt –
ROIbt2 )
(%age)
Debt-
Equity
Ratio2
(%age)
Spread
between
ROIat2 & Kdat
(ROIat2-Kdat)
(%age)
Debt
Impact
Net Gain
(RONat-
ROIat2 )
(%age)
Dec.1983 -2(-11) Unfavourable -2(7) 40.24 -1(-7) Unfavourable -1(5)
Dec.1984 -8.14(-12.72) Unfavourable -6.08(-1.50) 42.79 -8(-11) Unfavourable -6(-1)
Dec.1985 -.76(-8.31) Unfavourable -.58(6.97) 42.79 -.66(-7.23) Unfavourable -.51(6.06)
1986-87 2(-7) Favourable 2(11) 38.03 2(-5) Favourable 1(8)
1987-88 -7(-12) Unfavourable -3(2) 22.45 -4(-8) Unfavourable -3(1)
1988-89 -4(-8) Unfavourable -1(3) 28.11 -2.12(-4.24) Unfavourable -.53(1.59)
1989-90 -8(-12) Unfavourable -3(1) 31.77 -5(-7) Unfavourable -1(1)
1990-91 -9(-12) Unfavourable -3(0) 25.16 -4(-5) Unfavourable -1(0)
1991-92 -11.26(-13.14) Unfavourable -4.20(-2.32) 29.09 -5.76(-6.72) Unfavourable -1.92(-.96)
Dunlop
India Ltd.
-6.49(-10.81) Unfavourable -2.79(1.54) 30.84 -4.15(-6.92) Unfavourable -1.79(.98)

Volume 4, Number 3, July – September’ 2015
ISSN (Print):2319-9059, (Online):2319-9067
PEZZOTTAITE JOURNALS SJIF (2012): 3.946, SJIF (2013): 5.017, SJIF (2014): 5.912
International Journal of Trade & Global Business Perspectives© Pezzottaite Journals. 1842 |P a g e
fluctuations over the period under study excepting for the years 1986-87, 1987-88 and 1988-89 when it is 19 percent, 21
percent and 19 percent, respectively, whereas, cost of debt on after tax basis (Kdat) has been declining by witnessing
rising trend during the first half and declining trend in the remaining second and final half over the period under study.
Aggregate cost of debt on before and after tax basis (Kdbt & Kdat) of the company is worked out 17.80 percent and 11.39
percent, respectively, during the period under study.
It is observed that the rate of return on net total assets on before tax basis (ROIbt1) has been varying from 12 percent in
the year 1986-87 to 4.39 percent in the year 1991-92 while the rate of return on net total assets on after tax basis (ROIat1)
has been varying from 10 percent in the year 1986-87 to 1.92 percent in the year 1991-92 during the period under study.
Overall, rate of return on net total assets on before tax basis (ROIbt1) has been declining with fluctuations over the period
under study excepting for the years 1986-87, 1987-88 and 1988-89 when it is 12 percent, 9 percent and 8 percent,
respectively while rate of return on net total assets on after tax basis ( ROIat1) has also been declining with fluctuations
over the period under study excepting for the years 1985, 1986-87 and 1987-88 when it is 5.96 percent, 10 percent and 6
percent, respectively. On aggregate basis, the rate of return on net total assets on before and after tax basis (ROIbt1 &
ROIat1) is worked out 6.98 percent and 4.47 percent, respectively, during the study period.
It is found that rate of return on net assets on before tax basis (ROIbt2) has been varying from 21 percent in the year
1986-87 to 6.27 percent in the year 1991-92 while the rate of return on net assets on after tax basis (ROIat2) has been
varying from 17 percent in the year 1986-87 to 2.88 percent in the year 1991-92 during the period under study. Overall,
rate of return on net assets on before tax basis (ROIbt2) has been declining over the period under study excepting for the
year 1986-87 when it is 21 percent while rate of return on net assets on after tax basis (ROIat2) has been declining over
the period under study excepting for the years 1985 and 1986-87 when it is 12.53 percent and 17 percent respectively
over the study period. On aggregate basis, the rate of return on net assets on before and after tax basis (ROIbt2 & ROIat2)
is worked out 11.31 percent 7.24 percent, respectively, during the study period.
It is observed that rate of return on total networth on before tax basis (RONbt) has been varying from 23 percent in the
year 1986-87 to 2.07 percent in the year 1991-92 while rate of return on total networth on after tax basis (RONat) has
been varying from 18 percent in the year 1986-87 to 0.96 percent in the year 1991-92 during the period under study.
Overall, rate of return on total networth on before tax basis (RONbt) has been declining and witnessing a deep decline in
the years in 1984 and 1991-92 when it is 2.92 percent and 2.07 percent, respectively, over the period under study
excepting for the year 1986-87 when it is 23 percent while rate of return on total networth on after tax basis (RONat)
has also been declining and witnessing a deep decline in the years in 1984, 1990-91 and 1991-92 when it is 3 percent, 2
percent and 0.96 percent, respectively, over the period under study excepting for the years 1985 and 1986-87 when it is
12.21 percent and 18 percent respectively. On aggregate basis, the rate of return on total networth on before and after
tax basis (RONbt & RONat) is worked out 8.52 percent and 5.45 percent, respectively, during the study period.
It is observed that the company is suffering from unfavourable leverage with regard to use of debt during eight out of
nine years under study. Consequently, rate of return on total networth (RONbt & RONat) is less than from cost of debt
(Kdbt & Kdat) and rate of return on net assets (ROIbt2 & ROIat2) on before and after tax basis in the above said eight years
under study.
It is also found that spread and net gain are positive when leverage impact is positive and, spread and net gain are
negative when leverage impact is negative during the period under study. On aggregate basis, spread on before and after
tax basis is worked out -6.49 percent and -4.15 percent, respectively, while net gain on before and after tax basis is
worked out -2.79 percent and -1.79 percent, respectively, during the period under study.
It is also found that aggregate effective tax rate born by the company is 36 percent during the study period.
Thus, it is concluded that the company is suffering from unfavourable leverage with regard to use of debt during eight out of nine
years under study. Consequently, rate of return on total networth (RONbt & RONat) is less than from cost of debt (Kdbt & Kdat)
and rate of return on net assets (ROIbt2 & ROIat2) on before and after tax basis in the above said eight years under study. It means
that use of debt in the capital structure of the company has negative impact on the profitability of the company during eight out of
nine years under study, which consequently is not contributing to the total networth of the company, which ultimately is not
benefitting to the equity shareholders of the company. However, on aggregate basis, the company has also been experiencing
unfavourable leverage with regard to use of debt on before and after tax basis during the period under study. Due to unfavourable
impact of leverage by using debt in the capital structure of the company, spread between rate of return on net assets (ROIbt2 &
ROIat2) and cost of debt (Kdbt & Kdat) on before and after tax basis, and net gain calculated by deducting rate of return on net
assets (ROIbt2 & ROIat2) from rate of return on total networth (RONbt & RONat) on before and after basis have been negative in the
above said eight years under study. Spread and net gain are positive when leverage impact is positive during the remaining one
year under study. It is also found that effective tax rate born by the company is not high during the period under study.
Volume 4, Number 3, July – September’ 2015
ISSN (Print):2319-9059, (Online):2319-9067
PEZZOTTAITE JOURNALS SJIF (2012): 3.946, SJIF (2013): 5.017, SJIF (2014): 5.912
International Journal of Trade & Global Business Perspectives© Pezzottaite Journals. 1843 |P a g e
REFERENCES
1. Allen, D. E., & Mizuno, H. (1989, May). The Determinants of Corporate Capital Structure: Japanese Evidence. Applied
Economics, 21(5), 569-585.
2. Anthony, Robert N., & Reece, James S. (1982). Management Accounting Principles. New Delhi: D. S. Taraporewala
and Sons.
3. Chandra, Prasanna. (1984). Financial Management Theory and Practice. New Delhi: Tata McGraw Hill Publishing
Company Limited.
4. Chandra, Prasanna. (1985). Management’s Guide to Finance and Accounting. New Delhi: Tata McGraw Hill
Publishing Company Limited.
5. Guthman, Harry G. Analysis of Financial Statements (4th Edition). New Delhi: Prentice Hall of India.
6. Gangadhar, V., & Begum, Arifa. (October 2002-March 2003) Impact of Leverage on Profitability. Journal of
Accounting & Finance, 17(1), 58-72.
7. Garg, Mahesh Chand, & Shekhar, Chander. (2002, February). Determents of Capital Structure in India. The
Management Accountant, 37(2), 86-92.
8. Khan, M. V., & Jain, P. K. (1983). Financial Management. New Delhi: Tata McGraw Hill Publishing Company
Limited.
9. Kraus, Alan, & Litzenberger, Robert H. (1973, September). A State Preference Model of Optimal Financial Leverage.
The Journal of Finance, 28, 911-921.
10. Kulkarni, P. V. Business Finance-Principles & Problems. Bombay: Himalaya Publishing House.
11. Narender, & Sharma. (2006). Determinants of Capital Structure in Public Enterprises. Finance, 12(7), 14-28.
12. Narang, & Kaushal. (2006). Business Ethics. Ludhiana: Kalyani Publishers.
13. Pandey, Indra Mohan. (1978, March). Leverage, Risk and the Choice of Capital Structure. The Management
Accountant, 13(3), 203-208.
14. Pandey, Indra Mohan. (1978, July). Impact of Corporate Debt on the Cost of Equity. The Chartered Accountant, 27 (I),
14-20.
15. Pandey, I. M. (2003). Financial Management. New Delhi: Vikas Publishing House.
16. Pandey, I. M. (1985, March). The Financial Leverage in India: A Study. Indian Management, 21-34.
17. Rasoolpur, G. S. (2012, November). Ethical Paradox in Capital Structure Practices: An Empirical Analysis of
Automobile & Vehicles Industry-Evidence from the Indian Corporate Sector. Emerging Paradigms in Business Ethics,
77-83. Sri Fatehgarh Sahib Mata Gujri College.
18. Rasoolpur, G. S. (2012). Capital Structure Decisions: A Comparative Analysis of Selected Industries of India.
Emphasis-A Journal of Social Sciences, 6, 52-65.
19. Rasoolpur, G. S. (2012, January-June). Conservative Firm Behaviour vis-a-vis Target Capital Structure: An Empirical
Analysis of Automobile Ancillaries & Spare-Parts Industry of India. Global Management Horizon, II(I).
20. Rasoolpur, G. S. (2012, September). An Empirical Analysis of Capital Structure Determinants: Evidence from the
Indian Corporate Sector. International Journal of Management & Information Technology, 1(3), 1-12.
21. Rasoolpur, G. S. (2012, December). Composition of Capital Structure Decisions: Comparative Empirical Evidence from
India. International Journal of Research in Business and Technology, 1(1), 1-12.
22. Rasoolpur, G. S. (2013, March). Model of Financing Decisions: Experiences from the Indian Firms. ZENITH
International Journal of Business Economics & Management Research, 3(3), 28-44.
Volume 4, Number 3, July – September’ 2015
ISSN (Print):2319-9059, (Online):2319-9067
PEZZOTTAITE JOURNALS SJIF (2012): 3.946, SJIF (2013): 5.017, SJIF (2014): 5.912
International Journal of Trade & Global Business Perspectives© Pezzottaite Journals. 1844 |P a g e
23. Rasoolpur, G. S. (2013, May). Leverage Decisions: A Case of Textile & Readymade Garments Industry of the Indian
Corporate Sector. International Journal of Research in Business and Technology, 2(2), 27-32.
24. Rasoolpur, G. S., & Warne D. P. (2013, July). Configuration of Financing Pattern: A Study of Diversified Industry of
the Indian Corporate Sector. ZENITH International Journal of Multidisciplinary Research, 3(7), 89-97.
25. Rasoolpur, G. S., & Warne D. P. (2013, July). Capital Structure Decisions: An Empirical Evidence from POL, Power &
Transmission Industry of the Indian Corporate Sector. ZENITH International Journal of Multidisciplinary
Management Studies, 3(7), 141-149.
26. Rasoolpur, G. S., & Warne D. P. (2014, June). A Variable-Specific Analysis of Capital Structure Decisions. Steward
Business Review, 1(3), 80-82.
27. Rasoolpur, G. S. (2014). Debt-Equity Mix-A Traditional Approach: An Empirical Evidence from the Indian Firms.
Vision-An International Journal of Humanity and Management, 1(1), 229-238.
28. Rasoolpur, G. S. (2014, August). Impact of Cash Flow Coverage, Debt Service, & Current Ratio on Capital Structure
Decisions: Empirical Evidence from the Indian Corporate Sector. Journal of Research in Marketing, 3(1), 232-238.
29. Rasoolpur, G. S. (2015, June). Impact of Preference Share Capital on Equity Networth: An Empirical Case from the
Indian Corporate Sector. International Journal of Research in Business and Technology, 6(3), 1-12.
30. Rasoolpur, G. S. (2015, April-June). Leverage Choices: An Empirical Case from the Indian Corporate Sector.
International Journal of Entrepreneurship & Business Environment Perspectives, 4(2), 1760-1766.
31. Rasoolpur, G. S. (2015, April-June). Panorama of Preference Share Capital: An Empirical Case from the Indian
Corporate Sector. International Journal of Entrepreneurship & Business Environment Perspectives, 4(2), 1753-1759.
32. Rasoolpur, G. S. (2015, April-June). Relationship between Capital Structure & Life of Firms: Evidence from the Indian
Corporate Sector. International Journal of Trade & Global Business Perspectives, 4(2), 1696-1704.
33. Rasoolpur, G. S. (2015, April-June). Financial Leverage in India: An Empirical Study. International Journal of Trade
& Global Business Perspectives, 4(2), 1688-1695.
34. Rasoolpur, G. S. (2015, April-June). Impact of Preference Share Capital on Equity Networth: An Empirical Case of
Dunlop India Limited. International Journal of Applied Financial Management Perspectives, 4(2), 1800-1806.
35. Rasoolpur, G. S. (2015, April-June). Seascaping of Preference Share Capital: An Empirical Case. International Journal
of Applied Financial Management Perspectives, 4(2), 1698-1704.
36. Rasoolpur, G. S. (2015, April-June). Capital Structure is a Function of Uniqueness of Firms: Evidence from the Indian
Corporate Sector. International Journal of Applied Financial Management Perspectives, 4(2), 1705-1713.
37. Titman, S., & Wessells, R. (1988, March). The Determinants of Capital Structure Choice. The Journal of Finance,
XLIII(1), 1-19.
38. Venkatesan, S. (1983, January). Determinants of Financial Leverage an Empirical Extension. The Chartered Account,
32, 519-527.
39. Vashishth, Neeru, & Rajput, Namita. (2010). Corporate Governance Value & Ethics. New Delhi: Taxmann
Publications (P) Limited.Governance Value & Ethics,” Taxmann Publications (P) Ltd., New Delhi.
*****