Behaviors and Context of Call Production. (2019)
62
SPRINGALL, BRIAN, M.S. The In-Flight Social Calls of Insectivorous Bats: Species Specific Behaviors and Context of Call Production. (2019) Directed by Dr. Matina C. Kalcounis-Rueppell. 54 pp. Bats could be a useful study system for studying the evolution of social communication, as they exhibit a high diversity of social group size and complexity. However, the study of bat social calls has been limited, as they are nocturnal, volant animals that produce predominately ultrasonic vocalizations. Passive acoustic monitoring studies occasionally capture bat in-flight social calls. The information from surrounding echolocation calls can provide information on species identity, abundance, and foraging activity. I used passive acoustic monitoring in Greensboro, North Carolina, to identify seven types of in-flight social calls from Eptesicus fuscus, Lasiurus borealis, Lasiurus cinereus, Nycticeius humeralis, Perimyotis subflavus, and Tadarida brasiliensis. Eptesicus fuscus, N. humeralis, and T. brasiliensis differed in total social call production, and the proportional use of call types. Shared called types exhibited species-specific signatures. The presence of species-specific signatures indicates bats could potentially discern signaler identity. Social call production was highest early in the night and positively correlated with bat activity. Eptesicus fuscus and T. brasiliensis most commonly produced complex calls, which appear to mediate social interactions between conspecifics while foraging. Nycticeius humeralis most commonly produced downsweeps, which appear to be broad-functioning contact calls. Upsweeps exhibited a similar context to downsweeps, and were commonly produced by E. fuscus and N. humeralis. My results indicate bats use dedicated social calls to mediate different types of social interactions while in flight.
Transcript of Behaviors and Context of Call Production. (2019)
SPRINGALL, BRIAN, M.S. The In-Flight Social Calls of Insectivorous Bats: Species Specific
Behaviors and Context of Call Production. (2019)
Directed by Dr. Matina C. Kalcounis-Rueppell. 54 pp.
Bats could be a useful study system for studying the evolution of social communication,
as they exhibit a high diversity of social group size and complexity. However, the study of bat
social calls has been limited, as they are nocturnal, volant animals that produce predominately
ultrasonic vocalizations. Passive acoustic monitoring studies occasionally capture bat in-flight
social calls. The information from surrounding echolocation calls can provide information on
species identity, abundance, and foraging activity. I used passive acoustic monitoring in
Greensboro, North Carolina, to identify seven types of in-flight social calls from Eptesicus fuscus,
Lasiurus borealis, Lasiurus cinereus, Nycticeius humeralis, Perimyotis subflavus, and Tadarida
brasiliensis. Eptesicus fuscus, N. humeralis, and T. brasiliensis differed in total social call
production, and the proportional use of call types. Shared called types exhibited species-specific
signatures. The presence of species-specific signatures indicates bats could potentially discern
signaler identity. Social call production was highest early in the night and positively correlated
with bat activity. Eptesicus fuscus and T. brasiliensis most commonly produced complex calls,
which appear to mediate social interactions between conspecifics while foraging. Nycticeius
humeralis most commonly produced downsweeps, which appear to be broad-functioning contact
calls. Upsweeps exhibited a similar context to downsweeps, and were commonly produced by E.
fuscus and N. humeralis. My results indicate bats use dedicated social calls to mediate different
types of social interactions while in flight.

THE IN-FLIGHT SOCIAL CALLS OF INSECTIVOROUS BATS: SPECIES SPECIFIC
BEHAVIORS AND CONTEXT OF CALL PRODUCTION
by
Brian Springall
A Thesis Submitted to
the Faculty of The Graduate School at
The University of North Carolina at Greensboro
in Partial Fulfillment
of the Requirements for the Degree
Master of Science
Greensboro
2019
Approved by
__________________________________
Committee Chair

ii
To Greg Brosek; a good friend whose enthusiastic hard work and dedication were invaluable
towards the completion of this thesis.

iii
APPROVAL PAGE
This thesis written by Brian Springall has been approved by the following committee of
the Faculty of The Graduate School at The University of North Carolina at Greensboro.
Committee Chair __________________________________
Dr. Matina Kalcounis-Rueppell
Committee Members __________________________________
Dr. Olav Rueppell
__________________________________
Dr. Malcolm Schug
__________________________________
Dr. Aaron Corcoran
___________________________
Date of Acceptance by Committee
_________________________
Date of Final Oral Examination

iv
ACKNOWLEDGMENTS
I would like to thank my thesis committee chair Dr. Matina Kalcounis-Rueppell, and
committee members Dr. Olav Rueppell, Dr. Malcolm Schug, and Dr. Aaron Corcoran for their
guidance in developing the project, analyzing the data, and writing the thesis.
I would like to thank the other members of the Kalcounis-Rueppell lab; Dr. Han Li, Dr.
Bryan McLean, Dr. Angie Larsen, Rada Petric, Kevin Parker, and Becky Malin for their feedback
and support throughout this process. I would like to help my team of undergraduate research
assistants; Jay Davis, Ashley Rose, Sean Costner, Carlos Castellon, and Greg Brosek for their aid
in sorting through bat passes to identify those with social calls.
Many thanks to the UNCG Wetlands committee for allowing me to use this dataset, and
to their graduate assistant Kristina Morales who collects the recordings. The Wetland Installation
and research possible: The City of Greensboro, Greensboro Science Center, UNCG Bat and
Mouse Lab, UNCG Biology Department, UNCG Chemistry Department, UNCG Geography
Department, UNCG Office of Provost, Peabody Park Preservation Committee, UNCG Office of
Sustainability, The UNCG Undergraduate Research, Scholarship, and Creativity Office, UNCG
Facilities Design and Construction, UNCG Facilities Grounds and Garage, and the community of
volunteers aiding with the installation of the Wetlands. The Wetlands Project is funded by grants
from the Duke Energy Water Resources Fund, the UNCG Green Fund, and the UNCG Provost
Office

v
TABLE OF CONTENTS
Page
LIST OF TABLES ......................................................................................................................... vi
LIST OF FIGURES ...................................................................................................................... vii
CHAPTER
I. INTRODUCTION ............................................................................................................ 1
II. MATERIALS AND METHODS ...................................................................................... 7
III. RESULTS ...................................................................................................................... 16
IV. DISCUSSION ................................................................................................................. 24
REFERENCES .............................................................................................................................. 46
vi
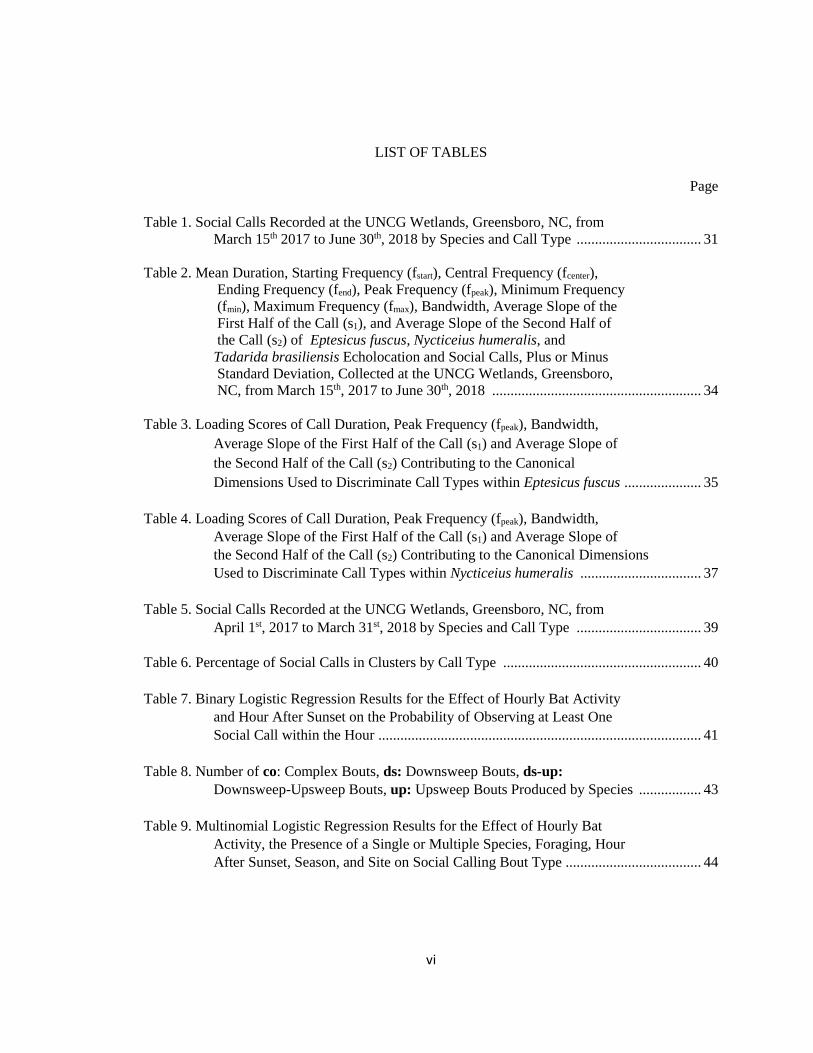
LIST OF TABLES
Page
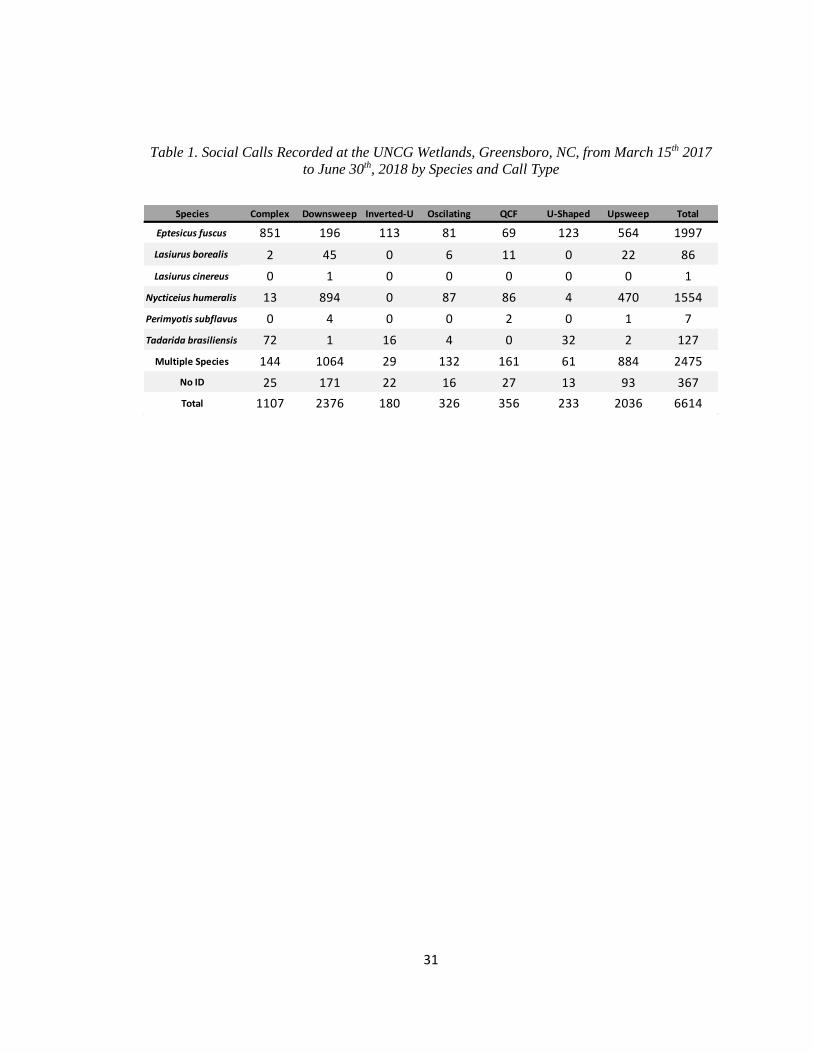
Table 1. Social Calls Recorded at the UNCG Wetlands, Greensboro, NC, from
. March 15th 2017 to June 30th, 2018 by Species and Call Type .................................. 31
Table 2. Mean Duration, Starting Frequency (fstart), Central Frequency (fcenter),
…...Ending Frequency (fend), Peak Frequency (fpeak), Minimum Frequency
…...(fmin), Maximum Frequency (fmax), Bandwidth, Average Slope of the
…...First Half of the Call (s1), and Average Slope of the Second Half of
…...the Call (s2) of Eptesicus fuscus, Nycticeius humeralis, and
…..Tadarida brasiliensis Echolocation and Social Calls, Plus or Minus
…...Standard Deviation, Collected at the UNCG Wetlands, Greensboro,
…...NC, from March 15th, 2017 to June 30th, 2018 ......................................................... 34
Table 3. Loading Scores of Call Duration, Peak Frequency (fpeak), Bandwidth,
…..Average Slope of the First Half of the Call (s1) and Average Slope of
…..the Second Half of the Call (s2) Contributing to the Canonical
…..Dimensions Used to Discriminate Call Types within Eptesicus fuscus ..................... 35
Table 4. Loading Scores of Call Duration, Peak Frequency (fpeak), Bandwidth,
…..Average Slope of the First Half of the Call (s1) and Average Slope of
…..the Second Half of the Call (s2) Contributing to the Canonical Dimensions
…..Used to Discriminate Call Types within Nycticeius humeralis ................................. 37
Table 5. Social Calls Recorded at the UNCG Wetlands, Greensboro, NC, from
…..April 1st, 2017 to March 31st, 2018 by Species and Call Type .................................. 39
Table 6. Percentage of Social Calls in Clusters by Call Type ...................................................... 40
Table 7. Binary Logistic Regression Results for the Effect of Hourly Bat Activity
…..and Hour After Sunset on the Probability of Observing at Least One
…..Social Call within the Hour ........................................................................................ 41
Table 8. Number of co: Complex Bouts, ds: Downsweep Bouts, ds-up:
…..Downsweep-Upsweep Bouts, up: Upsweep Bouts Produced by Species ................. 43
Table 9. Multinomial Logistic Regression Results for the Effect of Hourly Bat
…..Activity, the Presence of a Single or Multiple Species, Foraging, Hour
…..After Sunset, Season, and Site on Social Calling Bout Type ..................................... 44
vii
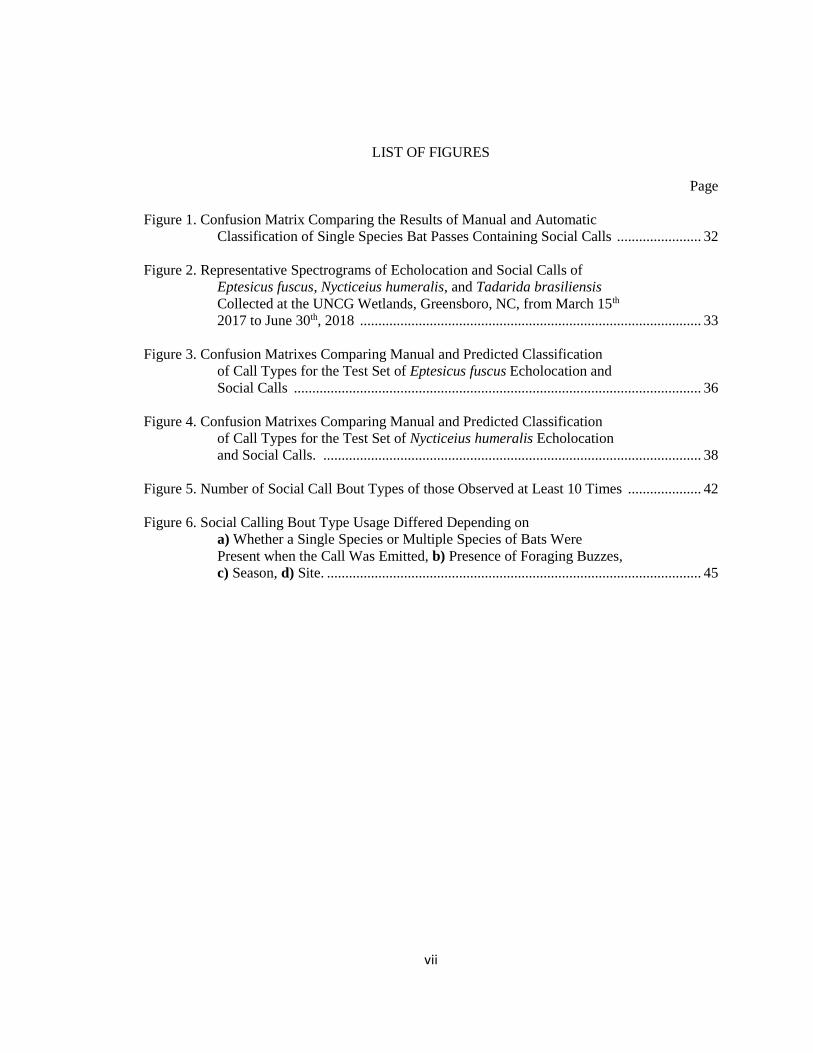
LIST OF FIGURES
Page
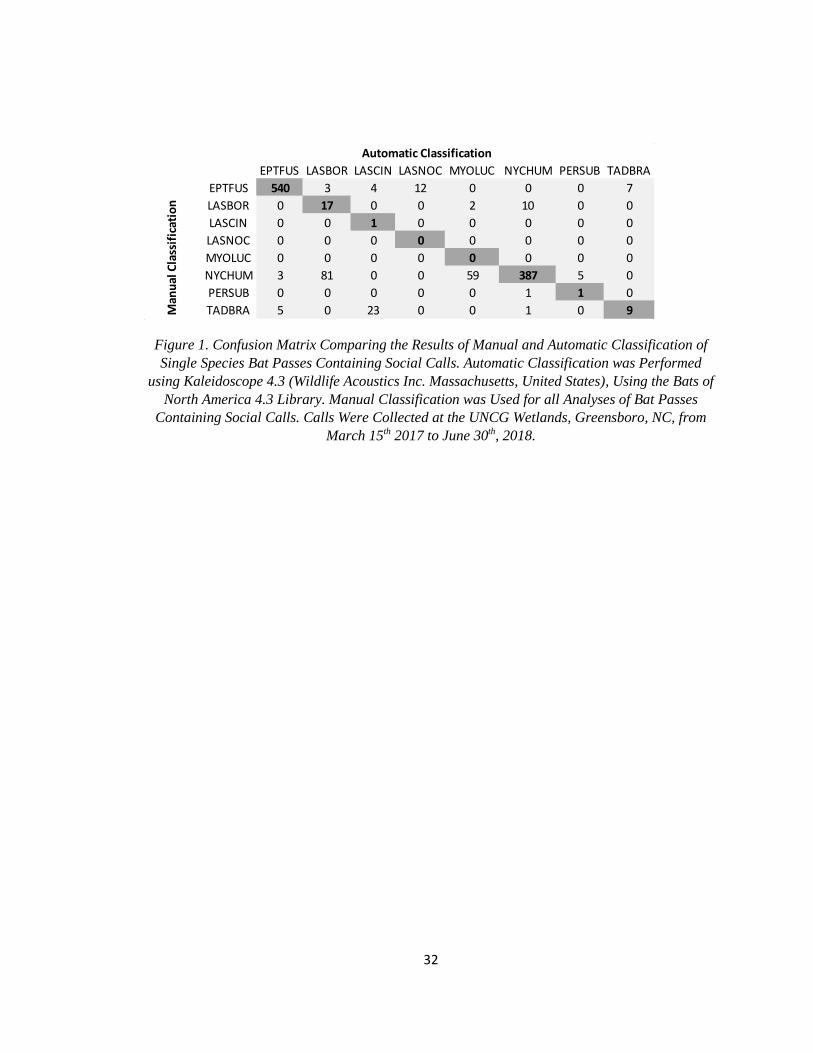
Figure 1. Confusion Matrix Comparing the Results of Manual and Automatic
…...Classification of Single Species Bat Passes Containing Social Calls ....................... 32
Figure 2. Representative Spectrograms of Echolocation and Social Calls of
…...Eptesicus fuscus, Nycticeius humeralis, and Tadarida brasiliensis
…...Collected at the UNCG Wetlands, Greensboro, NC, from March 15th
…...2017 to June 30th, 2018 ............................................................................................. 33
Figure 3. Confusion Matrixes Comparing Manual and Predicted Classification
…...of Call Types for the Test Set of Eptesicus fuscus Echolocation and
…...Social Calls ............................................................................................................... 36
Figure 4. Confusion Matrixes Comparing Manual and Predicted Classification
…...of Call Types for the Test Set of Nycticeius humeralis Echolocation
…...and Social Calls. ....................................................................................................... 38
Figure 5. Number of Social Call Bout Types of those Observed at Least 10 Times .................... 42
Figure 6. Social Calling Bout Type Usage Differed Depending on
…...a) Whether a Single Species or Multiple Species of Bats Were
…...Present when the Call Was Emitted, b) Presence of Foraging Buzzes,
…...c) Season, d) Site. ...................................................................................................... 45

1
CHAPTER I
INTRODUCTION
Species can differ in social communication behavior due to different call types used
(Blumstein & Armitage 1997; McComb & Semple 2005), different rates of call production
(Kalcounis-Rueppell et al. 2018), species specific differences in call characteristics (Insley, 1992;
Musolf et al. 2015; Rendell et al. 1999), and differences in information encoded (Medvin et al.
1993; Pollard, 2011). The social complexity hypothesis posits that species-specific differences in
communication systems can arise due to differences in social systems (Freeberg et al. 2012).
Across species, repertoire size has been positively correlated with social group complexity
(Blumstein & Armitage, 1997; McComb & Semple, 2005). Group size is often correlated with
call complexity, as more complex calls can encode more information about individual identity
(Freeberg, 2006; Medvin et al. 1993; Pollard, 2011; Wilkinson, 2003).
The extensive range in social complexity in bats suggests that bats are a viable model for
testing the relationship between sociality and communication. Group size ranges from solitary
species (Constantine, 1966) to colonies exceeding one million individuals (Davis et al. 1962).
Within socially living species, group organization ranges from simple aggregations (Barclay et al.
1988), to fission-fusion groups (Garroway & Broders, 2007; Patriquin et al. 2010; Willis &
Brigham, 2004), to the complex networks of reciprocal altruism seen in Desmodus rotundus
(Wilkinson, 1984). Parental care is common among bat species (Barclay et al. 1979; Matsumura
1979; Vaughan & Vaughan 1986). Bats exhibit a diversity of mating systems, including leks
(Bradbury, 1977), harems (Heckel & von Helversen, 2002), promiscuity (Barclay et al. 1979;
Keeley & Keeley, 2004; Thomas et al. 1979) and monogamy (Vaughan & Vaughan 1986).
2
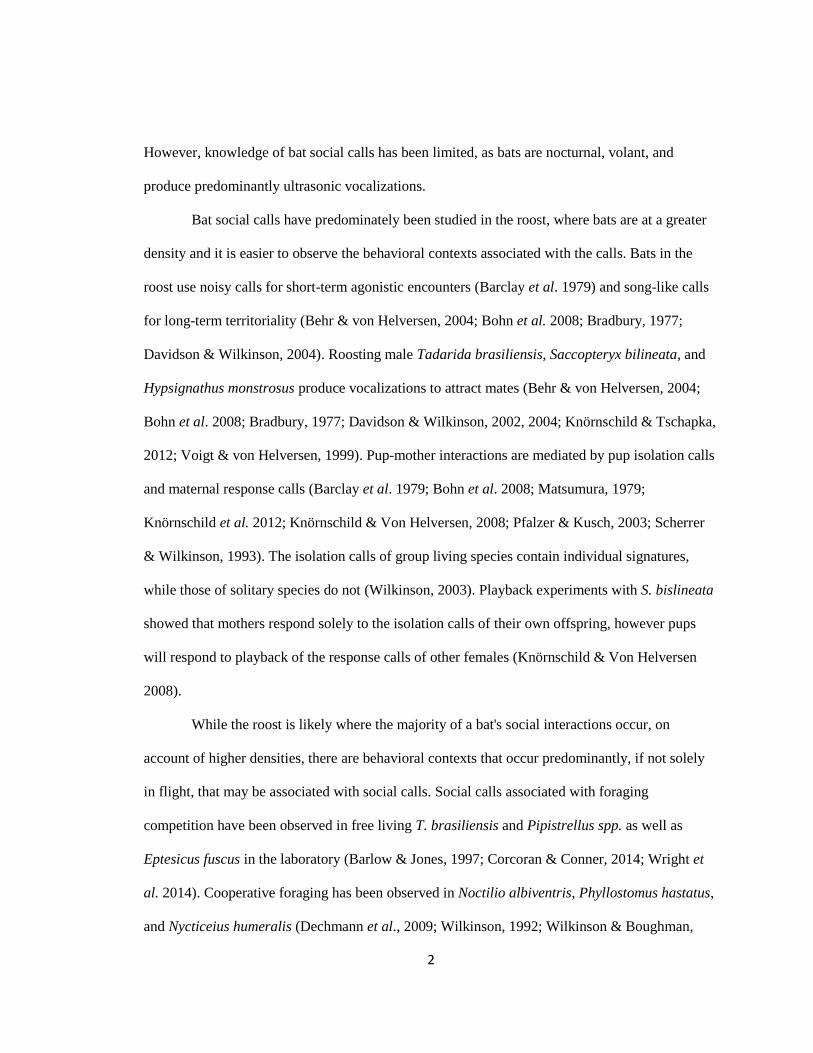
However, knowledge of bat social calls has been limited, as bats are nocturnal, volant, and
produce predominantly ultrasonic vocalizations.
Bat social calls have predominately been studied in the roost, where bats are at a greater
density and it is easier to observe the behavioral contexts associated with the calls. Bats in the
roost use noisy calls for short-term agonistic encounters (Barclay et al. 1979) and song-like calls
for long-term territoriality (Behr & von Helversen, 2004; Bohn et al. 2008; Bradbury, 1977;
Davidson & Wilkinson, 2004). Roosting male Tadarida brasiliensis, Saccopteryx bilineata, and
Hypsignathus monstrosus produce vocalizations to attract mates (Behr & von Helversen, 2004;
Bohn et al. 2008; Bradbury, 1977; Davidson & Wilkinson, 2002, 2004; Knörnschild & Tschapka,
2012; Voigt & von Helversen, 1999). Pup-mother interactions are mediated by pup isolation calls
and maternal response calls (Barclay et al. 1979; Bohn et al. 2008; Matsumura, 1979;
Knörnschild et al. 2012; Knörnschild & Von Helversen, 2008; Pfalzer & Kusch, 2003; Scherrer
& Wilkinson, 1993). The isolation calls of group living species contain individual signatures,
while those of solitary species do not (Wilkinson, 2003). Playback experiments with S. bislineata
showed that mothers respond solely to the isolation calls of their own offspring, however pups
will respond to playback of the response calls of other females (Knörnschild & Von Helversen
2008).
While the roost is likely where the majority of a bat's social interactions occur, on
account of higher densities, there are behavioral contexts that occur predominantly, if not solely
in flight, that may be associated with social calls. Social calls associated with foraging
competition have been observed in free living T. brasiliensis and Pipistrellus spp. as well as
Eptesicus fuscus in the laboratory (Barlow & Jones, 1997; Corcoran & Conner, 2014; Wright et
al. 2014). Cooperative foraging has been observed in Noctilio albiventris, Phyllostomus hastatus,
and Nycticeius humeralis (Dechmann et al., 2009; Wilkinson, 1992; Wilkinson & Boughman,
3
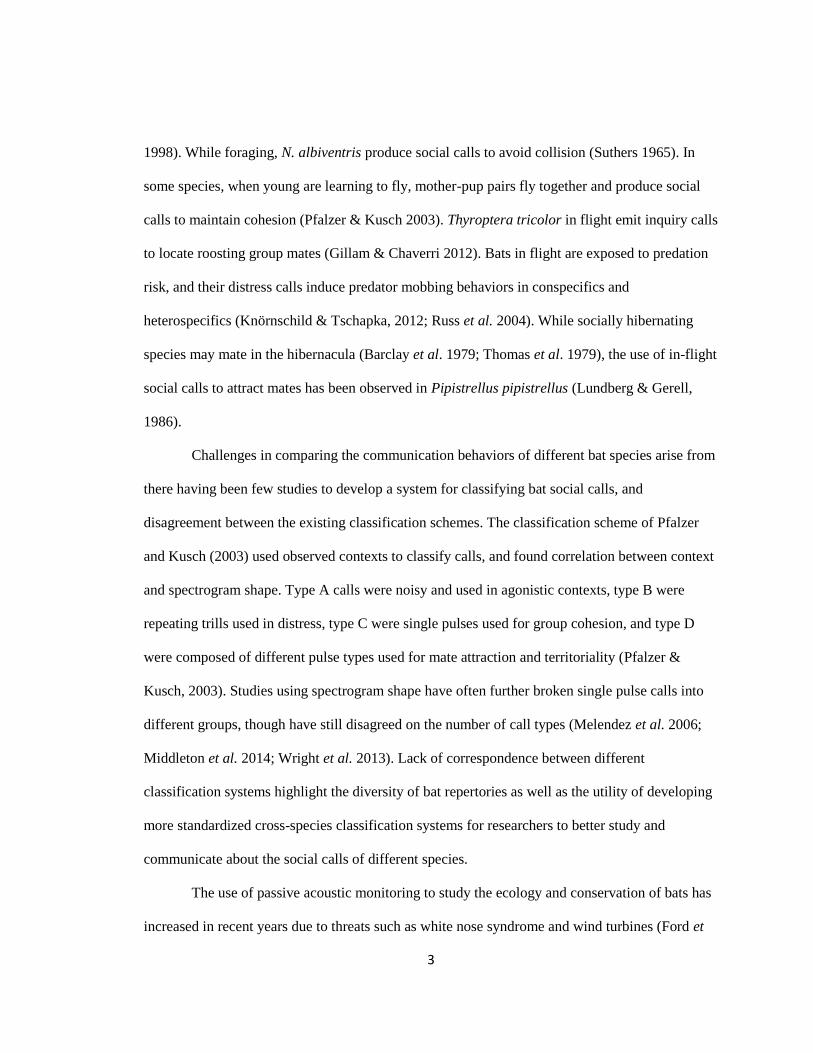
1998). While foraging, N. albiventris produce social calls to avoid collision (Suthers 1965). In
some species, when young are learning to fly, mother-pup pairs fly together and produce social
calls to maintain cohesion (Pfalzer & Kusch 2003). Thyroptera tricolor in flight emit inquiry calls
to locate roosting group mates (Gillam & Chaverri 2012). Bats in flight are exposed to predation
risk, and their distress calls induce predator mobbing behaviors in conspecifics and
heterospecifics (Knörnschild & Tschapka, 2012; Russ et al. 2004). While socially hibernating
species may mate in the hibernacula (Barclay et al. 1979; Thomas et al. 1979), the use of in-flight
social calls to attract mates has been observed in Pipistrellus pipistrellus (Lundberg & Gerell,
1986).
Challenges in comparing the communication behaviors of different bat species arise from
there having been few studies to develop a system for classifying bat social calls, and
disagreement between the existing classification schemes. The classification scheme of Pfalzer
and Kusch (2003) used observed contexts to classify calls, and found correlation between context
and spectrogram shape. Type A calls were noisy and used in agonistic contexts, type B were
repeating trills used in distress, type C were single pulses used for group cohesion, and type D
were composed of different pulse types used for mate attraction and territoriality (Pfalzer &
Kusch, 2003). Studies using spectrogram shape have often further broken single pulse calls into
different groups, though have still disagreed on the number of call types (Melendez et al. 2006;
Middleton et al. 2014; Wright et al. 2013). Lack of correspondence between different
classification systems highlight the diversity of bat repertories as well as the utility of developing
more standardized cross-species classification systems for researchers to better study and
communicate about the social calls of different species.
The use of passive acoustic monitoring to study the ecology and conservation of bats has
increased in recent years due to threats such as white nose syndrome and wind turbines (Ford et
4
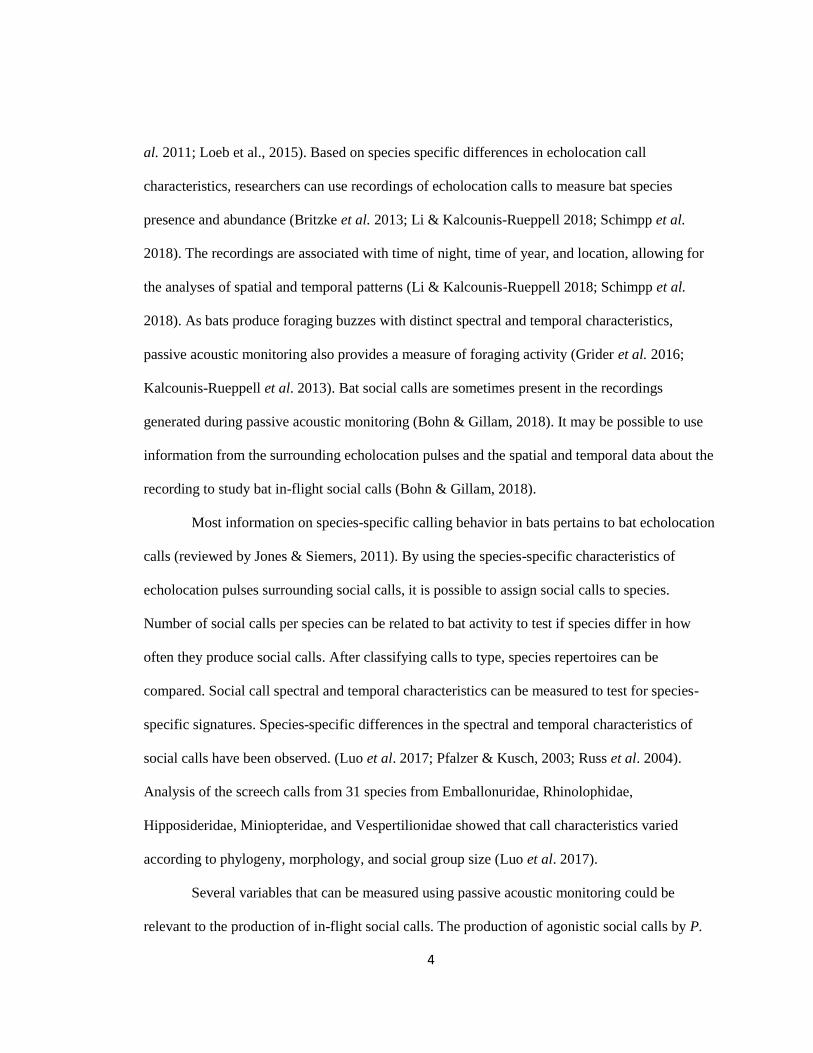
al. 2011; Loeb et al., 2015). Based on species specific differences in echolocation call
characteristics, researchers can use recordings of echolocation calls to measure bat species
presence and abundance (Britzke et al. 2013; Li & Kalcounis-Rueppell 2018; Schimpp et al.
2018). The recordings are associated with time of night, time of year, and location, allowing for
the analyses of spatial and temporal patterns (Li & Kalcounis-Rueppell 2018; Schimpp et al.
2018). As bats produce foraging buzzes with distinct spectral and temporal characteristics,
passive acoustic monitoring also provides a measure of foraging activity (Grider et al. 2016;
Kalcounis-Rueppell et al. 2013). Bat social calls are sometimes present in the recordings
generated during passive acoustic monitoring (Bohn & Gillam, 2018). It may be possible to use
information from the surrounding echolocation pulses and the spatial and temporal data about the
recording to study bat in-flight social calls (Bohn & Gillam, 2018).
Most information on species-specific calling behavior in bats pertains to bat echolocation
calls (reviewed by Jones & Siemers, 2011). By using the species-specific characteristics of
echolocation pulses surrounding social calls, it is possible to assign social calls to species.
Number of social calls per species can be related to bat activity to test if species differ in how
often they produce social calls. After classifying calls to type, species repertoires can be
compared. Social call spectral and temporal characteristics can be measured to test for species-
specific signatures. Species-specific differences in the spectral and temporal characteristics of
social calls have been observed. (Luo et al. 2017; Pfalzer & Kusch, 2003; Russ et al. 2004).
Analysis of the screech calls from 31 species from Emballonuridae, Rhinolophidae,
Hipposideridae, Miniopteridae, and Vespertilionidae showed that call characteristics varied
according to phylogeny, morphology, and social group size (Luo et al. 2017).
Several variables that can be measured using passive acoustic monitoring could be
relevant to the production of in-flight social calls. The production of agonistic social calls by P.
5
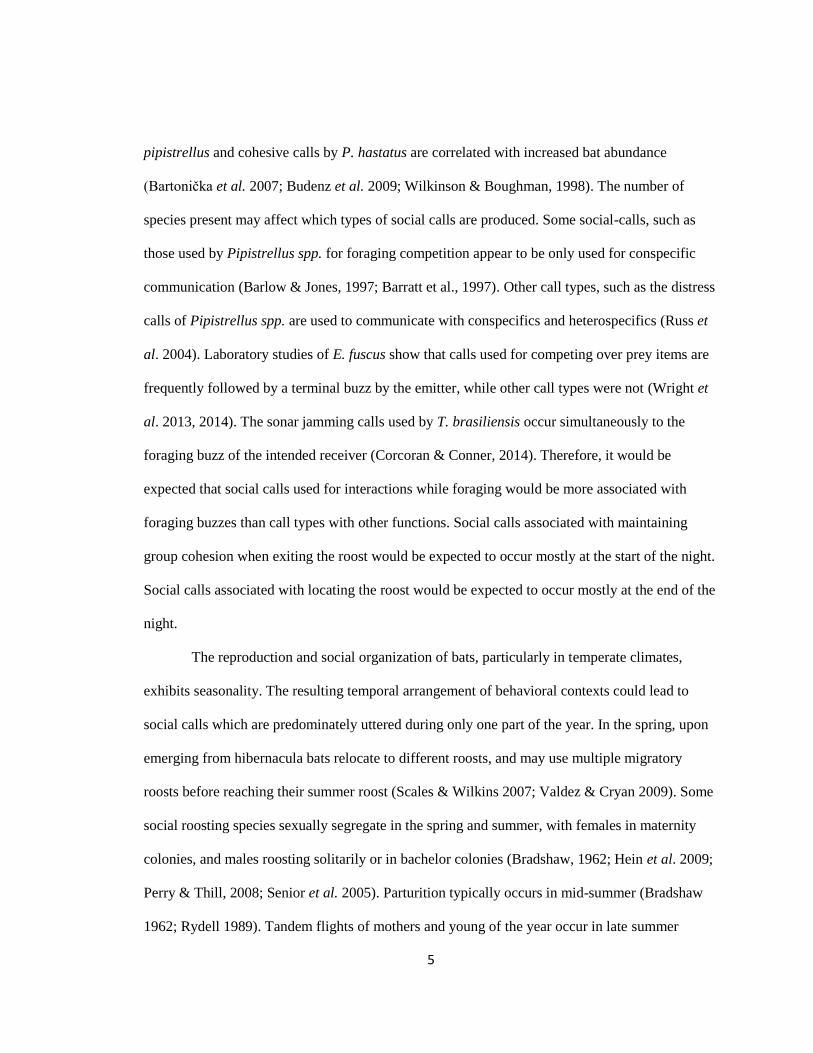
pipistrellus and cohesive calls by P. hastatus are correlated with increased bat abundance
(Bartonička et al. 2007; Budenz et al. 2009; Wilkinson & Boughman, 1998). The number of
species present may affect which types of social calls are produced. Some social-calls, such as
those used by Pipistrellus spp. for foraging competition appear to be only used for conspecific
communication (Barlow & Jones, 1997; Barratt et al., 1997). Other call types, such as the distress
calls of Pipistrellus spp. are used to communicate with conspecifics and heterospecifics (Russ et
al. 2004). Laboratory studies of E. fuscus show that calls used for competing over prey items are
frequently followed by a terminal buzz by the emitter, while other call types were not (Wright et
al. 2013, 2014). The sonar jamming calls used by T. brasiliensis occur simultaneously to the
foraging buzz of the intended receiver (Corcoran & Conner, 2014). Therefore, it would be
expected that social calls used for interactions while foraging would be more associated with
foraging buzzes than call types with other functions. Social calls associated with maintaining
group cohesion when exiting the roost would be expected to occur mostly at the start of the night.
Social calls associated with locating the roost would be expected to occur mostly at the end of the
night.
The reproduction and social organization of bats, particularly in temperate climates,
exhibits seasonality. The resulting temporal arrangement of behavioral contexts could lead to
social calls which are predominately uttered during only one part of the year. In the spring, upon
emerging from hibernacula bats relocate to different roosts, and may use multiple migratory
roosts before reaching their summer roost (Scales & Wilkins 2007; Valdez & Cryan 2009). Some
social roosting species sexually segregate in the spring and summer, with females in maternity
colonies, and males roosting solitarily or in bachelor colonies (Bradshaw, 1962; Hein et al. 2009;
Perry & Thill, 2008; Senior et al. 2005). Parturition typically occurs in mid-summer (Bradshaw
1962; Rydell 1989). Tandem flights of mothers and young of the year occur in late summer

6
(Pfalzer & Kusch 2003). Bats mate predominately in the fall, and in many species this is
associated with swarming to hibernacula (Bradshaw, 1962; Burns & Broders, 2015; Lundberg &
Gerell, 1986; Senior et al. 2005) however bats delay fertilization or implantation until the spring
(Bradshaw 1962; Kimura & Uchida 1983; Orr & Zuk 2013). Middleton (2006) observed
seasonality in the complex social calls of common pipistrelles, used for territoriality and mate
attraction, finding that call production peaked in April-May and again in September.
The objective of this study is to use passive acoustic monitoring to test the hypothesis
that bats use dedicated social calls to mediate different types of social interactions while flying.
To that end I have developed two specific aims. Aim 1 is to categorize the species-specific
differences in the in-flight social calls of insectivorous bats in the North Carolina Piedmont. Aim
2 is to categorize the contexts during which social calls are produced. For Aim 1, I predict that (1)
if bats use social calls for multiple functions in-flight, bats will produce different types of social-
calls with distinct spectral and temporal parameters, consistent with types produced by bats in
other regions. As bat species differ in social group organization, I predict (2) species will differ in
how often they produce social calls, and (3) proportional call type usage. I predict that (4) shared
called types exhibit greater between species variation than within species variation in spectral and
temporal characteristics, which could allow for species recognition. For Aim 2, I predict that the
production of social calls is related to behaviorally relevant factors such as bat activity, whether
multiple species are present, foraging activity, time of night, and time of year.
7
CHAPTER II
MATERIALS AND METHODS
Recording
I used recordings collected on the University of North Carolina at Greensboro campus,
Greensboro, North Carolina. The area in which I sampled includes Peabody Park and recreation
areas that are part of the UNCG Wetlands Project and described in Parker et al. (2018). Two sites
were in a mowed, recreational field area and the other two were in a forested area. One site in
each area contained a constructed wetland. Calls were recorded using Song Meter SMBAT4 FS
detectors (Wildlife Acoustics Inc. Massachusetts, United States). The detector had a sampling
rate of 256 kHz. Triggers were signals with a minimum frequency of 16 kHz, minimum
amplitude of 12 dB, and a minimum duration of 1.5 ms. Detectors were able to record
continuously, avoiding a loss of data due to lag during periods of high bat activity. The sampling
for this study was from March 15th, 2017 to June 30th, 2018. From each site I used 6 randomly
selected nights for March of 2017, and 11 randomly selected nights for each of the following
months. Due to detector failures, not all of the 684 possible detector nights could be sampled. I
used a final sample size of 679 detector nights for my analyses. To avoid having replication for
some seasons but not others, for analyses of the context of call production, I only used detector
nights from April 1st, 2017 to March 31st, 2018.
Social Call Identification
From the 679 detector nights of recordings, I examined all recorded calls, and I identified
social calls, by viewing the spectrogram for each recorded file in Kaleidoscope 4.3 (Wildlife
Acoustics Inc. Massachusetts, United States) in Bat Analysis Mode. Signal of interest parameters

8
were set between 8 and 120 kHz, 2 and 500 ms, with a maximum intersyllable gap of 500 ms, and
a minimum of 2 pulses. For viewing, the fast Fourier transformation window (FFT) was set to
256, with a window size of 128, and a maximum cache size of 256 MB. I considered social calls
as non-echolocation tonal sounds produced during bat passes that did not have another known
source. I considered a social call to be a complex social call rather than multiple social calls if the
calls were separated by silence without echolocation calls between the pulses, as is consistent
with previous studies (Pfalzer & Kusch, 2003; Wright et al. 2013).
While noisy bat social calls have been reported (Barclay et al. 1979; Pfalzer & Kusch
2003), these were in instances where researchers were able to visually confirm the vocalization as
coming from a bat. Given how little is known about the social calls of bats, particularly North
American species, without visual confirmation there is not sufficient evidence to conclude that a
noise pulse surrounded by echolocation calls was a bat vocalization.
Bat Species Identification
Social calls were assigned to bat species based on manually comparing the spectral and
temporal characteristics of the surrounding echolocation pulses to those reported in the Sonobat
reference library (Sonobat, DND Designs, Arcata, California) and to a library of known species
recordings generated from multiple bioacoustics studies (Buchler, 1980; Kunz & Parsons, 2009;
Kurta et al. 2007; Li & Wilkins, 2014; O’Farrell & Gannon, 1999; O’Farrell et al. 1999). I used
manual identification to species for bat passes with social calls because the presence of non-
echolocation calls, such as social calls, in a recording, can reduce the accuracy of automatic
identification software. Social calls were assigned to a species only when there was a single
species present in the recording based on at least three clear and complete echolocation calls with
call characteristics typical for that species and none with the typical call characteristics of another
species. Social calls in files where characteristic echolocation calls for multiple species were
9
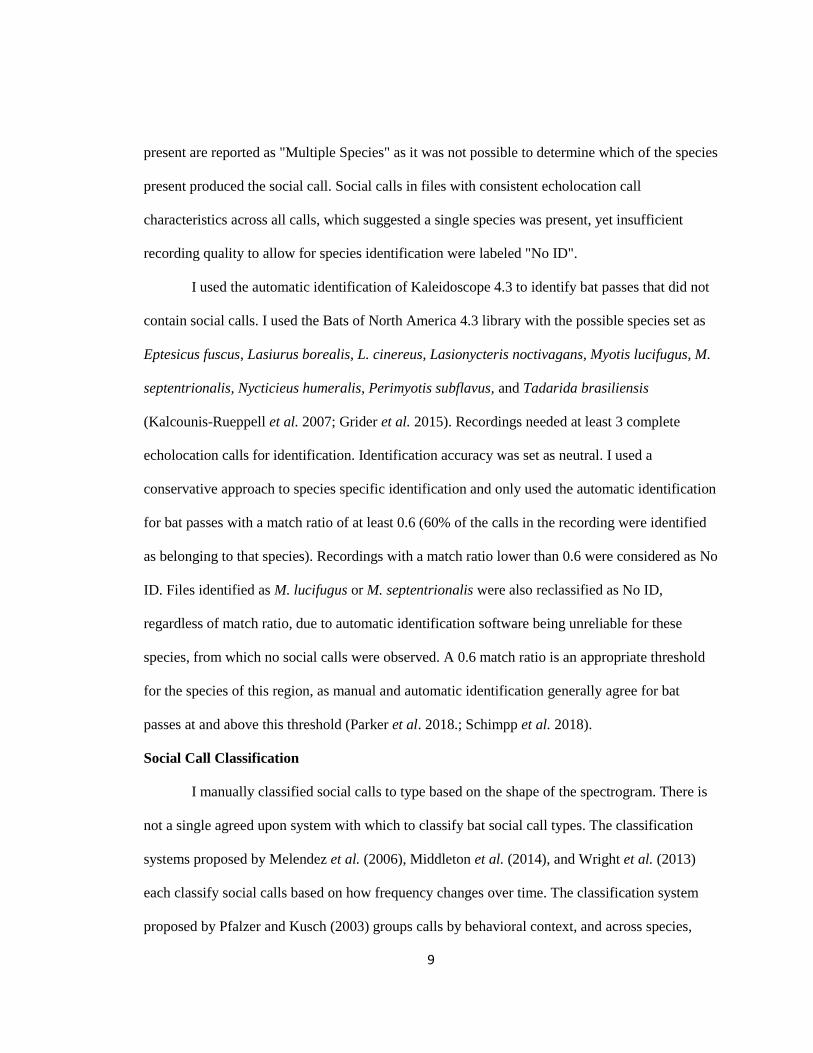
present are reported as "Multiple Species" as it was not possible to determine which of the species
present produced the social call. Social calls in files with consistent echolocation call
characteristics across all calls, which suggested a single species was present, yet insufficient
recording quality to allow for species identification were labeled "No ID".
I used the automatic identification of Kaleidoscope 4.3 to identify bat passes that did not
contain social calls. I used the Bats of North America 4.3 library with the possible species set as
Eptesicus fuscus, Lasiurus borealis, L. cinereus, Lasionycteris noctivagans, Myotis lucifugus, M.
septentrionalis, Nycticieus humeralis, Perimyotis subflavus, and Tadarida brasiliensis
(Kalcounis-Rueppell et al. 2007; Grider et al. 2015). Recordings needed at least 3 complete
echolocation calls for identification. Identification accuracy was set as neutral. I used a
conservative approach to species specific identification and only used the automatic identification
for bat passes with a match ratio of at least 0.6 (60% of the calls in the recording were identified
as belonging to that species). Recordings with a match ratio lower than 0.6 were considered as No
ID. Files identified as M. lucifugus or M. septentrionalis were also reclassified as No ID,
regardless of match ratio, due to automatic identification software being unreliable for these
species, from which no social calls were observed. A 0.6 match ratio is an appropriate threshold
for the species of this region, as manual and automatic identification generally agree for bat
passes at and above this threshold (Parker et al. 2018.; Schimpp et al. 2018).
Social Call Classification
I manually classified social calls to type based on the shape of the spectrogram. There is
not a single agreed upon system with which to classify bat social call types. The classification
systems proposed by Melendez et al. (2006), Middleton et al. (2014), and Wright et al. (2013)
each classify social calls based on how frequency changes over time. The classification system
proposed by Pfalzer and Kusch (2003) groups calls by behavioral context, and across species,
10
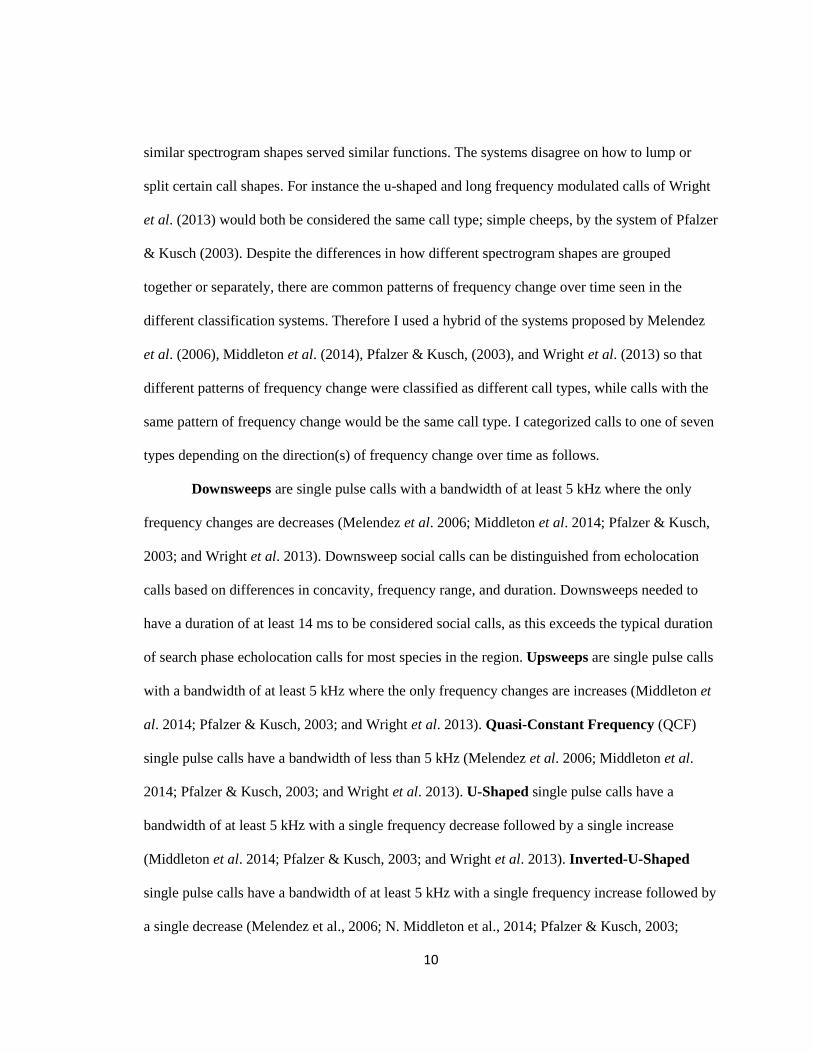
similar spectrogram shapes served similar functions. The systems disagree on how to lump or
split certain call shapes. For instance the u-shaped and long frequency modulated calls of Wright
et al. (2013) would both be considered the same call type; simple cheeps, by the system of Pfalzer
& Kusch (2003). Despite the differences in how different spectrogram shapes are grouped
together or separately, there are common patterns of frequency change over time seen in the
different classification systems. Therefore I used a hybrid of the systems proposed by Melendez
et al. (2006), Middleton et al. (2014), Pfalzer & Kusch, (2003), and Wright et al. (2013) so that
different patterns of frequency change were classified as different call types, while calls with the
same pattern of frequency change would be the same call type. I categorized calls to one of seven
types depending on the direction(s) of frequency change over time as follows.
Downsweeps are single pulse calls with a bandwidth of at least 5 kHz where the only
frequency changes are decreases (Melendez et al. 2006; Middleton et al. 2014; Pfalzer & Kusch,
2003; and Wright et al. 2013). Downsweep social calls can be distinguished from echolocation
calls based on differences in concavity, frequency range, and duration. Downsweeps needed to
have a duration of at least 14 ms to be considered social calls, as this exceeds the typical duration
of search phase echolocation calls for most species in the region. Upsweeps are single pulse calls
with a bandwidth of at least 5 kHz where the only frequency changes are increases (Middleton et
al. 2014; Pfalzer & Kusch, 2003; and Wright et al. 2013). Quasi-Constant Frequency (QCF)
single pulse calls have a bandwidth of less than 5 kHz (Melendez et al. 2006; Middleton et al.
2014; Pfalzer & Kusch, 2003; and Wright et al. 2013). U-Shaped single pulse calls have a
bandwidth of at least 5 kHz with a single frequency decrease followed by a single increase
(Middleton et al. 2014; Pfalzer & Kusch, 2003; and Wright et al. 2013). Inverted-U-Shaped
single pulse calls have a bandwidth of at least 5 kHz with a single frequency increase followed by
a single decrease (Melendez et al., 2006; N. Middleton et al., 2014; Pfalzer & Kusch, 2003;
11
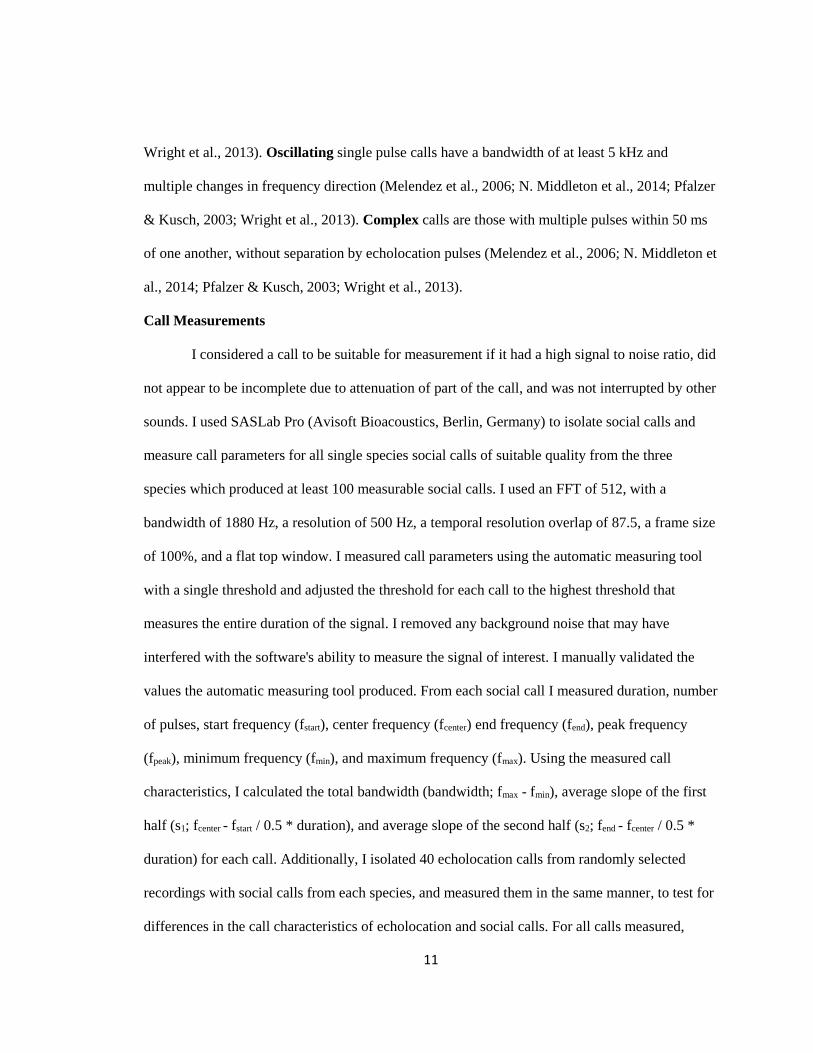
Wright et al., 2013). Oscillating single pulse calls have a bandwidth of at least 5 kHz and
multiple changes in frequency direction (Melendez et al., 2006; N. Middleton et al., 2014; Pfalzer
& Kusch, 2003; Wright et al., 2013). Complex calls are those with multiple pulses within 50 ms
of one another, without separation by echolocation pulses (Melendez et al., 2006; N. Middleton et
al., 2014; Pfalzer & Kusch, 2003; Wright et al., 2013).
Call Measurements
I considered a call to be suitable for measurement if it had a high signal to noise ratio, did
not appear to be incomplete due to attenuation of part of the call, and was not interrupted by other
sounds. I used SASLab Pro (Avisoft Bioacoustics, Berlin, Germany) to isolate social calls and
measure call parameters for all single species social calls of suitable quality from the three
species which produced at least 100 measurable social calls. I used an FFT of 512, with a
bandwidth of 1880 Hz, a resolution of 500 Hz, a temporal resolution overlap of 87.5, a frame size
of 100%, and a flat top window. I measured call parameters using the automatic measuring tool
with a single threshold and adjusted the threshold for each call to the highest threshold that
measures the entire duration of the signal. I removed any background noise that may have
interfered with the software's ability to measure the signal of interest. I manually validated the
values the automatic measuring tool produced. From each social call I measured duration, number
of pulses, start frequency (fstart), center frequency (fcenter) end frequency (fend), peak frequency
(fpeak), minimum frequency (fmin), and maximum frequency (fmax). Using the measured call
characteristics, I calculated the total bandwidth (bandwidth; fmax - fmin), average slope of the first
half (s1; fcenter - fstart / 0.5 * duration), and average slope of the second half (s2; fend - fcenter / 0.5 *
duration) for each call. Additionally, I isolated 40 echolocation calls from randomly selected
recordings with social calls from each species, and measured them in the same manner, to test for
differences in the call characteristics of echolocation and social calls. For all calls measured,

12
measurements were solely taken from the fundamental frequency. Data from harmonics were not
collected, as harmonics attenuate more rapidly, and are less likely to be detected in field
recordings.
Frequency was measured in kHz, and temporal characteristics were measured in
milliseconds (ms). Slopes were calculated and reported as kHz/ms, however for statistical
analyses slopes were transformed by multiplying the slope by ten, to ensure that the slope
characteristics are of the same order of magnitude as the other characteristics. Doing so did not
change the predictive capabilities of the discriminant function analysis (DFA) or the results of the
MANOVA. Having all variables be the same order of magnitude is necessary to properly
interpret the loading scores for the canonical variables. Variables with different orders of
magnitude have disproportionate loading scores.
Statistical Analysis
To test for species-specific differences in call production, I used a Chi-Squared to test if
the proportion of bat passes with social calls differed between E. fuscus, N humeralis, and T.
brasiliensis. To test for species-specific differences in call type usage, I used a Chi-Squared test
to compare the proportions of complex calls compared to all other social call types between E.
fuscus, N humeralis, and T. brasiliensis.
I performed DFA within species across call types to test whether the spectral and
temporal characteristics of social calls differ from echolocation calls and between different social
call types. DFA procedures have a high risk of Type I errors if the dataset has psuedoreplicates
(Mundry & Sommer, 2007). Social calls in the same bat pass are likely to be from the same
individual. For bat passes where there were multiple measured calls of the same type, I calculated
the average parameter values for all calls of that type in that recording and treated the average
values as a single call. I only conducted statistical analysis on call types where there were more
13
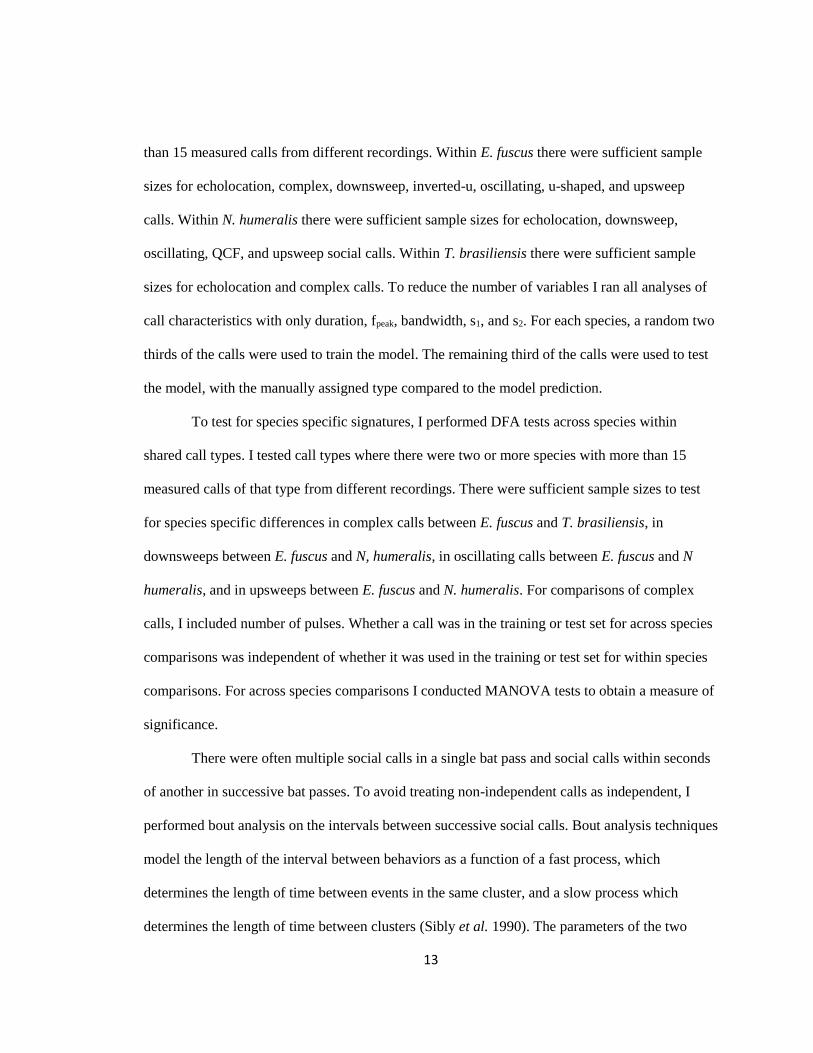
than 15 measured calls from different recordings. Within E. fuscus there were sufficient sample
sizes for echolocation, complex, downsweep, inverted-u, oscillating, u-shaped, and upsweep
calls. Within N. humeralis there were sufficient sample sizes for echolocation, downsweep,
oscillating, QCF, and upsweep social calls. Within T. brasiliensis there were sufficient sample
sizes for echolocation and complex calls. To reduce the number of variables I ran all analyses of
call characteristics with only duration, fpeak, bandwidth, s1, and s2. For each species, a random two
thirds of the calls were used to train the model. The remaining third of the calls were used to test
the model, with the manually assigned type compared to the model prediction.
To test for species specific signatures, I performed DFA tests across species within
shared call types. I tested call types where there were two or more species with more than 15
measured calls of that type from different recordings. There were sufficient sample sizes to test
for species specific differences in complex calls between E. fuscus and T. brasiliensis, in
downsweeps between E. fuscus and N, humeralis, in oscillating calls between E. fuscus and N
humeralis, and in upsweeps between E. fuscus and N. humeralis. For comparisons of complex
calls, I included number of pulses. Whether a call was in the training or test set for across species
comparisons was independent of whether it was used in the training or test set for within species
comparisons. For across species comparisons I conducted MANOVA tests to obtain a measure of
significance.
There were often multiple social calls in a single bat pass and social calls within seconds
of another in successive bat passes. To avoid treating non-independent calls as independent, I
performed bout analysis on the intervals between successive social calls. Bout analysis techniques
model the length of the interval between behaviors as a function of a fast process, which
determines the length of time between events in the same cluster, and a slow process which
determines the length of time between clusters (Sibly et al. 1990). The parameters of the two
14
process model give the probability densities of fast and slow process events, and the ratio of fast
to slow process events, which are used to determine the maximum interval for behaviors in the
same cluster (Sibly et al. 1990, Langton et al. 1995). I used maximum likelihood bout analysis
(Langton et al. 1995), as this method is not effected by subjective choices of histogram bin width
(Luque & Guinet, 2007). Intervals were not recorded for the first social call of the detector night.
Intervals longer than three hours were not included in the model, as the model produces divide by
zero errors if excessively large and rare intervals are not excluded. Using the criterion determined
by bout analysis, I grouped together social calls that were not temporally independent of one
another. It is not possible to determine whether the calls are all from the same individual, or a call
and response interaction between multiple individuals. Clusters of social calls and temporally
isolated social calls were considered independent social call bouts. I performed Chi-Squared tests
on the proportion of calls in clusters for each call type, using the proportion of calls in clusters
across types as the expected proportion.
Time of night was analyzed using time after sunset, based on the time of sunset reported
for Greensboro, North Carolina by the National Oceanic and Atmospheric Administration Solar
Calculator (National Oceanic and Atmospheric Administration). I calculated bat activity per hour
after sunset as the number of bat passes within that hour. I ran a binary logistic regression on the
presence-absence of social calls regardless of type, for each hour after sunset, as a function of
hourly bat activity and hour after sunset.
Bouts were classified based on the type(s) of social calls present. Total number of calls,
number of calls per type, and ordering of calls were not used to classify bouts. For each bout I
determined whether it was in a single or multiple species bat pass, and whether it was in a bat
pass with a foraging buzz. Winter was defined as December 21st to March 20th, spring as March
21st to June 20th, summer as June 21st to September 20th, and fall as September 21st to December
15
20th. I used multivariate logistic regression to model bout type as a function of single or multiple
species context, the presence of foraging buzzes, hourly bat activity, season, hour after sunset,
and site.
Only bout types with 100 or more recorded instances were used in the multivariate
logistic regression. There were sufficient sample sizes for bouts containing solely complex calls,
bouts containing solely downsweep calls, bouts containing solely upsweep calls, and bouts
containing both downsweep and upsweep calls. Multinomial logistic regression requires one
category of the response variable to be the reference group. I used complex calls as the reference
group due to direct observational studies showing complex calls serving different functions than
single pulse calls (Pfalzer & Kusch, 2003). For species present, single species was used as the
reference category. For foraging activity, the absence of foraging buzzes was used as the
reference category. For season, winter was used as the reference category. For site, the open field
non-wetland site was used as the reference category. All bouts, regardless of species were
included in the model as prior work shows that the same call types serve the same functions
across species (Pfalzer & Kusch, 2003). All statistical analyses were conducted in R (R Core
Team, 2018). I used the packages MASS for DFA tests (Venables & Ripley 2002), diveMove for
bout analysis (Luque 2007), nnet for multinomial logistic regression (Venables & Ripley, 2002),
and ggplot2 for data visualization (Wickham 2016).

16
CHAPTER III
RESULTS
Calls Recorded
I examined 123,007 recordings from 679 detector nights, 97,543 of which were
recordings of bats and 25,464 of which were noise. Of the bat recordings, 2,883 recordings
contained one or more bat social calls (3.0%). Within the 2,883 recordings, 6,614 individual
social calls were identified (mean of 2.3 social calls per bat pass, Table 1). In 1,558 (54.0%) of
the recordings with social calls, a single, identifiable species was present, allowing the 3,772
social calls they contained to be assigned to as either E. fuscus, L. borealis, L. cinereus, N.
humeralis, P. subflavus, or T. brasiliensis (mean of 2.4 social calls per bat pass identifiable to
species) In 1,147 (40.0%) recordings, two or more species were present, and therefore the 2,475
social calls from these recordings could not be identified to a single species (mean of 2.2 social
calls per bat pass with multiple species present). The remaining 178 (6.0%) recordings appeared
to contain only one species, but the echolocation calls were insufficient to determine which
species, and these contained 367 social calls (mean of 2.1 social calls per bat pass with a single,
unidentifiable species).
For single species bat passes with social calls, I compared manual classification to the
automatic identification results. Manual and automatic classification agreed for 81.3% of
the1,171 passes assigned to a specific species by both methods (Figure 1). When looking
specifically at bat passes at or above the match ratio threshold of 0.6, there was agreement for
90.6% of bat passes assigned to a specific species. Additionally, there were 421 bat passes that
could be identified manually but not with automatic identification. Only three species produced
17
sufficient sample sizes for statistical analysis. I observed all seven proposed social call types,
though not all species produced all call types (Figure 2).
Species Specific Differences in Call Production
I observed 28,598 bat passes that could be confidently identified as E. fuscus, 3,868 that
could be confidently identified as N. humeralis, and 1,678 that could be confidently identified as
T. brasiliensis. For bat passes classified using automatic identification, 74.4% of those labeled E.
fuscus, 42.6% of those labeled N. humeralis, and 60.1% of those labeled T. brasiliensis were at or
above the match ratio threshold of 0.6. Of E. fuscus bat passes, 682 (2.4%) contained at least one
social call. Of N. humeralis bat passes, 771 (19.9%) contained at least one social call. Of T.
brasiliensis bat passes, 63 (3.8%) contained at least one social call. The proportions of bat passes
with social calls significantly differs by species (X2 = 2474.7, d.f. = 2, p < 0.0001). Within bat
passes containing social calls, E. fuscus produced an average of 2.93 social calls per bat pass. N.
humeralis produced an average of 2.02 social calls per bat pass. T. brasiliensis produced an
average of 2.0 social calls per bat pass.
I tested for proportional differences in the usage of complex social calls between E.
fuscus, N. humeralis, and T. brasiliensis. There were significant differences in the proportion of
social calls that were complex calls between the three species (X2 = 875.4, d.f. = 2, p < 0.0001).
Complex calls made up 42.6 % of E. fuscus social calls recorded, 0.8% of N. humeralis social
calls recorded, and 56.7% of T. brasiliensis social calls recorded (Table 1). For E. fuscus and T.
brasiliensis, complex calls were the most common type produced. For N. humeralis, downsweep
calls were the most common type produced (57.5% of N. humeralis social calls, Table 1). All
seven proposed call types were observed to be produced by E. fuscus. There were no observations
of N. humeralis producing inverted-u calls, or of T. brasiliensis producing QCF calls.
18
Call Classification
There were sufficient sample sizes for statistical analyses for E. fuscus, N. humeralis, and
T. brasiliensis. I measured spectral and temporal characteristics for 1,853 social calls and 120
echolocation calls (Table 2).
For DFA within E. fuscus the training set consisted of 357 calls and the test set consisted
of 175 calls. The DFA produced five canonical dimensions explaining variation between call
types. Duration, s1, and s2, were the most important variables for discriminating call types (Table
3). The model agreed with manual classification for 86.9% of the calls in the test set (Figure 3).
For all call types except for oscillating, of which there were only four calls in the test set, the
DFA agreed with manual classification more often than not. Three of the eighteen echolocation
calls were confused for social calls, and no social calls were confused for echolocation calls.
For DFA within N. humeralis the training set consisted of 460 calls, and the test set
consisted of 237 calls. The DFA produced four canonical dimensions explaining variation
between call types. Loading values indicate the duration, s1, and s2 were most useful for
discriminating call types (Table 4). The model agreed with manual classification for 96.6% of
calls in the test set (Figure 4). There were no instances of echolocation calls confused for social
calls or social calls confused for echolocation calls.
For DFA within T. brasiliensis the training set consisted of 38 calls and the test set
consisted of 27 calls. With two groups, only a single canonical dimension was produced, which
was primarily explained by variation in fpeak, bandwidth, and s1 (loading scores: duration < -0.001,
fpeak: 0.114, bandwidth: -0.159, s1: -0.129, s2: 0.004). The DFA agreed with manual classification
for all calls in the test set.
19
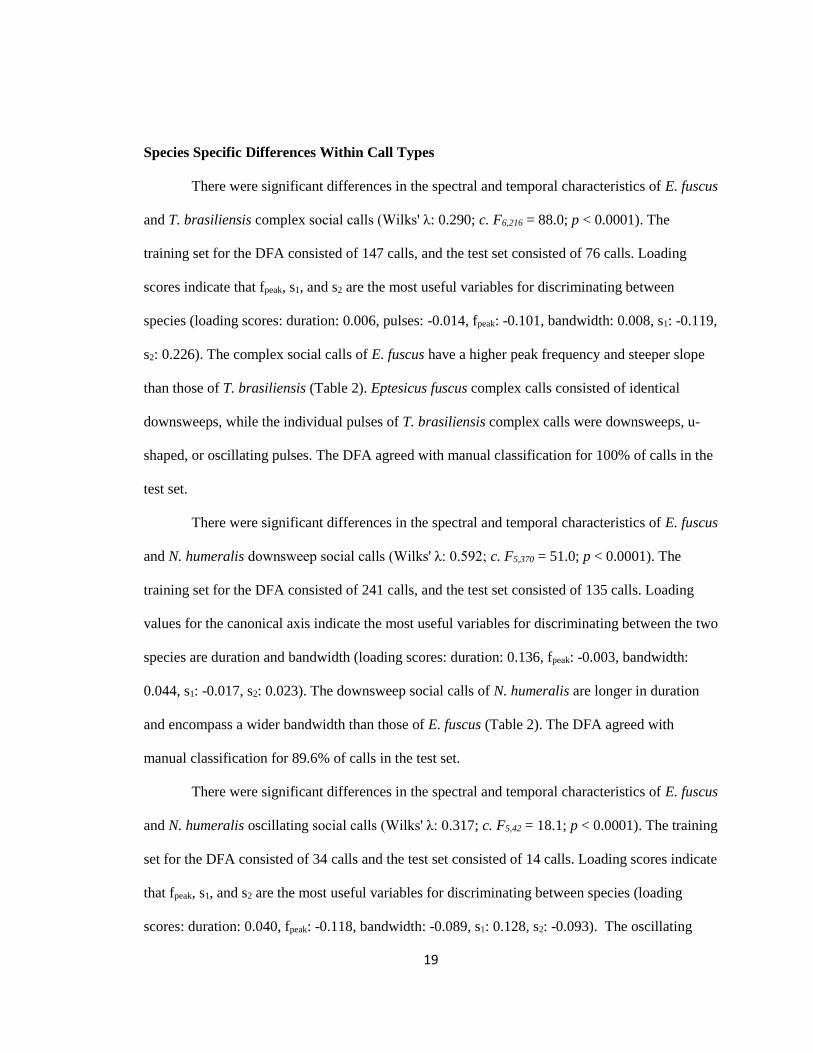
Species Specific Differences Within Call Types
There were significant differences in the spectral and temporal characteristics of E. fuscus
and T. brasiliensis complex social calls (Wilks' λ: 0.290; c. F6,216 = 88.0; p < 0.0001). The
training set for the DFA consisted of 147 calls, and the test set consisted of 76 calls. Loading
scores indicate that fpeak, s1, and s2 are the most useful variables for discriminating between
species (loading scores: duration: 0.006, pulses: -0.014, fpeak: -0.101, bandwidth: 0.008, s1: -0.119,
s2: 0.226). The complex social calls of E. fuscus have a higher peak frequency and steeper slope
than those of T. brasiliensis (Table 2). Eptesicus fuscus complex calls consisted of identical
downsweeps, while the individual pulses of T. brasiliensis complex calls were downsweeps, u-
shaped, or oscillating pulses. The DFA agreed with manual classification for 100% of calls in the
test set.
There were significant differences in the spectral and temporal characteristics of E. fuscus
and N. humeralis downsweep social calls (Wilks' λ: 0.592; c. F5,370 = 51.0; p < 0.0001). The
training set for the DFA consisted of 241 calls, and the test set consisted of 135 calls. Loading
values for the canonical axis indicate the most useful variables for discriminating between the two
species are duration and bandwidth (loading scores: duration: 0.136, fpeak: -0.003, bandwidth:
0.044, s1: -0.017, s2: 0.023). The downsweep social calls of N. humeralis are longer in duration
and encompass a wider bandwidth than those of E. fuscus (Table 2). The DFA agreed with
manual classification for 89.6% of calls in the test set.
There were significant differences in the spectral and temporal characteristics of E. fuscus
and N. humeralis oscillating social calls (Wilks' λ: 0.317; c. F5,42 = 18.1; p < 0.0001). The training
set for the DFA consisted of 34 calls and the test set consisted of 14 calls. Loading scores indicate
that fpeak, s1, and s2 are the most useful variables for discriminating between species (loading
scores: duration: 0.040, fpeak: -0.118, bandwidth: -0.089, s1: 0.128, s2: -0.093). The oscillating
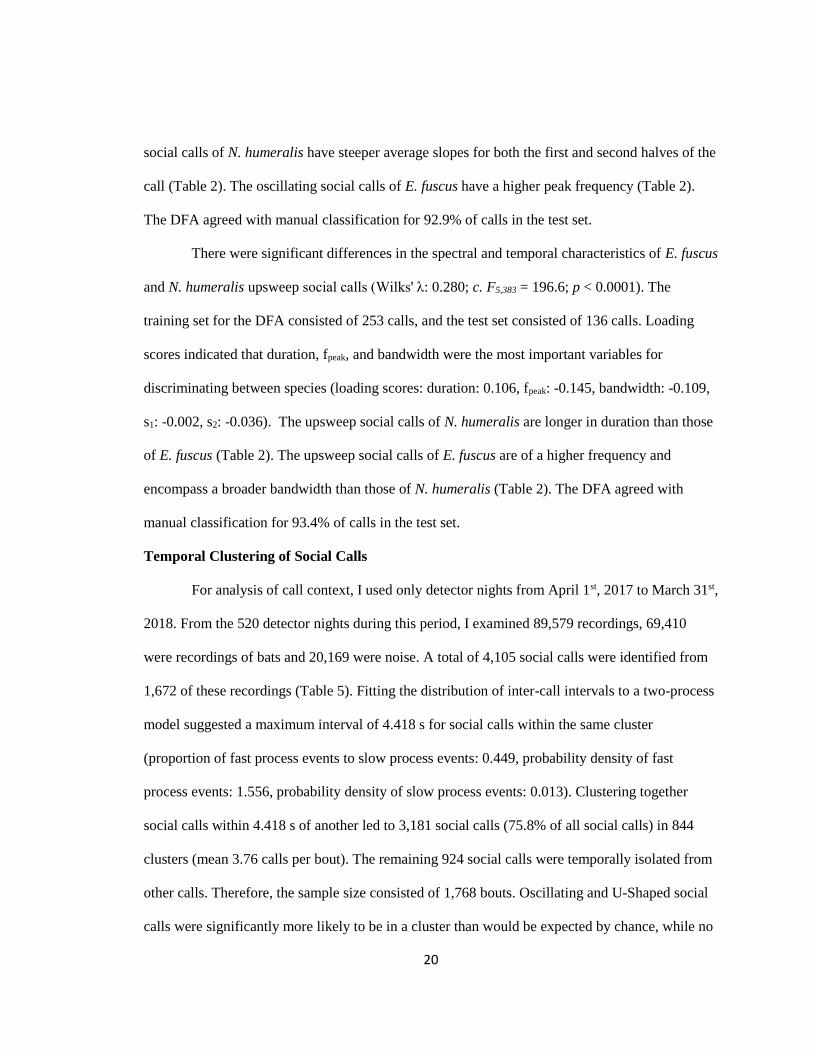
20
social calls of N. humeralis have steeper average slopes for both the first and second halves of the
call (Table 2). The oscillating social calls of E. fuscus have a higher peak frequency (Table 2).
The DFA agreed with manual classification for 92.9% of calls in the test set.
There were significant differences in the spectral and temporal characteristics of E. fuscus
and N. humeralis upsweep social calls (Wilks' λ: 0.280; c. F5,383 = 196.6; p < 0.0001). The
training set for the DFA consisted of 253 calls, and the test set consisted of 136 calls. Loading
scores indicated that duration, fpeak, and bandwidth were the most important variables for
discriminating between species (loading scores: duration: 0.106, fpeak: -0.145, bandwidth: -0.109,
s1: -0.002, s2: -0.036). The upsweep social calls of N. humeralis are longer in duration than those
of E. fuscus (Table 2). The upsweep social calls of E. fuscus are of a higher frequency and
encompass a broader bandwidth than those of N. humeralis (Table 2). The DFA agreed with
manual classification for 93.4% of calls in the test set.
Temporal Clustering of Social Calls
For analysis of call context, I used only detector nights from April 1st, 2017 to March 31st,
2018. From the 520 detector nights during this period, I examined 89,579 recordings, 69,410
were recordings of bats and 20,169 were noise. A total of 4,105 social calls were identified from
1,672 of these recordings (Table 5). Fitting the distribution of inter-call intervals to a two-process
model suggested a maximum interval of 4.418 s for social calls within the same cluster
(proportion of fast process events to slow process events: 0.449, probability density of fast
process events: 1.556, probability density of slow process events: 0.013). Clustering together
social calls within 4.418 s of another led to 3,181 social calls (75.8% of all social calls) in 844
clusters (mean 3.76 calls per bout). The remaining 924 social calls were temporally isolated from
other calls. Therefore, the sample size consisted of 1,768 bouts. Oscillating and U-Shaped social
calls were significantly more likely to be in a cluster than would be expected by chance, while no
21
call types were significantly more likely to be temporally isolated than would be expected by
chance (Table 6).
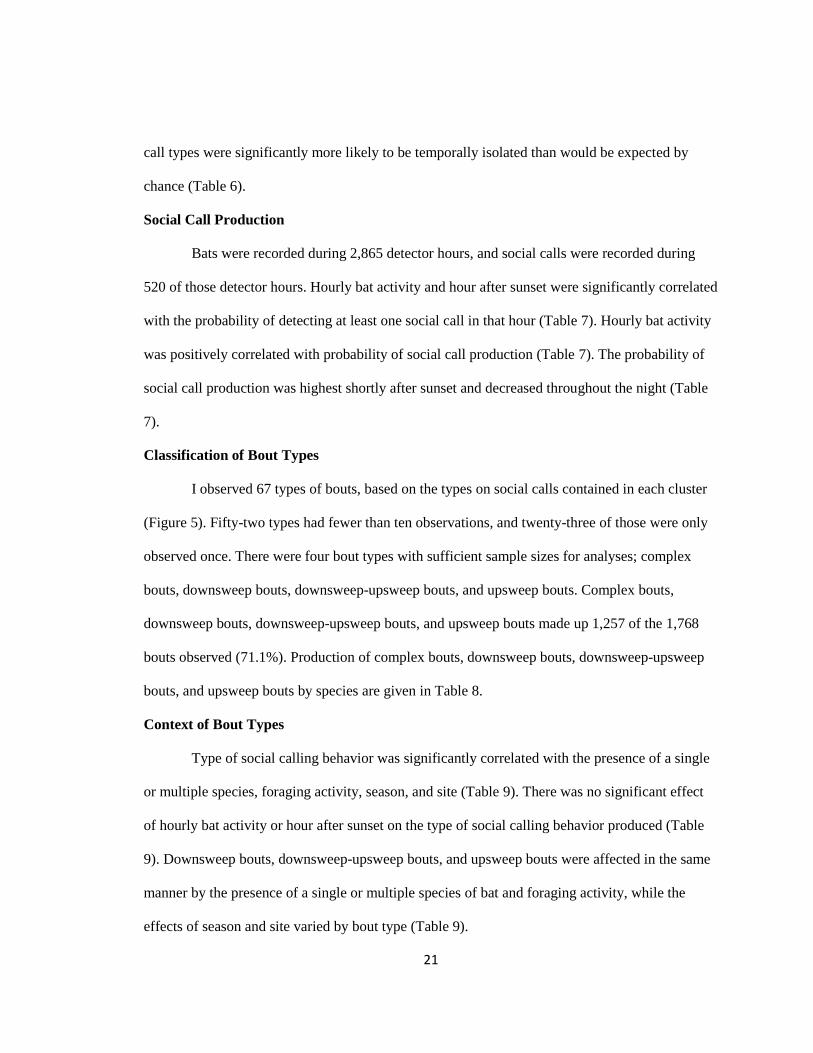
Social Call Production
Bats were recorded during 2,865 detector hours, and social calls were recorded during
520 of those detector hours. Hourly bat activity and hour after sunset were significantly correlated
with the probability of detecting at least one social call in that hour (Table 7). Hourly bat activity
was positively correlated with probability of social call production (Table 7). The probability of
social call production was highest shortly after sunset and decreased throughout the night (Table
7).
Classification of Bout Types
I observed 67 types of bouts, based on the types on social calls contained in each cluster
(Figure 5). Fifty-two types had fewer than ten observations, and twenty-three of those were only
observed once. There were four bout types with sufficient sample sizes for analyses; complex
bouts, downsweep bouts, downsweep-upsweep bouts, and upsweep bouts. Complex bouts,
downsweep bouts, downsweep-upsweep bouts, and upsweep bouts made up 1,257 of the 1,768
bouts observed (71.1%). Production of complex bouts, downsweep bouts, downsweep-upsweep
bouts, and upsweep bouts by species are given in Table 8.
Context of Bout Types
Type of social calling behavior was significantly correlated with the presence of a single
or multiple species, foraging activity, season, and site (Table 9). There was no significant effect
of hourly bat activity or hour after sunset on the type of social calling behavior produced (Table
9). Downsweep bouts, downsweep-upsweep bouts, and upsweep bouts were affected in the same
manner by the presence of a single or multiple species of bat and foraging activity, while the
effects of season and site varied by bout type (Table 9).
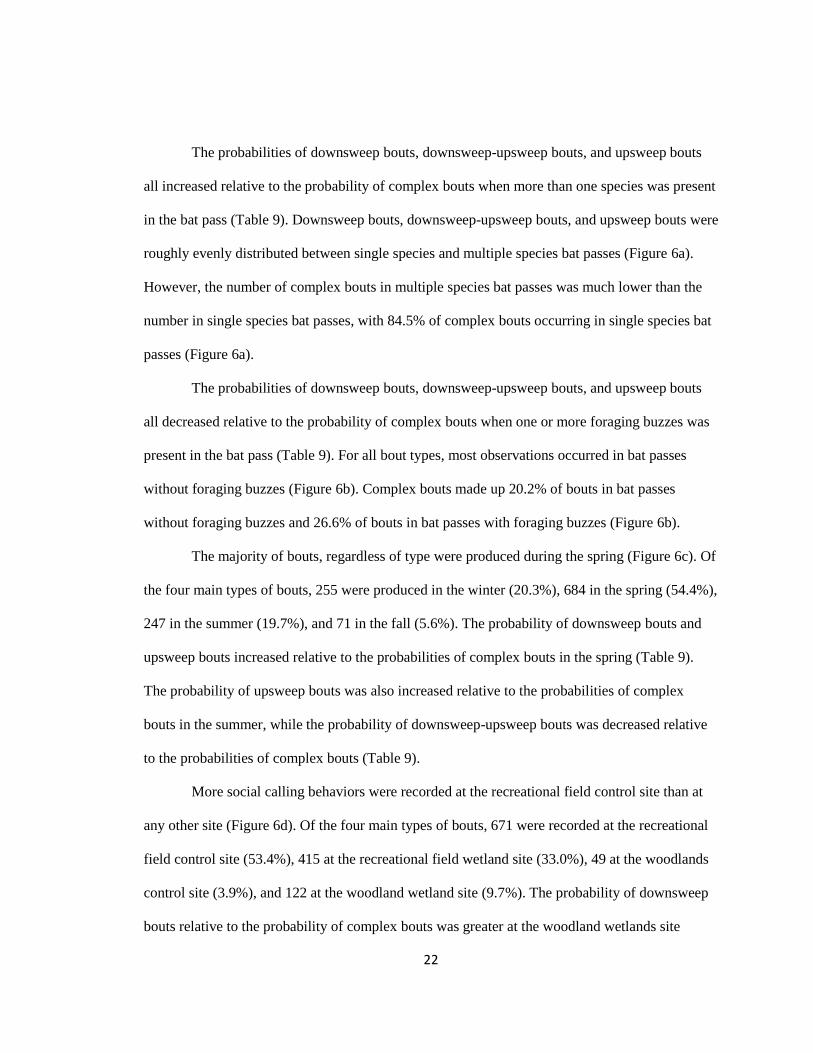
22
The probabilities of downsweep bouts, downsweep-upsweep bouts, and upsweep bouts
all increased relative to the probability of complex bouts when more than one species was present
in the bat pass (Table 9). Downsweep bouts, downsweep-upsweep bouts, and upsweep bouts were
roughly evenly distributed between single species and multiple species bat passes (Figure 6a).
However, the number of complex bouts in multiple species bat passes was much lower than the
number in single species bat passes, with 84.5% of complex bouts occurring in single species bat
passes (Figure 6a).
The probabilities of downsweep bouts, downsweep-upsweep bouts, and upsweep bouts
all decreased relative to the probability of complex bouts when one or more foraging buzzes was
present in the bat pass (Table 9). For all bout types, most observations occurred in bat passes
without foraging buzzes (Figure 6b). Complex bouts made up 20.2% of bouts in bat passes
without foraging buzzes and 26.6% of bouts in bat passes with foraging buzzes (Figure 6b).
The majority of bouts, regardless of type were produced during the spring (Figure 6c). Of
the four main types of bouts, 255 were produced in the winter (20.3%), 684 in the spring (54.4%),
247 in the summer (19.7%), and 71 in the fall (5.6%). The probability of downsweep bouts and
upsweep bouts increased relative to the probabilities of complex bouts in the spring (Table 9).
The probability of upsweep bouts was also increased relative to the probabilities of complex
bouts in the summer, while the probability of downsweep-upsweep bouts was decreased relative
to the probabilities of complex bouts (Table 9).
More social calling behaviors were recorded at the recreational field control site than at
any other site (Figure 6d). Of the four main types of bouts, 671 were recorded at the recreational
field control site (53.4%), 415 at the recreational field wetland site (33.0%), 49 at the woodlands
control site (3.9%), and 122 at the woodland wetland site (9.7%). The probability of downsweep
bouts relative to the probability of complex bouts was greater at the woodland wetlands site

23
(Table 9). The probability of downsweep-upsweep bouts was lower relative to the probability of
complex bouts at the woodlands control site (Table 9).
24
CHAPTER IV
DISCUSSION
I identified seven types of in-flight social calls produced by six species of insectivorous
bats in an urban park setting in Greensboro, North Carolina, using passive acoustic monitoring. I
analyzed species-specific differences in call production and call characteristics for the three
species which produced the most social calls; E. fuscus, N. humeralis, and T. brasiliensis. The
three species differed in how often they produced social calls, relative to their total activity, and
proportional call type usage. I detected species specific signatures in the temporal and spectral
characteristics of E. fuscus and T. brasiliensis complex calls, and E. fuscus and N. humeralis
downsweep calls, oscillating calls, and upsweep calls. Social calls were often temporally
clustered into independent social calling bouts. The most common bouts were those consisting of
solely complex calls, solely downsweep calls, solely upsweep calls, and combinations of
downsweep and upsweep calls. Production of bouts regardless of type was positively correlated
with bat activity and negatively correlated with time after sunset. Neither bat activity nor time
after sunset affected which type of bout was produced. Complex bouts were more likely to occur
when bats were foraging, while downsweep bouts, downsweep-upsweep bouts, and upsweep
bouts were more likely to be produced when multiple species were present.
The social call types detected using passive acoustic monitoring are broadly consistent
with those from laboratory studies and studies of European species (Melendez et al. 2006;
Middleton et al. 2014; Pfalzer & Kusch, 2003; Wright et al. 2013). Most of the call types I
recorded for E. fuscus are consistent with the laboratory studies of Wright et al. (2013), however
they did not observe the oscillating call observed here, and I did not observe the short frequency
25
modulated call they reported. To my knowledge this is the first time these social calls have been
observed for E. fuscus in the field, as well as for N. humeralis in any context. Interesting, the
oscillating call of N. humeralis greatly resembles calls used by T. brasiliensis to mediate mother-
pup interactions in the roost (Bohn et al. 2008). The oscillating calls produced by T. brasiliensis
in-flight did not resemble the N. humeralis oscillating call, but rather the sonar jamming
oscillating calls reported by Corcoran & Conner (2014) or individual pulses from the complex
calls. The song-like, complex calls of T. brasiliensis have mostly been described from studies in
the roost or laboratory, however they have also been observed in flight (Bohn & Gillam, 2018;
Bohn et al. 2008).
Social calls were differentiated from echolocation calls through visual examination of
spectrogram shape, and this difference was supported by the DFA. While downsweep social calls
and echolocation calls both have frequency solely decreasing through the call, downsweep social
calls are not likely to be abnormal echolocation calls. Within species mean duration of
downsweeps exceeded twice the duration of echolocation calls and frequency characteristics for
downsweeps were consistently lower than corresponding frequency characteristics for
echolocation calls. While T. brasiliensis echolocation calls do increase in duration when flying at
high altitudes, the bandwidth decreases to near constant frequency, making it unlikely that the
broadband downsweep calls are actually isolated calls from distant and high-altitude T.
brasiliensis (Gillam et al. 2009). The echolocation calls of high-altitude T. brasiliensis still have a
peak frequency of approximately 25 kHz, therefore it is unlikely that the higher frequency QCF
calls were high altitude T. brasiliensis echolocation calls mistaken for social calls (Gillam et al.
2009).
I found species specific differences in the temporal and spectral characteristics of all call
types tested. Analysis of the screech calls of 31 species of bats from 5 families in China showed
26
species specific differences in social call characteristics correlated with phylogeny, morphology,
and social group size (Luo et al. 2017). While three species are insufficient for a phylogenetic
analysis of the causes of variation, it is interesting to note that the direction of species-specific
differences between two species were not consistent across call types. Eptesicus fuscus upsweeps
were higher frequency and higher bandwidth than N. humeralis upsweeps, while E. fuscus
downsweeps were lower frequency and lower bandwidth than N. humeralis downsweeps.
The presence of species-specific signatures in social calls indicates it is possible that a bat
listening to the call would be able to discern emitter species. However, playback experiments
would be needed to determine if bats actually attend to these differences in social call
characteristics. Playback studies have yielded mixed results as to whether bats attend to species-
specific signatures (Russ et al. 2004; Schöner et al. 2010). Whether species discrimination occurs
may depend on call function. Entering a roost of heterospecifics would likely be disadvantageous,
and therefore species discrimination would be expected, while deterring a predator may be
advantageous regardless of the species of the predator’s immediate prey, and therefore species
discrimination would not occur (Russ et al. 2004; Schöner et al. 2010). I found that call types
varied in how often they were recorded during multiple species bat passes, suggesting some types
function for communicating with heterospecifics.
The most common call type for E. fuscus was the complex call, and the majority of
complex calls were produced by E. fuscus. Complex bouts were more associated with foraging
than were other bout types. In a laboratory setting, E. fuscus complex call were emitted when two
bats were approaching the same insect (Wright et al. 2014). Complex calls functioned for food
item defense, where the bat closer to the insect emitted the call and the second bat would alter its
flight trajectory to avoid the emitter and the insect (Wright et al. 2014). In the field, complex
bouts were unlikely to be detected in a multiple species bat pass, suggesting this food item
27
defense interaction occurs predominantly between conspecifics. While all species used in this
study are insectivorous, they exhibit preferences for different insect taxa (Safi & Kerth, 2007). It
is not surprising that a call associated with food item defense would be predominately found in
single species contexts, as conspecifics present more competition for food than do
heterospecifics. The use of complex calls to compete for food solely with conspecifics has also
been observed in P. pipistrellus and P. pygmaeus, each of which only respond to conspecific
complex calls (Barlow & Jones, 1997; Barratt et al. 1997). The social call production of E. fuscus
suggests the most common in-flight social interaction for this species is to compete with
conspecifics for food.
Social call production relative to activity for N. humeralis far exceeded that of E. fuscus
and T. brasiliensis. The most common social call type produced by N. humeralis was the
downsweep. Nycticeius humeralis also often produced upsweep calls. Production of downsweep,
downsweep-upsweep, and upsweep bouts exhibited similar contexts, suggesting some
redundancy in call function. In other species downsweep calls have been observed to function in
maintaining group cohesion (Carter et al. 2012; Pfalzer & Kusch, 2003). Female N. humeralis
cooperatively forage (Wilkinson, 1992). Maintaining group cohesion while cooperating could
explain why N. humeralis produces social calls more often than other species. Social calls have
been observed to function in maintaining group cohesion when commuting to foraging patches in
Phyllostomus hastatus (Wilkinson & Boughman, 1998). However, the negative association
between downsweep and upsweep calls and foraging buzzes suggests that, even if used to
maintain group cohesion when commuting, N. humeralis does not use them to advertise foraging
patches. Bats respond to the foraging buzzes of conspecifics (Dechmann et al. 2009). It is
possible that cooperatively foraging N. humeralis use social calls to maintain cohesion when
commuting, and then attend to foraging buzzes as a cue when prey has actually been located.

28
While bats can attend to echolocation calls to maintain group cohesion (Dechmann et al. 2009),
dedicated social calls may still be useful for group cohesion as social calls can encode more
information (Gillam & Fenton, 2016) and are often louder and lower frequency, allowing for
transmission over longer distances (Middelton et al. 2014).
Downsweep, downsweep-upsweep, and upsweep bouts were often used in multiple
species contexts. Maintaining group cohesion in-flight would only occur with conspecifics from
the same social groups. It is possible that the intended recipient is another conspecific, and the
presence of the heterospecific was incidental to the call emission. Whether a single or multiple
bat of any given species was present in the bat pass was not recorded, as it is often difficult to
determine with passive acoustic monitoring. Additionally, it is possible that only the emitter was
within range of the detector, and the intended receiver was too far away from the microphone to
be detected. However, if the presence of other species is mostly incidental to the production of
conspecific communication calls, there would not be such as dramatic difference in the
production of complex bouts based on whether multiple species are present.
Alternatively, downsweep and upsweep calls may serve multiple functions depending on
context. Phyllostomus hastatus screech calls function for anti-predator mobbing (Knörnschild &
Tschapka, 2012) and cohesion when commuting (Wilkinson & Boughman, 1998). Pippistrellus
spp. complex calls function in mate attraction (Lundberg & Gerell, 1986) and foraging
competition (Barlow & Jones, 1997). The exchange of contact calls by group members during
agonistic interactions with non-group members has also been observed in birds (Hopp et al. 2001;
Nowicki, 1983). Heterospecifics would be inherently non-group members. The majority of
downsweep, downsweep-upsweep, and upsweep bouts were produced in the spring, when bats
are returning from hibernacula and winter feeding grounds (Scales & Wilkins 2007; Valdez &
Cryan 2009). Therefore, agonistic encounters with unfamiliar individuals would be highest when
29
bats are first starting to be active on the landscape again. Male N. humeralis are solitary living in
the spring and summer (Hein et al. 2009; Perry & Thill, 2008), therefore any bat a male N.
humeralis encounters would be a non-group member. An increased rate of agonistic signal
production when presented with unfamiliar individuals has been observed in birds and frogs
(Briefer et al. 2008; Lesbarrères & Lodé, 2002).
A possible function for the apparent signal redundancy in downsweep and upsweep calls
may be that call type usage varies by signaler identity. Wright et al. (2013) found that the
likelihood of E. fuscus upsweep calls were positively correlated with the number of juveniles and
males in a dyad. If the majority of upsweeps recorded here are from juvenile bats, that would
explain the increased probability of a bout being an upsweep bout in the summer, as young
become volant in the summer (Pfalzer & Kusch 2003). If age class or sex specific social call
usage exists for other species, then social calls may be useful for assessing population
demographics in ecological and conservation passive acoustic monitoring studies. Sexual
segregation of foraging habitats has been observed in some bat species (Safi et al. 2007; Senior et
al. 2005). The use of Bayesian statistics to infer sex from echolocation call characteristics has
been suggested as a method for discerning sex ratios from passive acoustic monitoring (Lehnen et
al. 2018), however some bat species, including E. fuscus, do not exhibit sex-specific differences
in echolocation call characteristics (Heller & Helversen, 1989; Masters et al. 1995).
Eptesicus fuscus, N. humeralis, and T. brasiliensis differ in how often they produce social
calls with different functions. Nycticeius humeralis produces social calls the most often.
Downsweeps and upsweeps are the mail call types used by N. humeralis, and appear to be broad
functioning contact calls. The higher use of contact calls may be related to females cooperatively
foraging (Wilkinson, 1992), and the lower sociality of males (Hein et al. 2009; Perry & Thill,
2008), leading to increased contact with unfamiliar individuals. Eptesicus fuscus most commonly
30
produced a call type used for foraging competition (Wright et al., 2014), used specifically to
compete with conspecifics. E. fuscus also commonly produced upsweeps, a type of broad
functioning contact call, that in laboratory settings is mostly produced by juvenile and male bats
(Wright et al., 2013). Tadarida brasiliensis social calls were occasionally recorded, and were
primarily complex calls. E. fuscus, N. humeralis, and T. brasiliensis have different social
behaviors in the roosts (Bohn et al. 2008; Davis et al., 1962; Hein et al., 2009; Perry & Thill,
2008; Wilkinson, 1992; Willis & Brigham, 2004). Differential usage of social calls suggests these
species also exhibit different social behaviors while in flight.
I found that bats produce multiple social communication signals in flight to mediate
different social interactions. Bats exhibited species specific differences in call production rates,
repertoires, and call characteristics. The use of passive acoustic monitoring can be integrated with
other methodologies, particularly playback, to further ask questions about bat social
communication. With passive acoustic monitoring, I detected species-specific signatures in call
production. Playback would be useful to determine if bats actually attend to the between-species
differences in call characteristics. I also found associations between call type produced and the
context of call production. Communication is an interaction between multiple animals, therefore
the measure of response from playback is useful in determining call function. A greater
understanding of bat social calls will allow research on how their diverse social group
organization relates to communication system diversity.
31
Table 1. Social Calls Recorded at the UNCG Wetlands, Greensboro, NC, from March 15th 2017
to June 30th, 2018 by Species and Call Type
Species Complex Downsweep Inverted-U Oscilating QCF U-Shaped Upsweep Total
Eptesicus fuscus 851 196 113 81 69 123 564 1997
Lasiurus borealis 2 45 0 6 11 0 22 86
Lasiurus cinereus 0 1 0 0 0 0 0 1
Nycticeius humeralis 13 894 0 87 86 4 470 1554
Perimyotis subflavus 0 4 0 0 2 0 1 7
Tadarida brasiliensis 72 1 16 4 0 32 2 127
Multiple Species 144 1064 29 132 161 61 884 2475
No ID 25 171 22 16 27 13 93 367
Total 1107 2376 180 326 356 233 2036 6614
32
Figure 1. Confusion Matrix Comparing the Results of Manual and Automatic Classification of
Single Species Bat Passes Containing Social Calls. Automatic Classification was Performed
using Kaleidoscope 4.3 (Wildlife Acoustics Inc. Massachusetts, United States), Using the Bats of
North America 4.3 Library. Manual Classification was Used for all Analyses of Bat Passes
Containing Social Calls. Calls Were Collected at the UNCG Wetlands, Greensboro, NC, from
March 15th 2017 to June 30th, 2018.
EPTFUS LASBOR LASCIN LASNOC MYOLUC NYCHUM PERSUB TADBRA
EPTFUS 540 3 4 12 0 0 0 7
LASBOR 0 17 0 0 2 10 0 0
LASCIN 0 0 1 0 0 0 0 0
LASNOC 0 0 0 0 0 0 0 0
MYOLUC 0 0 0 0 0 0 0 0
NYCHUM 3 81 0 0 59 387 5 0
PERSUB 0 0 0 0 0 1 1 0
TADBRA 5 0 23 0 0 1 0 9
Automatic Classification
Man
ual
Cla
ssif
icat
ion
33
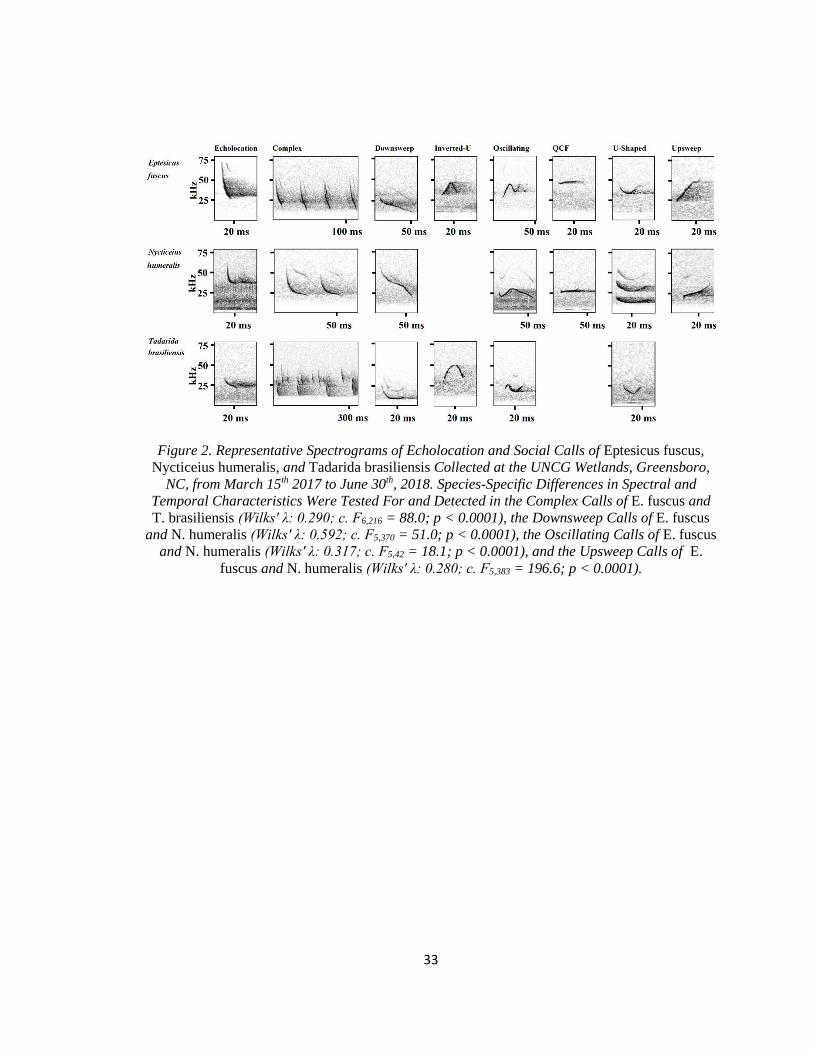
Figure 2. Representative Spectrograms of Echolocation and Social Calls of Eptesicus fuscus,
Nycticeius humeralis, and Tadarida brasiliensis Collected at the UNCG Wetlands, Greensboro,
NC, from March 15th 2017 to June 30th, 2018. Species-Specific Differences in Spectral and
Temporal Characteristics Were Tested For and Detected in the Complex Calls of E. fuscus and
T. brasiliensis (Wilks' λ: 0.290; c. F6,216 = 88.0; p < 0.0001), the Downsweep Calls of E. fuscus
and N. humeralis (Wilks' λ: 0.592; c. F5,370 = 51.0; p < 0.0001), the Oscillating Calls of E. fuscus
and N. humeralis (Wilks' λ: 0.317; c. F5,42 = 18.1; p < 0.0001), and the Upsweep Calls of E.
fuscus and N. humeralis (Wilks' λ: 0.280; c. F5,383 = 196.6; p < 0.0001).
34
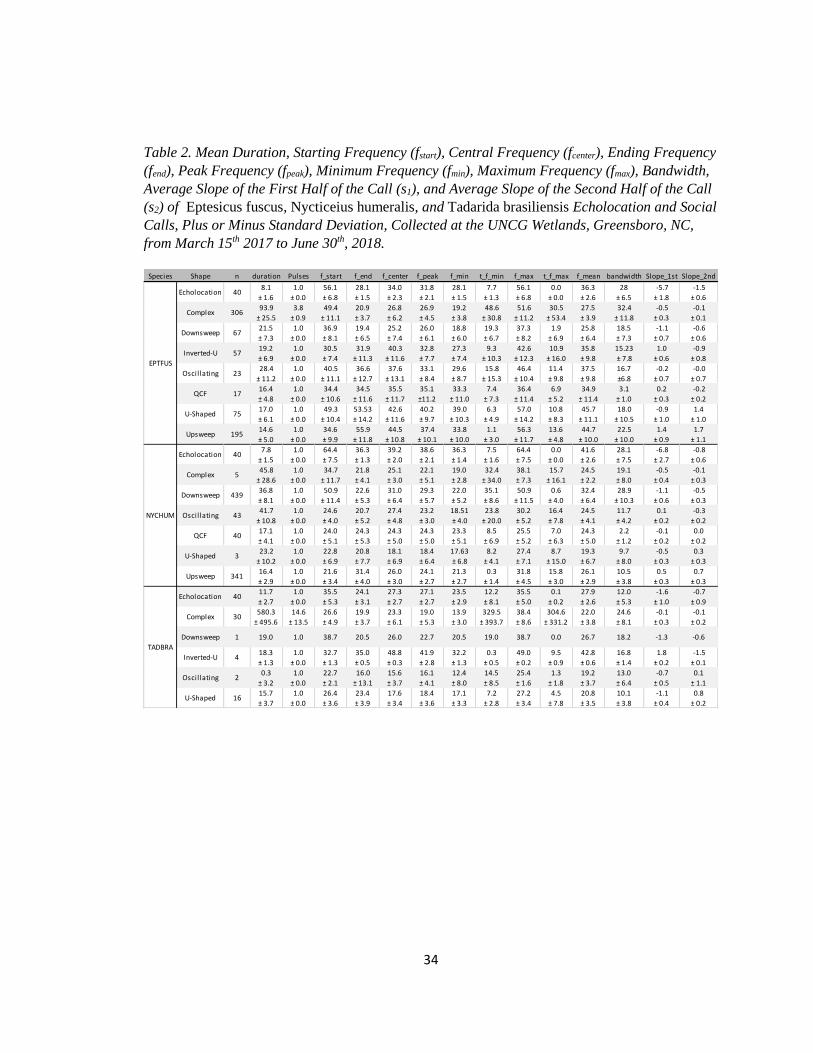
Table 2. Mean Duration, Starting Frequency (fstart), Central Frequency (fcenter), Ending Frequency
(fend), Peak Frequency (fpeak), Minimum Frequency (fmin), Maximum Frequency (fmax), Bandwidth,
Average Slope of the First Half of the Call (s1), and Average Slope of the Second Half of the Call
(s2) of Eptesicus fuscus, Nycticeius humeralis, and Tadarida brasiliensis Echolocation and Social
Calls, Plus or Minus Standard Deviation, Collected at the UNCG Wetlands, Greensboro, NC,
from March 15th 2017 to June 30th, 2018.
Species Shape n duration Pulses f_start f_end f_center f_peak f_min t_f_min f_max t_f_max f_mean bandwidth Slope_1st Slope_2nd
Echolocation 408.1
± 1.6
1.0
± 0.0
56.1
± 6.8
28.1
± 1.5
34.0
± 2.3
31.8
± 2.1
28.1
± 1.5
7.7
± 1.3
56.1
± 6.8
0.0
± 0.0
36.3
± 2.6
28
± 6.5
-5.7
± 1.8
-1.5
± 0.6
Complex 30693.9
± 25.5
3.8
± 0.9
49.4
± 11.1
20.9
± 3.7
26.8
± 6.2
26.9
± 4.5
19.2
± 3.8
48.6
± 30.8
51.6
± 11.2
30.5
± 53.4
27.5
± 3.9
32.4
± 11.8
-0.5
± 0.3
-0.1
± 0.1
Downsweep 6721.5
± 7.3
1.0
± 0.0
36.9
± 8.1
19.4
± 6.5
25.2
± 7.4
26.0
± 6.1
18.8
± 6.0
19.3
± 6.7
37.3
± 8.2
1.9
± 6.9
25.8
± 6.4
18.5
± 7.3
-1.1
± 0.7
-0.6
± 0.6
Inverted-U 5719.2
± 6.9
1.0
± 0.0
30.5
± 7.4
31.9
± 11.3
40.3
± 11.6
32.8
± 7.7
27.3
± 7.4
9.3
± 10.3
42.6
± 12.3
10.9
± 16.0
35.8
± 9.8
15.23
± 7.8
1.0
± 0.6
-0.9
± 0.8
Oscillating 2328.4
± 11.2
1.0
± 0.0
40.5
± 11.1
36.6
± 12.7
37.6
± 13.1
33.1
± 8.4
29.6
± 8.7
15.8
± 15.3
46.4
± 10.4
11.4
± 9.8
37.5
± 9.8
16.7
±6.8
-0.2
± 0.7
-0.0
± 0.7
QCF 1716.4
± 4.8
1.0
± 0.0
34.4
± 10.6
34.5
± 11.6
35.5
± 11.7
35.1
±11.2
33.3
± 11.0
7.4
± 7.3
36.4
± 11.4
6.9
± 5.2
34.9
± 11.4
3.1
± 1.0
0.2
± 0.3
-0.2
± 0.2
U-Shaped 7517.0
± 6.1
1.0
± 0.0
49.3
± 10.4
53.53
± 14.2
42.6
± 11.6
40.2
± 9.7
39.0
± 10.3
6.3
± 4.9
57.0
± 14.2
10.8
± 8.3
45.7
± 11.1
18.0
± 10.5
-0.9
± 1.0
1.4
± 1.0
Upsweep 19514.6
± 5.0
1.0
± 0.0
34.6
± 9.9
55.9
± 11.8
44.5
± 10.8
37.4
± 10.1
33.8
± 10.0
1.1
± 3.0
56.3
± 11.7
13.6
± 4.8
44.7
± 10.0
22.5
± 10.0
1.4
± 0.9
1.7
± 1.1
Echolocation 407.8
± 1.5
1.0
± 0.0
64.4
± 7.5
36.3
± 1.3
39.2
± 2.0
38.6
± 2.1
36.3
± 1.4
7.5
± 1.6
64.4
± 7.5
0.0
± 0.0
41.6
± 2.6
28.1
± 7.5
-6.8
± 2.7
-0.8
± 0.6
Complex 545.8
± 28.6
1.0
± 0.0
34.7
± 11.7
21.8
± 4.1
25.1
± 3.0
22.1
± 5.1
19.0
± 2.8
32.4
± 34.0
38.1
± 7.3
15.7
± 16.1
24.5
± 2.2
19.1
± 8.0
-0.5
± 0.4
-0.1
± 0.3
Downsweep 43936.8
± 8.1
1.0
± 0.0
50.9
± 11.4
22.6
± 5.3
31.0
± 6.4
29.3
± 5.7
22.0
± 5.2
35.1
± 8.6
50.9
± 11.5
0.6
± 4.0
32.4
± 6.4
28.9
± 10.3
-1.1
± 0.6
-0.5
± 0.3
Oscillating 4341.7
± 10.8
1.0
± 0.0
24.6
± 4.0
20.7
± 5.2
27.4
± 4.8
23.2
± 3.0
18.51
± 4.0
23.8
± 20.0
30.2
± 5.2
16.4
± 7.8
24.5
± 4.1
11.7
± 4.2
0.1
± 0.2
-0.3
± 0.2
QCF 4017.1
± 4.1
1.0
± 0.0
24.0
± 5.1
24.3
± 5.3
24.3
± 5.0
24.3
± 5.0
23.3
± 5.1
8.5
± 6.9
25.5
± 5.2
7.0
± 6.3
24.3
± 5.0
2.2
± 1.2
-0.1
± 0.2
0.0
± 0.2
U-Shaped 323.2
± 10.2
1.0
± 0.0
22.8
± 6.9
20.8
± 7.7
18.1
± 6.9
18.4
± 6.4
17.63
± 6.8
8.2
± 4.1
27.4
± 7.1
8.7
± 15.0
19.3
± 6.7
9.7
± 8.0
-0.5
± 0.3
0.3
± 0.3
Upsweep 34116.4
± 2.9
1.0
± 0.0
21.6
± 3.4
31.4
± 4.0
26.0
± 3.0
24.1
± 2.7
21.3
± 2.7
0.3
± 1.4
31.8
± 4.5
15.8
± 3.0
26.1
± 2.9
10.5
± 3.8
0.5
± 0.3
0.7
± 0.3
Echolocation 4011.7
± 2.7
1.0
± 0.0
35.5
± 5.3
24.1
± 3.1
27.3
± 2.7
27.1
± 2.7
23.5
± 2.9
12.2
± 8.1
35.5
± 5.0
0.1
± 0.2
27.9
± 2.6
12.0
± 5.3
-1.6
± 1.0
-0.7
± 0.9
Complex 30580.3
± 495.6
14.6
± 13.5
26.6
± 4.9
19.9
± 3.7
23.3
± 6.1
19.0
± 5.3
13.9
± 3.0
329.5
± 393.7
38.4
± 8.6
304.6
± 331.2
22.0
± 3.8
24.6
± 8.1
-0.1
± 0.3
-0.1
± 0.2
Downsweep 1 19.0 1.0 38.7 20.5 26.0 22.7 20.5 19.0 38.7 0.0 26.7 18.2 -1.3 -0.6
Inverted-U 418.3
± 1.3
1.0
± 0.0
32.7
± 1.3
35.0
± 0.5
48.8
± 0.3
41.9
± 2.8
32.2
± 1.3
0.3
± 0.5
49.0
± 0.2
9.5
± 0.9
42.8
± 0.6
16.8
± 1.4
1.8
± 0.2
-1.5
± 0.1
Oscillating 20.3
± 3.2
1.0
± 0.0
22.7
± 2.1
16.0
± 13.1
15.6
± 3.7
16.1
± 4.1
12.4
± 8.0
14.5
± 8.5
25.4
± 1.6
1.3
± 1.8
19.2
± 3.7
13.0
± 6.4
-0.7
± 0.5
0.1
± 1.1
U-Shaped 1615.7
± 3.7
1.0
± 0.0
26.4
± 3.6
23.4
± 3.9
17.6
± 3.4
18.4
± 3.6
17.1
± 3.3
7.2
± 2.8
27.2
± 3.4
4.5
± 7.8
20.8
± 3.5
10.1
± 3.8
-1.1
± 0.4
0.8
± 0.2
EPTFUS
NYCHUM
TADBRA
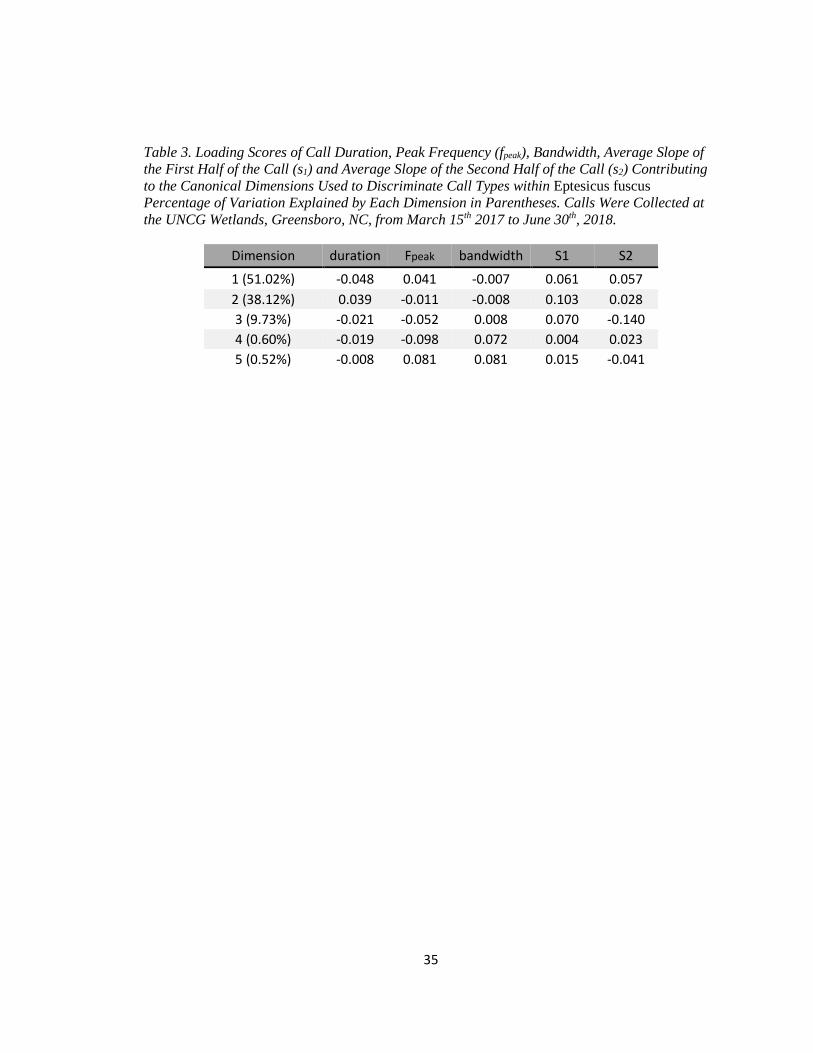
35
Table 3. Loading Scores of Call Duration, Peak Frequency (fpeak), Bandwidth, Average Slope of
the First Half of the Call (s1) and Average Slope of the Second Half of the Call (s2) Contributing
to the Canonical Dimensions Used to Discriminate Call Types within Eptesicus fuscus
Percentage of Variation Explained by Each Dimension in Parentheses. Calls Were Collected at
the UNCG Wetlands, Greensboro, NC, from March 15th 2017 to June 30th, 2018.
Dimension duration Fpeak bandwidth S1 S2
1 (51.02%) -0.048 0.041 -0.007 0.061 0.057
2 (38.12%) 0.039 -0.011 -0.008 0.103 0.028
3 (9.73%) -0.021 -0.052 0.008 0.070 -0.140
4 (0.60%) -0.019 -0.098 0.072 0.004 0.023
5 (0.52%) -0.008 0.081 0.081 0.015 -0.041
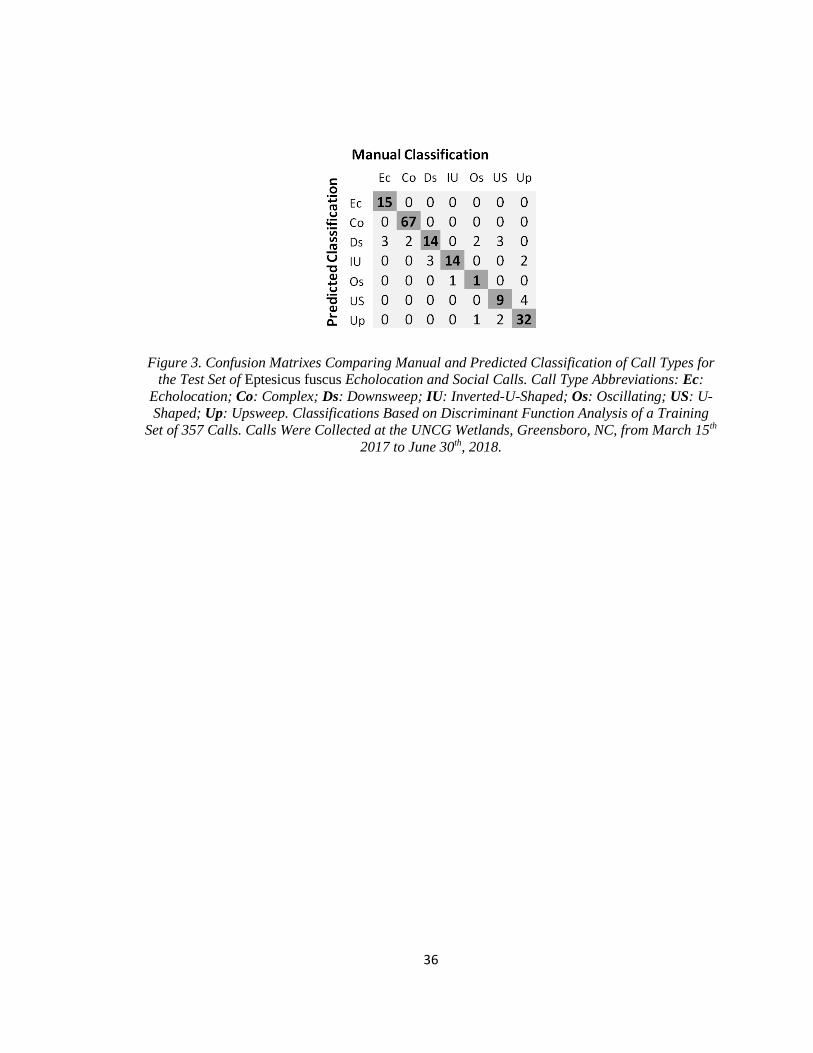
36
Figure 3. Confusion Matrixes Comparing Manual and Predicted Classification of Call Types for
the Test Set of Eptesicus fuscus Echolocation and Social Calls. Call Type Abbreviations: Ec:
Echolocation; Co: Complex; Ds: Downsweep; IU: Inverted-U-Shaped; Os: Oscillating; US: U-
Shaped; Up: Upsweep. Classifications Based on Discriminant Function Analysis of a Training
Set of 357 Calls. Calls Were Collected at the UNCG Wetlands, Greensboro, NC, from March 15th
2017 to June 30th, 2018.
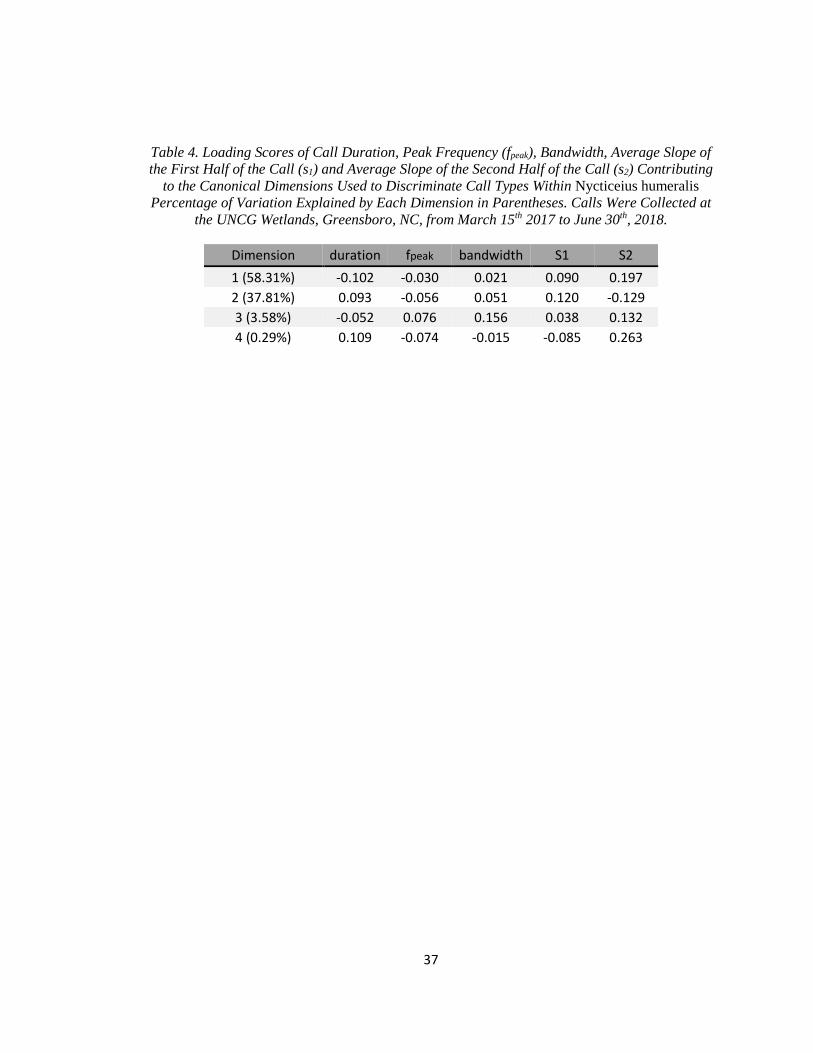
37
Table 4. Loading Scores of Call Duration, Peak Frequency (fpeak), Bandwidth, Average Slope of
the First Half of the Call (s1) and Average Slope of the Second Half of the Call (s2) Contributing
to the Canonical Dimensions Used to Discriminate Call Types Within Nycticeius humeralis
Percentage of Variation Explained by Each Dimension in Parentheses. Calls Were Collected at
the UNCG Wetlands, Greensboro, NC, from March 15th 2017 to June 30th, 2018.
Dimension duration fpeak bandwidth S1 S2
1 (58.31%) -0.102 -0.030 0.021 0.090 0.197
2 (37.81%) 0.093 -0.056 0.051 0.120 -0.129
3 (3.58%) -0.052 0.076 0.156 0.038 0.132
4 (0.29%) 0.109 -0.074 -0.015 -0.085 0.263
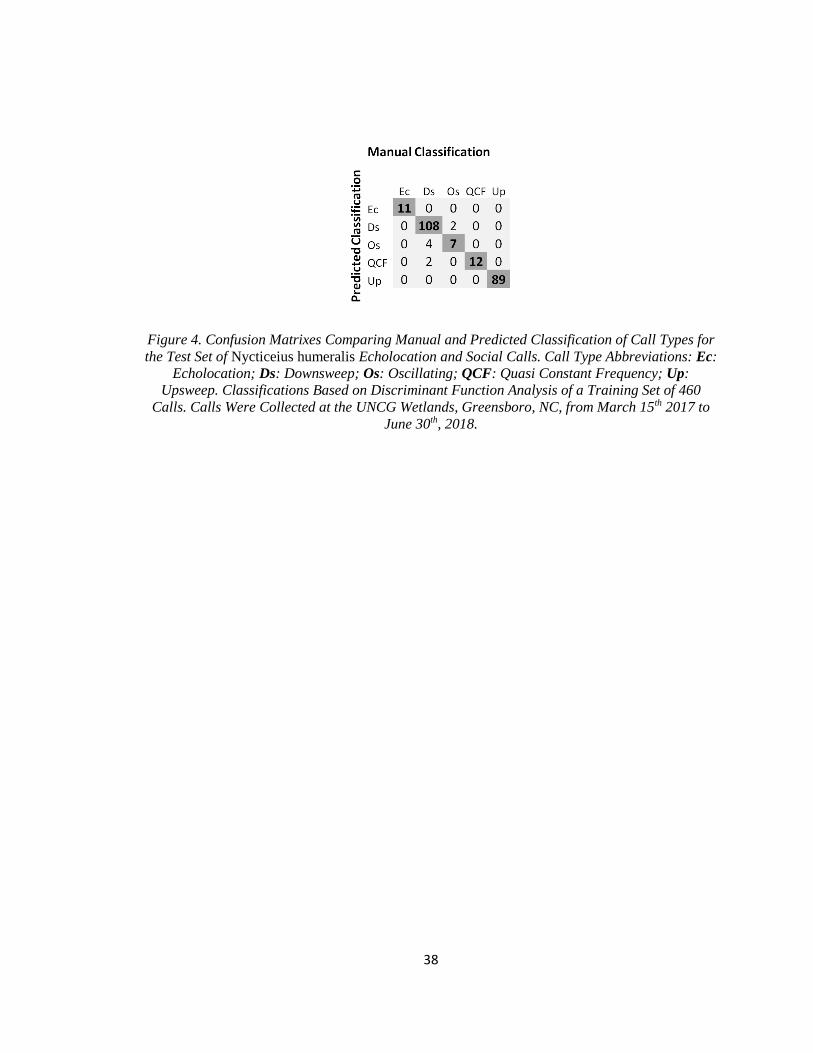
38
Figure 4. Confusion Matrixes Comparing Manual and Predicted Classification of Call Types for
the Test Set of Nycticeius humeralis Echolocation and Social Calls. Call Type Abbreviations: Ec:
Echolocation; Ds: Downsweep; Os: Oscillating; QCF: Quasi Constant Frequency; Up:
Upsweep. Classifications Based on Discriminant Function Analysis of a Training Set of 460
Calls. Calls Were Collected at the UNCG Wetlands, Greensboro, NC, from March 15th 2017 to
June 30th, 2018.
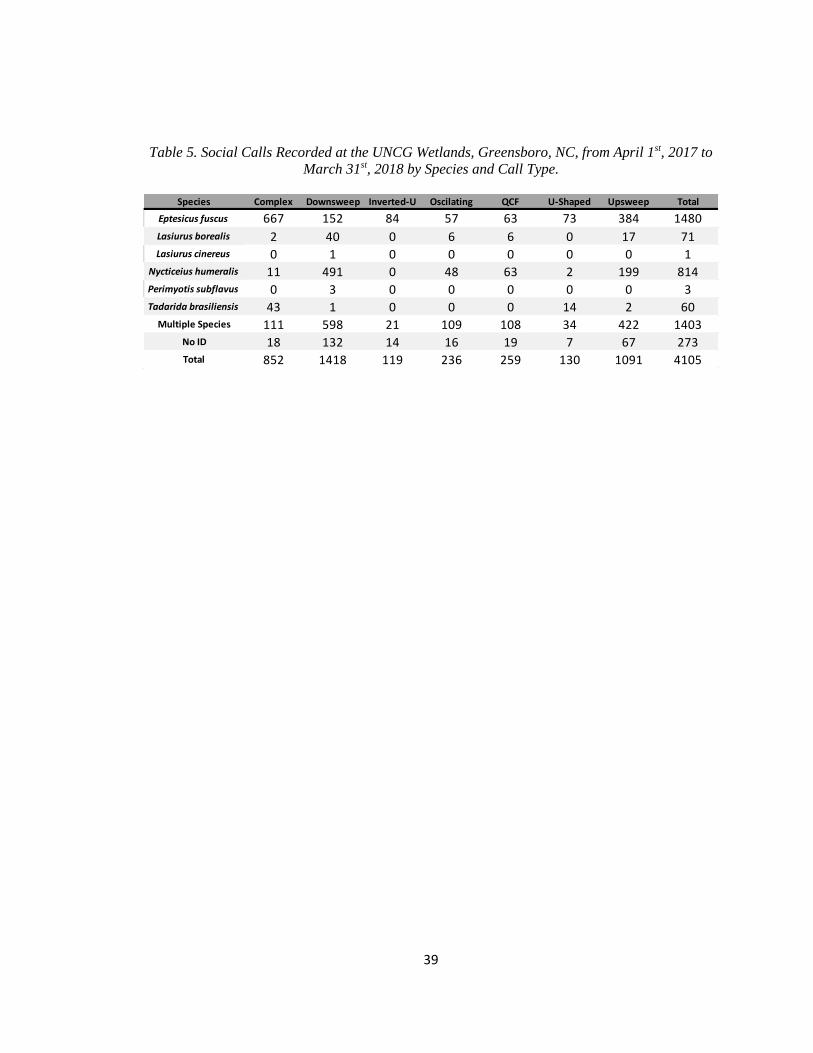
39
Table 5. Social Calls Recorded at the UNCG Wetlands, Greensboro, NC, from April 1st, 2017 to
March 31st, 2018 by Species and Call Type.
Species Complex Downsweep Inverted-U Oscilating QCF U-Shaped Upsweep Total
Eptesicus fuscus 667 152 84 57 63 73 384 1480
Lasiurus borealis 2 40 0 6 6 0 17 71Lasiurus cinereus 0 1 0 0 0 0 0 1
Nycticeius humeralis 11 491 0 48 63 2 199 814Perimyotis subflavus 0 3 0 0 0 0 0 3Tadarida brasiliensis 43 1 0 0 0 14 2 60
Multiple Species 111 598 21 109 108 34 422 1403No ID 18 132 14 16 19 7 67 273Total 852 1418 119 236 259 130 1091 4105
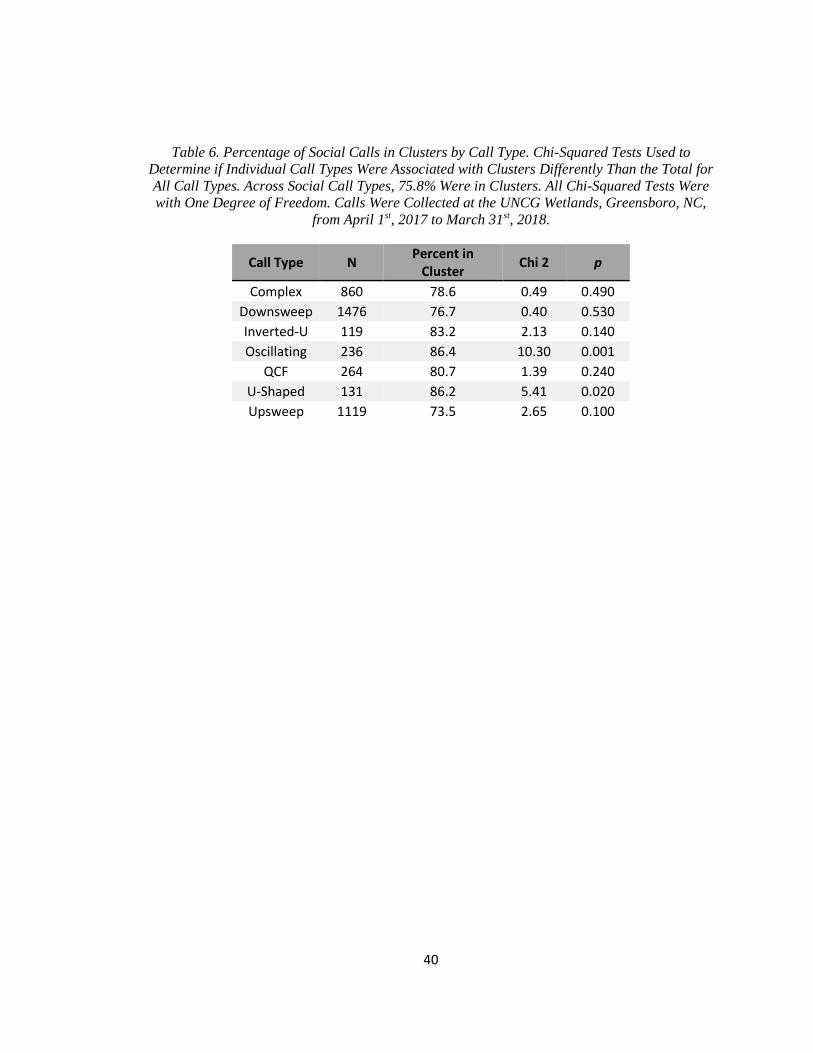
40
Table 6. Percentage of Social Calls in Clusters by Call Type. Chi-Squared Tests Used to
Determine if Individual Call Types Were Associated with Clusters Differently Than the Total for
All Call Types. Across Social Call Types, 75.8% Were in Clusters. All Chi-Squared Tests Were
with One Degree of Freedom. Calls Were Collected at the UNCG Wetlands, Greensboro, NC,
from April 1st, 2017 to March 31st, 2018.
Call Type N Percent in
Cluster Chi 2 p
Complex 860 78.6 0.49 0.490
Downsweep 1476 76.7 0.40 0.530
Inverted-U 119 83.2 2.13 0.140
Oscillating 236 86.4 10.30 0.001
QCF 264 80.7 1.39 0.240
U-Shaped 131 86.2 5.41 0.020
Upsweep 1119 73.5 2.65 0.100
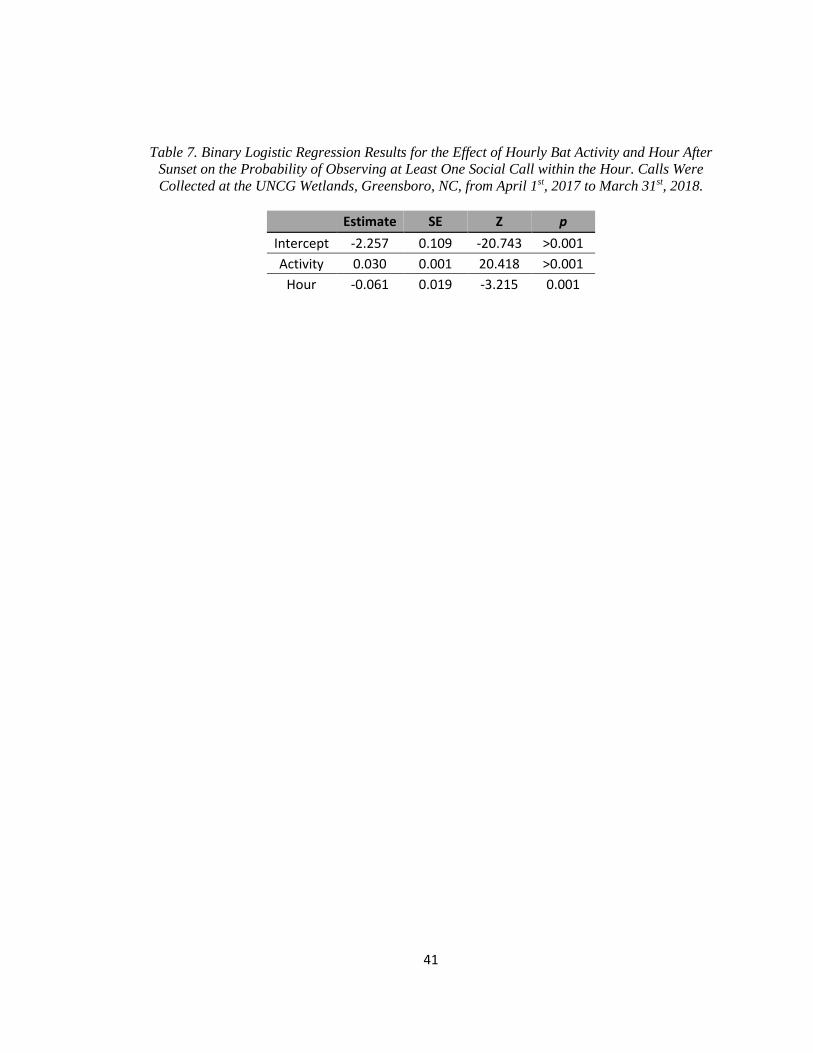
41
Table 7. Binary Logistic Regression Results for the Effect of Hourly Bat Activity and Hour After
Sunset on the Probability of Observing at Least One Social Call within the Hour. Calls Were
Collected at the UNCG Wetlands, Greensboro, NC, from April 1st, 2017 to March 31st, 2018.
Estimate SE Z p
Intercept -2.257 0.109 -20.743 >0.001
Activity 0.030 0.001 20.418 >0.001
Hour -0.061 0.019 -3.215 0.001

42
Figure 5. Number of Social Call Bout Types of those Observed at Least 10 Times. Classification
Based on the Types of Individual Social Calls Contained. Call Type Abbreviations: co: Complex,
ds: Downsweep, iu: Inverted-U, os: Oscillating, qcf: Quasi-Constant Frequency, up: Upsweep,
us: U-Shaped. Calls Were Collected at the UNCG Wetlands, Greensboro, NC, from April 1st,
2017 to March 31st, 2018.
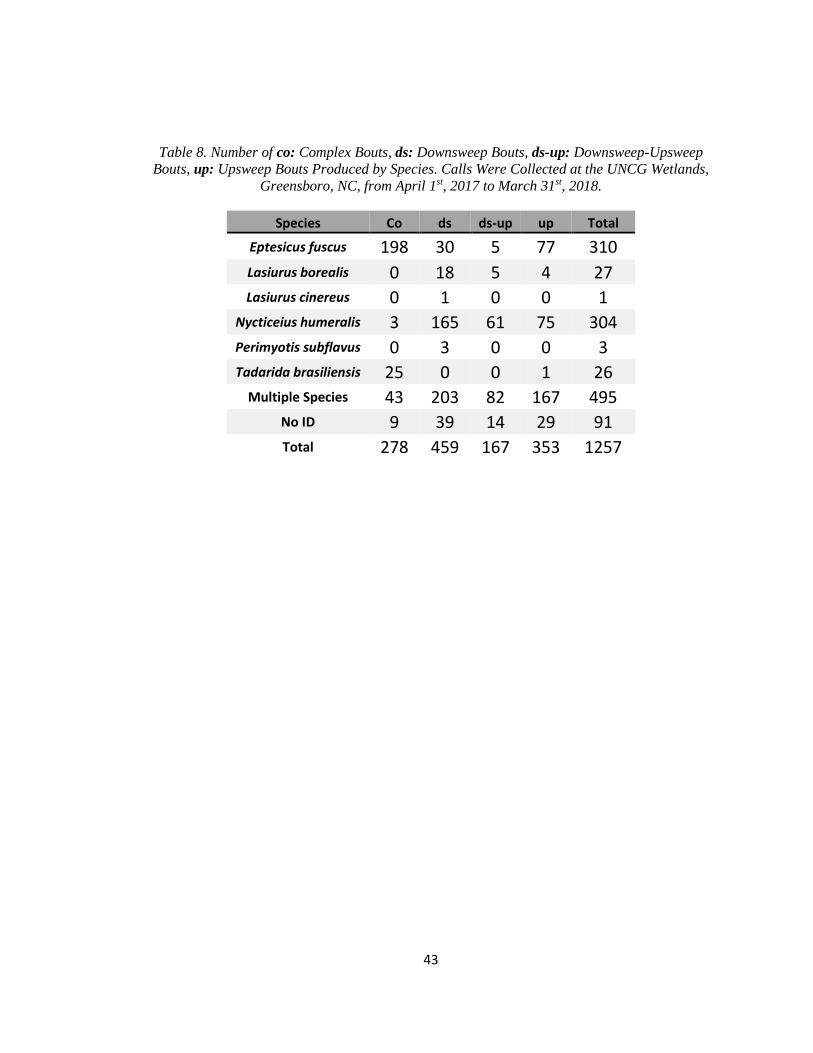
43
Table 8. Number of co: Complex Bouts, ds: Downsweep Bouts, ds-up: Downsweep-Upsweep
Bouts, up: Upsweep Bouts Produced by Species. Calls Were Collected at the UNCG Wetlands,
Greensboro, NC, from April 1st, 2017 to March 31st, 2018.
Species Co ds ds-up up Total
Eptesicus fuscus 198 30 5 77 310
Lasiurus borealis 0 18 5 4 27
Lasiurus cinereus 0 1 0 0 1
Nycticeius humeralis 3 165 61 75 304
Perimyotis subflavus 0 3 0 0 3
Tadarida brasiliensis 25 0 0 1 26
Multiple Species 43 203 82 167 495
No ID 9 39 14 29 91
Total 278 459 167 353 1257
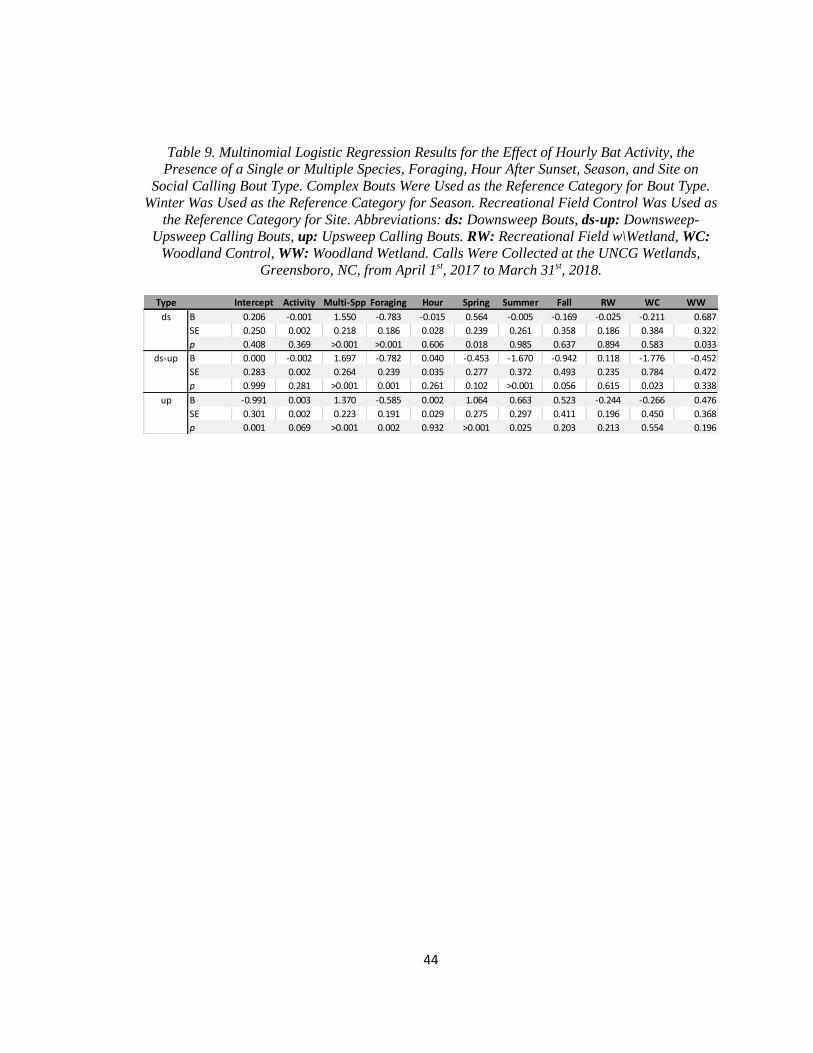
44
Table 9. Multinomial Logistic Regression Results for the Effect of Hourly Bat Activity, the
Presence of a Single or Multiple Species, Foraging, Hour After Sunset, Season, and Site on
Social Calling Bout Type. Complex Bouts Were Used as the Reference Category for Bout Type.
Winter Was Used as the Reference Category for Season. Recreational Field Control Was Used as
the Reference Category for Site. Abbreviations: ds: Downsweep Bouts, ds-up: Downsweep-
Upsweep Calling Bouts, up: Upsweep Calling Bouts. RW: Recreational Field w\Wetland, WC:
Woodland Control, WW: Woodland Wetland. Calls Were Collected at the UNCG Wetlands,
Greensboro, NC, from April 1st, 2017 to March 31st, 2018.
Type Intercept Activity Multi-Spp Foraging Hour Spring Summer Fall RW WC WW
B 0.206 -0.001 1.550 -0.783 -0.015 0.564 -0.005 -0.169 -0.025 -0.211 0.687
SE 0.250 0.002 0.218 0.186 0.028 0.239 0.261 0.358 0.186 0.384 0.322
p 0.408 0.369 >0.001 >0.001 0.606 0.018 0.985 0.637 0.894 0.583 0.033
B 0.000 -0.002 1.697 -0.782 0.040 -0.453 -1.670 -0.942 0.118 -1.776 -0.452
SE 0.283 0.002 0.264 0.239 0.035 0.277 0.372 0.493 0.235 0.784 0.472
p 0.999 0.281 >0.001 0.001 0.261 0.102 >0.001 0.056 0.615 0.023 0.338
B -0.991 0.003 1.370 -0.585 0.002 1.064 0.663 0.523 -0.244 -0.266 0.476
SE 0.301 0.002 0.223 0.191 0.029 0.275 0.297 0.411 0.196 0.450 0.368
p 0.001 0.069 >0.001 0.002 0.932 >0.001 0.025 0.203 0.213 0.554 0.196
ds
ds-up
up
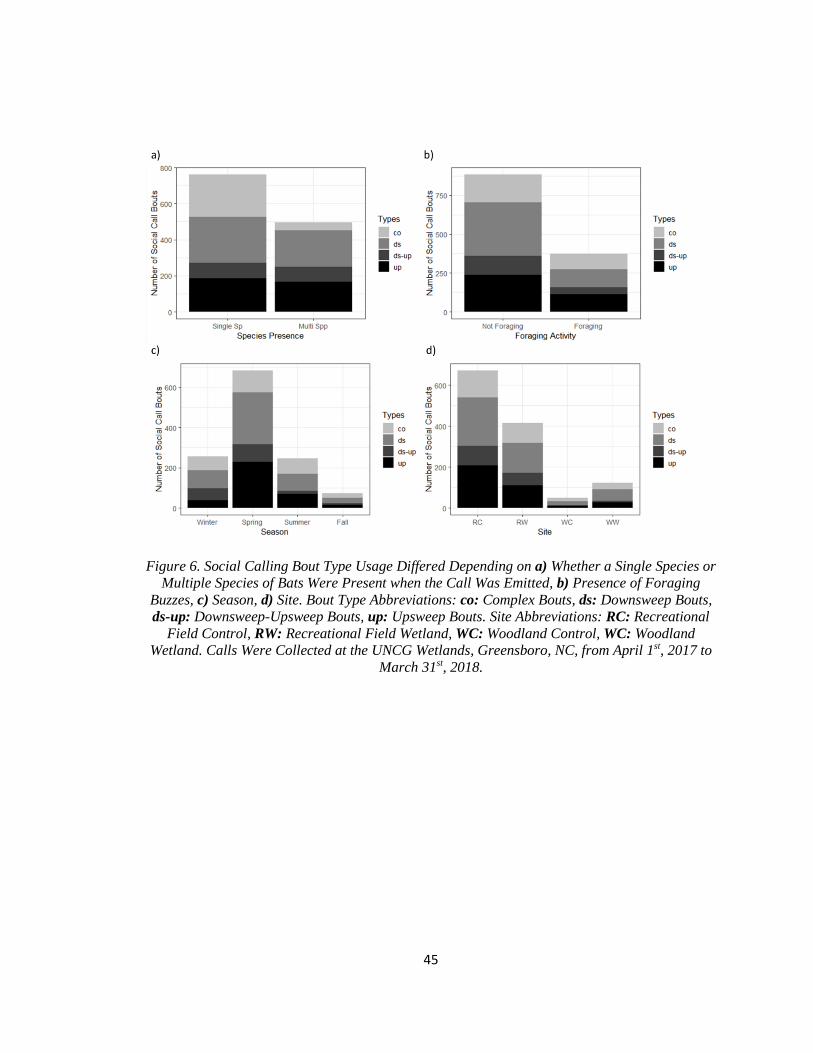
45
Figure 6. Social Calling Bout Type Usage Differed Depending on a) Whether a Single Species or
Multiple Species of Bats Were Present when the Call Was Emitted, b) Presence of Foraging
Buzzes, c) Season, d) Site. Bout Type Abbreviations: co: Complex Bouts, ds: Downsweep Bouts,
ds-up: Downsweep-Upsweep Bouts, up: Upsweep Bouts. Site Abbreviations: RC: Recreational
Field Control, RW: Recreational Field Wetland, WC: Woodland Control, WC: Woodland
Wetland. Calls Were Collected at the UNCG Wetlands, Greensboro, NC, from April 1st, 2017 to
March 31st, 2018.
46
REFERENCES
Barclay, R. M., Faure, P. A., & Farr, D. R. (1988). Roosting Behavior and Roost Selection by Migrating Silver-Haired Bats (Lasionycteris noctivagans). Journal of Mammalogy, 69(4), 821–825.
Barclay, R. M., Fenton, M. B., & Thomas, D. W. (1979). Social behavior of the little brown bat, Myotis lucifugus. Behavioral Ecology and Sociobiology, 6(2), 137–146.
Barlow, K. E., & Jones, G. (1997). Function of pipistrelle social calls: field data and a playback experiment. Animal Behaviour, 53(5), 991–999.
Barratt, E. M., Deaville, R., Burland, T. M., Bruford, M. W., Jones, G., Racey, P. A., & Wayne, R. K. (1997). DNA answers the call of pipistrelle bat species. Nature, 387(6629), 138.
Bartonička, T., Řehák, Z., & Gaisler, J. (2007). Can pipistrelles, Pipistrellus pipistrellus (Schreber, 1774) and Pipistrellus pygmaeus (Leach, 1825), foraging in a group, change parameters of their signals? Journal of Zoology, 272(2), 194–201.
Beecher, M. D. (1989). Signalling systems for individual recognition: an information theory approach. Animal Behaviour, 38(2), 248–261.
Behr, O., & von Helversen, O. (2004). Bat serenades—complex courtship songs of the sac-winged bat (Saccopteryx bilineata). Behavioral Ecology and Sociobiology, 56(2), 106–115.
Blumstein, D. T., & Armitage, K. B. (1997). Does sociality drive the evolution of communicative complexity? A comparative test with ground-dwelling sciurid alarm calls. The American Naturalist, 150(2), 179–200.
Bohn, K. M., & Gillam, E. H. (2018). In-Flight Social Calls: A Primer for Biologists and Managers Studying Echolocation. Canadian Journal of Zoology, (ja).
Bohn, K. M., Schmidt-French, B., Ma, S. T., & Pollak, G. D. (2008). Syllable acoustics, temporal patterns, and call composition vary with behavioral context in Mexican free-tailed bats. The Journal of the Acoustical Society of America, 124(3), 1838–1848.
Bradbury, J. W. (1977). Lek mating behavior in the hammer‐headed bat. Ethology, 45(3), 225–255.
Bradshaw, G. V. (1962). Reproductive cycle of the California leaf-nosed bat, Macrotus californicus. Science, 136(3516), 645–646.
47
Briefer, E., Rybak, F., & Aubin, T. (2008). When to be a dear enemy: flexible acoustic relationships of neighbouring skylarks, Alauda arvensis. Animal Behaviour, 76(4), 1319–1325. https://doi.org/10.1016/j.anbehav.2008.06.017
Britzke, E. R., Gillam, E. H., & Murray, K. L. (2013). Current state of understanding of ultrasonic detectors for the study of bat ecology. Acta Theriologica, 58(2), 109–117.
Buchler, E. R. (1980). The development of flight, foraging, and echolocation in the little brown bat (Myotis lucifugus). Behavioral Ecology and Sociobiology, 6(3), 211–218.
Budenz, T., Heib, S., & Kusch, J. (2009). Functions of bat social calls: the influence of local abundance, interspecific interactions and season on the production of pipistrelle (Pipistrellus pipistrellus) type D social calls. Acta Chiropterologica, 11(1), 173–182.
Burns, L. E., & Broders, H. G. (2015). Maximizing mating opportunities: higher autumn swarming activity in male versus female Myotis bats. Journal of Mammalogy, 96(6), 1326–1336.
Carter, G. G., Logsdon, R., Arnold, B. D., Menchaca, A., & Medellin, R. A. (2012). Adult Vampire Bats Produce Contact Calls When Isolated: Acoustic Variation by Species, Population, Colony, and Individual. PLOS ONE, 7(6), e38791. https://doi.org/10.1371/journal.pone.0038791
Constantine, D. G. (1966). Ecological observations on lasiurine bats in Iowa. Journal of Mammalogy, 47(1), 34–41.
Corcoran, A. J., & Conner, W. E. (2014). Bats jamming bats: Food competition through sonar interference. Science, 346(6210), 745–747.
Davidson, S. M., & Wilkinson, G. S. (2002). Geographic and individual variation in vocalizations by male Saccopteryx bilineata (Chiroptera: Emballonuridae). Journal of Mammalogy, 83(2), 526–535.
Davidson, S. M., & Wilkinson, G. S. (2004). Function of male song in the greater white-lined bat, Saccopteryx bilineata. Animal Behaviour, 67(5), 883–891.
Davis, R. B., Herreid, C. F., & Short, H. L. (1962a). Mexican free‐tailed bats in Texas. Ecological Monographs, 32(4), 311–346.
Davis, R. B., Herreid, C. F., & Short, H. L. (1962b). Mexican free‐tailed bats in Texas. Ecological Monographs, 32(4), 311–346.
Dechmann, D. K., Heucke, S. L., Giuggioli, L., Safi, K., Voigt, C. C., & Wikelski, M. (2009). Experimental evidence for group hunting via eavesdropping in echolocating bats. Proceedings of the Royal Society of London B: Biological Sciences, rspb. 2009.0473.

48
Egert-Berg, K., Hurme, E. R., Greif, S., Goldstein, A., Harten, L., Flores-Martínez, J. J., … Borissov, I. (2018). Resource Ephemerality Drives Social Foraging in Bats. Current Biology, 28(22), 3667–3673.
Ford, W. M., Britzke, E. R., Dobony, C. A., Rodrigue, J. L., & Johnson, J. B. (2011). Patterns of Acoustical Activity of Bats Prior to and Following White-Nose Syndrome Occurrence. Journal of Fish and Wildlife Management, 2(2), 125–134. https://doi.org/10.3996/042011-JFWM-027
Freeberg, T. M. (2006). Social complexity can drive vocal complexity: group size influences vocal information in Carolina chickadees. Psychological Science, 17(7), 557–561.
Freeberg, T. M., Dunbar, R. I., & Ord, T. J. (2012). Social complexity as a proximate and ultimate factor in communicative complexity. The Royal Society.
Garroway, C. J., & Broders, H. G. (2007). Nonrandom association patterns at northern long-eared bat maternity roosts. Canadian Journal of Zoology, 85(9), 956–964.
Gillam, E., & Fenton, M. B. (2016). Roles of acoustic social communication in the lives of bats. In Bat Bioacoustics (pp. 117–139). Springer.
Gillam, E. H., & Chaverri, G. (2012). Strong individual signatures and weaker group signatures in contact calls of Spix’s disc-winged bat, Thyroptera tricolor. Animal Behaviour, 83(1), 269–276.
Gillam, E. H., McCracken, G. F., Westbrook, J. K., Lee, Y.-F., Jensen, M. L., & Balsley, B. B. (2009). Bats aloft: variability in echolocation call structure at high altitudes. Behavioral Ecology and Sociobiology, 64(1), 69–79.
Grider, Homyack, J., & Kalcounis-Rueppell, M. (2015). High winter activity of peripheral bat populations has conservation implications for species affected by white nose syndrome and wind energy facilities. Conservation Biology, In Review.
Grider, J. F., Larsen, A. L., Homyack, J. A., & Kalcounis-Rueppell, M. C. (2016). Winter Activity of Coastal Plain Populations of Bat Species Affected by White-Nose Syndrome and Wind Energy Facilities. PLOS ONE, 11(11), e0166512. https://doi.org/10.1371/journal.pone.0166512
Heckel, G., & von Helversen, O. (2002). Male tactics and reproductive success in the harem polygynous bat Saccopteryx bilineata. Behavioral Ecology, 13(6), 750–756.
Hein, C. D., Miller, K. V., & Castleberry, S. B. (2009). Evening Bat Summer Roost-Site Selection on a Managed Pine Landscape. The Journal of Wildlife Management, 73(4), 511–517.
Heller, K.-G., & Helversen, O. v. (1989). Resource partitioning of sonar frequency bands in rhinolophoid bats. Oecologia, 80(2), 178–186.
49
Hopp, S. L., Jablonski, P., & Brown, J. L. (2001). Recognition of group membership by voice in Mexican jays, Aphelocoma ultramarina. Animal Behaviour, 62(2), 297–303. https://doi.org/10.1006/anbe.2001.1745
Insley, S. J. (1992). Mother-Offspring Separation and Acoustic Stereotypy: a Comparison of Call Morphology in Two Species of Pinnipeds. Behaviour, 120(1), 103–122. https://doi.org/10.1163/156853992X00237
Jones, G., & Siemers, B. M. (2011). The communicative potential of bat echolocation pulses. Journal of Comparative Physiology A, 197(5), 447–457.
Kalcounis-Rueppell, M. C., Payne, V. H., Huff, S. R., & Boyko, A. L. (2007). Effects of wastewater treatment plant effluent on bat foraging ecology in an urban stream system. Biological Conservation, 138(1–2), 120–130. https://doi.org/10.1016/j.biocon.2007.04.009
Kalcounis-Rueppell, Matina C., Briones, K. M., Homyack, J. A., Petric, R., Marshall, M. M., & Miller, D. A. (2013). Hard forest edges act as conduits, not filters, for bats. Wildlife Society Bulletin, 37(3), 571–576.
Kalcounis-Rueppell, Matina Carmen, Petric, R., & Marler, C. (2018). The bold, silent type: predictors of ultrasonic vocalizations in the genus Peromyscus. Frontiers in Ecology and Evolution, 6, 198.
Keeley, A. T., & Keeley, B. W. (2004). The mating system of Tadarida brasiliensis (Chiroptera: Molossidae) in a large highway bridge colony. Journal of Mammalogy, 85(1), 113–119.
Kimura, K., & Uchida, T. A. (1983). Ultrastructural observations of delayed implantation in the Japanese long-fingered bat, Miniopterus schreibersii fuliginosus. Journal of Reproduction and Fertility, 69(1), 187–193.
Knörnschild, M., Nagy, M., Metz, M., Mayer, F., & von Helversen, O. (2012). Learned vocal group signatures in the polygynous bat Saccopteryx bilineata. Animal Behaviour, 84(4), 761–769. https://doi.org/10.1016/j.anbehav.2012.06.029
Knörnschild, M., & Tschapka, M. (2012). Predator mobbing behaviour in the greater spear-nosed bat, Phyllostomus hastatus. Chiroptera Neotropical, 18(2), 1132–1135.
Knörnschild, M., & Von Helversen, O. (2008). Nonmutual vocal mother–pup recognition in the greater sac-winged bat. Animal Behaviour, 76(3), 1001–1009.
Kunz, T. H., & Parsons, S. (2009). Ecological and behavioral methods for the study of bats.
Kurta, A., Winhold, L., Whitaker Jr, J. O., & Foster, R. (2007). Range expansion and changing abundance of the eastern pipistrelle (Chiroptera: Vespertilionidae) in the central Great Lakes region. The American Midland Naturalist, 157(2), 404–411.
50
Langton, S. D., Collett, D., & Sibly, R. M. (1995). Splitting behaviour into bouts; a maximum likelihood approach. Behaviour, 781–799.
Lehnen, L., Schorcht, W., Karst, I., Biedermann, M., Kerth, G., & Puechmaille, S. J. (2018). Using Approximate Bayesian Computation to infer sex ratios from acoustic data. PloS One, 13(6), e0199428. https://doi.org/10.1371/journal.pone.0199428
Lesbarrères, D., & Lodé, T. (2002). Variations in male calls and responses to an unfamiliar advertisement call in a territorial breeding anuran, Rana dalmatina: evidence for a “dear enemy” effect. Ethology Ecology & Evolution, 14(4), 287–295. https://doi.org/10.1080/08927014.2002.9522731
Li, H., & Kalcounis-Rueppell, M. (2018). Separating the effects of water quality and urbanization on temperate insectivorous bats at the landscape scale. Ecology and Evolution, 8(1), 667–678. https://doi.org/10.1002/ece3.3693
Li, H., & Wilkins, K. T. (2014). Patch or mosaic: bat activity responds to fine-scale urban heterogeneity in a medium-sized city in the United States. Urban Ecosystems, 17(4), 1013–1031.
Loeb, S. C., Rodhouse, J, T., Ellison, E, L., Lausen, … H, D. (2015). A plan for the North American Bat Monitoring Program (NABat). Gen. Tech. Rep. SRS-208. Asheville, NC: U.S. Department of Agriculture Forest Service, Southern Research Station., 208, 1–100.
Lundberg, K., & Gerell, R. (1986). Territorial advertisement and mate attraction in the bat Pipistrellus pipistrellus. Ethology, 71(2), 115–124.
Luo, B., Huang, X., Li, Y., Lu, G., Zhao, J., Zhang, K., … Feng, J. (2017). Social call divergence in bats: a comparative analysis. Behavioral Ecology, 28(2), 533–540.
Luque, S., & Guinet, C. (2007). A maximum likelihood approach for identifying dive bouts improves accuracy, precision and objectivity. Behaviour, 144(11), 1315–1332.
Luque, S.P. Diving Behaviour Analysis in R. R News 7(3):8-14. December, 2007.
Masters, W. M., Raver, K. A., & Kazial, K. A. (1995). Sonar signals of big brown bats, Eptesicus fuscus, contain information about individual identity, age and family affiliation. Animal Behaviour, 50(5), 1243–1260.
Matsumura, S. (1979). Mother-infant communication in a horseshoe bat (Rhinolophus ferrumequinum nippon): development of vocalization. Journal of Mammalogy, 60(1), 76–84.
McComb, K., & Semple, S. (2005). Coevolution of vocal communication and sociality in primates. Biology Letters, 1(4), 381–385.

51
Medvin, M. B., Stoddard, P. K., & Beecher, M. D. (1993). Signals for parent-offspring recognition: a comparative analysis of the begging calls of cliff swallows and barn swallows. Animal Behaviour, 45(5), 841–850. https://doi.org/10.1006/anbe.1993.1105
Melendez, K. V., Jones, D. L., & Feng, A. S. (2006). Classification of communication signals of the little brown bat. J. Acoust. Soc. Am, 120(2), 2.
Middleton, N. E. (2006). A study of the emission of social calls by Pipistrellus spp. within central Scotland; including a description of their typical social call structure. BaTML Publications, 3, 23–28.
Middleton, N., Froud, A., & French, K. (2014). Social calls of the bats of Britain and Ireland. Pelagic Publishing Ltd.
Mundry, R., & Sommer, C. (2007). Discriminant function analysis with nonindependent data: consequences and an alternative. Animal Behaviour, 74(4), 965–976.
Musolf, K., Meindl, S., Larsen, A. L., Kalcounis-Rueppell, M. C., & Penn, D. J. (2015). Ultrasonic vocalizations of male mice differ among species and females show assortative preferences for male calls. PLoS One, 10(8), e0134123.
Nowicki, S. (1983). Flock-specific recognition of chickadee calls. Behavioral Ecology and Sociobiology, 12(4), 317–320. https://doi.org/10.1007/BF00302899
O’Farrell, M. J., & Gannon, W. L. (1999). A comparison of acoustic versus capture techniques for the inventory of bats. Journal of Mammalogy, 80(1), 24–30.
O’Farrell, M. J., Miller, B. W., & Gannon, W. L. (1999). Qualitative identification of free-flying bats using the Anabat detector. Journal of Mammalogy, 80(1), 11–23.
Orr, T. J., & Zuk, M. (2013). Does delayed fertilization facilitate sperm competition in bats? Behavioral Ecology and Sociobiology, 67(12), 1903–1913.
Parker, K. A., Springall, B. T., Garshong, R. A., Malachi, A. N., Dorn, L. E., Costa-Terryll, A., … Davis, T. T. (n.d.). Rapid Increases in Bat Activity and Diversity after Wetland Construction in an Urban Ecosystem. Wetlands, 1–11.
Patriquin, K. J., Leonard, M. L., Broders, H. G., & Garroway, C. J. (2010). Do social networks of female northern long-eared bats vary with reproductive period and age? Behavioral Ecology and Sociobiology, 64(6), 899–913.
Perry, R. W., & Thill, R. E. (2007). Tree roosting by male and female eastern pipistrelles in a forested landscape. Journal of Mammalogy, 88(4), 974–981.
52
Perry, R. W., & Thill, R. E. (2008). Diurnal Roosts of Male Evening Bats (Nycticeius Humeralis) in Diversely Managed Pine-Hardwood Forests. The American Midland Naturalist, 160(2), 374–386. https://doi.org/10.1674/0003-0031(2008)160[374:DROMEB]2.0.CO;2
Pfalzer, G., & Kusch, J. (2003). Structure and variability of bat social calls: implications for specificity and individual recognition. Journal of Zoology, 261(1), 21–33. https://doi.org/10.1017/S0952836903003935
Pollard, K. A. (2011). Making the most of alarm signals: the adaptive value of individual discrimination in an alarm context. Behavioral Ecology, 22(1), 93–100. https://doi.org/10.1093/beheco/arq179
R Core Team (2018). R: A language and environment for statistical computing. R Foundation for …………Statistical Computing, Vienna, Austria. URL https://www.R-project.org/.
Rendell, L. E., Matthews, J. N., Gill, A., Gordon, J. C. D., & Macdonald, D. W. (1999). Quantitative analysis of tonal calls from five odontocete species, examining interspecific and intraspecific variation. Journal of Zoology, 249(4), 403–410. https://doi.org/10.1111/j.1469-7998.1999.tb01209.x
Russ, J. M., Jones, G., Mackie, I. J., & Racey, P. A. (2004). Interspecific responses to distress calls in bats (Chiroptera: Vespertilionidae): a function for convergence in call design? Animal Behaviour, 67(6), 1005–1014.
Rydell, J. (1989). Feeding activity of the northern bat Eptesicus nilssoni during pregnancy and lactation. Oecologia, 80(4), 562–565.
Safi, K., & Kerth, G. (2007). Comparative analyses suggest that information transfer promoted sociality in male bats in the temperate zone. The American Naturalist, 170(3), 465–472.
Safi, K., König, B., & Kerth, G. (2007). Sex differences in population genetics, home range size and habitat use of the parti-colored bat (Vespertilio murinus, Linnaeus 1758) in Switzerland and their consequences for conservation. Biological Conservation, 137(1), 28–36. https://doi.org/10.1016/j.biocon.2007.01.011
Scales, J. A., & Wilkins, K. T. (2007). Seasonality and fidelity in roost use of the Mexican free-tailed bat, Tadarida brasiliensis, in an urban setting. Western North American Naturalist, 67(3), 402–408.
Scherrer, J. A., & Wilkinson, G. S. (1993). Evening bat isolation calls provide evidence for heritable signatures. Animal Behaviour, 46(5), 847–860.
Schimpp, S. A., Li, H., & Kalcounis-Rueppell, M. C. (2018). Determining species specific nightly bat activity in sites with varying urban intensity. Urban Ecosystems, 1–10.
53
Schöner, C. R., Schöner, M. G., & Kerth, G. (2010). Similar is not the same: Social calls of conspecifics are more effective in attracting wild bats to day roosts than those of other bat species. Behavioral Ecology and Sociobiology, 64(12), 2053–2063. https://doi.org/10.1007/s00265-010-1019-8
Senior, P., Butlin, R. K., & Altringham, J. D. (2005). Sex and segregation in temperate bats. Proceedings of the Royal Society of London B: Biological Sciences, 272(1580), 2467–2473.
Sibly, R. M., Nott, H. M. R., & Fletcher, D. J. (1990). Splitting behaviour into bouts. Animal Behaviour, 39(1), 63–69. https://doi.org/10.1016/S0003-3472(05)80726-2
Suthers, R. A. (1965). Acoustic orientation by fish‐catching bats. Journal of Experimental Zoology Part A: Ecological Genetics and Physiology, 158(3), 319–347.
Thomas, D. W., Brock Fenton, M., & Barclay, R. M. (1979). Social behavior of the little brown bat, Myotis lucifugus. Behavioral Ecology and Sociobiology, 6(2), 129–136.
Valdez, E. W., & Cryan, P. M. (2009). Food habits of the hoary bat (Lasiurus cinereus) during spring migration through New Mexico. The Southwestern Naturalist, 54(2), 195–200.
Vaughan, T. A., & Vaughan, R. P. (1986). Seasonality and the behavior of the African yellow-winged bat. Journal of Mammalogy, 67(1), 91–102.
Venables, W. N. & Ripley, B. D. (2002) Modern Applied Statistics with S. Fourth Edition. Springer, New York. ISBN 0-387-95457-0
Voigt, C. C., & von Helversen, O. (1999). Storage and display of odour by male Saccopteryx bilineata (Chiroptera, Emballonuridae). Behavioral Ecology and Sociobiology, 47(1–2), 29–40.
Wickham, H. ggplot2: Elegant Graphics for Data Analysis. Springer-Verlag New York, 2016
Wilkinson, G. S. (1984). Reciprocal food sharing in the vampire bat. Nature, 308(5955), 181.
Wilkinson, G. S. (1992). Information transfer at evening bat colonies. Animal Behaviour, 44, 501–518.
Wilkinson, G. S. (2003). Social and vocal complexity in bats.
Wilkinson, G. S., & Boughman, J. W. (1998). Social calls coordinate foraging in greater spear-nosed bats. Animal Behaviour, 55(2), 337–350.
Willis, C. K., & Brigham, R. M. (2004). Roost switching, roost sharing and social cohesion: forest-dwelling big brown bats, Eptesicus fuscus, conform to the fission–fusion model. Animal Behaviour, 68(3), 495–505.

54
Wright, G. S., Chiu, C., Xian, W., Moss, C. F., & Wilkinson, G. S. (2013). Social calls of flying big brown bats (Eptesicus fuscus). Frontiers in Physiology, 4, 214.
Wright, G. S., Chiu, C., Xian, W., Wilkinson, G. S., & Moss, C. F. (2014). Social calls predict foraging success in big brown bats. Current Biology, 24(8), 885–889.