Behavioral and Anatomical Consequences of Early versus ... · Behavioral and Anatomical...
12
Neuron Article Behavioral and Anatomical Consequences of Early versus Late Symbol Training in Macaques Krishna Srihasam, 1 Joseph B. Mandeville, 2 Istvan A. Morocz, 3 Kevin J. Sullivan, 1 and Margaret S. Livingstone 1, * 1 Department of Neurobiology, Harvard Medical School, 220 Longwood Ave, Boston, MA 02115, USA 2 Martinos Center for Biomedical Imaging, Massachusetts General Hospital, Charlestown, MA 02129, USA 3 Radiology Department, Brigham & Women’s Hospital, Boston, MA 02114, USA *Correspondence: [email protected] DOI 10.1016/j.neuron.2011.12.022 SUMMARY Distinct brain regions, reproducible from one person to the next, are specialized for processing different kinds of human expertise, such as face recogni- tion and reading. Here, we explore the relationship between age of learning, learning ability, and special- ized brain structures. Specifically, we ask whether the existence of reproducible cortical domains necessarily means that certain abilities are innate, or innately easily learned, or whether reproducible domains can be formed, or refined, by interactions between genetic programs and common early ex- perience. Functional MRI showed that intensive early, but not late, experience caused the formation of category-selective regions in macaque temporal lobe for stimuli never naturally encountered by monkeys. And behaviorally, early training produced more fluent processing of these stimuli than the same training in adults. One explanation for these results is that in higher cortical areas, as in early sensory areas, experience drives functional clus- tering and functional clustering determines how that information is processed. INTRODUCTION In most humans, face processing is localized predominantly to the right posterior ventral temporal lobe (Kanwisher et al., 1997; McCarthy et al., 1997); visual recognition of letters and words is also localized, to about the same part of the temporal lobe, though contralaterally and a bit more lateral and posterior (Cohen and Dehaene, 2004; Cohen et al., 2000). The importance of social interactions in primates could conceivably have driven the generation of a face-specific cortical domain by natural selection, yet it is difficult to imagine how a cortical region specific for written words could have evolved, given that humans have been using written language for only a few thousand years and literacy has been widespread for at most a few hundred. Thus, both reading and face processing are localized to similar parts of the temporal lobe, despite the discrepancy between the apparent innateness of face recognition and the unnatural- ness of reading. However, most people do have intensive early experience with both faces and text, raising the possibility that both kinds of domains are not innate, in the sense of being genet- ically predetermined, but rather emerge as a consequence of experience interacting with development. This prompted us to ask whether intensive early experience could cause monkeys to develop anatomical specializations for processing stimuli they never naturally encounter. We used number and letter symbols, which are simpler than faces and have been honed by human culture to be easily discriminated and remembered. If there is a basis in low-level vision for the particular shapes used in human writing systems and for their ease in processing (Changizi et al., 2006), this basis should be present in macaque monkeys. Adult and juvenile monkeys learned to associate reward amount with letters and numerals, precisely discriminating 26 symbols. The juvenile monkeys learned the symbols more easily than the adults did, and they responded faster to these symbols than adult learners with comparable training. Further- more the juveniles, but not the adults, developed regions in their temporal lobes that were more responsive to the learned sym- bols than to visually similar but unfamiliar shapes. The results suggest that intensive early experience drives the generation, or segregation, of domain-specific modules and that the forma- tion of specialized domains may facilitate the neuronal process- ing of those clustered categories. RESULTS Differences in Learning between Juveniles and Adults Ten monkeys were intensively trained for 3 years to choose between pairs of dot patterns or pairs of symbols for fluid reward (Figures 1A and 1B). Four juvenile (all male) and six adult (two female) Rhesus macaque monkeys learned to use touchscreens in their home cages to choose quite accurately between pairs of stimuli to select a reward amount (Figures 1C–1F). The two stimuli could be arrays of dots inside a circle or two symbols (Arabic numerals or English letters). Reward amounts corre- sponded to the number of dots in a circle or the assigned value of the symbol—numerals 0 through 9 corresponded to 0 to 9 drops, and the letters X Y W C H U T F K L N R M E A J repre- sented 10 through 25 drops. The monkeys were first trained on 0 versus 1, and each new symbol was introduced, in ascending order, only after the monkey’s choice behavior indicated that he or she had learned the value of the preceding symbol. After 1 year of daily training, during a month-long period while no new symbols were introduced, the monkeys were tested on 608 Neuron 73, 608–619, February 9, 2012 ª2012 Elsevier Inc.
Transcript of Behavioral and Anatomical Consequences of Early versus ... · Behavioral and Anatomical...
Neuron
Article
Behavioral and Anatomical Consequencesof Early versus Late Symbol Training in MacaquesKrishna Srihasam,1 Joseph B. Mandeville,2 Istvan A. Morocz,3 Kevin J. Sullivan,1 and Margaret S. Livingstone1,*1Department of Neurobiology, Harvard Medical School, 220 Longwood Ave, Boston, MA 02115, USA2Martinos Center for Biomedical Imaging, Massachusetts General Hospital, Charlestown, MA 02129, USA3Radiology Department, Brigham & Women’s Hospital, Boston, MA 02114, USA*Correspondence: [email protected]
DOI 10.1016/j.neuron.2011.12.022
SUMMARY
Distinct brain regions, reproducible from one personto the next, are specialized for processing differentkinds of human expertise, such as face recogni-tion and reading. Here, we explore the relationshipbetween age of learning, learning ability, and special-ized brain structures. Specifically, we ask whetherthe existence of reproducible cortical domainsnecessarily means that certain abilities are innate,or innately easily learned, or whether reproducibledomains can be formed, or refined, by interactionsbetween genetic programs and common early ex-perience. Functional MRI showed that intensiveearly, but not late, experience caused the formationof category-selective regions in macaque temporallobe for stimuli never naturally encountered bymonkeys. And behaviorally, early training producedmore fluent processing of these stimuli than thesame training in adults. One explanation for theseresults is that in higher cortical areas, as in earlysensory areas, experience drives functional clus-tering and functional clustering determines howthat information is processed.
INTRODUCTION
In most humans, face processing is localized predominantly to
the right posterior ventral temporal lobe (Kanwisher et al.,
1997; McCarthy et al., 1997); visual recognition of letters and
words is also localized, to about the same part of the temporal
lobe, though contralaterally and a bit more lateral and posterior
(Cohen and Dehaene, 2004; Cohen et al., 2000). The importance
of social interactions in primates could conceivably have driven
the generation of a face-specific cortical domain by natural
selection, yet it is difficult to imagine how a cortical region
specific for written words could have evolved, given that humans
have been using written language for only a few thousand years
and literacy has been widespread for at most a few hundred.
Thus, both reading and face processing are localized to similar
parts of the temporal lobe, despite the discrepancy between
the apparent innateness of face recognition and the unnatural-
ness of reading. However, most people do have intensive early
608 Neuron 73, 608–619, February 9, 2012 ª2012 Elsevier Inc.
experience with both faces and text, raising the possibility that
both kinds of domains are not innate, in the sense of being genet-
ically predetermined, but rather emerge as a consequence of
experience interacting with development. This prompted us to
ask whether intensive early experience could cause monkeys to
develop anatomical specializations for processing stimuli they
never naturally encounter. We used number and letter symbols,
which are simpler than faces and have been honed by human
culture to be easily discriminated and remembered. If there is
a basis in low-level vision for the particular shapes used in human
writing systems and for their ease in processing (Changizi et al.,
2006), this basis should be present in macaque monkeys.
Adult and juvenile monkeys learned to associate reward
amount with letters and numerals, precisely discriminating
26 symbols. The juvenile monkeys learned the symbols more
easily than the adults did, and they responded faster to these
symbols than adult learners with comparable training. Further-
more the juveniles, but not the adults, developed regions in their
temporal lobes that were more responsive to the learned sym-
bols than to visually similar but unfamiliar shapes. The results
suggest that intensive early experience drives the generation,
or segregation, of domain-specific modules and that the forma-
tion of specialized domains may facilitate the neuronal process-
ing of those clustered categories.
RESULTS
Differences in Learning between Juveniles and AdultsTen monkeys were intensively trained for 3 years to choose
between pairs of dot patterns or pairs of symbols for fluid reward
(Figures 1A and 1B). Four juvenile (all male) and six adult (two
female) Rhesus macaque monkeys learned to use touchscreens
in their home cages to choose quite accurately between pairs of
stimuli to select a reward amount (Figures 1C–1F). The two
stimuli could be arrays of dots inside a circle or two symbols
(Arabic numerals or English letters). Reward amounts corre-
sponded to the number of dots in a circle or the assigned value
of the symbol—numerals 0 through 9 corresponded to 0 to 9
drops, and the letters X Y W C H U T F K L N R M E A J repre-
sented 10 through 25 drops. The monkeys were first trained on
0 versus 1, and each new symbol was introduced, in ascending
order, only after the monkey’s choice behavior indicated that
he or she had learned the value of the preceding symbol. After
1 year of daily training, during a month-long period while no
new symbols were introduced, the monkeys were tested on
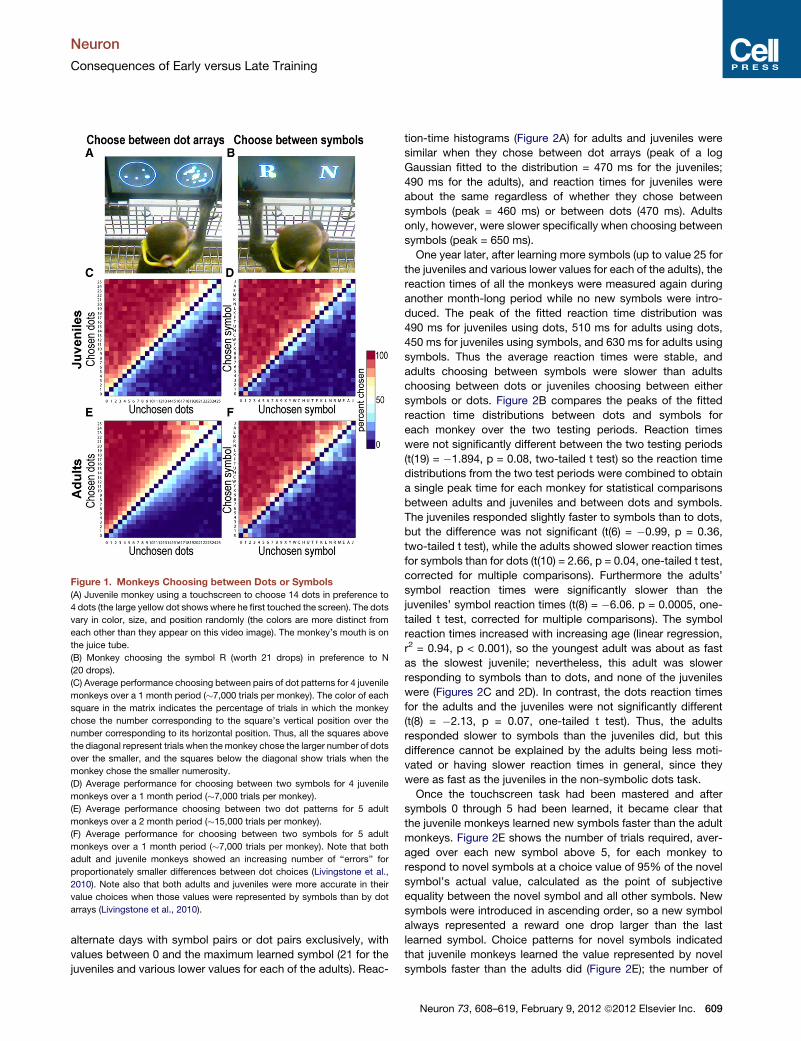
Figure 1. Monkeys Choosing between Dots or Symbols
(A) Juvenile monkey using a touchscreen to choose 14 dots in preference to
4 dots (the large yellow dot shows where he first touched the screen). The dots
vary in color, size, and position randomly (the colors are more distinct from
each other than they appear on this video image). The monkey’s mouth is on
the juice tube.
(B) Monkey choosing the symbol R (worth 21 drops) in preference to N
(20 drops).
(C) Average performance choosing between pairs of dot patterns for 4 juvenile
monkeys over a 1 month period (�7,000 trials per monkey). The color of each
square in the matrix indicates the percentage of trials in which the monkey
chose the number corresponding to the square’s vertical position over the
number corresponding to its horizontal position. Thus, all the squares above
the diagonal represent trials when themonkey chose the larger number of dots
over the smaller, and the squares below the diagonal show trials when the
monkey chose the smaller numerosity.
(D) Average performance for choosing between two symbols for 4 juvenile
monkeys over a 1 month period (�7,000 trials per monkey).
(E) Average performance choosing between two dot patterns for 5 adult
monkeys over a 2 month period (�15,000 trials per monkey).
(F) Average performance for choosing between two symbols for 5 adult
monkeys over a 1 month period (�7,000 trials per monkey). Note that both
adult and juvenile monkeys showed an increasing number of ‘‘errors’’ for
proportionately smaller differences between dot choices (Livingstone et al.,
2010). Note also that both adults and juveniles were more accurate in their
value choices when those values were represented by symbols than by dot
arrays (Livingstone et al., 2010).
Neuron
Consequences of Early versus Late Training
alternate days with symbol pairs or dot pairs exclusively, with
values between 0 and the maximum learned symbol (21 for the
juveniles and various lower values for each of the adults). Reac-
tion-time histograms (Figure 2A) for adults and juveniles were
similar when they chose between dot arrays (peak of a log
Gaussian fitted to the distribution = 470 ms for the juveniles;
490 ms for the adults), and reaction times for juveniles were
about the same regardless of whether they chose between
symbols (peak = 460 ms) or between dots (470 ms). Adults
only, however, were slower specifically when choosing between
symbols (peak = 650 ms).
One year later, after learning more symbols (up to value 25 for
the juveniles and various lower values for each of the adults), the
reaction times of all the monkeys were measured again during
another month-long period while no new symbols were intro-
duced. The peak of the fitted reaction time distribution was
490 ms for juveniles using dots, 510 ms for adults using dots,
450 ms for juveniles using symbols, and 630 ms for adults using
symbols. Thus the average reaction times were stable, and
adults choosing between symbols were slower than adults
choosing between dots or juveniles choosing between either
symbols or dots. Figure 2B compares the peaks of the fitted
reaction time distributions between dots and symbols for
each monkey over the two testing periods. Reaction times
were not significantly different between the two testing periods
(t(19) = �1.894, p = 0.08, two-tailed t test) so the reaction time
distributions from the two test periods were combined to obtain
a single peak time for each monkey for statistical comparisons
between adults and juveniles and between dots and symbols.
The juveniles responded slightly faster to symbols than to dots,
but the difference was not significant (t(6) = �0.99, p = 0.36,
two-tailed t test), while the adults showed slower reaction times
for symbols than for dots (t(10) = 2.66, p = 0.04, one-tailed t test,
corrected for multiple comparisons). Furthermore the adults’
symbol reaction times were significantly slower than the
juveniles’ symbol reaction times (t(8) = �6.06. p = 0.0005, one-
tailed t test, corrected for multiple comparisons). The symbol
reaction times increased with increasing age (linear regression,
r2 = 0.94, p < 0.001), so the youngest adult was about as fast
as the slowest juvenile; nevertheless, this adult was slower
responding to symbols than to dots, and none of the juveniles
were (Figures 2C and 2D). In contrast, the dots reaction times
for the adults and the juveniles were not significantly different
(t(8) = �2.13, p = 0.07, one-tailed t test). Thus, the adults
responded slower to symbols than the juveniles did, but this
difference cannot be explained by the adults being less moti-
vated or having slower reaction times in general, since they
were as fast as the juveniles in the non-symbolic dots task.
Once the touchscreen task had been mastered and after
symbols 0 through 5 had been learned, it became clear that
the juvenile monkeys learned new symbols faster than the adult
monkeys. Figure 2E shows the number of trials required, aver-
aged over each new symbol above 5, for each monkey to
respond to novel symbols at a choice value of 95% of the novel
symbol’s actual value, calculated as the point of subjective
equality between the novel symbol and all other symbols. New
symbols were introduced in ascending order, so a new symbol
always represented a reward one drop larger than the last
learned symbol. Choice patterns for novel symbols indicated
that juvenile monkeys learned the value represented by novel
symbols faster than the adults did (Figure 2E); the number of
Neuron 73, 608–619, February 9, 2012 ª2012 Elsevier Inc. 609
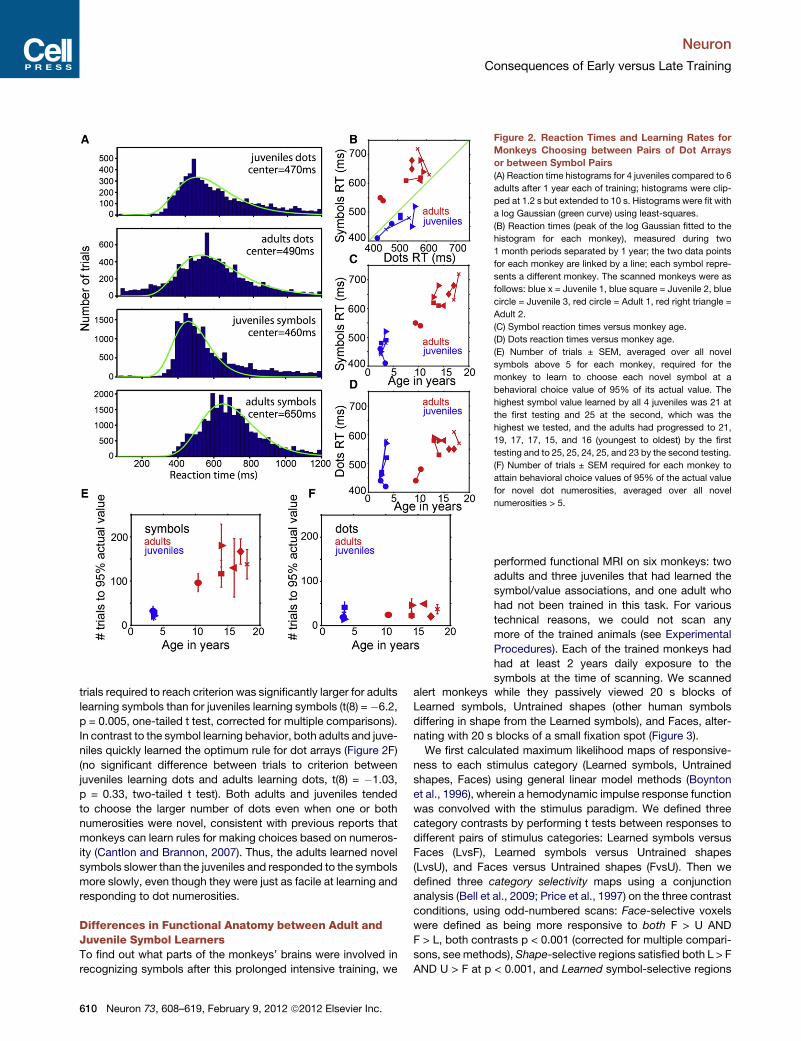
Figure 2. Reaction Times and Learning Rates for
Monkeys Choosing between Pairs of Dot Arrays
or between Symbol Pairs
(A) Reaction time histograms for 4 juveniles compared to 6
adults after 1 year each of training; histograms were clip-
ped at 1.2 s but extended to 10 s. Histograms were fit with
a log Gaussian (green curve) using least-squares.
(B) Reaction times (peak of the log Gaussian fitted to the
histogram for each monkey), measured during two
1 month periods separated by 1 year; the two data points
for each monkey are linked by a line; each symbol repre-
sents a different monkey. The scanned monkeys were as
follows: blue x = Juvenile 1, blue square = Juvenile 2, blue
circle = Juvenile 3, red circle = Adult 1, red right triangle =
Adult 2.
(C) Symbol reaction times versus monkey age.
(D) Dots reaction times versus monkey age.
(E) Number of trials ± SEM, averaged over all novel
symbols above 5 for each monkey, required for the
monkey to learn to choose each novel symbol at a
behavioral choice value of 95% of its actual value. The
highest symbol value learned by all 4 juveniles was 21 at
the first testing and 25 at the second, which was the
highest we tested, and the adults had progressed to 21,
19, 17, 17, 15, and 16 (youngest to oldest) by the first
testing and to 25, 25, 24, 25, and 23 by the second testing.
(F) Number of trials ± SEM required for each monkey to
attain behavioral choice values of 95% of the actual value
for novel dot numerosities, averaged over all novel
numerosities > 5.
Neuron
Consequences of Early versus Late Training
trials required to reach criterion was significantly larger for adults
learning symbols than for juveniles learning symbols (t(8) =�6.2,
p = 0.005, one-tailed t test, corrected for multiple comparisons).
In contrast to the symbol learning behavior, both adults and juve-
niles quickly learned the optimum rule for dot arrays (Figure 2F)
(no significant difference between trials to criterion between
juveniles learning dots and adults learning dots, t(8) = �1.03,
p = 0.33, two-tailed t test). Both adults and juveniles tended
to choose the larger number of dots even when one or both
numerosities were novel, consistent with previous reports that
monkeys can learn rules for making choices based on numeros-
ity (Cantlon and Brannon, 2007). Thus, the adults learned novel
symbols slower than the juveniles and responded to the symbols
more slowly, even though they were just as facile at learning and
responding to dot numerosities.
Differences in Functional Anatomy between Adult andJuvenile Symbol LearnersTo find out what parts of the monkeys’ brains were involved in
recognizing symbols after this prolonged intensive training, we
610 Neuron 73, 608–619, February 9, 2012 ª2012 Elsevier Inc.
performed functional MRI on six monkeys: two
adults and three juveniles that had learned the
symbol/value associations, and one adult who
had not been trained in this task. For various
technical reasons, we could not scan any
more of the trained animals (see Experimental
Procedures). Each of the trained monkeys had
had at least 2 years daily exposure to the
symbols at the time of scanning. We scanned
alert monkeys while they passively viewed 20 s blocks ofLearned symbols, Untrained shapes (other human symbols
differing in shape from the Learned symbols), and Faces, alter-
nating with 20 s blocks of a small fixation spot (Figure 3).
We first calculated maximum likelihood maps of responsive-
ness to each stimulus category (Learned symbols, Untrained
shapes, Faces) using general linear model methods (Boynton
et al., 1996), wherein a hemodynamic impulse response function
was convolved with the stimulus paradigm. We defined three
category contrasts by performing t tests between responses to
different pairs of stimulus categories: Learned symbols versus
Faces (LvsF), Learned symbols versus Untrained shapes
(LvsU), and Faces versus Untrained shapes (FvsU). Then we
defined three category selectivity maps using a conjunction
analysis (Bell et al., 2009; Price et al., 1997) on the three contrast
conditions, using odd-numbered scans: Face-selective voxels
were defined as being more responsive to both F > U AND
F > L, both contrasts p < 0.001 (corrected for multiple compari-
sons, seemethods), Shape-selective regions satisfied both L > F
AND U > F at p < 0.001, and Learned symbol-selective regions
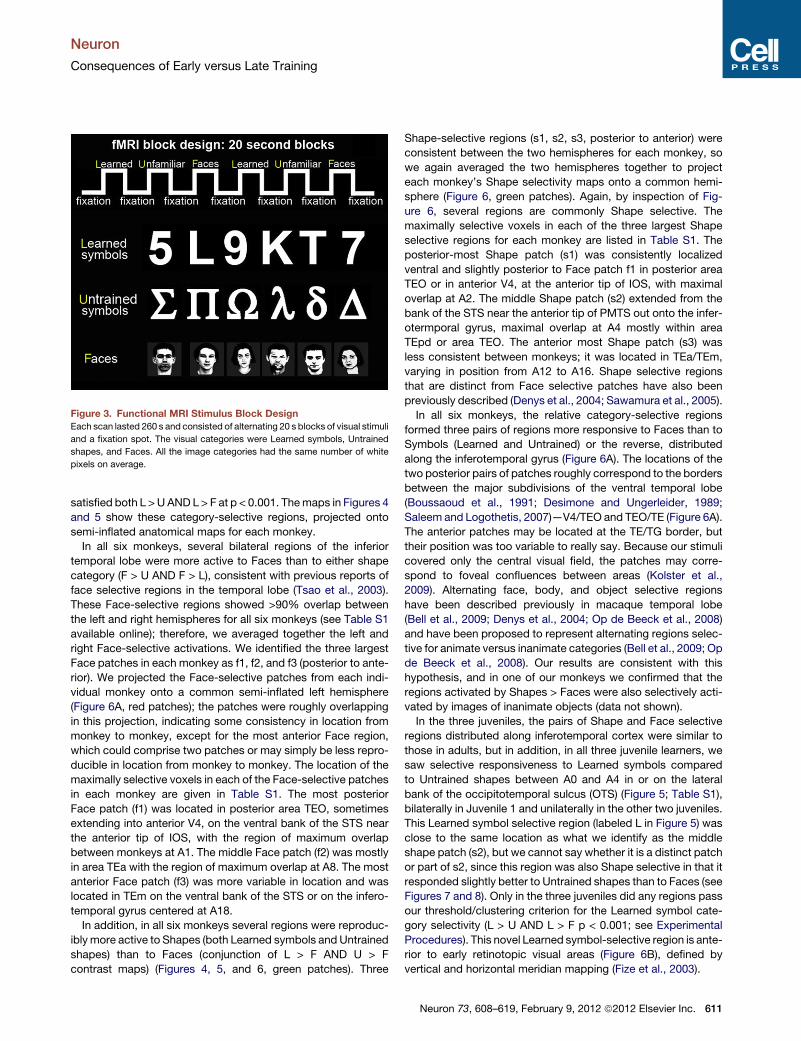
Figure 3. Functional MRI Stimulus Block Design
Each scan lasted 260 s and consisted of alternating 20 s blocks of visual stimuli
and a fixation spot. The visual categories were Learned symbols, Untrained
shapes, and Faces. All the image categories had the same number of white
pixels on average.
Neuron
Consequences of Early versus Late Training
satisfied both L >UAND L> F at p < 0.001. Themaps in Figures 4
and 5 show these category-selective regions, projected onto
semi-inflated anatomical maps for each monkey.
In all six monkeys, several bilateral regions of the inferior
temporal lobe were more active to Faces than to either shape
category (F > U AND F > L), consistent with previous reports of
face selective regions in the temporal lobe (Tsao et al., 2003).
These Face-selective regions showed >90% overlap between
the left and right hemispheres for all six monkeys (see Table S1
available online); therefore, we averaged together the left and
right Face-selective activations. We identified the three largest
Face patches in each monkey as f1, f2, and f3 (posterior to ante-
rior). We projected the Face-selective patches from each indi-
vidual monkey onto a common semi-inflated left hemisphere
(Figure 6A, red patches); the patches were roughly overlapping
in this projection, indicating some consistency in location from
monkey to monkey, except for the most anterior Face region,
which could comprise two patches or may simply be less repro-
ducible in location from monkey to monkey. The location of the
maximally selective voxels in each of the Face-selective patches
in each monkey are given in Table S1. The most posterior
Face patch (f1) was located in posterior area TEO, sometimes
extending into anterior V4, on the ventral bank of the STS near
the anterior tip of IOS, with the region of maximum overlap
between monkeys at A1. The middle Face patch (f2) was mostly
in area TEa with the region of maximum overlap at A8. The most
anterior Face patch (f3) was more variable in location and was
located in TEm on the ventral bank of the STS or on the infero-
temporal gyrus centered at A18.
In addition, in all six monkeys several regions were reproduc-
iblymore active to Shapes (both Learned symbols and Untrained
shapes) than to Faces (conjunction of L > F AND U > F
contrast maps) (Figures 4, 5, and 6, green patches). Three
Shape-selective regions (s1, s2, s3, posterior to anterior) were
consistent between the two hemispheres for each monkey, so
we again averaged the two hemispheres together to project
each monkey’s Shape selectivity maps onto a common hemi-
sphere (Figure 6, green patches). Again, by inspection of Fig-
ure 6, several regions are commonly Shape selective. The
maximally selective voxels in each of the three largest Shape
selective regions for each monkey are listed in Table S1. The
posterior-most Shape patch (s1) was consistently localized
ventral and slightly posterior to Face patch f1 in posterior area
TEO or in anterior V4, at the anterior tip of IOS, with maximal
overlap at A2. The middle Shape patch (s2) extended from the
bank of the STS near the anterior tip of PMTS out onto the infer-
otermporal gyrus, maximal overlap at A4 mostly within area
TEpd or area TEO. The anterior most Shape patch (s3) was
less consistent between monkeys; it was located in TEa/TEm,
varying in position from A12 to A16. Shape selective regions
that are distinct from Face selective patches have also been
previously described (Denys et al., 2004; Sawamura et al., 2005).
In all six monkeys, the relative category-selective regions
formed three pairs of regions more responsive to Faces than to
Symbols (Learned and Untrained) or the reverse, distributed
along the inferotemporal gyrus (Figure 6A). The locations of the
two posterior pairs of patches roughly correspond to the borders
between the major subdivisions of the ventral temporal lobe
(Boussaoud et al., 1991; Desimone and Ungerleider, 1989;
Saleem and Logothetis, 2007)—V4/TEO and TEO/TE (Figure 6A).
The anterior patches may be located at the TE/TG border, but
their position was too variable to really say. Because our stimuli
covered only the central visual field, the patches may corre-
spond to foveal confluences between areas (Kolster et al.,
2009). Alternating face, body, and object selective regions
have been described previously in macaque temporal lobe
(Bell et al., 2009; Denys et al., 2004; Op de Beeck et al., 2008)
and have been proposed to represent alternating regions selec-
tive for animate versus inanimate categories (Bell et al., 2009; Op
de Beeck et al., 2008). Our results are consistent with this
hypothesis, and in one of our monkeys we confirmed that the
regions activated by Shapes > Faces were also selectively acti-
vated by images of inanimate objects (data not shown).
In the three juveniles, the pairs of Shape and Face selective
regions distributed along inferotemporal cortex were similar to
those in adults, but in addition, in all three juvenile learners, we
saw selective responsiveness to Learned symbols compared
to Untrained shapes between A0 and A4 in or on the lateral
bank of the occipitotemporal sulcus (OTS) (Figure 5; Table S1),
bilaterally in Juvenile 1 and unilaterally in the other two juveniles.
This Learned symbol selective region (labeled L in Figure 5) was
close to the same location as what we identify as the middle
shape patch (s2), but we cannot say whether it is a distinct patch
or part of s2, since this region was also Shape selective in that it
responded slightly better to Untrained shapes than to Faces (see
Figures 7 and 8). Only in the three juveniles did any regions pass
our threshold/clustering criterion for the Learned symbol cate-
gory selectivity (L > U AND L > F p < 0.001; see Experimental
Procedures). This novel Learned symbol-selective region is ante-
rior to early retinotopic visual areas (Figure 6B), defined by
vertical and horizontal meridian mapping (Fize et al., 2003).
Neuron 73, 608–619, February 9, 2012 ª2012 Elsevier Inc. 611
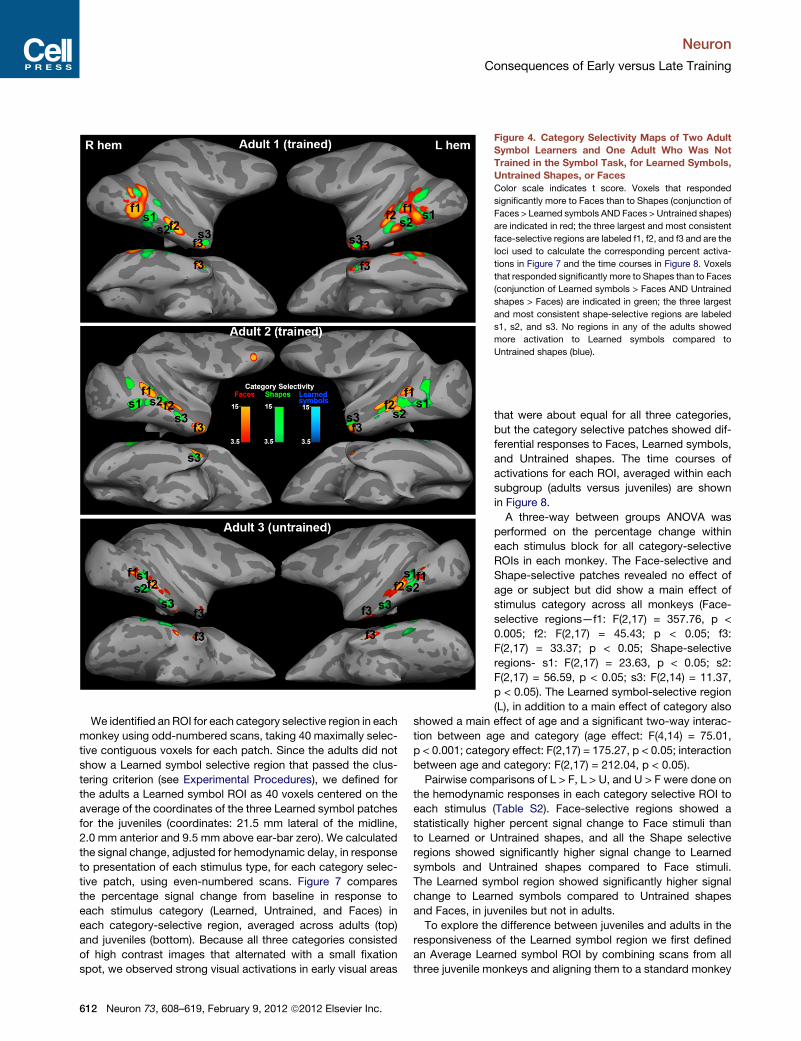
Figure 4. Category Selectivity Maps of Two Adult
Symbol Learners and One Adult Who Was Not
Trained in the Symbol Task, for Learned Symbols,
Untrained Shapes, or Faces
Color scale indicates t score. Voxels that responded
significantly more to Faces than to Shapes (conjunction of
Faces > Learned symbols AND Faces > Untrained shapes)
are indicated in red; the three largest and most consistent
face-selective regions are labeled f1, f2, and f3 and are the
loci used to calculate the corresponding percent activa-
tions in Figure 7 and the time courses in Figure 8. Voxels
that responded significantly more to Shapes than to Faces
(conjunction of Learned symbols > Faces AND Untrained
shapes > Faces) are indicated in green; the three largest
and most consistent shape-selective regions are labeled
s1, s2, and s3. No regions in any of the adults showed
more activation to Learned symbols compared to
Untrained shapes (blue).
Neuron
Consequences of Early versus Late Training
We identified an ROI for each category selective region in each
monkey using odd-numbered scans, taking 40 maximally selec-
tive contiguous voxels for each patch. Since the adults did not
show a Learned symbol selective region that passed the clus-
tering criterion (see Experimental Procedures), we defined for
the adults a Learned symbol ROI as 40 voxels centered on the
average of the coordinates of the three Learned symbol patches
for the juveniles (coordinates: 21.5 mm lateral of the midline,
2.0 mm anterior and 9.5 mm above ear-bar zero). We calculated
the signal change, adjusted for hemodynamic delay, in response
to presentation of each stimulus type, for each category selec-
tive patch, using even-numbered scans. Figure 7 compares
the percentage signal change from baseline in response to
each stimulus category (Learned, Untrained, and Faces) in
each category-selective region, averaged across adults (top)
and juveniles (bottom). Because all three categories consisted
of high contrast images that alternated with a small fixation
spot, we observed strong visual activations in early visual areas
612 Neuron 73, 608–619, February 9, 2012 ª2012 Elsevier Inc.
that were about equal for all three categories,
but the category selective patches showed dif-
ferential responses to Faces, Learned symbols,
and Untrained shapes. The time courses of
activations for each ROI, averaged within each
subgroup (adults versus juveniles) are shown
in Figure 8.
A three-way between groups ANOVA was
performed on the percentage change within
each stimulus block for all category-selective
ROIs in each monkey. The Face-selective and
Shape-selective patches revealed no effect of
age or subject but did show a main effect of
stimulus category across all monkeys (Face-
selective regions—f1: F(2,17) = 357.76, p <
0.005; f2: F(2,17) = 45.43; p < 0.05; f3:
F(2,17) = 33.37; p < 0.05; Shape-selective
regions- s1: F(2,17) = 23.63, p < 0.05; s2:
F(2,17) = 56.59, p < 0.05; s3: F(2,14) = 11.37,
p < 0.05). The Learned symbol-selective region
(L), in addition to a main effect of category also
showed a main effect of age and a significant two-way interac-
tion between age and category (age effect: F(4,14) = 75.01,
p < 0.001; category effect: F(2,17) = 175.27, p < 0.05; interaction
between age and category: F(2,17) = 212.04, p < 0.05).
Pairwise comparisons of L > F, L > U, and U > F were done on
the hemodynamic responses in each category selective ROI to
each stimulus (Table S2). Face-selective regions showed a
statistically higher percent signal change to Face stimuli than
to Learned or Untrained shapes, and all the Shape selective
regions showed significantly higher signal change to Learned
symbols and Untrained shapes compared to Face stimuli.
The Learned symbol region showed significantly higher signal
change to Learned symbols compared to Untrained shapes
and Faces, in juveniles but not in adults.
To explore the difference between juveniles and adults in the
responsiveness of the Learned symbol region we first defined
an Average Learned symbol ROI by combining scans from all
three juvenile monkeys and aligning them to a standard monkey
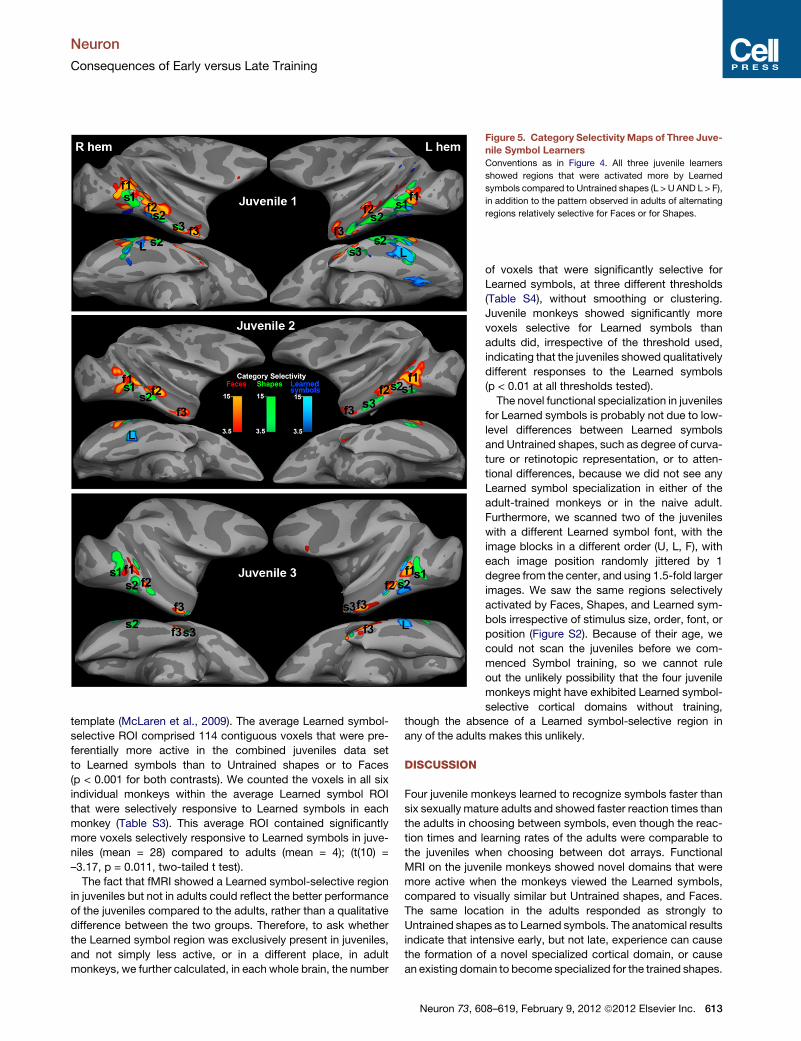
Figure 5. Category Selectivity Maps of Three Juve-
nile Symbol Learners
Conventions as in Figure 4. All three juvenile learners
showed regions that were activated more by Learned
symbols compared to Untrained shapes (L > U AND L > F),
in addition to the pattern observed in adults of alternating
regions relatively selective for Faces or for Shapes.
Neuron
Consequences of Early versus Late Training
template (McLaren et al., 2009). The average Learned symbol-
selective ROI comprised 114 contiguous voxels that were pre-
ferentially more active in the combined juveniles data set
to Learned symbols than to Untrained shapes or to Faces
(p < 0.001 for both contrasts). We counted the voxels in all six
individual monkeys within the average Learned symbol ROI
that were selectively responsive to Learned symbols in each
monkey (Table S3). This average ROI contained significantly
more voxels selectively responsive to Learned symbols in juve-
niles (mean = 28) compared to adults (mean = 4); (t(10) =
–3.17, p = 0.011, two-tailed t test).
The fact that fMRI showed a Learned symbol-selective region
in juveniles but not in adults could reflect the better performance
of the juveniles compared to the adults, rather than a qualitative
difference between the two groups. Therefore, to ask whether
the Learned symbol region was exclusively present in juveniles,
and not simply less active, or in a different place, in adult
monkeys, we further calculated, in each whole brain, the number
Neuron 73, 60
of voxels that were significantly selective for
Learned symbols, at three different thresholds
(Table S4), without smoothing or clustering.
Juvenile monkeys showed significantly more
voxels selective for Learned symbols than
adults did, irrespective of the threshold used,
indicating that the juveniles showed qualitatively
different responses to the Learned symbols
(p < 0.01 at all thresholds tested).
The novel functional specialization in juveniles
for Learned symbols is probably not due to low-
level differences between Learned symbols
and Untrained shapes, such as degree of curva-
ture or retinotopic representation, or to atten-
tional differences, because we did not see any
Learned symbol specialization in either of the
adult-trained monkeys or in the naive adult.
Furthermore, we scanned two of the juveniles
with a different Learned symbol font, with the
image blocks in a different order (U, L, F), with
each image position randomly jittered by 1
degree from the center, and using 1.5-fold larger
images. We saw the same regions selectively
activated by Faces, Shapes, and Learned sym-
bols irrespective of stimulus size, order, font, or
position (Figure S2). Because of their age, we
could not scan the juveniles before we com-
menced Symbol training, so we cannot rule
out the unlikely possibility that the four juvenile
monkeys might have exhibited Learned symbol-
selective cortical domains without training,
though the absence of a Learned symbol-selective region in
any of the adults makes this unlikely.
DISCUSSION
Four juvenile monkeys learned to recognize symbols faster than
six sexually mature adults and showed faster reaction times than
the adults in choosing between symbols, even though the reac-
tion times and learning rates of the adults were comparable to
the juveniles when choosing between dot arrays. Functional
MRI on the juvenile monkeys showed novel domains that were
more active when the monkeys viewed the Learned symbols,
compared to visually similar but Untrained shapes, and Faces.
The same location in the adults responded as strongly to
Untrained shapes as to Learned symbols. The anatomical results
indicate that intensive early, but not late, experience can cause
the formation of a novel specialized cortical domain, or cause
an existing domain to become specialized for the trained shapes.
8–619, February 9, 2012 ª2012 Elsevier Inc. 613
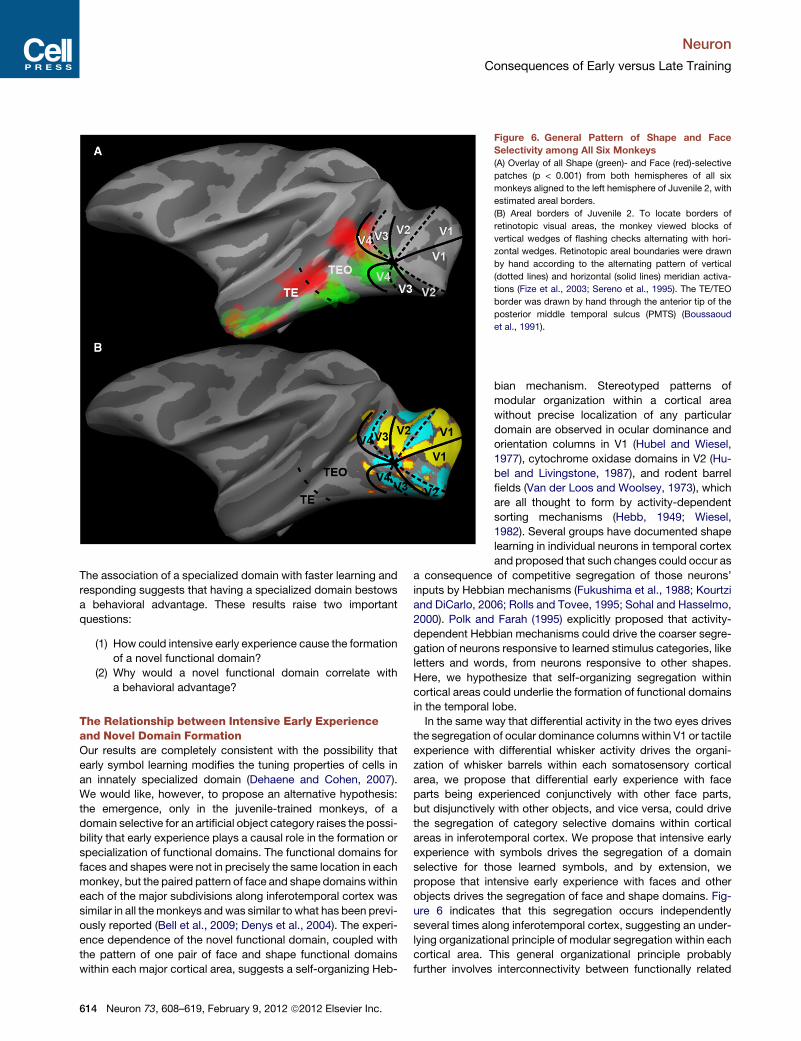
Figure 6. General Pattern of Shape and Face
Selectivity among All Six Monkeys
(A) Overlay of all Shape (green)- and Face (red)-selective
patches (p < 0.001) from both hemispheres of all six
monkeys aligned to the left hemisphere of Juvenile 2, with
estimated areal borders.
(B) Areal borders of Juvenile 2. To locate borders of
retinotopic visual areas, the monkey viewed blocks of
vertical wedges of flashing checks alternating with hori-
zontal wedges. Retinotopic areal boundaries were drawn
by hand according to the alternating pattern of vertical
(dotted lines) and horizontal (solid lines) meridian activa-
tions (Fize et al., 2003; Sereno et al., 1995). The TE/TEO
border was drawn by hand through the anterior tip of the
posterior middle temporal sulcus (PMTS) (Boussaoud
et al., 1991).
Neuron
Consequences of Early versus Late Training
The association of a specialized domain with faster learning and
responding suggests that having a specialized domain bestows
a behavioral advantage. These results raise two important
questions:
(1) How could intensive early experience cause the formation
of a novel functional domain?
(2) Why would a novel functional domain correlate with
a behavioral advantage?
The Relationship between Intensive Early Experienceand Novel Domain FormationOur results are completely consistent with the possibility that
early symbol learning modifies the tuning properties of cells in
an innately specialized domain (Dehaene and Cohen, 2007).
We would like, however, to propose an alternative hypothesis:
the emergence, only in the juvenile-trained monkeys, of a
domain selective for an artificial object category raises the possi-
bility that early experience plays a causal role in the formation or
specialization of functional domains. The functional domains for
faces and shapes were not in precisely the same location in each
monkey, but the paired pattern of face and shape domains within
each of the major subdivisions along inferotemporal cortex was
similar in all themonkeys and was similar to what has been previ-
ously reported (Bell et al., 2009; Denys et al., 2004). The experi-
ence dependence of the novel functional domain, coupled with
the pattern of one pair of face and shape functional domains
within each major cortical area, suggests a self-organizing Heb-
614 Neuron 73, 608–619, February 9, 2012 ª2012 Elsevier Inc.
bian mechanism. Stereotyped patterns of
modular organization within a cortical area
without precise localization of any particular
domain are observed in ocular dominance and
orientation columns in V1 (Hubel and Wiesel,
1977), cytochrome oxidase domains in V2 (Hu-
bel and Livingstone, 1987), and rodent barrel
fields (Van der Loos and Woolsey, 1973), which
are all thought to form by activity-dependent
sorting mechanisms (Hebb, 1949; Wiesel,
1982). Several groups have documented shape
learning in individual neurons in temporal cortex
and proposed that such changes could occur as
a consequence of competitive segregation of those neurons’
inputs by Hebbian mechanisms (Fukushima et al., 1988; Kourtzi
and DiCarlo, 2006; Rolls and Tovee, 1995; Sohal and Hasselmo,
2000). Polk and Farah (1995) explicitly proposed that activity-
dependent Hebbian mechanisms could drive the coarser segre-
gation of neurons responsive to learned stimulus categories, like
letters and words, from neurons responsive to other shapes.
Here, we hypothesize that self-organizing segregation within
cortical areas could underlie the formation of functional domains
in the temporal lobe.
In the same way that differential activity in the two eyes drives
the segregation of ocular dominance columns within V1 or tactile
experience with differential whisker activity drives the organi-
zation of whisker barrels within each somatosensory cortical
area, we propose that differential early experience with face
parts being experienced conjunctively with other face parts,
but disjunctively with other objects, and vice versa, could drive
the segregation of category selective domains within cortical
areas in inferotemporal cortex. We propose that intensive early
experience with symbols drives the segregation of a domain
selective for those learned symbols, and by extension, we
propose that intensive early experience with faces and other
objects drives the segregation of face and shape domains. Fig-
ure 6 indicates that this segregation occurs independently
several times along inferotemporal cortex, suggesting an under-
lying organizational principle of modular segregation within each
cortical area. This general organizational principle probably
further involves interconnectivity between functionally related
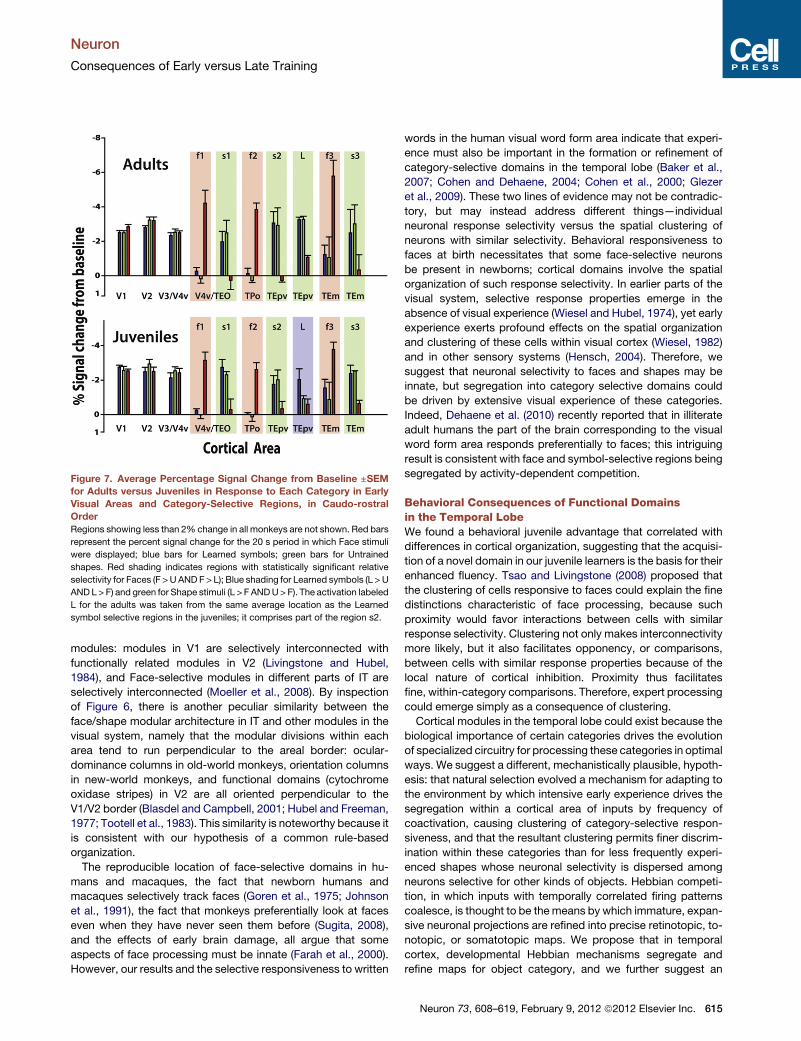
Figure 7. Average Percentage Signal Change from Baseline ±SEMfor Adults versus Juveniles in Response to Each Category in Early
Visual Areas and Category-Selective Regions, in Caudo-rostral
Order
Regions showing less than 2% change in all monkeys are not shown. Red bars
represent the percent signal change for the 20 s period in which Face stimuli
were displayed; blue bars for Learned symbols; green bars for Untrained
shapes. Red shading indicates regions with statistically significant relative
selectivity for Faces (F >U ANDF > L); Blue shading for Learned symbols (L > U
ANDL > F) and green for Shape stimuli (L > F ANDU> F). The activation labeled
L for the adults was taken from the same average location as the Learned
symbol selective regions in the juveniles; it comprises part of the region s2.
Neuron
Consequences of Early versus Late Training
modules: modules in V1 are selectively interconnected with
functionally related modules in V2 (Livingstone and Hubel,
1984), and Face-selective modules in different parts of IT are
selectively interconnected (Moeller et al., 2008). By inspection
of Figure 6, there is another peculiar similarity between the
face/shape modular architecture in IT and other modules in the
visual system, namely that the modular divisions within each
area tend to run perpendicular to the areal border: ocular-
dominance columns in old-world monkeys, orientation columns
in new-world monkeys, and functional domains (cytochrome
oxidase stripes) in V2 are all oriented perpendicular to the
V1/V2 border (Blasdel and Campbell, 2001; Hubel and Freeman,
1977; Tootell et al., 1983). This similarity is noteworthy because it
is consistent with our hypothesis of a common rule-based
organization.
The reproducible location of face-selective domains in hu-
mans and macaques, the fact that newborn humans and
macaques selectively track faces (Goren et al., 1975; Johnson
et al., 1991), the fact that monkeys preferentially look at faces
even when they have never seen them before (Sugita, 2008),
and the effects of early brain damage, all argue that some
aspects of face processing must be innate (Farah et al., 2000).
However, our results and the selective responsiveness to written
words in the human visual word form area indicate that experi-
ence must also be important in the formation or refinement of
category-selective domains in the temporal lobe (Baker et al.,
2007; Cohen and Dehaene, 2004; Cohen et al., 2000; Glezer
et al., 2009). These two lines of evidence may not be contradic-
tory, but may instead address different things—individual
neuronal response selectivity versus the spatial clustering of
neurons with similar selectivity. Behavioral responsiveness to
faces at birth necessitates that some face-selective neurons
be present in newborns; cortical domains involve the spatial
organization of such response selectivity. In earlier parts of the
visual system, selective response properties emerge in the
absence of visual experience (Wiesel and Hubel, 1974), yet early
experience exerts profound effects on the spatial organization
and clustering of these cells within visual cortex (Wiesel, 1982)
and in other sensory systems (Hensch, 2004). Therefore, we
suggest that neuronal selectivity to faces and shapes may be
innate, but segregation into category selective domains could
be driven by extensive visual experience of these categories.
Indeed, Dehaene et al. (2010) recently reported that in illiterate
adult humans the part of the brain corresponding to the visual
word form area responds preferentially to faces; this intriguing
result is consistent with face and symbol-selective regions being
segregated by activity-dependent competition.
Behavioral Consequences of Functional Domainsin the Temporal LobeWe found a behavioral juvenile advantage that correlated with
differences in cortical organization, suggesting that the acquisi-
tion of a novel domain in our juvenile learners is the basis for their
enhanced fluency. Tsao and Livingstone (2008) proposed that
the clustering of cells responsive to faces could explain the fine
distinctions characteristic of face processing, because such
proximity would favor interactions between cells with similar
response selectivity. Clustering not only makes interconnectivity
more likely, but it also facilitates opponency, or comparisons,
between cells with similar response properties because of the
local nature of cortical inhibition. Proximity thus facilitates
fine, within-category comparisons. Therefore, expert processing
could emerge simply as a consequence of clustering.
Cortical modules in the temporal lobe could exist because the
biological importance of certain categories drives the evolution
of specialized circuitry for processing these categories in optimal
ways. We suggest a different, mechanistically plausible, hypoth-
esis: that natural selection evolved a mechanism for adapting to
the environment by which intensive early experience drives the
segregation within a cortical area of inputs by frequency of
coactivation, causing clustering of category-selective respon-
siveness, and that the resultant clustering permits finer discrim-
ination within these categories than for less frequently experi-
enced shapes whose neuronal selectivity is dispersed among
neurons selective for other kinds of objects. Hebbian competi-
tion, in which inputs with temporally correlated firing patterns
coalesce, is thought to be themeans by which immature, expan-
sive neuronal projections are refined into precise retinotopic, to-
notopic, or somatotopic maps. We propose that in temporal
cortex, developmental Hebbian mechanisms segregate and
refine maps for object category, and we further suggest an
Neuron 73, 608–619, February 9, 2012 ª2012 Elsevier Inc. 615
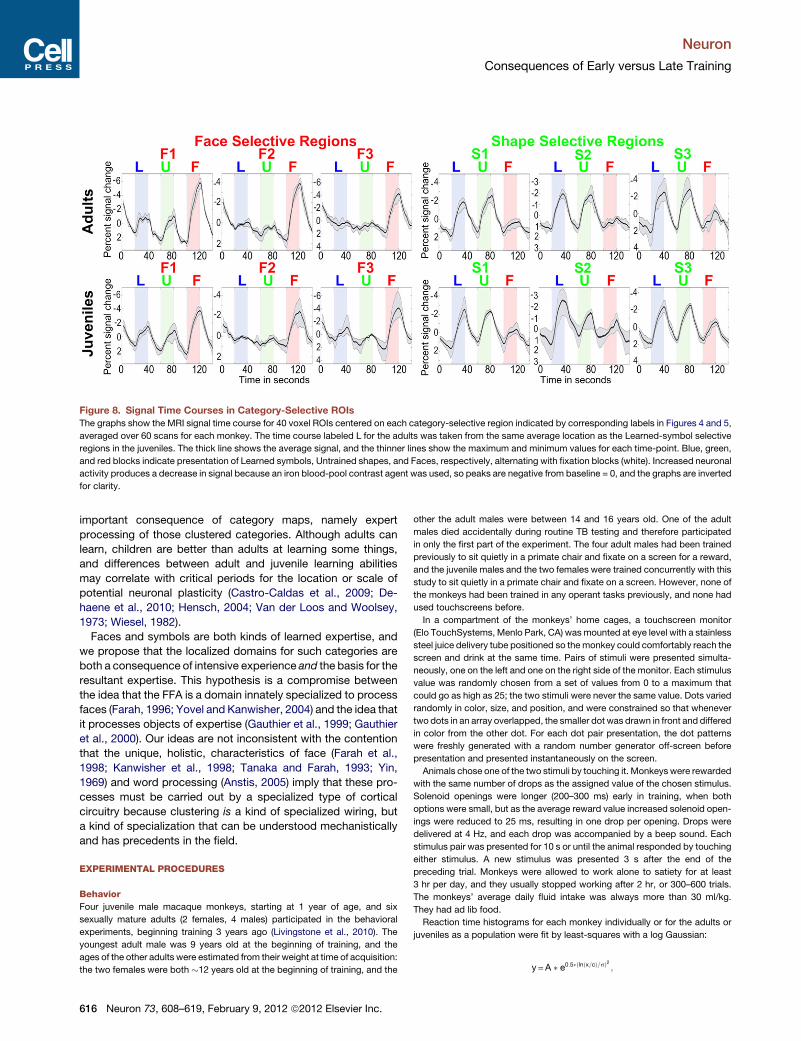
Figure 8. Signal Time Courses in Category-Selective ROIs
The graphs show the MRI signal time course for 40 voxel ROIs centered on each category-selective region indicated by corresponding labels in Figures 4 and 5,
averaged over 60 scans for each monkey. The time course labeled L for the adults was taken from the same average location as the Learned-symbol selective
regions in the juveniles. The thick line shows the average signal, and the thinner lines show the maximum and minimum values for each time-point. Blue, green,
and red blocks indicate presentation of Learned symbols, Untrained shapes, and Faces, respectively, alternating with fixation blocks (white). Increased neuronal
activity produces a decrease in signal because an iron blood-pool contrast agent was used, so peaks are negative from baseline = 0, and the graphs are inverted
for clarity.
Neuron
Consequences of Early versus Late Training
important consequence of category maps, namely expert
processing of those clustered categories. Although adults can
learn, children are better than adults at learning some things,
and differences between adult and juvenile learning abilities
may correlate with critical periods for the location or scale of
potential neuronal plasticity (Castro-Caldas et al., 2009; De-
haene et al., 2010; Hensch, 2004; Van der Loos and Woolsey,
1973; Wiesel, 1982).
Faces and symbols are both kinds of learned expertise, and
we propose that the localized domains for such categories are
both a consequence of intensive experience and the basis for the
resultant expertise. This hypothesis is a compromise between
the idea that the FFA is a domain innately specialized to process
faces (Farah, 1996; Yovel and Kanwisher, 2004) and the idea that
it processes objects of expertise (Gauthier et al., 1999; Gauthier
et al., 2000). Our ideas are not inconsistent with the contention
that the unique, holistic, characteristics of face (Farah et al.,
1998; Kanwisher et al., 1998; Tanaka and Farah, 1993; Yin,
1969) and word processing (Anstis, 2005) imply that these pro-
cesses must be carried out by a specialized type of cortical
circuitry because clustering is a kind of specialized wiring, but
a kind of specialization that can be understood mechanistically
and has precedents in the field.
EXPERIMENTAL PROCEDURES
Behavior
Four juvenile male macaque monkeys, starting at 1 year of age, and six
sexually mature adults (2 females, 4 males) participated in the behavioral
experiments, beginning training 3 years ago (Livingstone et al., 2010). The
youngest adult male was 9 years old at the beginning of training, and the
ages of the other adults were estimated from their weight at time of acquisition:
the two females were both �12 years old at the beginning of training, and the
616 Neuron 73, 608–619, February 9, 2012 ª2012 Elsevier Inc.
other the adult males were between 14 and 16 years old. One of the adult
males died accidentally during routine TB testing and therefore participated
in only the first part of the experiment. The four adult males had been trained
previously to sit quietly in a primate chair and fixate on a screen for a reward,
and the juvenile males and the two females were trained concurrently with this
study to sit quietly in a primate chair and fixate on a screen. However, none of
the monkeys had been trained in any operant tasks previously, and none had
used touchscreens before.
In a compartment of the monkeys’ home cages, a touchscreen monitor
(Elo TouchSystems, Menlo Park, CA) wasmounted at eye level with a stainless
steel juice delivery tube positioned so themonkey could comfortably reach the
screen and drink at the same time. Pairs of stimuli were presented simulta-
neously, one on the left and one on the right side of the monitor. Each stimulus
value was randomly chosen from a set of values from 0 to a maximum that
could go as high as 25; the two stimuli were never the same value. Dots varied
randomly in color, size, and position, and were constrained so that whenever
two dots in an array overlapped, the smaller dot was drawn in front and differed
in color from the other dot. For each dot pair presentation, the dot patterns
were freshly generated with a random number generator off-screen before
presentation and presented instantaneously on the screen.
Animals chose one of the two stimuli by touching it. Monkeys were rewarded
with the same number of drops as the assigned value of the chosen stimulus.
Solenoid openings were longer (200–300 ms) early in training, when both
options were small, but as the average reward value increased solenoid open-
ings were reduced to 25 ms, resulting in one drop per opening. Drops were
delivered at 4 Hz, and each drop was accompanied by a beep sound. Each
stimulus pair was presented for 10 s or until the animal responded by touching
either stimulus. A new stimulus was presented 3 s after the end of the
preceding trial. Monkeys were allowed to work alone to satiety for at least
3 hr per day, and they usually stopped working after 2 hr, or 300–600 trials.
The monkeys’ average daily fluid intake was always more than 30 ml/kg.
They had ad lib food.
Reaction time histograms for each monkey individually or for the adults or
juveniles as a population were fit by least-squares with a log Gaussian:
y=A � e0:5�ðlnðx=cÞ=sÞ2 ;
Neuron
Consequences of Early versus Late Training
where A is the amplitude of the Gaussian, c is the center, and s is the width; we
took c, the center of the log Gaussian as the reaction time for each distribution.
To find out how long it took each monkey to learn novel symbols, we calcu-
lated the behavioral value of each novel symbol, as each symbol was intro-
duced. To do this, we extracted from the entire data set all trials in which the
novel symbol was one of the options and took bins of 10 trials (per monkey),
and for each bin we calculated the fraction of larger (novel symbol) choices
as a function of the value of the other choice. For each bin, we took the behav-
ioral value of the novel symbol as the point of subjective equality as a function
of the other choice values from the best fitting sigmoid (cumulative normal
distribution) for those points. We then used the exponential
y=V � �1� elx�;
where y is the calculated behavioral value of the novel stimulus, as a function
of x (10-trial bin number), and V is the actual value of the novel symbol (# of
drops delivered); we used least-squares to estimate the l that gave the best
fit to the data points for each novel symbol. For each novel symbol, we calcu-
lated the number of trials needed for the behavioral value to reach 95% of the
actual value by finding the bin number where the fitted exponential curve
crossed 95% of the actual value.
As an alternative method of calculating how long it took each monkey to
learn each novel symbol, we calculated a running average of the frequency
of larger choices for each novel symbol by averaging across a moving window
of ±10 consecutive trials; using only trials in which the novel symbol was one of
the options. We calculated how many trials it took each monkey to attain 90%
correct (larger) choices for each novel symbol. Results were almost identical to
the equivalent value calculations described above, in that the adults took more
trials to learn each novel symbol than the juveniles did.
We tested all the monkeys behaviorally with 1.5- and 2-fold larger and
smaller fonts, for which theymaintained the same accuracy as with the original
size. We tested the monkeys behaviorally using a serif font (Utopia), instead of
the sans serif font (Helvetica) they first learned, and they all recognized this font
accurately after a few days.
Functional MRI
Six monkeys were scanned to look for localization of Learned symbol respon-
siveness: two adults (one male and one female) who had learned symbols,
three juveniles who had learned symbols, and one adult male who had not
been exposed to the symbol task. These six animals represent the maximum
number of our trained monkeys who could be scanned; the fourth trained
juvenile and the other adult female were not willing to sit still enough in the
scanner for fMRI, and the other trained adult males are too large to scan.
The monkeys were scanned using techniques similar to those pioneered by
Vanduffel and colleagues (2001). The monkeys lay comfortably in a horizontal
primate chair in a ‘‘sphynx’’ position, free to move limbs, but with the head
restrained. The heads of four of the monkeys (the adult female and the three
juveniles) were held stationary during scanning using a noninvasive vacuum
helmet restraint (Srihasam et al., 2010), and the two adult males were held still
using previously implanted delrin headposts (Tsao et al., 2006; Vanduffel et al.,
2001). Each monkey was trained to sit in the chair and habituated to the
sounds ofMR scanning in a ‘‘mock’’MRbore. Themonkeyswere water sched-
uled during the period of testing, and behavioral control was achieved using
operant conditioning techniques. They were trained on a fixation task, and
eye position was monitored using a pupil-corneal reflection tracking system
(RK-726PCI, ISCAN, Cambridge, MA). Monkeys were rewarded for maintain-
ing fixation within a 2� square fixation window. The interval between rewards
was decreased systematically (from 2,000 to 500 ms) as the monkey main-
tained fixation within the window during the trials. After fixation performance
reached an asymptote (20–50 training sessions), the monkeys were scanned
in a 3-T horizontal GE scanner (Sigma) or in a 3T Siemens Tim Trio with an
AC88 gradient insert. Similar results were obtained using both scanners,
though at higher resolution in the Siemens scanner.
We used custom-made 4 channel coil arrays (made by Azma Maryam at the
Martinos Imaging Center or by Resonance Innovations, Omaha, NE) that fit
closely over the monkeys’ heads. In order to enhance contrast, before each
scanning session, themonkeywas injectedwith 10mg/kg of aMonocrystalline
Iron Oxide Nanoparticle contrast agent (Feraheme, AMAG Pharmaceuticals,
Cambridge, MA). Each session consisted of 10–30 functional scans, each
lasting 260 s (2D gradient-echo planar imaging [GE-EPI]; repetition time
[TR] = 2 s, echo time [TE] = 14 ms). In the GE scanner: 64 3 64 matrix; 1.2 3
1.23 1.2 mm voxels, 35 contiguous horizontal slices. In the Siemens scanner:
96 3 84 matrix; 1 3 1 3 1 mm voxels, 50 contiguous horizontal slices. Slices
were positioned to cover the entire brain. In a separate session, a high-
resolution anatomical scan (0.35 3 0.35 3 0.45 mm) was obtained for each
monkey in the Siemens scanner using a surface coil while the monkey was
anesthetized.
Visual stimuli were projected onto a screen at the end of the bore 57 cm from
the animal’s eyes. Each image subtended 3� 3 3�. The stimuli consisted of
symbols the monkeys had learned to associate with reward amount, 5 6 7 8
9 X Y W C H U T F K L N R M E A J, untrained shapes, @ b d D D $ L X g J
P Q S F G # h U P % V, and 21 high-contrast faces. The Learned symbol
blocks never contained symbols the monkey being scanned had not yet
learned, and the number of possible images for each category was always
the same. There was always a fixation spot at the center of the screen. Each
scan lasted 260 s, consisting of 20 s blocks of 20 images (1 s presentation
of each image) from one category, Learned symbols (L), Untrained shapes
(U), or Faces (F). Visual blocks were separated by 20 s blocks of the fixation
spot alone. Stimuli were randomly selected from the appropriate category,
with the constraint that consecutive stimuli not be identical.
Data Analysis
Data were analyzed using AFNI (Cox, 1996) and Freesurfer (Dale et al., 1999;
Fischl et al., 1999). Only scans in which the monkey fixated within the
2� 3 2� fixation window for >90% of the duration were used for statistical anal-
ysis. Prior to data analysis, all functional data were aligned to each monkey’s
anatomical template individually using JIP software (http://www.nitrc.org/
projects/jip) to remove distortions of the functional images, due to field varia-
tions induced by body position and movement between scans.
For four monkeys (all Juveniles and Adult 1), we used a total of 120 scans
from 5 separate sessions each for our analysis. For monkeys Adult 2 and Adult
3, we used 60 scans from two separate sessions each. To identify category-
selective regions for eachmonkey, we analyzed the odd and even scans sepa-
rately, using the odd scans to identify regions selectively activated by each
category (Figures 4 and 5) and the even scans to calculate response time
courses (Figure 8), the percentage signal change (Figure 7), and significance
(Table S2) at each locus. Data were motion corrected, quadratically de-
trended, and smoothed after flattening with a Gaussian kernel of 2 mm full-
width-at-half-magnitude (fwhm). To calculate the maximum likelihood maps
of responses to each stimulus category, we used a modified gamma-variate
function approximating monkey hemodynamic changes in cerebral blood
volume with monocrystalline iron oxide nanoparticle contrast agent (Leite
et al., 2002; Mandeville et al., 1999). We ran Monte Carlo simulations to get
the clustering criterion needed to eliminate false positives arising frommultiple
comparisons (threshold/clustering criterion: p < 0.001, minimum cluster size
15 voxels).
For each monkey, we defined three category contrasts by performing
t tests between pairs of stimulus categories: Learned symbols versus Faces
(LvsF), Learned symbols versus Untrained shapes (LvsU), and Faces versus
Untrained shapes (FvsU). Three stimulus category-selective maps (Learned
L, Shapes S, and Faces F) were defined by conjunction analyses (Bell et al.,
2009; Price et al., 1997).
We used odd-numbered scans to define regions of interest (ROIs) for each
category-selective patch as the best 40 contiguous voxels centered on the
maximally active voxel, to alleviate any adverse effects on results due to differ-
ences in cluster sizes. We then used even-numbered scans to calculate time
courses for each category-selective ROI. This gave us 130 measurements
for blood flow changes, adjusted for hemodynamic delay, during three stim-
ulus conditions. We averaged two stimulus cycles to get 70 measurements
for each ROI, .i.e., 10 values for the average blood flow during the 20 s display
interval for each stimulus condition. Baseline was calculated by averaging the
activity during the fixation periods and was used to calculate the percentage
signal change in Figure 7. Three-way ANOVA was performed on the average
signal change for each stimulus block to test for effects of stimulus category,
subject, and age. Wilcoxon rank-sum test was done on the stimulus block data
Neuron 73, 608–619, February 9, 2012 ª2012 Elsevier Inc. 617
Neuron
Consequences of Early versus Late Training
for statistical significance of the patches (Table S2). The percentage signal
changes for the early visual areas (V1, V2, V3/V4) were calculated using 40
contiguous voxels in the central visual field part of each area, identified using
retinotopic mapping (Srihasam et al., 2010) and a macaque atlas (Saleem and
Logothetis, 2007).
To identify an average ROI for the Learned symbol-selective region, we
randomly took 30 odd-numbered scans from each of the three juvenile
monkeys (90 scans in total). These functional volumes were then warped
into a standard template (McLaren et al., 2009) to compensate for the indi-
vidual differences using a nonrigid mapping software, JIP. Data were analyzed
as described above for individual monkeys. Two ROIs were then defined in left
and right TEpv between A0 and A4 in or on the lateral bank of the OTS, by
taking all the voxels selectively more active for Learned symbols than for
Untrained shapes and Faces within this subregion (114 voxels).
Software for stimulus presentation and reward delivery was developed
in-house and was written in C++. All experiments were done in accordance
with procedures approved by the Harvard Medical School Standing Com-
mittee on Animals.
SUPPLEMENTAL INFORMATION
Supplemental Information includes four tables and one figure and can be
found with this article online at doi:10.1016/j.neuron.2011.12.022.
ACKNOWLEDGMENTS
This work was supported by NIH grant EY16187. We thank Wim Vanduffel for
much help developing scanning technology, Tristram Savage for monkey
training, and Winrich Freiwald, Doris Tsao, and Heather Sternshein for advice
and comments.
Accepted: December 5, 2011
Published: February 8, 2012
REFERENCES
Anstis, S. (2005). Last but not least. Perception 34, 237–240.
Baker, C.I., Liu, J., Wald, L.L., Kwong, K.K., Benner, T., and Kanwisher, N.
(2007). Visual word processing and experiential origins of functional selectivity
in human extrastriate cortex. Proc. Natl. Acad. Sci. USA 104, 9087–9092.
Bell, A.H., Hadj-Bouziane, F., Frihauf, J.B., Tootell, R.B., and Ungerleider, L.G.
(2009). Object representations in the temporal cortex of monkeys and humans
as revealed by functional magnetic resonance imaging. J. Neurophysiol. 101,
688–700.
Blasdel, G., and Campbell, D. (2001). Functional retinotopy of monkey visual
cortex. J. Neurosci. 21, 8286–8301.
Boussaoud, D., Desimone, R., and Ungerleider, L.G. (1991). Visual topography
of area TEO in the macaque. J. Comp. Neurol. 306, 554–575.
Boynton, G.M., Engel, S.A., Glover, G.H., and Heeger, D.J. (1996). Linear
systems analysis of functional magnetic resonance imaging in human V1.
J. Neurosci. 16, 4207–4221.
Cantlon, J.F., and Brannon, E.M. (2007). How much does number matter to
a monkey (Macaca mulatta)? J. Exp. Psychol. Anim. Behav. Process. 33,
32–41.
Castro-Caldas, A., Nunes, M.V., Maestu, F., Ortiz, T., Simoes, R., Fernandes,
R., de La Guia, E., Garcia, E., and Goncalves, M. (2009). Learning orthography
in adulthood: a magnetoencephalographic study. J. Neuropsychol. 3, 17–30.
Changizi, M.A., Zhang, Q., Ye, H., and Shimojo, S. (2006). The structures of
letters and symbols throughout human history are selected to match those
found in objects in natural scenes. Am. Nat. 167, E117–E139.
Cohen, L., andDehaene, S. (2004). Specializationwithin the ventral stream: the
case for the visual word form area. Neuroimage 22, 466–476.
Cohen, L., Dehaene, S., Naccache, L., Lehericy, S., Dehaene-Lambertz, G.,
Henaff, M.A., and Michel, F. (2000). The visual word form area: spatial and
618 Neuron 73, 608–619, February 9, 2012 ª2012 Elsevier Inc.
temporal characterization of an initial stage of reading in normal subjects
and posterior split-brain patients. Brain 123, 291–307.
Cox, R.W. (1996). AFNI: software for analysis and visualization of functional
magnetic resonance neuroimages. Comput. Biomed. Res. 29, 162–173.
Dale, A.M., Fischl, B., and Sereno,M.I. (1999). Cortical surface-based analysis.
I. Segmentation and surface reconstruction. Neuroimage 9, 179–194.
Dehaene, S., and Cohen, L. (2007). Cultural recycling of cortical maps. Neuron
56, 384–398.
Dehaene, S., Pegado, F., Braga, L.W., Ventura, P., Nunes Filho, G., Jobert, A.,
Dehaene-Lambertz, G., Kolinsky, R., Morais, J., and Cohen, L. (2010). How
learning to read changes the cortical networks for vision and language.
Science 330, 1359–1364.
Denys, K., Vanduffel, W., Fize, D., Nelissen, K., Peuskens, H., Van Essen, D.,
and Orban, G.A. (2004). The processing of visual shape in the cerebral cortex
of human and nonhuman primates: a functional magnetic resonance imaging
study. J. Neurosci. 24, 2551–2565.
Desimone, R., and Ungerleider, L.G. (1989). Neural mechanism of visual
processing in monkeys. In Handbook of Neuropsychology, E. Boller and
B.V. Grafman, eds. (New York: Elsivier Science Publishers).
Farah, M.J. (1996). Is face recognition ‘special’? Evidence from neuropsy-
chology. Behav. Brain Res. 76, 181–189.
Farah, M.J., Wilson, K.D., Drain, M., and Tanaka, J.N. (1998). What is ‘‘special’’
about face perception? Psychol. Rev. 105, 482–498.
Farah, M.J., Rabinowitz, C., Quinn, G.E., and Liu, G.T. (2000). Early commit-
ment of neural substrates for face recognition. Cogn. Neuropsychol. 17,
117–123.
Fischl, B., Sereno,M.I., and Dale, A.M. (1999). Cortical surface-based analysis.
II: Inflation, flattening, and a surface-based coordinate system. Neuroimage 9,
195–207.
Fize, D., Vanduffel, W., Nelissen, K., Denys, K., Chef d’Hotel, C., Faugeras, O.,
and Orban, G.A. (2003). The retinotopic organization of primate dorsal V4 and
surrounding areas: A functional magnetic resonance imaging study in awake
monkeys. J. Neurosci. 23, 7395–7406.
Fukushima, K., Miyake, S., and Ito, T. (1988). Neocognitron: a neural network
model for a mechanism of visual pattern recognition. In Computer Society
Press Technology Series Neural Networks (Los Alamitos, CA: IEEE
Computer Society Press), pp. 136–144.
Gauthier, I., Behrmann, M., and Tarr, M.J. (1999). Can face recognition really
be dissociated from object recognition? J. Cogn. Neurosci. 11, 349–370.
Gauthier, I., Skudlarski, P., Gore, J.C., and Anderson, A.W. (2000). Expertise
for cars and birds recruits brain areas involved in face recognition. Nat.
Neurosci. 3, 191–197.
Glezer, L.S., Jiang, X., and Riesenhuber, M. (2009). Evidence for highly selec-
tive neuronal tuning to whole words in the ‘‘visual word form area’’. Neuron 62,
199–204.
Goren, C.C., Sarty, M., and Wu, P.Y. (1975). Visual following and pattern
discrimination of face-like stimuli by newborn infants. Pediatrics 56, 544–549.
Hebb, D.O. (1949). The Organization of Behavior; a Neuropsychological
Theory (New York: Wiley).
Hensch, T.K. (2004). Critical period regulation. Annu. Rev. Neurosci. 27,
549–579.
Hubel, D.H., and Freeman, D.C. (1977). Projection into the visual field of ocular
dominance columns in macaque monkey. Brain Res. 122, 336–343.
Hubel, D.H., and Livingstone, M.S. (1987). Segregation of form, color, and
stereopsis in primate area 18. J. Neurosci. 7, 3378–3415.
Hubel, D.H., and Wiesel, T.N. (1977). Ferrier lecture. Functional architecture of
macaque monkey visual cortex. Proc. R. Soc. Lond. B Biol. Sci. 198, 1–59.
Johnson, M.H., Dziurawiec, S., Ellis, H., and Morton, J. (1991). Newborns’
preferential tracking of face-like stimuli and its subsequent decline.
Cognition 40, 1–19.
Neuron
Consequences of Early versus Late Training
Kanwisher, N.G., McDermott, J., and Chun, M.M. (1997). The fusiform face
area: a module in human extrastriate cortex specialized for face perception.
J. Neurosci. 17, 4302–4311.
Kanwisher, N., Tong, F., and Nakayama, K. (1998). The effect of face inversion
on the human fusiform face area. Cognition 68, B1–B11.
Kolster, H., Mandeville, J.B., Arsenault, J.T., Ekstrom, L.B., Wald, L.L., and
Vanduffel, W. (2009). Visual field map clusters in macaque extrastriate visual
cortex. J. Neurosci. 29, 7031–7039.
Kourtzi, Z., and DiCarlo, J.J. (2006). Learning and neural plasticity in visual
object recognition. Curr. Opin. Neurobiol. 16, 152–158.
Leite, F.P., Tsao, D., Vanduffel, W., Fize, D., Sasaki, Y., Wald, L.L., Dale, A.M.,
Kwong, K.K., Orban, G.A., Rosen, B.R., et al. (2002). Repeated fMRI using iron
oxide contrast agent in awake, behavingmacaques at 3 Tesla. Neuroimage 16,
283–294.
Livingstone, M.S., and Hubel, D.H. (1984). Anatomy and physiology of a color
system in the primate visual cortex. J. Neurosci. 4, 309–356.
Livingstone, M.S., Srihasam, K., and Morocz, I.A. (2010). The benefit of
symbols: monkeys show linear, human-like, accuracy when using symbols
to represent scalar value. Anim. Cogn. 13, 711–719.
Mandeville, J.B., Marota, J.J., Ayata, C., Zaharchuk, G., Moskowitz, M.A.,
Rosen, B.R., and Weisskoff, R.M. (1999). Evidence of a cerebrovascular
postarteriole windkessel with delayed compliance. J. Cereb. Blood Flow
Metab. 19, 679–689.
McCarthy, G., Puce, A., Gore, J.C., and Allison, T. (1997). Face-specific
processing in the human fusiform gyrus. J. Cogn. Neurosci. 9, 605–610.
McLaren, D.G., Kosmatka, K.J., Oakes, T.R., Kroenke, C.D., Kohama, S.G.,
Matochik, J.A., Ingram, D.K., and Johnson, S.C. (2009). A population-average
MRI-based atlas collection of the rhesus macaque. Neuroimage 45, 52–59.
Moeller, S., Freiwald, W.A., and Tsao, D.Y. (2008). Patches with links: a unified
system for processing faces in the macaque temporal lobe. Science 320,
1355–1359.
Op de Beeck, H.P., Deutsch, J.A., Vanduffel, W., Kanwisher, N.G., and
DiCarlo, J.J. (2008). A stable topography of selectivity for unfamiliar shape
classes in monkey inferior temporal cortex. Cereb. Cortex 18, 1676–1694.
Polk, T.A., and Farah, M.J. (1995). Brain localization for arbitrary stimulus
categories: a simple account based on Hebbian learning. Proc. Natl. Acad.
Sci. USA 92, 12370–12373.
Price, C.J., Moore, C.J., and Friston, K.J. (1997). Subtractions, conjunctions,
and interactions in experimental design of activation studies. Hum. Brain
Mapp. 5, 264–272.
Rolls, E.T., and Tovee, M.J. (1995). The responses of single neurons in the
temporal visual cortical areas of the macaque when more than one stimulus
is present in the receptive field. Exp. Brain Res. 103, 409–420.
Saleem, K.S., and Logothetis, N. (2007). A Combined MRI and Histology Atlas
of the Rhesus Monkey Brain in Stereotaxic Coordinates (Burlington, MA:
Academic Press).
Sawamura, H., Georgieva, S., Vogels, R., Vanduffel, W., and Orban, G.A.
(2005). Using functional magnetic resonance imaging to assess adapta-
tion and size invariance of shape processing by humans and monkeys.
J. Neurosci. 25, 4294–4306.
Sereno, M.I., Dale, A.M., Reppas, J.B., Kwong, K.K., Belliveau, J.W., Brady,
T.J., Rosen, B.R., and Tootell, R.B. (1995). Borders of multiple visual areas
in humans revealed by functional magnetic resonance imaging. Science
268, 889–893.
Sohal, V.S., and Hasselmo, M.E. (2000). A model for experience-dependent
changes in the responses of inferotemporal neurons. Network 11, 169–190.
Srihasam, K., Sullivan, K., Savage, T., and Livingstone, M.S. (2010).
Noninvasive functional MRI in alert monkeys. Neuroimage 51, 267–273.
Sugita, Y. (2008). Face perception in monkeys reared with no exposure to
faces. Proc. Natl. Acad. Sci. USA 105, 394–398.
Tanaka, J.W., and Farah, M.J. (1993). Parts and wholes in face recognition.
Q. J. Exp. Psychol. A 46, 225–245.
Tootell, R.B., Silverman, M.S., De Valois, R.L., and Jacobs, G.H. (1983).
Functional organization of the second cortical visual area in primates.
Science 220, 737–739.
Tsao, D.Y., and Livingstone, M.S. (2008). Mechanisms of face perception.
Annu. Rev. Neurosci. 31, 411–437.
Tsao, D.Y., Freiwald, W.A., Knutsen, T.A., Mandeville, J.B., and Tootell, R.B.
(2003). Faces and objects in macaque cerebral cortex. Nat. Neurosci. 6,
989–995.
Tsao, D.Y., Freiwald, W.A., Tootell, R.B., and Livingstone, M.S. (2006). A
cortical region consisting entirely of face-selective cells. Science 311,
670–674.
Van der Loos, H., and Woolsey, T.A. (1973). Somatosensory cortex: structural
alterations following early injury to sense organs. Science 179, 395–398.
Vanduffel, W., Fize, D., Mandeville, J.B., Nelissen, K., Van Hecke, P., Rosen,
B.R., Tootell, R.B., and Orban, G.A. (2001). Visual motion processing investi-
gated using contrast agent-enhanced fMRI in awake behaving monkeys.
Neuron 32, 565–577.
Wiesel, T.N. (1982). Postnatal development of the visual cortex and the influ-
ence of environment. Nature 299, 583–591.
Wiesel, T.N., and Hubel, D.H. (1974). Ordered arrangement of orientation
columns in monkeys lacking visual experience. J. Comp. Neurol. 158,
307–318.
Yin, R. (1969). Looking at upside-down faces. J. Exp. Psychol. 81, 141–145.
Yovel, G., and Kanwisher, N. (2004). Face perception: domain specific, not
process specific. Neuron 44, 889–898.
Neuron 73, 608–619, February 9, 2012 ª2012 Elsevier Inc. 619