BEHAVIOR OF RC BEAMS SHEAR STRENGTHENED … · before strain gauges were bonded at three locations...
29
BEHAVIOR OF RC BEAMS SHEAR STRENGTHENED WITH BONDED OR UNBONDED FRP WRAPS J.G. Teng 1 , G.M. Chen 2 , J.F. Chen 3 , O.A. Rosenboom 4 , L. Lam 5 Abstract: RC beams shear strengthened with FRP fully wrapped around the member usually fail due to rupture of FRP, commonly preceded by gradual debonding of the FRP from the beam sides. To gain a better understanding of the shear resistance mechanism of such beams, particularly the interaction between the FRP, concrete and internal steel stirrups, nine beams were tested in the present study: three as control specimens, three with bonded FRP full wraps, and three with FRP full wraps left unbonded to the beam sides. The use of unbonded wraps was aimed at a reliable estimation of the FRP contribution to shear resistance of the beam and how bonding affects this contribution. The test results show that the bonded and unbonded FRP wraps have nearly the same shear strength contribution, and that their strain distributions along the critical shear crack are both close to parabolic at the ultimate state. FRP rupture of the strengthened beams occurred at a value of maximum FRP strain considerably lower than the rupture strain found from tensile tests of flat coupons, which may be attributed to the effects of the dynamic debonding process and deformation of the FRP wraps due to the relative movements between the two sides of the critical shear crack. Test results also suggest that while the internal steel stirrups are fully utilized at beam shear failure by FRP rupture, the contribution of the concrete to the shear capacity may be adversely affected at high values of tensile strain in FRP wraps. CE database subject headings: Shear resistance, fiber reinforced polymers, reinforced concrete, rehabilitation, retrofitting. 1 Chair Professor of Structural Engineering., Department of Civil and Structural Engineering, The Hong Kong Polytechnic University, Hong Kong, China (Corresponding author); Email: [email protected] 2 PhD Candidate, Department of Civil and Structural Engineering, The Hong Kong Polytechnic University, Hong Kong, China 3 Reader, Institute for Infrastructure and Environment, The University of Edinburgh, United Kingdom. 4 Research Associate, Department of Civil and Structural Engineering, The Hong Kong Polytechnic University, Hong Kong, China 5 Senior Research Fellow, Department of Civil and Structural Engineering, The Hong Kong Polytechnic University, Hong Kong, China 1 This is the Pre-Published Version.
Transcript of BEHAVIOR OF RC BEAMS SHEAR STRENGTHENED … · before strain gauges were bonded at three locations...
BEHAVIOR OF RC BEAMS SHEAR STRENGTHENED WITH BONDED OR UNBONDED FRP WRAPS
J.G. Teng1, G.M. Chen2, J.F. Chen3, O.A. Rosenboom4, L. Lam5
Abstract: RC beams shear strengthened with FRP fully wrapped around the member usually fail due to rupture of FRP, commonly preceded by gradual debonding of the FRP from the beam sides. To gain a better understanding of the shear resistance mechanism of such beams, particularly the interaction between the FRP, concrete and internal steel stirrups, nine beams were tested in the present study: three as control specimens, three with bonded FRP full wraps, and three with FRP full wraps left unbonded to the beam sides. The use of unbonded wraps was aimed at a reliable estimation of the FRP contribution to shear resistance of the beam and how bonding affects this contribution. The test results show that the bonded and unbonded FRP wraps have nearly the same shear strength contribution, and that their strain distributions along the critical shear crack are both close to parabolic at the ultimate state. FRP rupture of the strengthened beams occurred at a value of maximum FRP strain considerably lower than the rupture strain found from tensile tests of flat coupons, which may be attributed to the effects of the dynamic debonding process and deformation of the FRP wraps due to the relative movements between the two sides of the critical shear crack. Test results also suggest that while the internal steel stirrups are fully utilized at beam shear failure by FRP rupture, the contribution of the concrete to the shear capacity may be adversely affected at high values of tensile strain in FRP wraps. CE database subject headings: Shear resistance, fiber reinforced polymers, reinforced concrete, rehabilitation, retrofitting.
1 Chair Professor of Structural Engineering., Department of Civil and Structural Engineering, The Hong Kong Polytechnic University, Hong Kong, China (Corresponding author); Email: [email protected] 2 PhD Candidate, Department of Civil and Structural Engineering, The Hong Kong Polytechnic University, Hong Kong, China 3 Reader, Institute for Infrastructure and Environment, The University of Edinburgh, United Kingdom. 4 Research Associate, Department of Civil and Structural Engineering, The Hong Kong Polytechnic University, Hong Kong, China 5 Senior Research Fellow, Department of Civil and Structural Engineering, The Hong Kong Polytechnic University, Hong Kong, China
1
This is the Pre-Published Version.
INTRODUCTION
The technique of shear strengthening of reinforced concrete (RC) beams with FRP has been well established through many experimental studies (Teng et al. 2002). Simple and rational analytical models have also been proposed for use in design (e.g. Chen and Teng 2003a, b). However, significant work remains, in particular to quantify the interaction between the concrete, steel stirrups and FRP in contributing to the shear strength (Cao et al. 2005; Chen et al. 2006; Mohamed Ali et al. 2006). Three forms of shear strengthening are common: full wraps, U-jackets, or side strips. The term ‘strips’ is used herein as a generic term and can refer to either precured or wet lay-up FRP strengthening systems. Experiments have shown that nearly all fully wrapped beams fail by tensile rupture of FRP, and most U-jacketed beams fail by FRP debonding (Chen and Teng 2003b). By contrast, almost all beams strengthened using side strips fail by FRP debonding (Chen and Teng 2003a). Even in the FRP rupture failure mode, significant debonding of the FRP from the beam sides generally precedes failure. The FRP debonding failure mode may be taken as either an ultimate limit state or a severability limit state (Cao et al. 2005), but fully wrapped beams can possess significant residual load and deflection capacities following initial debonding of the most highly stressed FRP strip. The brittle nature of the FRP debonding or rupture failure mode may lead to a system where the yield strength of the internal steel stirrups is not realized prior to failure. This goes contrary to the methodology espoused in existing design models, where the concrete and internal steel contributions to shear strength are evaluated using provisions in existing design codes (e.g. Chaallal et al. 1998; Khalifa et al. 1998; Triantafillou 1998; Triantafillou and Antonopoulos 2000; Taljsten 2003; Chen and Teng 2003a, b). Mohamed Ali et al. (2006) developed a model to study the interaction between the FRP and the internal steel which assumes a linearly descending bond-slip relationship for the FRP-concrete interface. The model also assumes that there exists no bond between the internal steel stirrups and the concrete, a simplification which leads to inaccurate results when the stirrups are deformed bars (Chen et al. 2006). A recent numerical study has shown that for beams strengthened using either fully wrapped or U-jacketed configurations, the steel stirrups normally achieve yielding prior to FRP failure (Chen et al. 2006). The strains in the external FRP reinforcement are closely related to the width of the critical shear crack (Chen and Teng 2003b). As a result, for large beams the activation of the FRP system occurs only with the development of a wide shear crack (Denton et al. 2004). Since the development of such a crack is likely to lead to the loss of aggregate interlock along the critical shear crack, the contribution of the concrete to the shear strength of the FRP strengthened member could be substantially reduced below code specified values (Cao et al. 2005). However, for beams shear strengthened with FRP, the interaction between the concrete, internal steel and FRP contributions to shear strength has not been experimentally verified (Cao et al. 2005). This is a result of the difficulties in independently measuring the contributions of the concrete, steel stirrups, and FRP to the shear capacity. One of these difficulties is assessing the strain distribution in the FRP strips along the critical shear crack as the beam approaches failure, mainly due to the complex nature of the debonding process. For FRP wrapped beams, the FRP strips intersected by the critical shear crack achieve almost complete debonding from the beam sides before failure of the beam (Chen and Teng 2003b; Cao et al. 2005). Therefore, for research purposes, it is of interest to install FRP strips intentionally left unbonded from the beam sides. If the difference in shear contribution
2
between bonded and unbonded strips is found to be negligible at high load levels, the FRP contribution to shear strength can be well isolated at the ultimate state. Intentionally unbonded sides can also provide insight into the mechanism of FRP rupture for wrapped beams. Rounding of beam corners can reduce stress concentrations there, but the effect of curvature due to the corners may still cause the FRP rupture strain to fall considerably below that from flat coupon tests (Cao et al. 2005). Away from the corners and near the location of the critical shear crack, out-of-plane bending and in-plane transverse bending deformation of the strips as a result of sliding movements between the two sides of the critical shear crack may also result in a reduction in strength. Chen and Teng (2003b) proposed a reduction factor of 0.8 for considering these effects, but this reduction factor needs further support of experimental evidence. This paper presents the results of an experimental study to determine the interaction between the FRP, concrete and internal steel stirrups of an FRP strengthened beam in resisting shear. Focusing on the FRP rupture failure mode for wrapped members, an experimental program was designed using specimens with FRP either fully bonded or unbonded to the sides of the beam. Several conclusions can be drawn from the study, including that the contribution of the concrete to the shear strength of the system is reduced at high values of FRP strain, and that the FRP rupture strain used in design should be reduced to account for the effects of curvature at the corners and in-plane sliding deformations along the critical shear crack.
TEST PROGRAM Specimen design
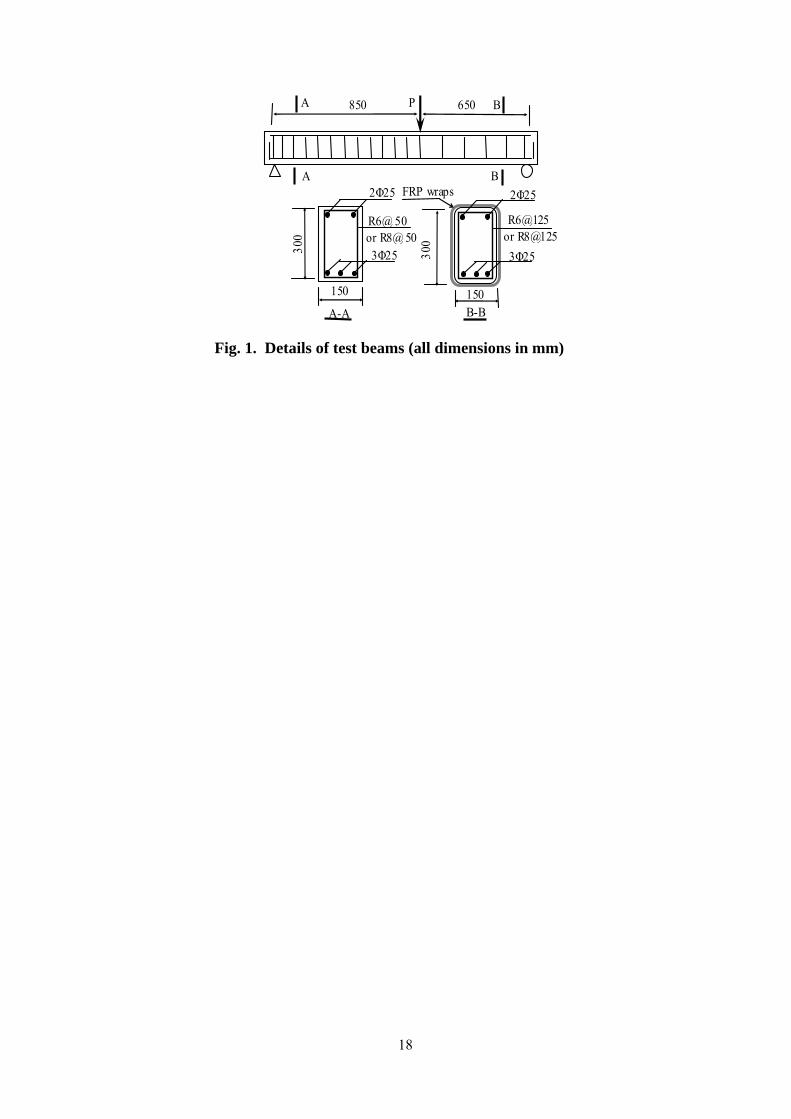
Nine simply supported beams were tested under three-point bending. The beams were 1.5 m long, 150 mm wide and 300 mm deep, with an effective depth of 260 mm (Fig. 1). To avoid flexural failure, they were all reinforced with three 25 mm diameter tension bars and two 25 mm diameter compression bars. Only the shorter shear span was designed as the test span for each specimen. The longer non-test span was shear reinforced with 6 or 8 mm diameter internal steel stirrups at 50 mm center to center spacing. In the test span, specimens CTL-00, UBF-00, UBF-00 were not shear reinforced, specimens CTL-R6, UBF-R6, BDF-R6 were shear reinforced with 6 mm steel stirrups, and specimens CTL-R8, UBF-R8, BDF-R8 with 8 mm steel stirrups both at a center to center spacing of 125 mm. Of the 9 specimens, 3 beams (series CTL) were tested as unstrengthened control beams and the other 6 beams (series UBF and BDF) as strengthened beams. The UBF and BDF beams were all strengthened by complete wrapping of CFRP strips with the same width (wfrp), thickness (tfrp) and center to center spacing (sfrp) within the test shear spans. The BDF series differs from the UBF series only in that the FRP wraps were bonded around the beam by epoxy resin in the former but were left un-bonded on the two sides of the beam in the latter (i.e. bonded only to the compression and tension faces and the corners). To prevent premature rupture of the CFRP strips, the beam corners in both series UBF and BDF were rounded with a radius of 25mm. All specimens were designed to have the same concrete strength and the same dimensions. Table 1 shows details of each specimen.
Test setup and procedure
The RC beams were cured for at least 28 days before being strengthened by wrapping wet lay-up FRP strips. For the UBF beams, a thin plastic film was used on the sides during installation to prevent bonding. The FRP strips were left for curing for at least two days
3
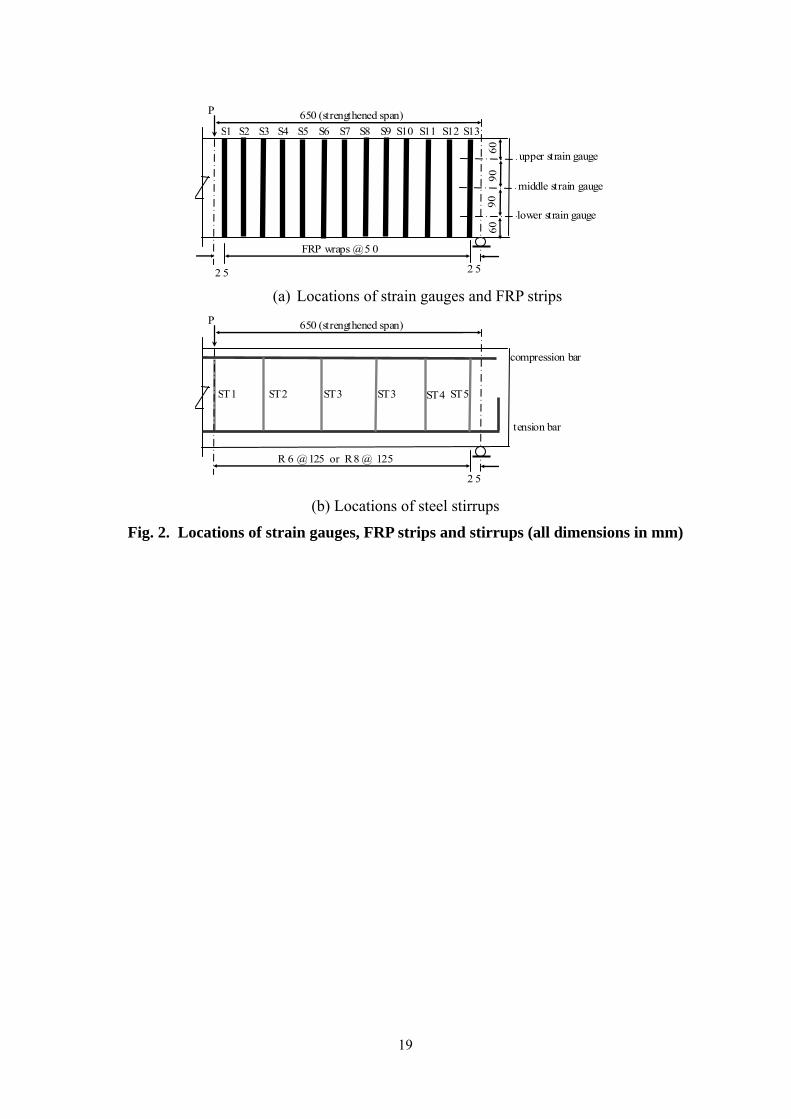
before strain gauges were bonded at three locations over the beam height (referred to as the upper, middle and lower gauges). The positions of the FRP strips, steel stirrups and strain gauges are shown in Fig. 2. Each specimen was cured for an additional one week prior to testing. All specimens were tested at a loading rate between 2 to 5 kN per minute.
Material tests
Three concrete cubes for each beam specimen were tested at the time when the beam specimen was tested. The average concrete cube compressive strength for each beam specimen is listed in Table 2. Also provided in Table 2 is the yield strength of the steel stirrups of each beam. The concrete compressive strength varies between the specimens though the mix design was the same. This difference was accounted for in the interpretation of the test results using a procedure given in Chen and Teng (2003b). Flat tensile coupon tests of the FRP material showed little variation between different specimens. The material behaved in a linear-elastic fashion with average values for elastic modulus, ultimate tensile strength and ultimate rupture strain of 26.6 GPa, 3970 MPa, and 15000 με respectively.
Failure process
The CTL series showed typical shear failures. Cracking started with the appearance of several fine flexural cracks in the maximum moment region, followed by a stage during which diagonal cracks appeared and propagated in the test span. When the load continued to increase, one of the diagonal cracks was widened into a critical diagonal crack, signifying the occurrence of shear failure. The shear force versus the loading point displacement curves (Fig. 3) indicate that the failure was brittle but some ductility existed because of the dowel action of the tensile reinforcement crossing the diagonal crack and steel stirrups in the case of beams CTL-R6 and CTL-R8. Beam CTL-R8 failed by concrete crushing near the loading point, so its failure was more brittle than beams CTL-00 and CTL-R6 (Fig. 3).
For the beams in series UBF and BDF, the failure modes are listed in Table 1. In each case the FRP wraps increased the load capacity, but generally decreased the ductility of the strengthened beam except for beams UBF-R8 and BDF-R8. Both beam CTL-R8 and beam UBF-R8 failed by concrete compression near the loading point, so their failure appears to be slightly more brittle than the other beams. Compared to the UBF beams, the BDF beams showed more ductility as FRP debonding before rupture resulted in less brittle post-peak behavior, as can be seen from Fig. 3. FRP STRAIN DEVELOPMENT
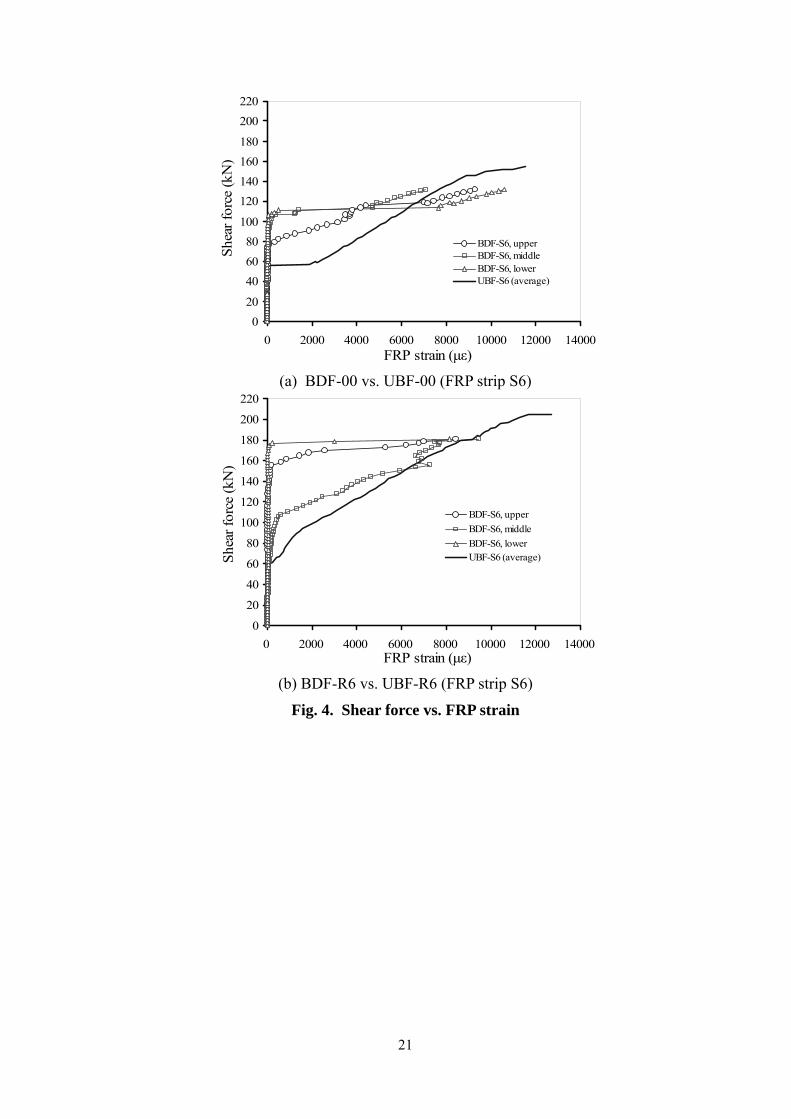
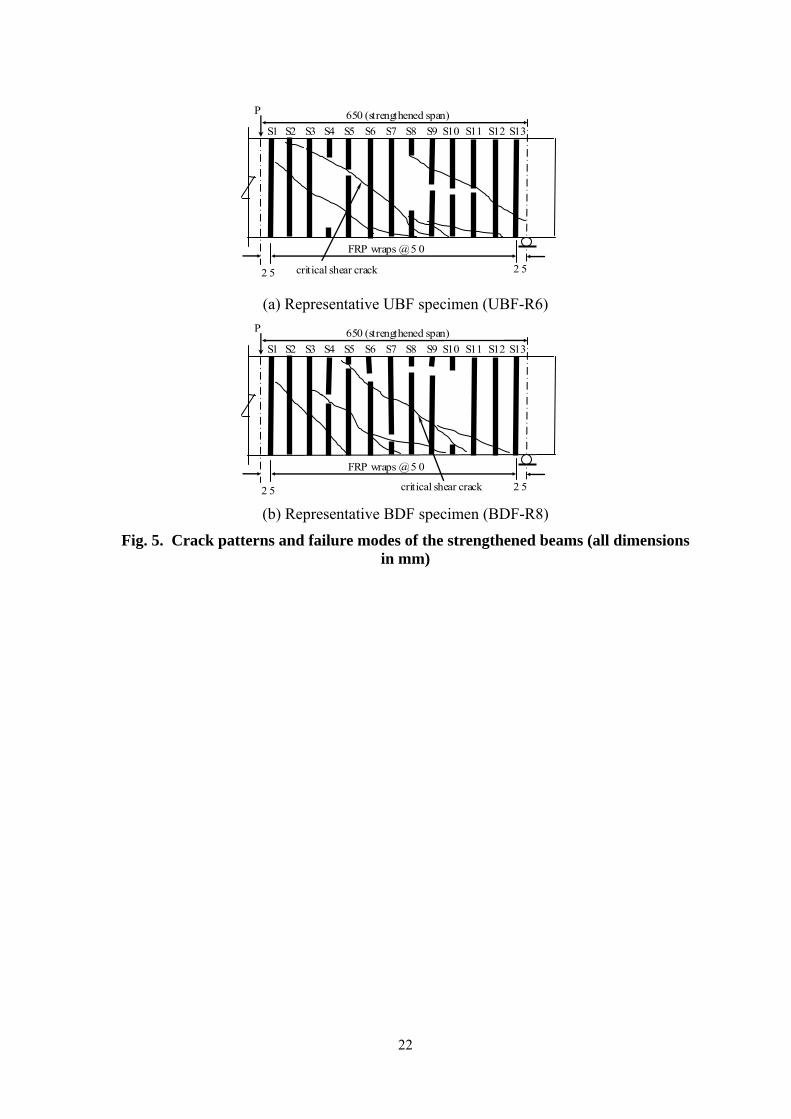
For all the strengthened beams, the strains in the FRP strips remained nearly zero before shear cracking in the test span, after which the strains noticeably increased (Fig. 4). After shear cracking, some significant differences exist between the UBF and the BDF beams (Fig. 4). For the UBF beams, the strain in many of the FRP strips increased gradually after shear cracking, whereas for the BDF beams more complex behavior occurred. First of all, the strains in only some locations of the FRP strips which were intersected by a crack showed obvious increases. Once FRP debonding propagated to positions away from the crack, the FRP strains at these locations would suddenly increase to a value nearly the same as that of the cracked position. The locations of the cracks at the ultimate state of representative beams of the UBF and BDF series are shown in Fig. 5. In Fig. 4 the influence of the steel stirrups is also apparent, with the FRP strains for the beams with no transverse steel increasing much more rapidly than those with steel stirrups after shear cracking. This is because the steel stirrups resist part of the shear force and restrain the opening of the shear cracks.
4
Another difference is that the maximum measured FRP strains in the UBF beams are generally larger than those in the corresponding BDF beams. Compared to the FRP rupture strain of 15000 με, the maximum FRP strains recorded (Table 3) are substantially lower. For the UBF beams, the average maximum strain is 11% less than that of the tensile tests. It should be noted that as the critical shear crack was inclined to the FRP strips, the opening-up and sliding movements of the two sides of the critical shear crack is expected to have exerted in-plane transverse bending action on the FRP strips, leading to transverse bending and out-of-plane bending deformation of the thin FRP strips. This phenomenon may be the cause for the reduction in the rupture strain of the FRP. For the BDF beams, the average maximum strain is 29% less. These results indicate that the debonding process between the FRP and concrete can adversely affect the rupture strain of the FRP. It has been proposed in Cao et al. (2005) that transient local bending may exist during debonding. This, along with the dynamic effects of the debonding process, may account for the greater reduction in the maximum measured strain in the bonded FRP. Further research is necessary to test these propositions. Clearly, if the effect of debonding process on the measured tensile strain is eliminated through the use of FRP unbonded to the sides of the beam, the reduction factor proposed in Chen and Teng (2003b) of 0.8 to be applied to the rupture strain of the FRP is conservative based on the limited experimental results presented here. STRAIN DISTRIBUTION IN AN FRP STRIP
To investigate the strain distribution in the FRP along the height of the beam, strains were measured at three different height levels (Fig. 2). Figure 6 shows the strain distributions along the height of the beam at different values of applied shear force for beams UBF-R6 and BDF-R6. Due to the limited space, only one representative FRP strip from the UBF beams and one from the BDF beams are shown here, while the following discussions are based on the strain distribution information of all the FRP strips. For the FRP strips of the UBF beams, the strains at the three height levels in the same FRP strip are nearly the same for nearly all load levels, which is the case regardless of the location of the FRP strip (Fig. 6a). This result is reasonable noting the fact that for the UBF beams, FRP strips were unbonded to the beam sides and the FRP internal forces at the three locations are theoretically the same if secondary effects are ignored. The small differences between the three strain readings within each FRP strip are likely a combination of measurement errors (e.g. the direction of the strain gauge may be a little skewed from the vertical direction at some locations) and bending of the FRP strip due to the relative movements between the two sides of the shear crack. In the BDF beams, the strain distribution along a strip is quite different (Fig. 6b). Since at low load levels the FRP strain at the location of the critical shear crack is much larger than the strains away from the crack, the location of the critical shear crack can be identified in Fig. 6b to be close to the location of the highest strain value (the exact location could be identified if many more strain gauges were bonded on each strip). When debonding propagates, the values of strains away from the shear crack increase rapidly, and the strain values in the debonded location become nearly the same (Fig. 6d). FRP rupture failure follows after an FRP strip has fully debonded over the height of the beam (Fig. 6d). STRAIN DISTRIBUTION IN FRP ALONG THE LONGITUDINAL AXIS
5

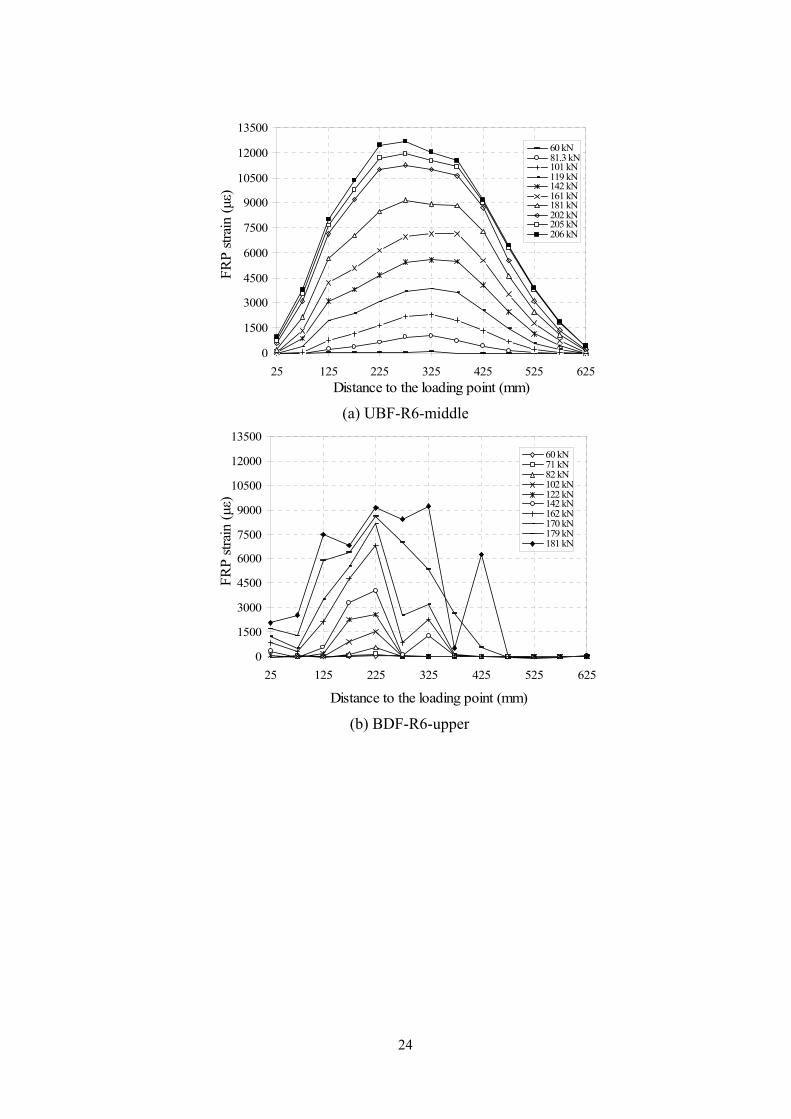
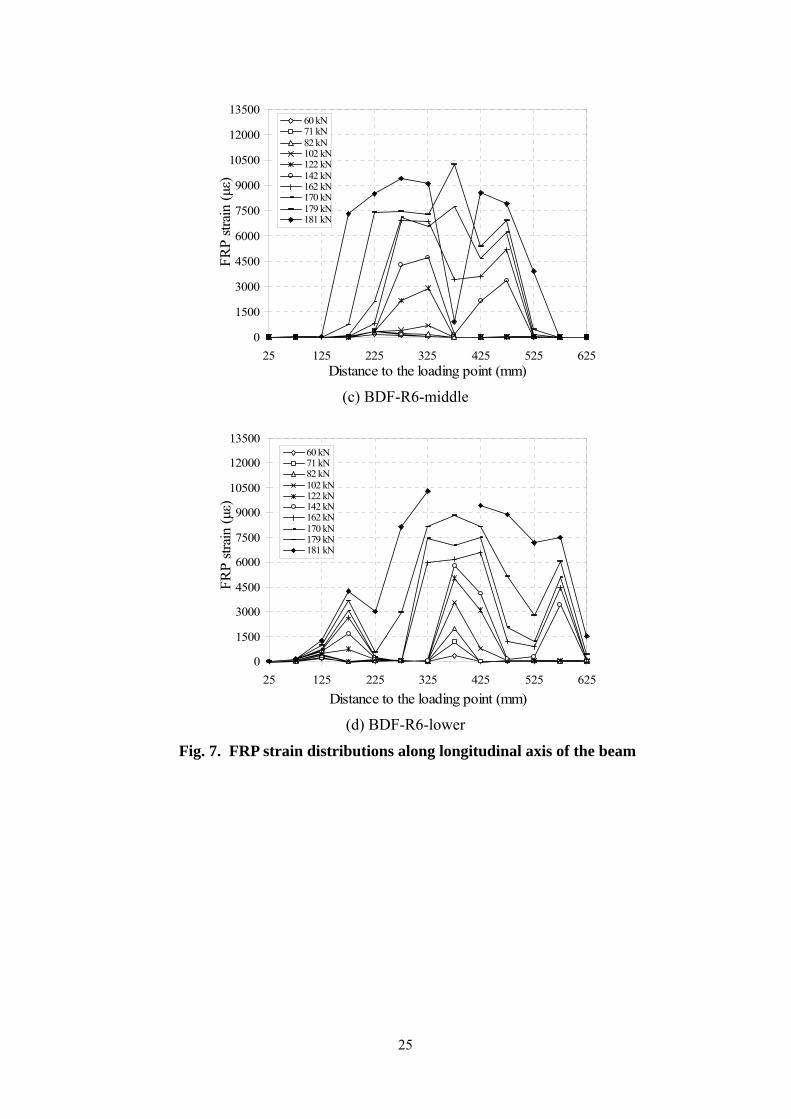
The strain distribution in the FRP along the longitudinal axis of the test span for different values of applied shear force is examined in Fig. 7. Due to limited space, only the distributions of beams UBF-R6 and BDF-R6 are shown, while the following discussion is based on the information from all of the beams. In the UBF beams, there is little variation among the strain values at the three height levels within one FRP strip, so the strain distribution along the longitudinal axis is nearly the same for the three height levels. A representative plot is shown in Fig. 7a. Before cracking the strain values are rather small and not shown in the figure. After cracking, the unbonded FRP strips have a quasi parabolic strain distribution along the longitudinal axis, with the highest value around the middle, and nearly zero values at the two ends of the test span. This is because the FRP strips near both ends are not normally intersected by any shear crack. For the BDF beams, the strain distributions are slightly different. At low load levels (but after cracking), there exist large variations in strain along the longitudinal axis, with strain values at the crack positions being the highest. After debonding of the FRP strips, the strain distribution changes to become nearly parabolic within part of the test span. Almost no strain was measured in the FRP strip close to the support at the upper strain gauge locations (Fig. 7b) and near the loading point at the lower gauge positions (Fig. 7d) because the FRP strips were not debonded at these locations. The debonding process damaged the strain gauges at several locations, so some of the strain values were not recorded for the ultimate state. STRAIN DISTRIBUTION IN FRP ALONG THE CRITICAL SHEAR CRACK The FRP contribution to the shear resistance of the beam is related to the product of the strain distribution factor and the maximum stress in the FRP as explained by Chen and Teng (2003a, 2003b). The strain distribution factor Dfrp is defined as the ratio of the average strain of the FRP strips intersected by the critical shear crack within the effective height to the maximum FRP strain in the same FRP strips at the considered load level. For beams strengthened with discrete FRP strips, it can be expressed as the average strain in all FRP strips divided by the maximum strain:
,
1
max
n
frp ii
frpDn
ε
ε==∑
(1)
where εfrp,i is the strain in the ith FRP strip, n is the total number of FRP strips intersected by the critical shear crack, and εmax is the maximum strain in these FRP strips.
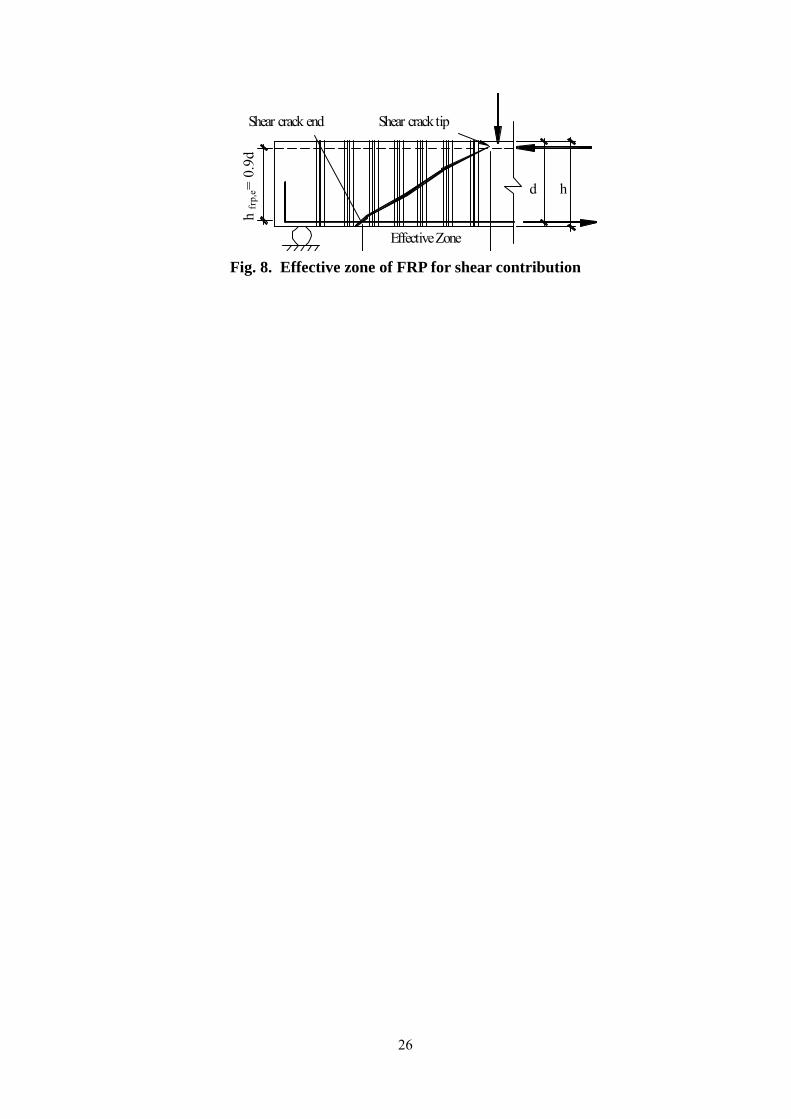
As in Chen and Teng (2003a, b), the effective height of FRP is defined as the height from the centroid of the tension reinforcement to the top of the crack which is assumed to be 0.1d below the top face of the beam as shown in Fig. 8. FRP strips outside this effective zone are excluded from the following analysis. For ease of reference, the intersection between the tensile reinforcement and the shear crack is referred to as the ‘crack end’ within the effective zone though the physical crack end is likely to be at the bottom of the beam. Similarly, the assumed top of the crack is referred to as the crack tip for the following analysis. The position of the actual crack tip changes as the load is increased, but the assumed crack tip is close to the actual position at both the debonding state and the ultimate state of FRP rupture. FRP strain distributions along the critical shear crack for UBF and BDF beams are shown in Fig. 9 at the ultimate state. The strains are shown against the normalized horizontal distance from the crack tip, which represents the distance from the crack tip estimated from
6
experimental measurements divided by the horizontal length of the critical shear crack. For the UBF beams, it is straightforward to find the strain values along the critical shear crack since the strain values in a single FRP strip are nearly the same along the height of the beam. For the BDF beams, the reading of the strain gauge at the location closest to the shear crack was used in the analysis, which is always the largest among the three recorded strain values within an FRP strip. The strain distribution obtained using this method is an approximation, since it is very likely that none of the three strain gauges was located close to the critical shear crack. To improve accuracy of the distribution, more strain gauges are needed, or pre-cracking (Cao et al. 2005) may be used to locate the position of the shear crack. Figure 9 shows that both the UBF and the BDF beams have a quasi-parabolic strain distribution along the critical shear crack, which is in line with the general assumption made by Chen and Teng (2003b) in their shear strength model for FRP rupture. It may be noted that Chen and Teng’s proposed design value of Dfrp=0.5, corresponding to either a linear strain distribution with the largest strain at the crack end or a bilinear strain distribution with a zero strain at both the crack end and tip, represents the lower limit of practical values. The maximum strain value appears nearly halfway along the horizontal distance of the critical shear crack for the beam with no stirrups (Fig. 9a), and closer to the crack end for beams with weak stirrups (R6@125 mm) (Fig. 9b). For beam UBF-R8 (Fig. 9c) local concrete compression failure near the crack tip led to the increased values of FRP strain at this location. This indicates that the steel stirrups have a significant effect on the distribution of FRP strain along the critical shear crack for both the UBF beams and the BDF beams. Figure 9 also shows that the maximum FRP strains of the UBF beams are larger than those of the corresponding BDF beams as mentioned already (see also Table 3). Another aspect worth noting is that for both the UBF and BDF beams, the strains in the FRP wraps are not zero at the crack tip of the critical shear crack, which is not in line with the assumption made by Chen and Teng (2003b) in their shear strength model for FRP rupture. This may be attributed to three factors: the secondary cracks around the location of the critical shear crack tip (Fig. 5) and the large horizontal compressive strains in the concrete near the crack tip which lead to significant vertical tensile strains there. It is also possible that the actual crack tip might be higher than the assumed position of 0.1d below the compression face. Neglecting these effects as in the method of Chen and Teng (2003b) is conservative in evaluating the shear contribution of the FRP wraps. FRP CONTRIBUTION TO SHEAR RESISTANCE
The ultimate shear capacity of an RC beam strengthened with FRP (Vu) may be written as: Vu = Vc + Vs + Vfrp (2) where Vc , Vs and Vfrp are, respectively, the shear contributions from the concrete, steel stirrups, and FRP. Vfrp was calculated using two different methods in this study. The first method is according to a procedure outlined in Chen and Teng (2003b):
frp
efrpfrpfrpefrpfrp s
hwtfV
ββθ sin)cot(cot2 ,
,
+= (3)
where tfrp is the thickness of FRP, wfrp is the width of the FRP strips (perpendicular to fiber orientation), β is the angle of fibers in the FRP measured from the longitudinal axis of the beam, θ is the inclination angle of the critical shear crack with respect to the longitudinal axis, sfrp is the spacing of the FRP strips measured along the beam longitudinal axis, and hfrp,e is the effective height of the FRP on the sides of the beam as shown in Fig. 8, and ffrp,e is the
7
effective stress in the FRP intersected by a shear crack at the ultimate state which can be written as: ,,frp e frp frp e frp frpf E E D maxε ε= = (4) where εfrp,e is the effective strain in the FRP at the ultimate state, Efrp is the modulus of elasticity of the FRP, and εmax and Dfrp are defined in Eq. 1. For vertical FRP wraps, Eq. (3) can be simplified by substituting β=90° into it:
θtan
9.02 ,frp
frpfrpefrpfrp sdwtfV = (5)
To calculate the contribution of the FRP to the shear capacity of the strengthened beam, the strain distribution factor Dfrp must first be found. To minimize the effect of small fluctuations in the experimental data and for the purpose of generality, a parabolic function was adopted to represent the strain distribution by regression analysis of the discrete strain values. The fitted curves for beam sides A and B were averaged and used to determine the average and maximum strain values. They were then used to calculate the strain distribution factor Dfrp following Cao et al. (2005). The fitted parabolic curves at the ultimate state are shown along with the raw data in Fig. 9. The calculated strain distribution factors are listed in Table 3. Also shown in Table 3 are the angles of the critical shear crack θ from experimental observations, which were used in Eq. 5 to calculate Vfrp. The second method used to calculate Vfrp is the direct summation of the shear resistance of the FRP strips intersected by the critical diagonal crack. The maximum strain reading among the three in each FRP strip measured at the ultimate state of the strengthened beam was taken as the strain in each strip when performing this calculation. Vfrp determined using both methods are shown in Table 3. The combined experimental shear resistance of concrete and stirrups Vc +Vs was determined from the experimental results of the control beam. It was taken as the shear resistance of the control beam at the deflection corresponding to the ultimate load of the strengthened beam. The value of Vc +Vs was then modified to account for the small variations in concrete strength between the control beams and the corresponding strengthened beams following the procedure given in Chen and Teng (2003a) and the corrected results are listed in Table 3. This exercise could not be completed for beams UBF-R8 and BDF-R8 because of the brittle failure of the control beam CTL-R8 due to local concrete compression failure. Using the above two methods, the shear resistance of the section Vu can be calculated using Eq. (2). For the four strengthened beams under examination which failed due to FRP rupture, the values of FRP contribution to the shear resistance found from method 1 are very slightly larger than the experimentally measured values with a maximum difference of 4.2% (Table 3). The values from method 2 are in turn very slightly higher than those from method 1, and exceed the test values by up to 8.3%. These limited results indicate that both methods may be used to deduce reliable values of the FRP contribution to shear resistance in experimental investigations. It is seen from Table 3 that the FRP contribution to shear resistance is larger in the UBF beams than in the BDF beams for the four specimens which failed due to FRP rupture (UBF-00, BDF-00, UBF-R6 and BDF-R6), consistent with the earlier observation that the FRP strains in UBF beams are larger than those in BDF beams at the ultimate state.
8
SHEAR INTERACTION BETWEEN FRP WRAPS AND CONCRETE
A unique benefit derived from the testing of beams with FRP wraps unbonded to the sides is that the contribution of FRP to shear resistance can be reliably estimated using the measured FRP strains. If it is assumed that the number of FRP strips intersected by the critical shear crack remains unchanged after the appearance of the critical shear crack, Vfrp can be calculated at each load level using Eqs (1) and (3). The maximum of the three FRP strain values recorded by the three gauges in each FRP strip was used for calculating Vfrp. The sum of the shear contributions of the concrete and the steel, Vc +Vs, can then be deduced by subtracting Vfrp from the applied value of shear force recorded during testing. The Vfrp versus displacement curves obtained using this method are shown in Fig. 10 along with the deduced Vc+Vs curves. For comparison, the Vc+Vs curves of the corresponding control beams are also shown, which have been modified to account for the difference in concrete strength (Chen and Teng 2003a). Figure 10 shows that corresponding to the ultimate state of the control beam (Point A in the figures), the Vc+Vs value of the FRP wrapped beam is always smaller than that of the corresponding control beam. This difference is likely due to inaccuracies in assessing the shear resistance contribution from the FRP Vfrp at low levels of shear force.
Figure 11 shows the applied shear force versus the strains in the internal steel stirrups for the beams with R6 and R8 stirrups. It shows that at the ultimate load of each beam, the values of strains in the steel stirrups have reached the yielding strain (denoted by a vertical dashed line) as determined from material testing summarized in Table 2. Therefore, at the ultimate state, Vs of both the UBF and the CTL beams with identical stirrups can be regarded as the same. Since the internal steel has yielded, from Fig. 10 it may be concluded that some adverse shear interaction between Vfrp and Vc exists for an RC beam strengthened with FRP wraps near the ultimate state of the strengthened section. Given the large strain values corresponding to FRP rupture as shown in Table 3, and assuming one critical shear crack, the maximum crack width at failure could be large enough to compromise several of the concrete’s shear-resisting mechanisms such as dowel action, aggregate interlock, or shear friction along the shear crack. As a result, at the ultimate state, Vc of an RC beam strengthened with FRP wraps is less than that of a normal RC beam. As shown in Fig. 10, at the ultimate state of the FRP wrapped beams, the shear resistances of the control beams Vc+Vs have already reached their ultimate state and are decreasing, or were not recorded due to brittle failure. There is a reduction of 22.5% for beam CTL-00 and 5.4% for beam CTL-R6. Beam CTL-R8 failed at a displacement level less than that of the corresponding FRP wrapped beam, but if a comparison is made with the calculated value of Vc+Vs for UBF-R8, the reduction is 2.1%. Although these values cannot be used for design, they illustrate a phenomenon which should be examined more closely in future research. In order to prevent the loss of concrete shear contribution at high levels of loading, the strain in the FRP shear strengthening system should be kept below appropriate limits. A value of Vfrp for each strengthened beam corresponding to the maximum value of Vc + Vs for the respective control beam is shown as point A in Fig. 10. Beyond this point, the effectiveness of the concrete in resisting shear could be reduced. Using Eqs. (1) and (4) the effective value of FRP strain was determined at this point and is shown in Table 4. The value of effective FRP strain decreases as the amount of internal steel increases, but this is due to the concrete crushing failure mode for beams UBF-R8. The average value of effective FRP strain using
9

this analysis is 4900 με which is slightly higher than the value of 4000 με recommended in ACI-440.2R (2008) as the maximum value of FRP strain to prevent the loss of aggregate interlock. However, it should be emphasized here that the shear capacity can significantly increase when the FRP strain increases further as shown in Fig. 10. Therefore, this is not the strain which the authors would recommend to be used as a limit for design as this can significantly limit the potential of FRP for shear strengthening. CONCLUSIONS
The following conclusions can be drawn from the above analysis of the test results of RC beams with full FRP wraps: 1. The beams with FRP intentionally left unbonded on the sides (UBF) provided at least the
same shear contribution as the beams with side bonded FRP (BDF).
2. The FRP used in both the BDF and UBF beams reduced the ductility of the shear failure of beams. The BDF beams showed more ductility than the UBF beams, with the debonding of the FRP giving some useful warning of the impending failure.
3. The strain values in FRP showed a noticeable increase only after the appearance of the shear crack crossing the FRP wraps, before which the strains remained at a rather lower level. For the UBF beams, the FRP strain showed little variation over the height of beam during the loading process, while for the BDF beams, only those positions crossed by shear cracks had high FRP strains, and strain values decreased quickly away from the cracked positions.
4. The average maximum recorded values of FRP strain for the UBF and the BDF beams are respectively 11.3% and 28.7% lower than the values measured during flat tensile tests. This may be due to such factors as the dynamic nature of the debonding process, and out-of-plane bending and in-plane transverse bending of the FRP strips due to the relative movements between the two sides of the critical shear crack.
5. The strain distributions in the FRP along the critical shear crack had a quasi parabolic shape for the UBF and BDF beams which were heavily reinforced in flexure.
6. The UBF beams had a similar FRP strain distribution factor to but a larger maximum FRP strain than that of the BDF beams, so the FRP in the former made a greater shear contribution than in the latter. This can explain why a beam strengthened with side unbonded FRP wraps has a higher shear capacity than that strengthened with side bonded FRP wraps, if all other parameters are the same.
7. For the FRP strengthened beams, some adverse shear interaction between the shear contribution of FRP and that of the concrete was observed due to the larger crack width at the ultimate state. The value of effective FRP strain, at a point where the concrete contribution to shear strength was at its maximum in these test beams, was around 4900 με, which is slightly higher than the value recommended in ACI-440.2R (2008).
ACKNOWLEDGEMENTS
The authors are grateful for the financial support received from the Research Grants Council of the Hong Kong SAR (Project No: PolyU 5151/03E) and The Hong Kong Polytechnic University provided (Project code: BBZH). The authors also wish to thank Ms. Maggie Fung and Mr Simon Morton for their valuable contribution to the experimental work.
10

REFERENCES
ACI 440.2R (2008). Guide for the Design and Construction of Externally Bonded FRP Systems for Strengthening Concrete Structures, ACI Committee 440, America Concrete Institute, Farmington Hills, MI, USA.
Cao, S.Y, Chen, J.F., Teng, J.G., Hao, Z. and Chen, J. (2005). “Debonding in RC beams shear-strengthened with complete FRP wraps”, Journal of Composites for Constructions, ASCE, Vol. 9, No.5, pp. 417-428.
Chaallal, O., Nollet, M. J. and Perraton, D. (1998). “Strengthening of reinforced concrete beams with externally bonded fiber-reinforced-plastic plates: design guidelines for shear and flexure”. Canadian Journal of Civil Engineering, Vol. 25, No. 4, pp. 692-704.
Chen, J.F. and Teng, J.G. (2003a). “Shear capacity of FRP-strengthened RC beams: FRP debonding”. Construction and Building Materials, Vol. 17, No.1, pp. 27-41.
Chen, J.F. and Teng, J.G. (2003b). “Shear capacity of fiber-reinforced polymer-strengthened reinforced concrete beams: fibre reinforced polymer rupture”. Journal of Structural Engineering, ASCE, Vol. 129, No. 5, pp. 615-625.
Chen, J.F., Chen, G.M. and Teng, J.G. (2006). “Shear resistance of FRP-strengthened RC beams: interaction between steel stirrups and external FRP strips,” Proceedings of the ACUN-5, Conference on Developments in Composites: Advanced, Infrastructural, Natural, and Nano-composites, Sri Bandyopadhyay et al., eds, UNSW, Sydney, Australia, July 11-14, pp. 143-150.
Denton, S.R., Shave, J.D. and Porter, A.D. (2004). “Shear strengthening of reinforced concrete structures using FRP composites”, Proceedings, Second International Conference on Advanced Polymer Composites for Structural Applications in Construction, L. C. Hollaway, M. K. Chryssanthopoulos and S. S. J. Moy, eds, Woodhead Publishing Limited, Abington Cambridge U.K., pp. 134-143.
Khalifa, A., Gold, W.J., Nanni, A. and Aziz M.I., A. (1998). “Contribution of externally bonded FRP to shear capacity of RC flexural members”. Journal of Composites for Construction, ASCE, Vol. 2, No. 4, pp. 195-202.
Mohamed Ali, M.S., Oehlers, D.J. and Seracino, R. (2006). “Vertical shear interaction model between external FRP transverse plates and internal steel stirrups,” Engineering Structures, Vol. 28, No. 3, pp. 381-389.
Teng, J.G., Chen, J.F., Simth, S.T., and Lam, L. (2002). FRP-strengthened RC Structures, John Wiley & Sons, UK.
Triantafillou, T.C. (1998). “Shear strengthening of reinforced concrete beams using epoxy-bonded FRP composites”. ACI Structural Journal, Vol. 95, No. 2, pp. 107-115.
Triantafillou, T.C. and Antonopoulos, C.P. (2000). “Design of concrete flexural members strengthened in shear with FRP”, Journal of Composites for Construction, ASCE, Vol. 4, No. 4, pp. 198-205.
Taljsten, B. (2003). “Strengthening concrete beams for shear with CFRP sheets”, Construction and Building Materials, Vol. 17, No. 1, pp. 15-26.
11

LIST OF TABLES
Table 1. Details and failure modes of beam specimens Table 2. Strengths of concrete and steel Table 3. Calculated and experimental results of test beams Table 4. FRP strains for UBF beams at point A
12
13
LIST OF FIGURES
Fig. 1. Details of test beams (all dimensions in mm) Fig. 2. Locations of strain gauges, FRP strips and stirrups (all dimensions in mm) Fig. 3. Shear force vs. displacement of loading point Fig. 4. Shear force vs. FRP strain Fig. 5. Crack patterns and failure modes of the strengthened beams (all dimensions in mm) Fig. 6. FRP strain distributions along height of the beam Fig. 7. FRP strain distributions along longitudinal axis of the beam Fig. 8. Effective zone of FRP for shear contribution Fig. 9. FRP strain distributions along the critical shear crack Fig. 10. Shear contribution comparison Fig. 11. Steel stirrup strain comparison

14
Table 1. Details and failure modes of beam specimens
Beam designation CTL-00 CTL-R6 CTL-R8 UBF-00 UBF-R6 UBF-R8 BDF-00 BDF-R6 BDF-R8
tfrp (mm) N/A 0.11 wfrp (mm) N/A 20
FRP wraps
sfrp (mm) N/A 50 Test span N/A R6@125 R8@125 N/A R6@125 R8@125 N/A R6@125 R8@125 Steel stirrups
Non-test span R6@50 R6@50 R8@50 R6@50 R6@50 R8@50 R6@50 R6@50 R8@50 Failure load P (kN) 141 212 253 273 363 350 233 319 377
Failure mode and remarks
shear failure
shear failure
compressionfailure near the loading
point
shear failure by FRPrupture
shear failure by FRPrupture
compressionfailure near the loading
point
shear failure by FRPrupture
shear failure by FRPrupture
Shear failure by FRP rupture

15
Table 2. Strengths of concrete and steel
Beam designation
CTL -00
CTL -R6
CTL -R8
UBF -00
UBF -R6
UBF -R8
BDF -00
BDF -R6
BDF -R8
fcu (MPa) 43.3 45.8 45.6 47.0 47.4 45.9 53.8 50.6 45.4 fy (MPa) N/A 271.0 342.2 N/A 271.0 342.2 N/A 271.0 342.2
fcu: cube compressive strength of concrete; fy: yield strength of stirrups

16
Table 3. Calculated and experimental results of test beams
Method 1 Method 2 Beam εmax
(με) εfrp,e(με)
Dfrp θ Degree
Vtest(kN)
Vc + Vs (kN) Vfrp (kN) Vu (kN) Dif (%) * Vfrp (kN) Vu (kN) Dif (%) *
CTL-00 36 79.7 -- -- -- -- -- -- -- UBF-00 13500 11100 0.83 32 154.7 63.4 97.5 160.9 3.99 104.2 167.6 8.32 BDF-00 10700 8960 0.84 35 132.1 66.5 71.2 137.7 4.21 71.4 137.9 4.36 CTL-R6 37 119.9 -- -- -- -- -- -- -- UBF-R6 13900 11300 0.82 35 205.5 119.4 88.4 207.8 1.10 92.6 212.0 3.15 BDF-R6 10700 8370 0.78 34 180.9 119.5 67.8 187.3 3.55 68.4 187.9 3.88 CTL-R8 40 143.3 -- -- -- -- -- -- -- UBF-R8 13800 8600 0.62 35 198.3 ‡ 58.4 -- -- 60.4 -- -- BDF-R8 10900 10200 0.93 41 213.6 ‡ 64.0 -- -- 71.3 -- --
*
‡ Due to the brittle nature of the failure of CTL-R8, this could not be determined from experimental results.
%100×=test
testn
VV −V
Dif

Table 4. FRP strains for UBF beams at point A
Beam Side maxε
(με) efrp,ε
(με) frpD
sideA 8290 5620 0.68 UBF-00 sideB 7190 5240 0.73
sideA 6480 4630 0.72 UBF-R6 sideB 7320 5580 0.76
sideA 6830 4050 0.59 UBF-R8 sideB 6410 4300 0.67
17
150 15030
0
300
2Φ25 2Φ25
3Φ25 3Φ25or R8@ 50 or R8@125
R6@125
FRP wrapsA B
A-A B-B
R6@ 50
PA B650850
Fig. 1. Details of test beams (all dimensions in mm)
18
FRP wraps @ 5 0
2 5 2 5
650 (strengthened span)P
60
90
90
60
upper strain gauge
middle strain gauge
lower strain gauge
S1 S2 S3 S4 S5 S6 S7 S8 S9 S10 S11 S12 S13
(a) Locations of strain gauges and FRP strips
R 6 @ 125 or R 8 @ 125
2 5
650 (strengthened span)P
ST1 ST2 ST3 ST3 ST4 ST5
compression bar
tension bar
(b) Locations of steel stirrups
Fig. 2. Locations of strain gauges, FRP strips and stirrups (all dimensions in mm)
19

020406080
100120140160180200220
0 2 4 6 8 10 12 14 1Displacement of loading point (mm)
Shea
r for
ce (k
N)
6
CTL-00UBF-00BDF-00
(a) Beams with no shear reinforcement
020406080
100120140160180200220
0 2 4 6 8 10 12 14 16Displacement of loading point (mm)
Shea
r for
ce (k
N)
CTL-R6UBD-R6BDF-R6
(b) Beams with R6 stirrups
020406080
100120140160180200220
0 2 4 6 8 10 12 14 1Dispacement of loading point (mm)
Shea
r for
ce (k
N)
6
CTL-R8UBF-R8BDF-R8
(c) Beams with R8 stirrups
Fig. 3. Shear force vs. displacement of loading point
20
020
406080
100
120140160180
200220
0 2000 4000 6000 8000 10000 12000 14000FRP strain (με)
Shea
r for
ce (k
N)
BDF-S6, upperBDF-S6, middleBDF-S6, lowerUBF-S6 (average)
(a) BDF-00 vs. UBF-00 (FRP strip S6)
0
20
40
60
80
100
120
140
160
180
200
220
0 2000 4000 6000 8000 10000 12000 14000FRP strain (με)
Shea
r for
ce (k
N)
BDF-S6, upperBDF-S6, middleBDF-S6, lowerUBF-S6 (average)
(b) BDF-R6 vs. UBF-R6 (FRP strip S6)
Fig. 4. Shear force vs. FRP strain
21
critical shear crack
FRP wraps @ 5 0
2 5 2 5
650 (strengthened span)P
S1 S2 S3 S4 S5 S6 S7 S8 S9 S10 S11 S12 S13
(a) Representative UBF specimen (UBF-R6)
FRP wraps @ 5 0
2 5 2 5
650 (strengthened span)P
S1 S2 S3 S4 S5 S6 S7 S8 S9 S10 S11 S12 S13
critical shear crack
(b) Representative BDF specimen (BDF-R8)
Fig. 5. Crack patterns and failure modes of the strengthened beams (all dimensions in mm)
22

30
60
90
120
150
180
210
240
270
0 2500 5000 7500 10000 12500FRP strain (με)
Dist
ance
to b
eam
bot
tom
(mm
)
60 kN81.3 kN
101 kN119 kN
142 kN161 kN181 kN
202 kN205 kN
206 kN
(a) UBF-R6-Strip S5
30
60
90
120
150
180
210
240
270
0 2500 5000 7500 10000 12500FRP strain (με)
Dist
ance
to b
eam
bot
tom
(mm
)
60 kN
71 kN
82 kN102 kN
122 kN
142 kN
162 kN
170 kN179 kN
181 kN
(b) BDF-R6- Strip S6
Fig. 6. FRP strain distributions along height of the beam
23
0
1500
3000
4500
6000
7500
9000
10500
12000
13500
25 125 225 325 425 525 625Distance to the loading point (mm)
FRP
strai
n (με)
60 kN81.3 kN101 kN119 kN142 kN161 kN181 kN202 kN205 kN206 kN
(a) UBF-R6-middle
0
1500
3000
4500
6000
7500
9000
10500
12000
13500
25 125 225 325 425 525 625
Distance to the loading point (mm)
FRP
strai
n (με)
60 kN
71 kN82 kN102 kN122 kN142 kN162 kN170 kN179 kN181 kN
(b) BDF-R6-upper
24
0
1500
3000
4500
6000
7500
9000
10500
12000
13500
25 125 225 325 425 525 625Distance to the loading point (mm)
FRP
strai
n (με)
60 kN71 kN82 kN102 kN122 kN142 kN162 kN170 kN179 kN181 kN
(c) BDF-R6-middle
0
1500
3000
4500
6000
7500
9000
10500
12000
13500
25 125 225 325 425 525 625Distance to the loading point (mm)
FRP
strai
n (με)
60 kN71 kN82 kN102 kN122 kN142 kN162 kN170 kN179 kN181 kN
(d) BDF-R6-lower
Fig. 7. FRP strain distributions along longitudinal axis of the beam
25
Effective Zone
Shear crack tip
d h
Shear crack end
h fr
p,e=
0.9
d
Fig. 8. Effective zone of FRP for shear contribution
26

0
2000
4000
6000
8000
10000
12000
14000
16000
0 0.1 0.2 0.3 0.4 0.5 0.6 0.7 0.8 0.9 1Normalized distance from crack tip (mm)
FRP
strai
n (με)
UBF-00,side AUBF-00,side BBDF-00,side ABDF-00,side B
(a) UBF-00 vs. BDF-00
0
2000
4000
6000
8000
10000
12000
14000
16000
0 0.1 0.2 0.3 0.4 0.5 0.6 0.7 0.8 0.9 1Normalized distance from crack tip (mm)
FRP
strai
n (με)
UBF-R6,side AUBF-R6,side BBDF-R6,side ABDF-R6,side B
(b) UBF-R6 vs. BDF-R6
0
2000
4000
6000
8000
10000
12000
14000
16000
0 0.1 0.2 0.3 0.4 0.5 0.6 0.7 0.8 0.9 1Normalized distance from crack tip (mm)
FRP
strai
n (με)
UBF-R8,side AUBF-R8,side BBDF-R8,side ABDF-R8,side B
(c) UBF-R8 vs. BDF-R8
Fig. 9. FRP strain distributions along the critical shear crack
27

020406080
100120140160180200220
0 1 2 3 4 5 6 7 8 9 10 11 12 13Deflection at loading point (mm)
Shea
r for
ce (k
N)
CTL-00 (Vc+Vs)UBF-00 (Vf)UBF-00 (Vc+Vs)UBF-00 (Vc+Vs+Vf)
A
(a) UBF-00 vs. CTL-00
020406080
100120140160180200220
0 1 2 3 4 5 6 7 8 9 10 11 12 13Deflection at the loading point (mm)
Shea
r for
ce (k
N)
CTL-R6 (Vc+Vs)UBF-R6 (Vf)UBF-R6 (Vc+Vs)UBF-R6 (Vc+Vs+Vf)
A
(b) UBF-R6 vs. CTL-R6
020406080
100120140160180200220
0 1 2 3 4 5 6 7 8 9 10 11 12 13Deflection at loading point (mm)
Shea
r for
ce (k
N)
-
CTL-R8 (Vc+Vs)UBF-R8 (Vf)UBF-R8 (Vc+Vs)UBF-R8 (Vc+Vs+Vf)
A
(c) UBF-R8 vs. CTL-R8
Fig. 10. Shear contribution comparison
28

0
40
80
120
160
200
240
0 500 1000 1500 2000Stirrup strain (με)
Shea
r for
ce (k
N)
CTL-R6, ST4CTL-R6, ST5UBF-R6, ST3UBF-R6, ST4UBF-R6, ST5
Stirrup yield strain
Fig. 11. Steel stirrup strain in UBF-R6 and CTL-R6
29
![Strengthening Defected Dam Gates under Cavitation ...jast.modares.ac.ir/article-15-25449-fa.pdf · bonded FRP [7] Failure mode analyses of reinforced concrete beams strengthened in](https://static.fdocuments.us/doc/165x107/5fb90a783ac73e670e3ab52f/strengthening-defected-dam-gates-under-cavitation-jast-bonded-frp-7-failure.jpg)


![Strengthening Defected Dam Gates under Cavitation ...journals.modares.ac.ir/article-15-25449-fa.pdf · bonded FRP [7] Failure mode analyses of reinforced concrete beams strengthened](https://static.fdocuments.us/doc/165x107/5fb90acd0c818f6d767fedcb/strengthening-defected-dam-gates-under-cavitation-bonded-frp-7-failure-mode.jpg)