Behavior of organic gelatin/phenolic micro balloon composite...
13
Indian Journal of Engineering & Materials Sciences Vol. 22, December 2015, pp. 618-630 Behavior of organic gelatin/phenolic micro balloon composite under compressive loading, static and low velocity impact S Sathiya Naarayan*, J Dhayanidhi, B Nagarajappa, Yathish Vorkady & Satish Chandra Structural Technologies Division, National Aerospace Laboratories, Bangalore 560017, India Received 1 December 2014; accepted 2 July 2015 The physical properties like density/porosity, stress-strain behavior and energy absorption of organic gelatin/phenolic micro balloon (PMB) composite is studied with respect to its water content and content of phenolic micro balloon. Quasi static compression tests and low velocity impact (LVI) tests are conducted on the gelatin/PMB composite samples with three different gelatin to water ratios (by weight) 1G:2W, 1G:3W and 1G:4W and four PMB contents 0%, 2.5%, 5% and 10% of the combined gelatin-water weight. The stress-strain behavior of the composite is studied through quasi-static compression tests at different loading rates. Low velocity impact tests are conducted to check the energy absorption of specimens and high speed videos of the impact tests were acquired to analyze the behavior of gelatin/PMB composite. The stress-strain tests show that the stiffness of the composite is dependent on both PMB and water content and that the behavior of composite is strain rate dependent or viscoelastic. The high speed imaging of the LVI tests conform with the energy absorption calculations that gelatin’s energy absorption capability increases with increase in the water content as the lateral spread (and consequently the vertical compression of the composite samples) increases with water content. Further the stiffness of the composite increases with the increase of PMB content and reduction of water content. It is also found that 1G:4W composite with 0% PMB content absorbs the maximum energy and he nce is ideal for energy absorption purpose. Keywords: Gelatin, Phenolic microballoons, Energy absorption, Low velocity impact Gelatin consists of fibrous protein extracted from the skin, bones and organs of animals. Gelatin mixed with water in certain proportions, has been known to replicate the behavior of human tissue and has been used for a long time as a tissue simulant. Preparation of gelatin as a tissue simulant involves a detailed procedure in which hot water is mixed with gelatin in certain proportions along with other ingredients and cured in a specific way. There are plenty of literature for the preparation of gelatin as a tissue simulant 1-3 in which various ways of preparation of gelatin is enumerated. They have suggested different proportions of water to gelatin. Commonly there are two accepted ways of preparation of gelatin. The 20% solution gelatin (also called as NATO gelatin), i.e. gelatin and water in the ratio of 1G:4W by volume and the 10% solution gelatin (also known as Fackler gelatin), i.e., gelatin and water in the ratio of 1G:9W by volume 3 . A mixture of gelatin and water along with a porosity inducing agent like phenolic micro balloon has been used as bird simulant in the aircraft industry. The density of birds is less than water (0.90-0.95 g/cm 3 ) because of internal cavities, pneumatic bones and air sacs. To simulate a bird, therefore a porosity inducing agent like phenolic micro balloon is added to gelatin and water. Porous gelatin was studied by several researchers 4,5 with its properties similar to water in respect of the density and Hugoniot constant as a substitute for bird with its internal cavities, pneumatic bones and air sacs. The increase of porosity of the gelatin results in reduction in shock pressures similar to that of bird. Various studies in the field of composites have shown that presence of hollow micro spheres in matrix toughens the material, decreases density and is good in impact situations because of their capability to reduce impact forces 6,7 . The presence of hollow glass microspheres in epoxy resin composites has resulted in reduction of impact force. So there are implications for possible use of gelatin-PMB composite as an energy absorbent for low velocity impacts. Most of the studies in gelatin-PMB composite 4,5 were carried out at very high velocities of impact for the purpose of simulating the impact of bird during a bird hit on a speeding flying object and hence there is no detailed study on the energy absorption characteristics of gelatin-PMB-water —————— *Corresponding author (E-mail: [email protected])
Transcript of Behavior of organic gelatin/phenolic micro balloon composite...

Indian Journal of Engineering & Materials Sciences Vol. 22, December 2015, pp. 618-630
Behavior of organic gelatin/phenolic micro balloon composite under compressive loading, static and low velocity impact
S Sathiya Naarayan*, J Dhayanidhi, B Nagarajappa, Yathish Vorkady & Satish Chandra Structural Technologies Division, National Aerospace Laboratories, Bangalore 560017, India
Received 1 December 2014; accepted 2 July 2015
The physical properties like density/porosity, stress-strain behavior and energy absorption of organic gelatin/phenolic micro balloon (PMB) composite is studied with respect to its water content and content of phenolic micro balloon. Quasi static compression tests and low velocity impact (LVI) tests are conducted on the gelatin/PMB composite samples with three different gelatin to water ratios (by weight) 1G:2W, 1G:3W and 1G:4W and four PMB contents 0%, 2.5%, 5% and 10% of the combined gelatin-water weight. The stress-strain behavior of the composite is studied through quasi-static compression tests at different loading rates. Low velocity impact tests are conducted to check the energy absorption of specimens and high speed videos of the impact tests were acquired to analyze the behavior of gelatin/PMB composite. The stress-strain tests show that the stiffness of the composite is dependent on both PMB and water content and that the behavior of composite is strain rate dependent or viscoelastic. The high speed imaging of the LVI tests conform with the energy absorption calculations that gelatin’s energy absorption capability increases with increase in the water content as the lateral spread (and consequently the vertical compression of the composite samples) increases with water content. Further the stiffness of the composite increases with the increase of PMB content and reduction of water content. It is also found that 1G:4W composite with 0% PMB content absorbs the maximum energy and he nce is ideal for energy absorption purpose.
Keywords: Gelatin, Phenolic microballoons, Energy absorption, Low velocity impact
Gelatin consists of fibrous protein extracted from the skin, bones and organs of animals. Gelatin mixed with water in certain proportions, has been known to replicate the behavior of human tissue and has been used for a long time as a tissue simulant. Preparation of gelatin as a tissue simulant involves a detailed procedure in which hot water is mixed with gelatin in certain proportions along with other ingredients and cured in a specific way. There are plenty of literature for the preparation of gelatin as a tissue simulant1-3 in which various ways of preparation of gelatin is enumerated. They have suggested different proportions of water to gelatin. Commonly there are two accepted ways of preparation of gelatin. The 20% solution gelatin (also called as NATO gelatin), i.e. gelatin and water in the ratio of 1G:4W by volume and the 10% solution gelatin (also known as Fackler gelatin), i.e., gelatin and water in the ratio of 1G:9W by volume3.
A mixture of gelatin and water along with a porosity inducing agent like phenolic micro balloon has been used as bird simulant in the aircraft industry. The density of birds is less than water (0.90-0.95
g/cm3) because of internal cavities, pneumatic bones and air sacs. To simulate a bird, therefore a porosity inducing agent like phenolic micro balloon is added to gelatin and water.
Porous gelatin was studied by several researchers4,5 with its properties similar to water in respect of the density and Hugoniot constant as a substitute for bird with its internal cavities, pneumatic bones and air sacs. The increase of porosity of the gelatin results in reduction in shock pressures similar to that of bird.
Various studies in the field of composites have shown that presence of hollow micro spheres in matrix toughens the material, decreases density and is good in impact situations because of their capability to reduce impact forces6,7. The presence of hollow glass microspheres in epoxy resin composites has resulted in reduction of impact force. So there are implications for possible use of gelatin-PMB composite as an energy absorbent for low velocity impacts. Most of the studies in gelatin-PMB composite4,5 were carried out at very high velocities of impact for the purpose of simulating the impact of bird during a bird hit on a speeding flying object and hence there is no detailed study on the energy absorption characteristics of gelatin-PMB-water
—————— *Corresponding author (E-mail: [email protected])

NAARAYAN et al: BEHAVIOR OF ORGANIC GELATIN/PHENOLIC MICRO BALLOON COMPOSITE
619
mixture with respect to its constituents at low velocities.
Broadly, the loading rates in the material characterization tests on soft materials like tissues and gels can be classified as quasi static and dynamic. Most of the quasi static tests on soft materials like gels and tissues involve compressive loading3,8-12. Tensile testing of soft materials pose a challenge because of the difficulty involved in gripping of very soft specimens13.Compressive quasi static tests of gelatin3,8-12 at different strain rates show viscoelastic behavior. But most of these tests show results for gelatin with fixed ratio between gelatin to water and a detailed test program where the strain rate sensitivity (or viscoelasticity) of gelatin/PMB composite solution with respect to its constituents doesn’t exist. In this work, the strain rate sensitivity of gelatin/PMB composite is studied with respect to its constituents by conducting compressive stress strain tests in a UTM at different strain rates in the quasistatic range.
The dynamic tests are usually conducted using a Kolsky bar (also called Split Hopkinson bar). The test consists of mainly compressive9-11,14 and shear loading15. The thickness of the specimen for a stress-strain test is of utmost importance and is usually kept very low for maintaining dynamic equilibrium. This is in contrast to the case when the energy absorption is to be measured instead of the material characteristics like stress strain response. The increased thickness of the sample is more useful for measuring energy absorption where the material behaves more like a structure than as a stress strain sample16. A low velocity impact test using a drop tower with a considerably stiff moving mass or crosshead along with a suitable sensor (like a piezoresistive accelerometer or a displacement measurement device) would be suitable therefore for measuring the energy absorption in a thick gelatin sample. In the present study, low velocity impact tests are conducted by dropping a fixed rigid mass (rigid relative to gelatin) with an accelerometer from a determined height (for getting constant velocity)on thick gelatin samples with varying proportions of water, gelatin and PMB for the purpose of measuring the energy absorption.
The behavior of gelatin varies with the velocity regimes. At higher velocities (above 60 m/s) it behaves more like a fluid and the analysis of gelatin at high velocities is carried out using the Lagrangian, Eulerian or the SPH methods17-19. Experimental work on the behavior of ballistic gelatin in this regime with
applications related to forensic science has been carried out by several researchers20-22. At lower velocities and quasistatic rate of loading the behavior of gelatin can be described through hyperelastic models3,9,10,12. This work focuses on the quasistatic behavior and the energy absorption characteristics of gelatin/PMB composite at a low velocity (Vi ~ 4.5m/s)) with respect to its constituents. Experimental Procedure
Quasistatic and LVI tests were carried out to obtain the properties of the gelatin/PMB composite with respect to its water content. Three different gelatin to water contents by weight (1G:2W, 1G:3W and 1G:4W) samples were prepared and tested. Similarly to test the property of the composite with respect to porosity (PMB content), the composite samples with different gelatin to water ratios with four different PMB contents by weight (0%, 2.5%, 5% and 10% of the combined weight of gelatin and water) were prepared and tested. Method of preparation and specimen geometry consideration
Preparation and conditioning of ballistic gelatine is known to play a strong role in the mechanical response of ballistic gelatin1,23 and therefore a consistent procedure was adopted for the preparation of the gelatin/PMB composite to make any valid observation. Food grade gelatin powder of Bloom number 120, pH value of 5.4 and particle mesh size pass of #10 was used for the tests. The gelatin was procured from Nitta Gelatin India Ltd. The porosity in organic gelatin was induced by adding phenolic micro balloon (PMB) (BJO-0930), lightweight filler which is reddish brown in color. The properties of PMB are given in Table 1. The PMB was procured from Malayan Adhesives. When added to resin, it displaces resin with air creating a thick low density compound.
Table 1—Properties of phenolic micro balloon
Properties PMB (BJO-0930) Appearance and odor: Reddish-brown powder,
odorless Average hydrostatic compressive strength (MPa)
2.4
Liquid density (liquid displacement) (g/cm3)
0.21 - 0.25
Average bulk density (g/cm3) 0.104 max Moisture content (%) < 4 Particle size (µm) 5-127 Floatation in toluene dupanol solution (%)
> 90

INDIAN J ENG. MATER. SCI., DECEMBER 2015
620
The procedure for preparation of the gelatin/PMB composite samples is briefly described as: (i) The water in quantity required was heated below
boiling temperature (75oC) and the PMB powder was added slowly to the water and stirred continuously.
(ii) The required quantity of gelatin was measured and added to the solution of PMB and water slowly and stirred continuously to avoid lump formation.
(iii) The gelatin mixture was poured in tubes (moulds) and the mixture was cured for 24 h in controlled temperature (22C) in an air-conditioned room.
(iv) The cast samples were removed carefully from the tubes and tested immediately.
Gelatin/PMB composite specimens of cylindrical shape with diameter of 40 mm were prepared for the stress strain tests and 100 mm diameter for the low velocity impact tests. The height to diameter ratio for both the UTM tests and the low velocity impact tests was 1.0:1.0. The specimen radius for the stress strain tests was decided based on the limitations of the platen dimensions of the UTM. A larger height or thickness of the gelatin for the LVI tests was chosen for the purpose of ensuring maximum energy absorption during the first impact. A larger thickness will allow for maximum interaction time between the impactor and the gelatin which will ensure reduction of the kinetic energy of the impactor. The high aspect ratio of 1:1 ensures that no buckling of the sample takes place during the tests.
Density/porosity Density measurement was made using the UX
series (UX420H) electronic balance which uses the Archimedean displacement principle with the medium as water. Small pieces from different samples were cut out and placed in upper pan without immersing it in the glass of water to get the dry weight, later the same was immersed in the glass of water for a very short time to get the suspended weight. The difference of the above two reading gives the volume of the sample. The bulk density was calculated as the ratio of dry weight to the volume of the sample. The average density was arrived from the five samples of gelatin/PMB composite. The percentage of volume porosity induced in the gelatin as a result of adding PMB is calculated by the following equation4,5.
1001%Porosity0
b
… (1)
where ρb is the bulk density of the sample and ρ0 is the density of gelatin sample with no PMB (with 0% porosity), also called the solid material density. Quasi static stress strain tests on gelatin/PMB composite specimens at different strain rates
The samples were tested at four different rate of loading of 1.67e-5m/s, 1.67e-4m/s, 1.67e-3m/s and 0.015 m/s and the engineering stress and strain were plotted. The rate of loading corresponds to strain rates of 4.175e-4/s,4.175e-3/s, 4.175e-2/s and 0.375/s. The tests were conducted on 5 kN UTM machine from Tinius Olsen. Lubricating oil was applied to the top and bottom surfaces of the sample to prevent barreling. Figure 1 shows a gelatin/PMB composite sample subjected to test in the UTM. The diameter of the cylindrical specimens was 40 mm. The height of the cylinder was same as the diameter. Three samples were tested for each case. The samples were tested up to a maximum compression of 32 mm or an engineering strain of 0.8. The speed accuracy for the machine is within 0.05% ensuring the accuracy in strain measurement within 62.5 microns. The samples were tested within 1-3 min immediately after it is taken from the air-conditioned room for the last three velocities. For the first rate of loading, this rule cannot be followed as the duration of testing exceeds this period of 3 min. Since the ambient temperature is generally higher than that of the air-conditioned room which may lead to the decrease in the compliance of the gelatin. Hence the stress-strain results for the first rate of loading are expected to be in the conservative side. The curves are plotted till the onset of instability (stress strain curve bending downward) or till the maximum engineering strain of 0.80 was reached without instability.
Fig. 1—Gelatine/PMB composite sample subjected to stress-strain test in UTM

NAARAYAN et al: BEHAVIOR OF ORGANIC GELATIN/PHENOLIC MICRO BALLOON COMPOSITE
621
Low velocity impact tests on gelatin/PMB composite specimens
The LVI tests are carried out on gelatin/PMB composites to check the energy absorption of the composite and its dependence on the water content and PMB content. The set-up for the LVI tests is shown in Fig. 2. It consists of a 2 m high, guided 2 column drop tower which can drop a mass from a maximum height of 2 m. A constant mass (cross head) of 18.8 kg was dropped on all the gelatin/PMB composite samples. The cross head consists of a flat steel plate which glides through the two guide columns through lubricated bearings. The impactor which is part of the cross head is a circular steel disc attached below the flat steel plate. The impactor impacts the test samples which are placed on the base plate made of steel. The drop is achieved through a manual quick release mechanism. High Speed Camera from IDT Vision, Redlake, USA was used to capture the impact event. The frame rate used was 4000/s. The image analysis was conducted using Image Pro software. For the measurement of velocity of the impactor and the lateral/vertical displacements of the composite, the optics were calibrated using the dimensions of the load cell and the gelatin respectively as shown in Fig. 2. Two Piezoresistive Accelerometers from Measurement Specialties, France were placed on the mount to measure the acceleration of the mount. One of the accelerometer was placed near the center of the plate and the other on the right of the center (as shown in Fig. 2). As the modulus of steel is certain orders of magnitude higher than that of gelatin, it is assumed that the impactor is rigid and hence the accelerometer results can be integrated to obtain velocities of the mount. The mount was dropped
from a fixed drop height of 1.40 m from the bottom of the circular disc to the top of the specimen which corresponds to a theoretical drop velocity of 5.24 m/s. The actual velocity is lesser because of the friction due to travel in the guided columns. The samples were taken out from the air conditioned room just before the tests and were impacted within 1-3 min after they were taken out from the room. Since high intensity lighting is required for high speed imaging, a slight increase in temperature results may result in the decrease of compliance of the gelatin/PMB composite, the results (estimated energy absorption) obtained can be considered to be on the higher side. Results and Discussion Density/porosity
Density/porosity variation with phenolic micro balloon content Figure 3 shows the variation of average
density/porosity with PMB and water content. The density decreases with increase in PMB content and since the maximum standard deviation difference between any two cases is well within the differences between the average densities, this trend is very clear. The correlation coefficient between the density (in g/cm3) and PMB % is calculated for different water contents. The correlation coefficient between PMB % and density data points for 1G:2W, 1G:3W and 1G:4W composite specimens are -0.981 (20 points),-0.933 (20 points) and -0.987 (20 points) respectively. The negative sign of the correlation coefficient suggests that the density decreases with increase in PMB content and as the coefficients are almost equal to unity; there is a linear relationship between the PMB % and the density. This is corroborated with studies conducted by other researchers24 for other materials like foam. Figure 3 also shows the variation of porosity in dimensionless units with PMB content and water content. The correlation coefficient between PMB% and porosity data points for 1G:2W, 1G:3W and 1G:4W composite specimens are 0.983 (20 points), 0.935 (20 points), and 0.988(20 points) respectively. The correlation coefficient is positive suggesting that the average porosity increases with PMB content as observed in the Fig. 3. The maximum standard deviation difference between any two successive cases is well within the difference between the average porosities for all the cases (except for the1G:3W with 5% and 10%) and since the correlation coefficients are almost
Fig. 2—Set-up for the low velocity impact test

INDIAN J ENG. MATER. SCI., DECEMBER 2015
622
equal to unity there is a strong linear relationship between the porosity and the PMB content. Based on the above two observations, a linear function of the form shown in Eq. (2) is fitted between density/porosity and the PMB % content for various water contents.
PMBmCP … (2) where P is either density (g/cm3) or porosity (%), C is the density/porosity at 0% PMB and m is the slope of curve signifying the rate of increase of density/porosity with PMB %. Tables 2 and 3 show the value of m and C for the density and porosity variation, respectively. The fitting was achieved through MATLAB software. The coefficient of determination (R2) for the fit is also shown in Tables 2 and 3. Since the coefficient of determination (R2) values are near unity, the formula in Tables 2 and 3 are reliable within the range of PMB content and can be used to determine the density/porosity within the range with a reasonable accuracy.
Density/porosity variation with respect to water content The average density is plotted with respect to water
ratio and PMB in Fig. 3. There is no clear relationship between the density/porosity and water content for particular PMB content.
Stress-strain Specimens after compression at low strain rates
At higher strain rates (0.375/s), when compressed to engineering strain of 0.8, the specimens (1G:2W 1G:3W and 1G:4W) did not fail. At lower strain rate (4.2e-3/s), when compressed up to engineering strain of 0.8, the specimens failed and the stress strain curves showed instability with the curve bending downwards. Figure 4 show one of the sample (1G:4W sample with 0% PMB) tested at low strain rate. This phenomenon of failing at lower strain rates and strengthening at higher strain rates is similar to the behavior observed by previous researchers11 where
Table 2—Results of linear fit between density and PMB%
C(g/cm3) m(g/cm3/PMB) Coefficient of determination (R2)/number
1G:2W 1.0825 -0.0301 0.9625/20 pts 1G:3W 1.0694 -0.0331 0.8808/20 pts 1G:4W 1.0673 -0.0250 0.9746/20 pts
Table 3—Results of linear fit between porosity% and PMB%
C(%) m (porosity/PMB) Coefficient of determination (R2)/number
1G:2W 0.783 2.76 0.9681/20 pts 1G:3W 0.613 3.07 0.8851/20 pts 1G:4W 0.179 2.33 0.9762/20 pts
Fig. 3—Variation of density/porosity of gelatin/PMB composite with water content and PMB

NAARAYAN et al: BEHAVIOR OF ORGANIC GELATIN/PHENOLIC MICRO BALLOON COMPOSITE
623
the difference in the failure stresses is high between low and high strain rate tests. Effect of strain rate on gelatine with different water contents
Figures 5(a)-(c) show the selected representative engineering stress-strain curves of the composite at different strain rates for the three different water content (1G:2W, 1G:3W and 1G:4W ) samples with different PMB contents. The observations on these figures hold for almost all the remaining curves for different PMB and water content and are therefore representative. The curves are obtained by averaging three stress strain curves for the same strain rate, PMB and gelatine/water ratio. The curves are plotted till the onset of instability or till the maximum engineering strain of 0.80 is reached without instability. It is observed from the stress-strain curves that the curve with the lowest strain rate is the most compliant. The small increase in stiffness due to strain rate can be attributed to the fact that the strain rates are in the quasi-static regime. Similar behavior was observed in ballistic gelatin9,11 where the stress-strain behavior was strain rate dependent. The strain rate dependence was more pronounced in the two references9,11 for ballistic gelatin since comparison was made between the quasi static regime (<0.01/s) and the intermediate/high strain rate regimes (>100/s). In the present case as the comparison is made between strain rates in the quasi static regime (< 0.375/s), the strain rate effect in terms of the stiffness increase is not pronounced even though apparent. The high or dramatic difference in stiffness due to change in strain rate from quasi static to intermediate/high strain rates are attributed to nonlinear viscous effects like shear thickening12,15. As the strain rate in the present study
Fig. 4—Damaged specimen at strain rate of 4.2e-3/s for 1.0G: 4.0W with 0% PMB
Fig. 5—Quasistatic stress-strain curves for (a)1G:2W composite sample with 0% PMB, (b) 1G:3W composite sample with 2.5% PMB and (c) 1G:4W composite samples with 5% PMB

INDIAN J ENG. MATER. SCI., DECEMBER 2015
624
is limited to the quasi static regime, the smaller stiffness change can be attributed to linear viscous effects like linear viscoelasticity though a detailed study through modeling of these results is required to confirm it. It is also observed that the load up to which the failure or instability occurs increases with increase in strain rate.
Effect of water content on the stress-strain curves of Gelatin at the same strain rate
Figure 6a shows the representative engineering stress-engineering strain curves for different water contents for the same PMB content of 10%. The curves are obtained by averaging three curves for the same strain rate, PMB and gelatin/water ratio. It is clear that the stress strain curves stiffen with decrease in water content for all the cases. The same trend was observed in all the remaining tests.
Effect of PMB content on the stress-strain curves Figure 6b show the effect of PMB content on the
engineering stress-engineering strain tests for
different strain rates for the 1G:3W composite samples. The curves are obtained by averaging three curves for the same strain rate, PMB and gelatin/water ratio. It is observed that increasing the PMB content increases the stiffness of the composite. This observation holds strongly for the higher PMB contents of 2.5%, 5% and 10% for the remaining tests. For all the strain rates it was observed that the 10% PMB content gelatin/PMB composite is the stiffest. It is also observed that for the lower PMB contents (0% and 2.5% PMB); the stress-strain curves tend to be exponential in shape with the stress increasing exponentially with strain and for the higher PMB contents, stress-strain relationship tend to become more linear. Low velocity impact (LVI) test
The test program for the LVI tests consisted of 60 tests with five trials for each composite sample as shown in Table 4. The velocity before the impact was calculated using image processing of the high speed
Table 4—Experimental data and analysis for the LVI tests
Gelatin/PMB composite specimen
Average initial velocity, Vi (m/s) (STDev)
Average velocity change ΔVav (m/s) (STDev)
Average change in initial kinetic energy (J)
Displacement for first impact (δav mm) (STDev)
0% 4.46(±0.035) -7.29(±0.11) 188.52 77.2 (±2.32) 2.5% 4.47(±0.031) -6.97(±0.073) 189.03 72.48 (±0.56) 5% 4.43(±0.047) -6.80(±0.10) 185.84 68.3 (±1.13)
1G:2W
10% 4.44(±0.042) -6.44(±0.017) 186.51 63.1 (±1.83) 0% 4.46(±0.031) -6.88(±0.14) 187.01 92.21 (±2.26)
2.5% 4.50(±0.057) -6.72(±0.091) 191.25 79.84 (±1.22) 5% 4.50(±0.047) -6.34(±0.048) 191.41 75.2 (±0.78)
1G:3W
10% 4.42(±0.034) -5.94(±0.050) 184.83 74 (±1.37) 0% 4.45(±0.066) -5.15(±0.05) 187.37 93.2(±0.78)
2.5% 4.51(±0.052) -5.52(±0.12) 192.44 91.2 (±2.61) 5% 4.51(±0.10) -5.76(±0.06) 192.67 81.92(±0.73)
1G:4W
10% 4.47(0.022) -6.08(±0.05) 189.03 75.85(±2.01)
Fig. 6—(a) Quasistatic stress-strain curves for 10% PMB composite samples at different water contents for strain rate of 4.2e-4/s and (b) stress-strain curves for 1G:3W composite samples at different PMB content for strain rate of 4.2e-3/s

NAARAYAN et al: BEHAVIOR OF ORGANIC GELATIN/PHENOLIC MICRO BALLOON COMPOSITE
625
videos as described in the experimental procedure. Table 4 also gives the details of the tests like the average initial velocities, the average initial kinetic energies, average maximum displacement in the first impact and the average change in velocity of the first impact.
Influence of water content on the compression of gelatin in the LVI tests
Figure 7 (a-f) shows the sequence of images obtained from high speed photography done at 4000 frames per second of the compression of gelatin/PMB composite with gelatin to water ratios of 1G:2W and 1G: 4W till the time of maximum compression of the composite during the first impact.
It is clear from the images of 1G:2W at 7 ms and 1G:4W at 7.82 ms that there is an initial bulge on top of the specimen when the mount comes in contact with the gelatin. The presence of a bulge suggests that the gelatin/PMB composite is not uniformly compressed during the impact and that during the initial phase, only the top part of the specimen undergoes compression and the bulge is due to the resultant lateral deformation due to the Poisson’s ratio effect. This phenomenon is due to dynamic non-equilibrium12,16, caused due to the presence of unequal stresses between the two ends of the gelatin/PMB composite specimen and is not preferred during a stress-strain test but is of no consequence for energy absorption calculation. This phenomenon occurs for thicker and soft specimens when subjected to higher
rates of loading16. The presence of the bulge for a longer time in the higher water content gelatin/PMB composite can be explained by the fact that the presence of water content makes the gelatin more flexible and soft resulting in dynamic non-equilibrium.
It is observed from Figures 7(c) and 7(f) that the lateral deformation of the 1G:4W specimen is more than 1G:2W specimen. The lateral spread is shown by a white line (21 ms for 1G:2W and 23.5 ms for 1G:4W). The lateral deformation of 1G:4W specimen goes beyond the diameter of cross head whereas for the 1G:2W specimen is well within the diameter of the cross head. Since the lateral deformation is related to the vertical deformation for a soft, incompressible material like gelatin, the larger spread of the composite laterally can be explained through larger vertical compression. Using image analysis software, the estimate of lateral deformation of the 1G:2W and 1G:4W sample was 206 mm and 390 mm. Since it would be difficult to measure the thickness (or length) of the 1G:4W sample at maximum deflection (as the thickness or length is very less), the lateral deflection is measured. Even if errors due to calibration and measurement errors were accounted for, a nearly 100% change in the lateral deflection due to change in water content clearly establishes the larger lateral deformation (and hence a larger vertical deformation) of a higher water content sample. Larger vertical deformation has implications for larger energy absorption.
Fig. 7—High speed images of impact of 1G:2W composite (top 7(a)-7(c)) and 1G:4W composite (bottom 7(d)-7(f)) with 0% PMB

INDIAN J ENG. MATER. SCI., DECEMBER 2015
626
Influence of PMB on the deformation of gelatin/PMB composite Figure 8 (a-c) shows the images obtained from high
speed photography done at 4000 frames per second of the compression of gelatin/PMB composite with gelatin to water ratios of 1G:4W with varying PMB content of 2.5%, 5% and 10% respectively at the time the impactor reaches static equilibrium. It is observed for 1G:4W composite sample that the impactor finds equilibrium after the first impact at around 51 ms for the 1G:4W specimen of 2.5% PMB and 5% PMB. Both the specimens attain their maximum deflection near 25.5 ms and then later there is regaining of shape due to elasticity at 51 ms but no real separation between the gelatin and the impactor. The specimen with 5% PMB content (Fig. 8b) shows more elasticity than the specimen with 2.5% PMB (Fig. 8c) as the return displacement (due to regaining) is higher for the 5% specimen. Using the image processing software the estimate of the final length of the 2.5% and 5% PMB specimen is 26.7 mm and 37 mm suggesting a higher return displacement for the 5% PMB sample. The bottom figures show that the specimen with 10% PMB finds equilibrium at 292.5 ms. This is much higher than the one for 2.5%PMB and 5% PMB. This can be explained by the fact that there is a separation of the impactor with the specimen (suggesting an even higher return displacement for the 10% PMB composite specimen due to more stored energy. The high speed imaging and the subsequent analysis establishes that the addition of PMB increases the elasticity of the gelatin/PMB Composite. This observation is consistent with the results of the stress-strain tests. Energy absorbed by gelatin with respect to water content and PMB content
The amount of energy absorbed by the gelatin/PMB composite specimen is calculated from acceleration versus time curves for both the
accelerometers for the different trials. The acceleration curves are subjected to CFC60 filter. Figure 9 (a-d) shows the filtered acceleration values for the gelatin/PMB composite specimen with 0% PMB, 2.5% PMB, 5% PMB and 10% PMB content for different water ratios in the first impact for the accelerometer placed in the right. These acceleration curves are shifted up by the acceleration experienced due to body force at the start of contact. The time period is from the start to the end of the loading cycle during the period of contact between the impactor and the composite specimen in the first impact. The time period of contact seem to decrease in general with increasing water content. It is also observed for all the composite specimens that there is an initial phase of loading where the acceleration seems to increase at a very slow rate and then afterwards the rate increases. The initial phase is around 19 ms and 18 ms for 1G:2W and 1G:3W specimens respectively and 14 ms for 1G:4W specimen as seen in Fig. 9(a) for 0% PMB. The rate of increase of the 1G:4W composite specimen is the highest even though the acceleration in the initial phase is the lowest of all as can be seen from all the four figures and owing to the high rate it almost intercepts the 1G:2W acceleration curve at 20 ms as can be seen in Fig. 9(b). This can be attributed to the nonlinear behavior of hyperelastic materials if the acceleration curves are likened to the force curves. The force or the engineering stress in a hyperelastic material increases rapidly at higher strains. This can also explain the observation that the 1G:4W curves stiffen at a very higher rate compared to others as the impactor would have little resistance till 15 ms and it would have compressed considerably resulting in the rapid stiffening after 15 ms. This behavior is also seen in all the curves. It is also observed that there is waviness of the acceleration curve for the 1G:4W
Fig. 8—High speed images of impact of 1G:4W gelatin with (a)2.5% PMB, (b)5% PMB and (c) 10% PMB

NAARAYAN et al: BEHAVIOR OF ORGANIC GELATIN/PHENOLIC MICRO BALLOON COMPOSITE
627
samples in the initial phase. This can be attributed to the reflections of the waves in the initial time causing small changes in the accelerometer results. There is no waviness in the later phase. It is observed that the peak accelerations of the composites for various water contents are dependent on the PMB content and that the peak accelerations for 1G:2W and 1G:3W specimens decrease with PMB content and for the 1G:4W specimen it increases with PMB content. The correlation coefficient for the PMB content and
peak acceleration for 1G:2W, 1G:3W and 1G:4W are -0.959, -0.845 and 0.369, respectively. It is also observed that the peak acceleration recorded for the 1G:4W specimen with 0% PMB is low (when compared to 1G:2W and 1G:3W sample with 0% PMB) which is around 650 m/s2. The lowest acceleration is observed for the 1G:3W specimen with 10% PMB which is around 450 m/s2.
The energy absorbed by the composite during the first impact of the mass was calculated using DATS
Fig. 9—Accelerations at different water contents for the first impact for (a) 0% PMB, (b) 2.5% PMB, (c) 5% PMB and (d)10% PMB for the first trial

INDIAN J ENG. MATER. SCI., DECEMBER 2015
628
software. The energy absorbed is calculated as the difference between the kinetic energy of the impactor just before and after impact. The difference in kinetic energy can be written in terms of final change of velocity ΔV and the initial velocity Vi by substituting Eq. (3) in Eq. (4).
ΔVVV if (3)
)(21 2
f2
iA VVME (4)
Vf is the velocity of the impactor at end of duration of impact and M is the mass of the impactor. The final change in velocity ΔV=Vf-Vi or the velocity difference between the final velocity and initial velocity is obtained by integrating the acceleration over the load cycle for the first impact.
Since the initial velocity and therefore the initial kinetic energy varies for each test as seen in Table 4, for purpose of comparison between different composite specimens, the percentage energy absorption (Ep) is calculated as follows.
100
21p
2i
A
VM
EE … (5)
The denominator in Eq. (5) is the initial kinetic energy of the impactor. Figure 10 shows the calculated average Ep by the above method for various water contents and PMB content. It is observed from
Fig. 10 that the Ep of gelatin/PMB composite increases with increase in water content. The correlation coefficients between the water content (expressed in weight ratios of 0.67, 0.75 and 0.8 for 1G: 2W, 1G:3W and 1G:4W respectively) and Ep for 0%, 2.5%, 5% and 10% PMB content are 0.913 (30 points), 0.913 (30 points), 0.984 (30 points) and 0.841 (30 points) respectively which suggests a good linear relationship between the water content and energy absorption. Since the increase in PMB content increases the porosity (as seen in Fig. 2), the correlation coefficient between the PMB percentage and energy absorbed (J) is calculated for different water contents. The correlation coefficient for 1G:2W, 1G:3W and 1G:4W composites are 0.932 (40 points), 0.942 (40 points) and -0.97 (40 points), respectively. It can be said therefore that there is a definite positive linear correlation between PMB % and Ep for 1G:2W and 1G:3W water contents, but at water content of 1G:4W there is negative correlation between PMB % and Ep and 1G:4W composite specimen with 0% PMB has the highest % energy absorption. It is observed in Table 4 that the displacement or compression (δm) is higher for samples with higher Ep. It is also observed from Table 4 that the absolute value of ΔVav is the lowest for the 1G:4W specimen which will result in maximum energy absorption. This is highly beneficial considering that along with the low acceleration and consequently force, it also absorbs more energy making it useful for energy absorption purpose when
Fig. 10—Energy absorbed by gelatin with respect to PMB and water content
NAARAYAN et al: BEHAVIOR OF ORGANIC GELATIN/PHENOLIC MICRO BALLOON COMPOSITE
629
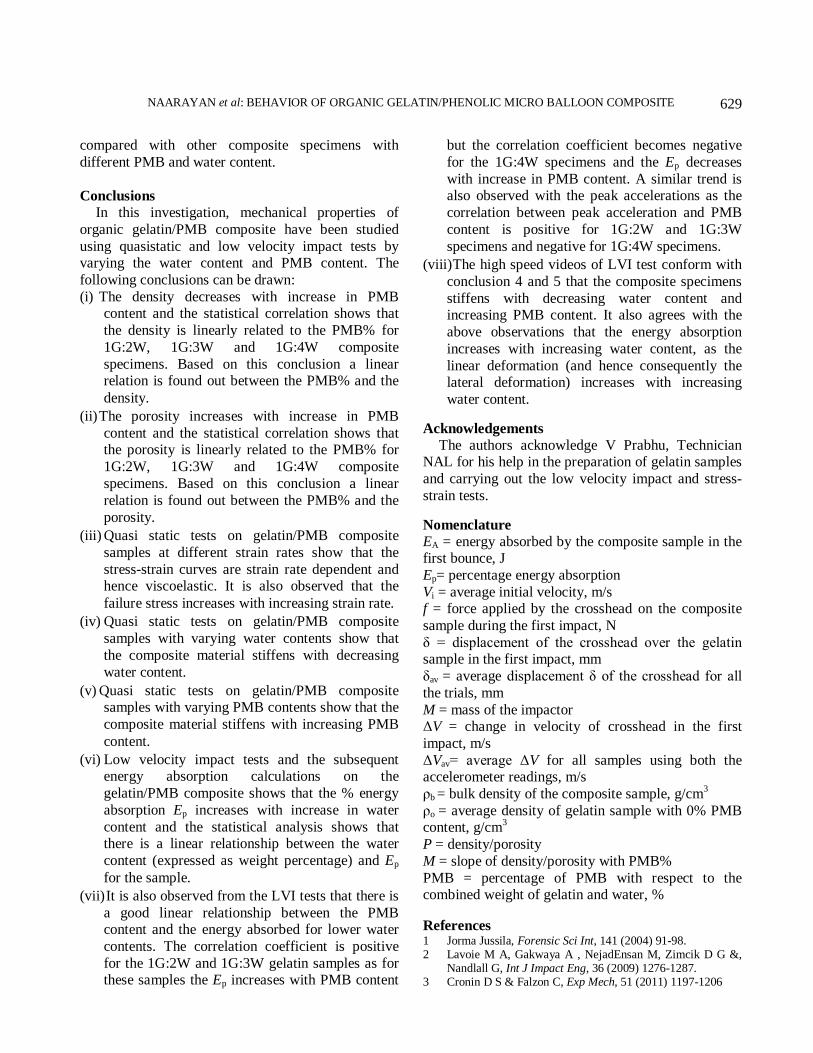
compared with other composite specimens with different PMB and water content. Conclusions
In this investigation, mechanical properties of organic gelatin/PMB composite have been studied using quasistatic and low velocity impact tests by varying the water content and PMB content. The following conclusions can be drawn: (i) The density decreases with increase in PMB
content and the statistical correlation shows that the density is linearly related to the PMB% for 1G:2W, 1G:3W and 1G:4W composite specimens. Based on this conclusion a linear relation is found out between the PMB% and the density.
(ii) The porosity increases with increase in PMB content and the statistical correlation shows that the porosity is linearly related to the PMB% for 1G:2W, 1G:3W and 1G:4W composite specimens. Based on this conclusion a linear relation is found out between the PMB% and the porosity.
(iii) Quasi static tests on gelatin/PMB composite samples at different strain rates show that the stress-strain curves are strain rate dependent and hence viscoelastic. It is also observed that the failure stress increases with increasing strain rate.
(iv) Quasi static tests on gelatin/PMB composite samples with varying water contents show that the composite material stiffens with decreasing water content.
(v) Quasi static tests on gelatin/PMB composite samples with varying PMB contents show that the composite material stiffens with increasing PMB content.
(vi) Low velocity impact tests and the subsequent energy absorption calculations on the gelatin/PMB composite shows that the % energy absorption Ep increases with increase in water content and the statistical analysis shows that there is a linear relationship between the water content (expressed as weight percentage) and Ep for the sample.
(vii) It is also observed from the LVI tests that there is a good linear relationship between the PMB content and the energy absorbed for lower water contents. The correlation coefficient is positive for the 1G:2W and 1G:3W gelatin samples as for these samples the Ep increases with PMB content
but the correlation coefficient becomes negative for the 1G:4W specimens and the Ep decreases with increase in PMB content. A similar trend is also observed with the peak accelerations as the correlation between peak acceleration and PMB content is positive for 1G:2W and 1G:3W specimens and negative for 1G:4W specimens.
(viii) The high speed videos of LVI test conform with conclusion 4 and 5 that the composite specimens stiffens with decreasing water content and increasing PMB content. It also agrees with the above observations that the energy absorption increases with increasing water content, as the linear deformation (and hence consequently the lateral deformation) increases with increasing water content.
Acknowledgements
The authors acknowledge V Prabhu, Technician NAL for his help in the preparation of gelatin samples and carrying out the low velocity impact and stress-strain tests. Nomenclature EA = energy absorbed by the composite sample in the first bounce, J Ep= percentage energy absorption Vi = average initial velocity, m/s f = force applied by the crosshead on the composite sample during the first impact, N δ = displacement of the crosshead over the gelatin sample in the first impact, mm δav = average displacement δ of the crosshead for all the trials, mm M = mass of the impactor ΔV = change in velocity of crosshead in the first impact, m/s ΔVav= average ΔV for all samples using both the accelerometer readings, m/s ρb = bulk density of the composite sample, g/cm3 ρo = average density of gelatin sample with 0% PMB content, g/cm3 P = density/porosity M = slope of density/porosity with PMB% PMB = percentage of PMB with respect to the combined weight of gelatin and water, % References 1 Jorma Jussila, Forensic Sci Int, 141 (2004) 91-98. 2 Lavoie M A, Gakwaya A , NejadEnsan M, Zimcik D G &,
Nandlall G, Int J Impact Eng, 36 (2009) 1276-1287. 3 Cronin D S & Falzon C, Exp Mech, 51 (2011) 1197-1206

INDIAN J ENG. MATER. SCI., DECEMBER 2015
630
4 Wilbeck James S, Impact behavior of low strength projectiles, Report, Air Force Materials Laboratory, 1977.
5 James S Wilbeck & James L Rand, J Eng Power, 103 (1981) 725-730.
6 Kim Ho Sung & Khamis Mohammad Azhar, Composites Part A, 32 (2001) 1311-1317
7 Pearson R A & Yee A F, J Mater Sci, 21 (1986) 2475-88 8 Winter J, The Material Properties of Gelatin Gels, Report,
Ballistic Research Laboratories, AD-AOO03 396, 1975. 9 Cronin D S & Falzon C, Dynamic characterization and
simulation of ballistic gelatin, (Proceedings of the SEM Annual Conference, Society for Experimental Mechanics Inc, Albuquerque New Mexico USA), 2009.
10 Salisbury C P & Cronin D S, Exp Mech, 49 (2009) 829-840 11 Jiwoon Kwon & Ghatu Subhash, J Biomech, 43 (2010)
420-425. 12 Nishant Ravikumar, Cristopher Noble, Edward Cramphorn &
Zeike A Taylor, J Mech Behavior Biomed Mater, 47(2015) 97-94.
13 Paul Moy, Tusit Weerasooriya & Allan Gunnarsson, Tensile deformation of ballistic gelatine as a function of loading rate, Proc XIth Int Congress and Exposition 2008, Society for Experimental Mechanics Inc Orlando, Florida USA, 2008.
14 Richler D & Rittel D, Exp Mech, 54 (2014) 805-815. 15 Subhash G , Kwon J, Mei R & Moore D F, Exp Mech, 52
(2012) 551-560. 16 Song B & Chen W, Exp Mech, 44(2004) 300-313 17 Sebastian Heimbs, Comput Struct, 89 (2011) 2093-2112 18 Airoldi A & Cacchione B, Int J Impact Eng, 32 (1981)
1651-1677. 19 Johnson A F & Holzapfel M, Comput Struct, 61 (2003)
103-113. 20 Appleby-Thomas G J, Hazell P J, WilgerothJ M, Shepherd C J,
Wood D C & Roberts A, J Appl Phys, 109 (2011) 084701 1-6. 21 Shepherd C J, Appleby-Thomas G J, Hazell P J & Allsop D F,
The Dynamic Behavior Of Ballistic Gelatin, Proc American Physical Society Topical Group on Shock Compression of Condensed Matter AIP, Melville, New York, USA, 2009
22 WightmanG, Beard J & Allison R, Forensic Sci Int, 200 (2010).
23 Jusilla J, Wound ballistic simulation: Assessment of the legitimacy of law enforcement firearms ammunition by means of wound ballistic simulation, Thesis, Second Department of Surgery, University of Helsinki, Finland, 2005.
24 Saha Mrinal C, Nilufar Sabrina, Major Mosi & Jeelani Shaik, Polym Compos, (2008) 294-301.