Behavior & Energy: Key Insights from the Social Sciences
11
Amanda Carrico University of Texas Smart Grid Conference Austin, TX April 7, 2011 Behavior & Energy: Key Insights from the Social Sciences 1
-
Upload
willow-weiss -
Category
Documents
-
view
34 -
download
2
description
Behavior & Energy: Key Insights from the Social Sciences. Amanda Carrico University of Texas Smart Grid Conference Austin, TX April 7, 2011. 1. Putting Price in Context. Souce : Stern (1999). 2. Putting Technology in Context. - PowerPoint PPT Presentation
Transcript of Behavior & Energy: Key Insights from the Social Sciences

1
Amanda Carrico
University of Texas Smart Grid ConferenceAustin, TXApril 7, 2011
Behavior & Energy:Key Insights from the Social Sciences

2
1. Putting Price in Context
Souce: Stern (1999)

3
2. Putting Technology in Context
Need to understand the gap between technical potential and behaviorally realistic potential.
Need to address both technology adoption and use. Energy use in nearly identical homes can vary by as much as
300% (Socolow, 1978).
Programmable thermostats: Estimated technical potential is 5 – 15% reductions in household
energy use. Actual energy savings achieved is negligible (e.g., Nevius &
Pigg, 2000; Meier et al, 2010).

4
3. The Energy Invisibility Problem
Consumers have little understanding of where energy is used in the home and the relative impacts of actions to conserve energy.
Tendency to overestimate potential savings due to conservation vs. potential savings due to efficiency (Attari, 2010).
Prevalence of “energy myths” based on inaccurate or outdated information.

5
3. The Energy Invisibility Problem
Over 80% of Americans hold inaccurate or outdated beliefs about how long they should idle their vehicles.
0
1
2
3
4
5
6
4.3
2.5
3.5
0.5
Minutes
Carrico et al. (2009)

6
3. The Energy Invisibility Problem
Minutes/day
% of population
Daily US Emissions
(million lbs / kg)
Annual US emissions
(MMt)
Daily US consumption
(million gallons / liters)
Annual US consumption
(billion gallons / liters)
Warming 2.748%
(91.2 million)45.6 / 20.7 7.5 2.3 / 8.7 0.9 / 3.4
Waiting 3.146%
(87.4 million)50.2 / 22.8 8.3 2.6 / 9.8 0.9 / 3.4
Total 95.8 / 43.5 15.8 4.9 / 18.5 1.8 / 6.8
CO2 Emissions Fuel Consumption
Table 3. Estimated CO2 emissions and fuel use associated with unnecessary idling in the U.S.
Carrico et al. (2009)
We estimate that a well-implemented public education campaign could eliminate roughly 8MMt of CO2 annually.

7
4. Behavioral Feedback Matters
In-home feedback associated with a rapid 5 – 15% reduction in energy use (e.g., Ehrhardt-Martinez et al., 2010). Effects shown in the absence of dynamic pricing schemes. Effects shown among individuals who are not responsible for
their own energy costs (e.g., Carrico & Riemer, 2011). Early evidence suggest these effects persist for as long as 2
years.
Critical for overcoming energy invisibility and information deficits.
Key supplement to dynamic pricing schemes.

8
5. Social Feedback Matters
Source: Ayres et al. (2009); See also Schultz et al., (2007)

9
5. Social Feedback Matters
Source: Goldstein et al. (2008)
“Around 75% of guests participate in our
program… and re-use their bathroom towels.”
10
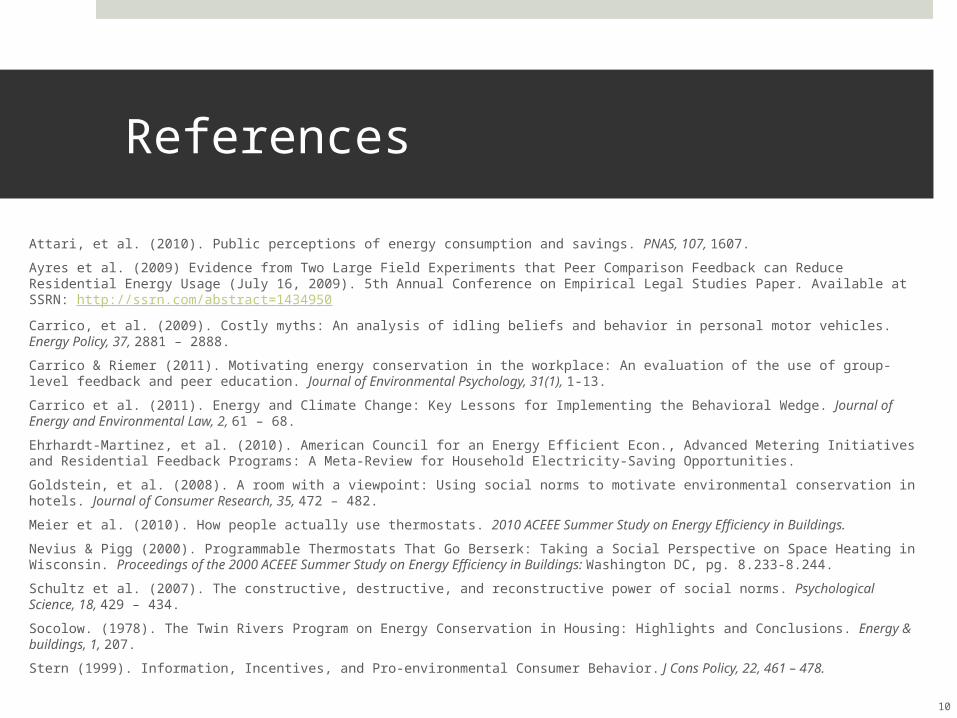
References
Attari, et al. (2010). Public perceptions of energy consumption and savings. PNAS, 107, 1607.
Ayres et al. (2009) Evidence from Two Large Field Experiments that Peer Comparison Feedback can Reduce Residential Energy Usage (July 16, 2009). 5th Annual Conference on Empirical Legal Studies Paper. Available at SSRN: http://ssrn.com/abstract=1434950
Carrico, et al. (2009). Costly myths: An analysis of idling beliefs and behavior in personal motor vehicles. Energy Policy, 37, 2881 – 2888.
Carrico & Riemer (2011). Motivating energy conservation in the workplace: An evaluation of the use of group-level feedback and peer education. Journal of Environmental Psychology, 31(1), 1-13.
Carrico et al. (2011). Energy and Climate Change: Key Lessons for Implementing the Behavioral Wedge. Journal of Energy and Environmental Law, 2, 61 – 68.
Ehrhardt-Martinez, et al. (2010). American Council for an Energy Efficient Econ., Advanced Metering Initiatives and Residential Feedback Programs: A Meta-Review for Household Electricity-Saving Opportunities.
Goldstein, et al. (2008). A room with a viewpoint: Using social norms to motivate environmental conservation in hotels. Journal of Consumer Research, 35, 472 – 482.
Meier et al. (2010). How people actually use thermostats. 2010 ACEEE Summer Study on Energy Efficiency in Buildings.
Nevius & Pigg (2000). Programmable Thermostats That Go Berserk: Taking a Social Perspective on Space Heating in Wisconsin. Proceedings of the 2000 ACEEE Summer Study on Energy Efficiency in Buildings: Washington DC, pg. 8.233-8.244.
Schultz et al. (2007). The constructive, destructive, and reconstructive power of social norms. Psychological Science, 18, 429 – 434.
Socolow. (1978). The Twin Rivers Program on Energy Conservation in Housing: Highlights and Conclusions. Energy & buildings, 1, 207.
Stern (1999). Information, Incentives, and Pro-environmental Consumer Behavior. J Cons Policy, 22, 461 – 478.
11
Amanda Carrico, Ph.D.Climate Change Research NetworkVanderbilt Institute for Energy and EnvironmentVanderbilt Universitywww.vanderbilt.edu/[email protected](615) 322 – 9690