Behavior and Risk of Predation in Larval Tree Hole ...
14
Behavior and Risk of Predation in Larval Tree Hole Mosquitoes: Effects of Hunger and Population History of Predation Steven A. Juliano; Laura J. Hechtel; John R. Waters Oikos, Vol. 68, No. 2. (Nov., 1993), pp. 229-241. Stable URL: http://links.jstor.org/sici?sici=0030-1299%28199311%2968%3A2%3C229%3ABAROPI%3E2.0.CO%3B2-4 Oikos is currently published by Nordic Society Oikos. Your use of the JSTOR archive indicates your acceptance of JSTOR's Terms and Conditions of Use, available at http://www.jstor.org/about/terms.html. JSTOR's Terms and Conditions of Use provides, in part, that unless you have obtained prior permission, you may not download an entire issue of a journal or multiple copies of articles, and you may use content in the JSTOR archive only for your personal, non-commercial use. Please contact the publisher regarding any further use of this work. Publisher contact information may be obtained at http://www.jstor.org/journals/oikos.html. Each copy of any part of a JSTOR transmission must contain the same copyright notice that appears on the screen or printed page of such transmission. The JSTOR Archive is a trusted digital repository providing for long-term preservation and access to leading academic journals and scholarly literature from around the world. The Archive is supported by libraries, scholarly societies, publishers, and foundations. It is an initiative of JSTOR, a not-for-profit organization with a mission to help the scholarly community take advantage of advances in technology. For more information regarding JSTOR, please contact [email protected]. http://www.jstor.org Thu Aug 30 12:34:22 2007
Transcript of Behavior and Risk of Predation in Larval Tree Hole ...

Behavior and Risk of Predation in Larval Tree Hole Mosquitoes: Effects of Hungerand Population History of Predation
Steven A. Juliano; Laura J. Hechtel; John R. Waters
Oikos, Vol. 68, No. 2. (Nov., 1993), pp. 229-241.
Stable URL:
http://links.jstor.org/sici?sici=0030-1299%28199311%2968%3A2%3C229%3ABAROPI%3E2.0.CO%3B2-4
Oikos is currently published by Nordic Society Oikos.
Your use of the JSTOR archive indicates your acceptance of JSTOR's Terms and Conditions of Use, available athttp://www.jstor.org/about/terms.html. JSTOR's Terms and Conditions of Use provides, in part, that unless you have obtainedprior permission, you may not download an entire issue of a journal or multiple copies of articles, and you may use content inthe JSTOR archive only for your personal, non-commercial use.
Please contact the publisher regarding any further use of this work. Publisher contact information may be obtained athttp://www.jstor.org/journals/oikos.html.
Each copy of any part of a JSTOR transmission must contain the same copyright notice that appears on the screen or printedpage of such transmission.
The JSTOR Archive is a trusted digital repository providing for long-term preservation and access to leading academicjournals and scholarly literature from around the world. The Archive is supported by libraries, scholarly societies, publishers,and foundations. It is an initiative of JSTOR, a not-for-profit organization with a mission to help the scholarly community takeadvantage of advances in technology. For more information regarding JSTOR, please contact [email protected].
http://www.jstor.orgThu Aug 30 12:34:22 2007

OIKOS 68: 229-241. Copenhagen 1993
Behavior and risk of predation in larval tree hole mosquitoes: effects of hunger and population history of predation
Steven A. Juliano, Laura J. Hechtel and John R. Waters
Juliano, S. A, , Hechtel, L. J . and Waters, J . R. 1993. Behavior and risk of predation in larval tree hole mosquitoes: effects of hunger and population history of predation. - Oikos 68: 229-241.
We compare fixed behavior patterns and estimate associated risk of predation for eight populations of Aedes triseriatus at different levels of hunger, produced by manipulation of food availability prior to the test. Activity patterns (frequencies of browsing, filtering, resting, and thrashing) varied significantly among populations, but did not differ significantly between populations from sympatry with the predator Toxorhynchites rutilus vs those from allopatry to this predator. Activity patterns were affected by hunger, with increasing hunger associated with decreasing thrashing and resting, and increasing browsing. Food affected activity in all populations in a similar fashion. Estimates of risk of predation associated with activity patterns varied sig- nificantly among populations, but did not differ significantly between sympatric vs allopatric A. triseriatus. Risk associated with activity patterns increased with in- creasing hunger. Patterns of positions occupied (bottom, middle, wall, and surface) also varied significantly among populations, but again did not differ significantly between populations from sympatry with Toxorhynchites rutilus vs those from allo- patry to this predator. Positions were affected by food, however the effects of food on positions differed significantly among populations. Estimated risk of predation asso- ciated with positions varied among populations, but did not differ between sympatric and allopatric populations. Hunger affected risk associated with positions in early instars, but the effect was not consistent across populations. Hunger had no effect on risk associated with positions in late instar larvae. Although there are pronounced behavioral differences among populations, these differences are not associated with prescncelabsence of T. rutilus, hence are unlikely to be products of natural selection by predation. Hunger affects behavior and increases risk of predation, primarily via changes in activity pattern. Activity pattern changes with hunger more consistently that does position.
S. A. Juliano (correspondence), L. J . Hechtel and J. R. Waters, Dept of Biological Sciences, Ecology Group, Illinois State Univ., Normal, IL 61790-4120, USA.
Behavior of an organism may be related to predation on that organism in several ways. Predation is one selective force that shapes behavior, and populations with dif- ferent histories of predation may therefore exhibit di- vergent patterns of behavior (Arnold and Bennett 1984, Fawcett 1984, Giles and Huntingford 1984, Fraser and Gilliam 1987, Kats et al. 1988, Magurran 1990, Riechert
Accepted 27 February 1993
Copyright 0OIKOS 1993 ISSN 0030-1299 Printed in Denmark - all rights reserved
and Hedrick 1990). There have been relatively few at- tempts to test rigorously for a consistent relationship between predation on populations and typical behavior of individuals within those populations. In many instances only two populations are compared (e.g. Herzog and Schwartz 1990, Magurran 1990, Riechert and Hedrick 1990, Juliano and Reminger 1992), and

Table 1. Populations of Aedes triseriatus used in this experiment. "Container type" indicates the containers from which parents of individuals used in the experiment were collected.
Population T. rutilus elevation Longitude Latitude Container types (abbreviation) Resident (m) rw) (ON)
FermiLab IL (F) Normal IL (N)
Absent Rare in some years
73 239
88.21 89.00
41.45 40.31
Oak. basswood, and cherry tree holes Oak tree holes
Romeo MI (R) Absent 299 83.18 42.39 Oak and maple tree holes Worcester MA (W) Absent 302 71.52 42.16 Maple tree holes Ashland VA (A) Present 67 77.29 37.45 Tires; a few tree holes Durham NC (D) Present 125 78.58 36.20 Oak. sweet gum, and maple tree holes Olive Branch IL ( 0 ) Present 104 89.22 37.10 Oak and maple tree holes; a few tires Vero Beach FL (V) Present 5 80.25 27.36 Oak tree holes; tires
behavioral differences between the two are inferred to be products of differential predation. Comparisons be- tween sets of populations exposed to predation vs sets of populations not exposed to predation are necessary in order to establish that differences between popula- tions with and without histories of predation are large compared to variation among populations with similar histories of predation.
Interpopulation behavioral differentiation provides evidence for some of the indirect effects of predation on prey. Predation is presumed to select for behaviors that reduce the risk of mortality relative to other behaviors (Sih 1987). Such safe behavior patterns are presumed to have costs, expressed as reduced opportunity to mate, forage, groom, or raise young, and in the absence of reda at ion. selection is likelv to favor individuals that do not pay these costs of adopting safe behaviors (Sih 1987). Recent theoretical and empirical work has em- phasized the trade-off between risk of predation and foraging and feeding rate. In many instances, it appears that foraging activities place animals at greater risk of predation than do non-foraging activities. As a result, individuals that are hungrier are expected to endure greater exposure to and risk of predation in conjunction with their increased foraging activities (Sih 1987). In some systems this trade-off is well documented for be- havioral choice of habitats (Werner et al. 1983, Sih 1986, 1987, Gilliam and Fraser 1987, Holomuzki and Short 1988). Several ex~erimental studies have docu- mented that hungry animals experience greater risk of predation (Milinski and Heller 1978, Dill and Fraser 1984, Milinski 1985, Sih 1987, Godin and Sproul 1988).
Populations with different histories of predation may differ in either the flexible behavioral response to the perception of predators. or in fixed patterns of behavior that i re expressed regardless of whether predators are immediately present (Sih 1987). Differentiation in flexible responses vs fixed behavior patterns probably reflects the costs and benefits of low-risk behavior vs the ctnts and benefits of gathering accurate information on predator presence (Sih 1987).
In this paper, we test for consistent differences in fixed behavior patterns between populations with dif-
ferent histories of predation, in order to test the hypo- thesis that behavioral differences among populations are products of selection by predation. We also test for effects of recent feeding history (=hunger) on be-havior, and because we know the relative riskiness of different behaviors (Juliano and Reminger 1992), we can test the hypothesis that hunger increases risk of predation. We examine behavior of tree hole dwelling larvae of the mosquito Aedes triseriatus. This species is ideal for testing these hypotheses because different geo- graphic populations have very different histories of exposure to the predatory mosquito Toxorhynchites rutilus. We have chosen to concentrate in this paper on fixed behavioral differences among populations for two related reasons. First, in prior studies of behavior (Juliano and Reminger 1992), differentiation of fixed behaviors between a pair of populations has been estab- lished, but the degree to which such differences are consistent among populations is not known. Second, although T. rutilus induces behavioral changes in A . triseriatus in the laboratory, these changes do not ap- pear to differ between populations and also are not clearly related to reduced risk of predation (Juliano and Reminger 1992). Thus. existing data on A . triseriatus suggest that testing the hypothesis of differentiation of fixed behaviors is more interesting.
Methods Study organism
Aedes triseriatus is a common tree hole mosquito found throughout the eastern United States and southern Canada (Bradshaw and Holzapfel 1985). Females oviposit on damp surfaces in water filled tree holes and similar containers (e.g., old tires) in the woods (Bradshaw and Holzapfel 1983). Eggs are desiccation resistant and hatch when flooded (Bradshaw and Holzapfel 1983). Larvae are filter feeders, browsers, and gnawers feeding on bacteria, protozoa, fungi, and detritus (Walker and Merritt 1991. Merritt et al. 1992). Populations of A. triseriatus from the southern U.S.

(south of -40" north latitude) regularly encounter predatory larvae of container inhabiting Toxorhynchites rutilus (Livdahl 1984, Bradshaw and Holzapfel 1985). Unlike A. triseriatus, T. rutilus is exclusively predaceous in its larval stages (Bradshaw and Holzapfel 1983). T. rutilus does not appear to survive permanently in the northern part of the continent, although dispersing indi- viduals may occasionally reach latitudes greater than 40" north (Darsie and Ward 1981). T. rutilus larvae over- winter in tree holes and are intolerant of freezing (Brad- shaw and Holzapfel 1985). Northern populations of A. triseriatus are therefore very rarely or never exposed to this predator, and have few predators in the aquatic environment and none as voracious as T. rutilus (Brad-shaw and Holzapfel 1985).
Origin of populations
Populations from Vero Beach, FL, Durham, NC, Ash- land, VA, and Olive Branch, IL are sympatric with T. rutilus (Table I ) , and both species were often collected from the same containers. Normal, IL, FermiLab, IL, Romeo, MI, and Worcester, MA, were designated as populations allopatric to T. rutilus. At the Normal, IL site, T. rutilus was absent in years preceding this study. However, in two subsequent years (1991 and 1992) a few T. rutilus larvae have been collected in late summer from two tree holes and from tires, suggesting that adult T. rutilus occasionally reach this site during the sum- mer. We have no evidence of a continuing overwinter- ing population.
A. triseriatus from all sites were collected as larvae and pupae from tree holes or tires. Adults were main- tained as free-mating colonies (300 to >I000 indi-viduals) in 0.6 m3 screened cages, fed on sugar water and provided with blood meals from anaesthetized mice. Females oviposited on paper towels in black cups. General rearing methods are described by Juliano (1989). Individuals used in experiments were all F, progeny of the field collected animals, and thus had not undergone prolonged artificial selection in the labora- tory.
Experimental design
We conducted a factorial experiment to test the null hypotheses that (1) A. triseriatus populations from sym- patry and allopatry with T. rutilus do not differ consis- tently in behavior; (2) regardless of sympatrylallopatry, populations of A. triseriatus do not vary in behavior; (3) the amount of food available over the previous 24 h has no effect on behavior.
In the experiment, two observers independently con- ducted instantaneous scan censuses (Martin and Bate- son 1986) of behavior of larvae. After synchronous hatching (Novak and Shroyer 1978) we observed larvae
one day after they reached each of the four instars. One day after hatching, larvae were placed into group rear- ing tubs (-200 larvae in 6 1 of water, with 0.5 g liver powder/larva/week) for rearing to later instars (at 2z0C, 17:7 L:D). Some first instar larvae were immediately placed on specific food treatments in preparation for the observations. As larvae reached each successive instar, we removed newly molted (<24 h) individuals from the rearing tubs and placed them on the food treatments for 24 h prior to observation. Observed larvae were not returned to the group rearing container, so that no larva was observed more than once.
In order to manipulate the hunger level of larvae, we offered four food treatments consisting of different amounts of liver powder provided to individual larvae in 10 ml water for 24 h ptior to observation. Amounts used were 0 mg, 0.01 mg, 0.10 mg, and 1.00 mg liver powder larva-'. Larvae on specific food treatments were then placed into the containers, and held for 24 h at 22"C, 16:s L:D. These treatments thus manipulated food availability for 1 day prior to observation at a standardized developmental stage (immediately follow- ing molt).
After 24 h on the food treatments, larvae were re- moved from the feeding containers, rinsed in clean wa- ter, and placed into the observation containers, which were 50 ml microbeakers filled with 30 ml water without food. Initial water temverature was 22°C. Observations were done under fluorescent lights (illuminance =
807 Ix) at various times during the light period. The experimental observations were done blind, so that the observers did not know the population and food treat- ment for individual larvae. In each session, the ob- served group consisted of up to 18 larvae from 4 of the 8 populations, 2 from sympatry, 2 from allopatry. Once in the observation containers, larvae were observed fol- lowing 5 min acclimation. We censused the position and activity of larvae every min for 30 min, with the goal of obtaining observations of 10 larvae/population-instar-food combination, which would have resulted in obser- vations of 1280 larvae. Because of mortality during the treatment phase and other losses of larvae, we actually observed 1140 larvae, or -9 larvaelpopulation-instar-food combination.
Behaviors recorded were those described by Juliano and Reminger (1992). The homologies between these behavioral categories and those used by Walker and -Merritt (1991) were given by Juliano and Reminger (1992). Four activities were: 1) Resting. Larvae were not feeding and were not moving through the water. 2) Browsing. Larvae moved along the surfaces of the con- tainer, working their mouth parts against the surface, presumably collecting microbes. 3) Filtering. Larvae in open water floated through the water propelled by movements of the mouth parts. No movement of the body was observed. 4) Thrashing. Larvae moved through the water propelled by vigorous lateral flexions of the entire body.

Four positions within the containers were: 1) Surface. Larvae had their spiracular siphons in contact with the water's surface. 2) Wall. Larva were within 1mm of the container wall. 3) Bottom. Larvae were within 1 mm of the container bottom. 4) Middle. Larvae were away from the surface, wall, and bottom. Larvae that were both within 1 mm of the wall and 1 mm of the bottom were recorded as at the bottom. Larvae in contact with the surface and also within I mm of the wall were recorded as at the surface.
Data analysis
For each individual, the behavioral data consisted of arcsine transformed proportions (based on N = 30 ob-servations) of observations in a given activity or position category. Differences in behavior among populations and the effects of food availability were analyzed using multivariate analysis of variance (MANOVA), with FOOD as a covariate, and with REGION (Sympatric, Allopatric) and POPULATION WITHIN REGION (Table 1) as the categorical variables. Because two different observers were involved, we included OB- SERVER as a block effect. In order to simplify ana- lyses, we analyzed early (1st and 2nd instars) and late instars (3rd and 4th instars) separately. Juliano and Reminger (1992) documented that the major behavioral differences among instars are between these two groups, and that differences within these two groups are minimal. Our primary interests are: 1) Is the REGION effect significant? This was tested using POPULATION (REGION) as the error term. Use of POPULATION (REGION) as an error term implies that populations are randomly chosen, which is not strictly true. We conduct this test in this way in order to generalize from these populations to all sympatric and allopatric popula- tions. In the absence of a way to select populations at random, we must assume that these populations are representative of sympatric and allopatric populations ingeneral. 2) Are there differences among populations? We test the POPULATION effect against ERROR. 3) Does food significantly affect behavior, and if so, what is the direction (increasing vs decreasing frequency) of the effect of food on frequencies of different behaviors? MANOVA tests of the FOOD effect, followed by uni- variate tests and estimates of slopes, were used to answer this question.
MANOVA was done using an analysis of covariance approach, i.e., we first test a model incorporating a multivariate test for the POPULATION*FOOD inter- action, then, if this interaction is not significant in the MANOVA test, we test a multivariate model without this interaction. The test for interaction tests whether the multivariate relationship of frequency variables to food was homogeneous for all populations. When there was a significant multivariate POPULATION*FOOD interaction, the final MANOVA retains this effect and
we refer to the analysis as a "linear model analysis" in order to make clear the distinction of these analyses from analysis of covariance models without interaction. MANOVA was followed by multivariate multiple com- parisons (Bonferroni method, Neter and Wasserman 1974) of behavioral frequencies among populations. All analyses were performed using the GLM procedure of SAS (SAS Institute Inc. 1987).
Quantifying risk of predation
Juliano and Reminger (1992) showed that among activ- ities, thrashing was the most risky, resting the least risky, and filtering and browsing were intermediate. Among positions, the bottom was most risky, the sur- face least risky, and wall and middle were intermediate (Juliano and Reminger 1992). With this information, it may be possible to conclude that behavior patterns of some populations (or at some food levels) are more likely to lead to capture than are those of other popula- tions (or food levels). However, some differences may be difficult to interpret, for instance, if one population has greater frequencies of both thrashing and resting (the most and least risky activities, respectively). Our solution to this problem is to derive a risk index, which quantifies the degree of risk associated with each be- havior (within the behavioral classes position and ac- tivity), and then to calculate a weighted average risk index (= risk score) for each population. The weights for this weighted average are the observed frequencies for each behavior in that population.
Juliano and Reminger (1992) reported frequencies of observations of different behaviors in two groups of mosquitoes, one group in which the behavior that im- mediately preceded capture by T. rutilus was recorded (capture group), the other group in which behavior was recorded at times not associated with capture (no-capture group). These two frequencies were used to calculate an index of risk for each behavior. Let F,, = frequency of behavior i in the capture group, and F,,, = frequency of behavior i in the no-capture group. Risky behaviors are those for which F,, >F,,, and safe behaviors are those for which F,, <F,,, (Juliano and Reminger 1992). These data are analogous to those used to calculate indices of preference among prey types in studies of predator diet choice (Lechowicz 1982). with behaviors analogous to prey types, the capture group analogous to prey in the predator's diet, and the no capture group analogous to prey in the environment. Lechowicz (1982) showed that nearly all existing pre- ference indices give similar results concerning risk of predation. We choose the index, R, = log(F,)F,,) = iog(F,,) - log(F,,), which has the desirable property (Lechowicz 1982) of being symmetrical about 0, which is the index value indicating a risk-neutral behavior. The risk index for all behaviors would be 0 if different behaviors had no effect on risk. R, >0 indicates risky
OIKOS 68.2 (1943)
- - -
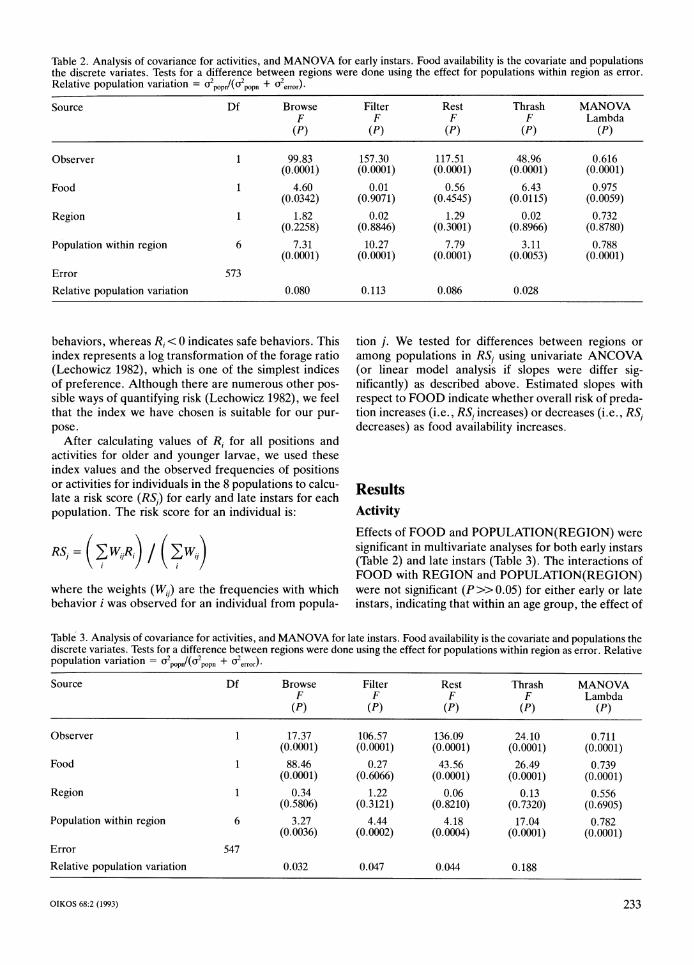
Table 2. Analysis of covariance for activities, and MANOVA for early instars. Food availability is the covariate and populations the discrete variates. Tests for a difference between regions were done using the effect for populations within region as error. Relative population variation = a2,,,,1(a2,,,, + $,,,,,). Source Df Browse
F (PI
Observer
Food
Region
Population within region
Error Relative population variation
1
6
573
1.82 (0.2258)
7.31 (0.000l)
0.080
behaviors, whereas R, < 0 indicates safe behaviors. This index represents a log transformation of the forage ratio (~echowicz 1982), which is one of the simplestindices of preference. Although there are numerous other pos- sible ways of quantifying risk (Lechowicz 1982), we feel that the index we have chosen is suitable for our pur- pose.
After calculating values of R, for all positions and activities for older and younger larvae, we used these index values and the observed frequencies of positions or activities for individuals in the 8 populations to calcu- late a risk score (RS,) for early and late instars for each population. The risk score for an individual is:
where the weights (W,) are the frequencies with which behavior i was observed for an individual from popula-
Filter Rest Thrash MANOVA F F F Lambda
(PI (PI (PI (PI
0.02 1.29 0.02 0.732 (0.8846) (0.3001) (0.8966) (0.8780)
10.27 7.79 3.11 0.788 (0.0001) (0.0001) (0.0053) (0.0001)
0.113 0.086 0.028
tion j. We tested for differences between regions or among populations in RS, using univariate ANCOVA (or linear model analysis if ;lopes were differ sig-nificantly) as described above. Estimated slopes with respect to FOOD indicate whether overall risk of preda- tion increases (i.e., RS, increases) or decreases (i.e., RS, decreases) as food availability increases.
Results Activity
Effects of F O O D and POPULATION(REGI0N) were significant in multivariate analyses for both early instars (Table 2) and late instars (Table 3). The interactions of FOOD with REGION and POPULATION(REGI0N) were not significant (P>> 0.05) for either early or late instars, indicating that within an age group, the effect of
Table 3. Analysis of covariance for activities, and MANOVA for late instars. Food availability is the covariate and populations the discrete variates. Tests for a difference between regions were done using the effect for populations within region as error. Relative population variation = u2,,,,l(a2,,,, + a2,,,,, ).
Source Df Browse
Observer 1 17.37 (0.000l)
Food 1 88.46 (0.000l)
Region 1 0.34 (0.5806)
Population within region 6 3.27 (0.0036)
Error 547
Relative population variation 0.032
Filter Rest Thrash MANOVA F Lambda
(PI (PI
106.57 136.09 24.10 0.711 (0.0001) (0.0001) (0.0001) (0.000l)
0.27 43.56 26.49 0.739 (0.6066) (0.000l) (0.0001) (0.0001)
1.22 0.06 0.13 0.556 (0.3121) (0.8210) (0.7320) (0.6905)
4.44 4.18 17.04 0.782 (0.0002) (0.0004) (0.0001) (0.0001)
0.047 0.044 0.188

a BROWSE 0FILTER RI-ST a THRASH
~EARLYINSTARS
- " a A D O V
" F N R W A D O V
POPULATION
Fig. 1. Least squares means (kSE) for transformed frequen-cies of four activities. Back-transformed proportions are given on the right axis. Site abbreviations are: F = FermiLab, IL; N =Normal, IL; R = Romeo, MI; W = Worcester, MA; A = Ashland, VA; D = Durham. NC; 0= Olive Branch, IL; V = Vero Beach, FL. The first four populations are allopatric to the predator Toxorhynchites rutilus. and the last four are sympatric with this predator (See Table 1 for details). Within an age class, populations marked with the same letter have multivariate activity patterns that are not significantly different (overall u = 0.05).
food availability on activity patterns was the same for all 8 populations. The REGION effect was not significant for either early or late instars (Tables 2 and 3, respec-tively), indicating that although populations differed in activity pattern, there was no consistent difference in activity pattern between sympatric vs allopatric popula-tions. The block effect (OBSERVER) was also sig-nificant for both early and late instars (Tables 2 and 3).
For early instars, multivariate activity patterns of the four sympatric populations tended to be similar (Fig. I ) , with the only differences between Ashland and Durham, and Vero Beach and Durham (Fig. 1). Among allopatric populations, Worcesler differed from
Table 4. Estimated slopes and SE's for the relationships of activity frequencies (Arcsine proportion transformed) to food availability. Slopes marked with an asterisk are sig-nificantly different from 0 (see Tables 2 and 3).
Activity Early instar larvae Late instar larvae
Slope SE Slope SE
Browse -3.021* 1.409 -13.927* 1.481 Filter -0.133 1.140 -0.699 1.356 Rest 1.203 1.608 9.914* 1.502 Thrash 3.275* 1.292 5.740* 1.115
all others, and Romeo differed from FermiLab and Normal, which did not differ (Fig. 1). For early instar\. the Worcester population had the most distinct act~vity pattern, differing significantly from all other popula-tions (Fig. 1). Four populations, Ashland. Vero Beach. FermiLab, and Normal did not differ sigmficantly among themselves (Fig. 1).Half of all inter-region pairs were not significantly different in pattern of activity for early instars.
For late instars. the Durham and Olive Branch populations were most distinct from all other popula-tions in multivariate activity pattern (Fig. 1). Among the four allopatric populations, there were no rig-nificant pairwise differences in activity pattern, whereas among the four sympatric populations Durham and Olive Branch differed from Ashland and Vero Beach (Fig. 1). Of 16 inter-region pairwise comparisons. 10 were not significant (Fig. 1).
Univariate analyses for early instars indicated that FOOD primarily affected the frequencies of browsing and thrashing, and had no effect on frequencies of fil-tering and resting (Table 2). Slopes for the linear rela-tionships (Table 4) indicated that as food available prior to observation increased (i .e. , hunger decreased). the frequency of browsing decreased and the frequency of thrashing increased. Hungrier early instar larvae in-crease one type of foraging activity. and reduce thrash-ing, a locomotor activity
Univariate analyses for late instars indicated that FOOD affected browsing, resting, and thrashing, but had no effect on filtering (Table 3). Slopes for the linear relationships (Table 4) indicated that as food available prior to observation increased (i.e., hunger decreased). the frequency of browsing decreased and the frequen-cies of resting and thrashing increased. Hungrier late instar larvae increase one type of foraging activity, and reduce non-feeding activities.
Although there was significant variation among populations in the frequencies of all four activities, the proportion of total variation (= variation among populations + variation among individuals within populations) attributable to i n t e ~ - ~ o ~ u l a t i o ndiffer-ences was generally small (Tables 2 and 3). Only for thrashing in late instar larvae did the proportion of variability attributable to populations rise above 0.15. Thus, although there is detectable inter-population variation in activity pattern, most of the variation is among individuals within populations.
Activity risk scores
For early instar larvae, there were no significant effects of FOOD or REGION on risk scores (Table 5). The lack of a FOOD effect indicates that although hunger affects activity pattern, the risk of predation associated with activity pattern does not change with hunger for early instar larvae. The interactions of FOOD with RE-

Table 5. Analysis of covariance on risk score for activity variables. Food availability is the covariate and populations the discrete variates. Tests for a difference between regions were done using the effect for populations within region as error. Relative population variation = 02,,,,, /(02,,,,+ 02,,,,,).
Source
Observer Food Region Population within region Error Relative population variation Slope ? SE
Early instar larvae Late instar larvae
Df F P Df F P
1 0.14 0.7109 1 73.00 0.0001 1 2.36 0.1253 1 19.75 0.0001 1 0.52 0.4969 1 0.08 0.7865 6 3.04 0.0062 6 8.96 0.0001
573 547 0.112 0.126
0.013f 0.008 -0.084+0.019
EARLY INSTAR -
: , n n - ab* *
a
LATE INSTAR - bc
a
-0.3
* ad
b ab
bc
F N R W A D O V POPULATION
Fig. 2. Least squares means (iSE) of predation risk scores based on activity patterns for Aedes triseriatus larvae from eight populations in two age classes. Population abbreviations as in Fig. 1. Within an age class, least squares means marked with the same letter are not significantly different (overall a = 0.05).
GION and POPULATION(REGI0N) were also not significant (P>>0.05), and the block (OBSERVER) effect was not significant (Table 5). For early instars, only the POPULATION(REGI0N) effect was signif- icant, indicating that the risk of predation associated with activity patterns of different populations differed, despite the fact that such differences were not consis- tently associated with sympatry vs allopatry (Table 5). The proportion of variation in risk score associated with POPULATION was low (Table 5), indicating that most intraspecific variation in risk score is due to variation among individuals.
For late instar larvae, risk scores were significantly affected by FOOD and by POPULATION(REGI0N) (Table 5). As with early instars, effects of REGION and interactions of FOOD with REGION or POPULA-TION(REGI0N) were not significant (Table 5 ) , indi-cating that risk scores change with hunger in the same way for all populations, and that although there is inter- population variation in risk scores, this variation is not consistently related to sympatry vs allopatry. As was true for early instars, most of the variation in risk scores for later instars was among individuals within popula- tions, rather than between populations (Table 5). For late instar larvae, the block (OBSERVER) effect was significant (Table 5). The slope for risk scores vs food availability prior to observation (Table 5) was negative indicating that as food availability increased (i.e., hun- ger decreased), risk of predation associated with activity pattern decreased. Activity patterns of hungrier late instar larvae appear to entail greater risk of predation.
The only pairwise differences among populations that were significant for risk scores of early instars were Durham vs Ashland and Durham vs FermiLab, with early instars from Durham having significantly lower risk scores (Fig. 2). For late instar larvae, individuals from Olive Branch, Durham, and Romeo had the highest risk scores, which were significantly greater than those of individuals from Vero Beach, Ashland, FermiLab, and Normal (Fig. 2). The risk scores for individuals from Worcester were significantly different from those of individuals from Olive Branch. but not

- -
Table 6. Linear model analysis and MANOVA for positions for early instar larvae. Food availability is the covariate and populations the discrete variates. Tests for a difference between regions were done using the effect for populations within region as error. Relative population variation = ~2,,,~(02p,p,+ u2erio,).
Source Df Bottom F
(PI
Middle F
(PI
Wall F
(Pi
Surface F
(PI
MANOVA Lambda
(P)
Observer
Food
Region 1 2.68 (0.1524)
Population within region 6 3.33 (0.0031)
Food by population 7 2.20 (0.0327)
Error 566
Relative population variation 0.044
significantly different from those of individuals from all and 7), indicating that within an age group, the effect other populations (Fig. 2). of food availability on patterns of position occupied
differed among the 8 populations. The block effect (OBSERVER) was also significant for both early and
Position late instars (Tables 6 and 7).
Univariate analyses for early instars indicated that The effect of POPULATION(REGI0N) on positions FOOD*POPULATION interactions were significant was significant in multivariate analyses for both early for the frequencies of observations at the bottom and instars (Table 6 ) and late instars (Table 7). The effect of middle, and not significant for the frequencies of ob- REGION was not significant (Tables 6 and 7) for either servations at the wall and surface (Table 6). For ob- early or late instar larvae. The effect of FOOD on servations of early instars at the bottom, the slope positions was significant for late instar larvae (Table 7) for the Normal population was significant ( t =2.62, but not for early instar larvae (Table 6), whereas P= 0.0088) and positive (10.85 rt 4.17), indicating that the interaction of FOOD with POPULATION was sig- as food available prior to observation increased (i.e., nificant for both early and late instar larvae (Tables 6 hunger decreased), the frequency of observations at the
Table 7. Linear model analysis and MANOVA for positions for late instar larvae. Food availability is the covariate and populations the discrete variates. Tests for a difference between regions were done using the effect for populations within region as error. Relative population variation = 02p',,p,/(02,,,, + cr2,,,,,).
Source Df Bottom Middle Wall Surface MANOVA F F F F Lambda
(PI (PI (PI (PI (PI
Observer
Food
Region
Population within region 6 3.22 1.95 8.83 10.27 0.843 (0.0041) (0.0707) (0.0001) (0.0001) (0.0001)
Food by population
Error 540
Relative population variation 0.043 0.019 0.138 0.159

Table 8. Linear model analysis (early instar larvae) and analysis of covariance (late instar larvae) on risk score for position variables. Food availability is the covariate and populations the discrete variates. Tests for a difference between regions were done using the effect for populations within region as error. Relative population variation = 02,,,,/(02,,,, + u2,,,,).
Source Early instar larvae Late instar larvae
Df F P Df F P
Observer 1 149.24 0.0001 1 45.40 0.0001 Food 1 0.29 0.5883 1 1.01 0.3158 Region Population within region Food by population
1 6 7
2.35 4.80 2.57
0.1764 0.0001 0.0129
1 6
0.44 5.15
0.5330 0.0001
Error 566 547 Relative population variation 0.069 0.056 Slope fSE
bottom increased for the Normal population. Slopes for all other populations were nonsignificant (P>> 0.05). For observations of early instars in the middle the slope for the FermiLab population was significant (t = -2.87, P = 0.0031) and negative (-6.81 f2.32), whereas the slope for the Normal population was significant ( t = 2.04, P = 0.0418), and positive (4.56 k2.23). Thus, as food available prior to observation increased (i.e., hunger decreased), the frequency of observations in the middle decreased for the FermiLab population, but in- creased for the Normal populations. Slopes for early instars in all other were nonsignificant (P>> 0.05).
Univariate analyses for late instars indicated that FOOD*POPULATION interactions affected frequency of observations in the middle and at the surface, and that the FOOD effect was significant for frequencies of observations at the wall (Table 7). There were no signif- icant effects involving FOOD for frequencies of obser- vations at the bottom for late instar larvae (Table 7). The slope for the linear relationship of frequency in the middle vs food was significant (t = 2.92, P = 0.0036) and positive (6.13 + 2.10) for the population from FermiLab and significant (t = 2.17, P = 0.0303) and positive (3.93 f1.81) for the population from Normal. These slopes indicate that as food available prior to observa- tion increased (i.e., hunger decreased), the frequency of observations at middle increased for the FermiLab and Normal populations. Slopes of middle vs food for all other populations were not significant (P>>0.05). The slope for the linear relationship of frequency at the surface vs food was significant ( t = 2.96, P = 0.0032) and positive (12.59 f4.25) for the population from Durham, and was significant (t = 2.03, P = 0.0426) and positive (8.61 t4.24) for the population from Olive Branch. The slopes of frequency in the middle vs food were not significant (P>0.05) for all other populations. Across all populations, the slope for frequency at the wall was significant (t = -3.81, P < 0.0002), and nega- tive (-4.32 + 1.13). This slope indicates that as food available prior to observation increased (i.e., hunger
OIKOS 68:? (1993)
0.004+0.004
decreased), observations of late instar larvae at the wall decreased.
As with activity, although there was significant varia- tion among populations in the frequencies of positions. the proportion of total variation (=variation among populations + variation among individuals within populations) attributable to inter-population differ-ences was small (Tables 6 and 7). Only for the surface in later instar larvae did the proportion of variability at- tributable to populations rise above 0.15. Thus, al- though there is detectable inter-population variation in pattern of position occupied, most of the variation is among individuals within populations. Because of the interpopulation heterogeneity of relationships of posi- tion variables to food availability, further comparisons of patterns of positions occupied among populations are not useful. However, it is clear that patterns of positions occupied are not consistently related to sympatry vs allopatry. Food availability affects pattern of positions occupied, although the precise nature of the effect de- pends upon which population is examined.
Position risk scores
For early instar larvae, there were no significant effects of FOOD or REGION on risk scores, however there was a significant FOOD*POPULATION interaction (Table 8). This interaction indicates that hunger effects on the risk of predation associated with positions occu- pied for early instar larvae differ among populations. Estimated slope of risk score vs food was significant ( t= -2.40, P=0.0165) and negative (-0.0674 f0.0280) for the population from Durham and significant (t = 3.02, P = 0.0026) and positive for the population from Normal (0.0735 t0.0243). For the remaining 6 populations, the slope of risk score vs food was not significantly different from 0, indicating that hunger did not affect position risk score in these populations. For early instars, the block (OBSERVER) effect was
237

EARLY INSTAR
i f ! - P a a
a aa a i -
LATE INSTAR
- I Q Q I
p Q ~ b cI k g ab abc ab
a -
-0.1 0 F N R W A D O V
POPULATION Fig. 3. Least squares means (+ SE) of predation risk scores based on patterns of positions occupied for Aedes triseriatus larvae from eight populations in two age classes. Population abbreviations as in Fig. 1. For early instars, least squares means for populations from Normal, IL, and Durham, NC should be interpreted with caution because the slopes relating position risk scores to food availability for these populations differed from those of the other six populations (see text and Table 8). Within an age class, least squares means marked with the same letter are not significantly different (overall a = 0.05).
significant (Table 8). For early instars, the POPULA- TION(REGI0N) effect was also significant (Table 8), despite the fact that this risk score was not consistently associated with sympatry vs allopatry (Table 8). The proportion of variation in risk score associated with POPULATION was low (Table 8), indicating that most intraspecific variation in position risk score is due to variation among individuals.
For late instar larvae, position risk scores were significantly affected by POPULATION(REGI0N) (Table 8). Interactions of FOOD with REGION or POPULATION(REGI0N) were not significant (P>>0.05), and the FOOD effect was not significant
(Table 8) indicating that position risk scores do not change with hunger. The REGION effect was not sig- nificant (Table 8), indicating that although there is inter-population variation in position risk scores, this variation is not consistently related to sympatry vs allopatry. As was true for early instars, most of the variation in risk scores for later instars was among individuals within populations, rather than between populations (Table 8). For late instar larvae, the block (OBSERVER) effect was significant (Table 8).
Pairwise differences in position risk scores for late instar larvae are summarized in Fig. 3. For position risk scores of early instars, the only significant pairwise dif- ferences involved the Worcester population, which had a significantly lower risk score than all other popula- tions (Fig. 3). Tests involving adjusted mean risk scores for early instar larvae from Durham and Normal should be interpreted with caution because for these popula- tions, position risk scores are differentially affected by food (see Table 8). For late instar larvae, individuals from Durham had the highest position risk scores, which were significantly greater than those of indi-viduals from Vero Beach, FermiLab, and Normal (Fig. 3). Individuals from Normal had the lowest posi- tion risk scores, which were significantly different from those of individuals from Olive Branch, Worcester. Romeo, and Durham (Fig. 3). Position risk scores for late instar individuals from all other populations were not significantly different (Fig. 3).
Discussion Although we find significant differences in behavior patterns among the eight populations we studied, we do not find consistent differences in behavior patterns be- tween populations of A. triseriatus from sympatry vs allopatry with the predator T. rutilus. Because the indi- viduals used in this study were reared in a common laboratory environment, differences among populations strongly suggest a genetic basis for behavioral dif-ferentiation. The lack of a consistent difference be- tween sympatric and allopatric populations suggests that although behavior pattern is related to risk of predation (Juliano and Reminger 1992), pattern of geographic variation in behavior is not determined solely, or even primarily, by predation by T. rutilus. It seems more likely that behavior patterns are deter-mined by a variety of factors (e.g., resource availability and type, climate, random differentiation of isolated populations). Whether predation has no selective effect on behavior (e.g., if selection by other factors is always more important), or the role of predation in shaping behavior is variable (e.g., if selection due to predation is important at some sites, but not at others), or selection by predation affects behavior at some sites, and other
OIKOS 68 2 (lL9Y3) 238

traits (e.g., life history) at other sites is at present un- known.
Our results indicate no consistent differences in fixed patterns of behavior. This experiment does not test for possible regional differences in responses to the pres- ence of T. rutilus. Juliano and Reminger (1992) found that two populations (Vero Beach and Normal) did not differ in their behavioral responses to T. rutilus. Behav-ioral changes observed by Juliano and Reminger (1992) were quite subtle, and were based on short term (- 1 h) exposure to T. rutilus. Juliano and Reminger (1992) suggested that more pronounced, and perhaps differ- ential, behavioral responses may result from long-term (days or weeks) exposure to T. rutilus. Clearly, further investigations of flexible responses to the presence of T. rutilus are needed in order to test fully whether behav- ioral responses to this predator are associated with sym- patryiallopatry to this predator.
Despite significant differences in behavior among the eight populations, the actual proportion of intraspecific variation attributable to inter-population differences is small, and most of the intraspecific variation in behavior is among individuals within a population. If this pattern of phenotypic variation indicates a correspondingly low proportion of genotypic variation among populations, this suggests that selection on behavior within a popula- tion (whatever the cause) is relatively weak, and in- capable of eliminating intra-population behavioral variation. It is also likely that some of the intra-population variation in behavior results from dif-ferences between sexes, and variation in age and de- velopmental stage. Our categorization of early (1st and 2nd) and late (3rd and 4th) instar larvae may have accentuated intra-population behavioral variation.
The specific differences among populations in activity patterns are sometimes inconsistent for early and late instar larvae. For example, among early instar larvae, individuals from Durham feed less frequently and rest more frequently than individuals from other popula- tions, yet among late instar larvae this pattern is not present (see Fig. 1).
Although past observations have shown that popula- tions from Normal and Vero Beach differ in activity pattern (Juliano and Reminger 1992), this pairwise dif- ference is not significant in the present study. This dis- crepancy may be the result of testing using a multiple comparison procedure, which imposes a lower compari- son-wise a. In fact, if the observations for only these two populations are compared, differences in behavior patterns are significant (P<0.05) in the present ex-periment. As in past studies of behavior (Juliano and Reminger 1992), individuals from Vero Beach thrash less than those from Normal. Nonetheless, the present data illustrate that differences in activity pattern be- tween these two ~ o ~ u l a t i o n s are not as extreme as be- havioral differences between other pairs of populations.
Our estimate of risk of predation based on activity pattern supports the conclusion that sympatric popula-
. &
OIKOS 68 2 (1993)
tions d o not uniformly experience strong selection for activity patterns that reduce risk of predation. Although activity risk scores differ significantly among popula- tions, there are no significant differences between sym- patric and allopatric populations. Differences among early instars in risk scores show that activities of young larvae usually produce homogeneous risk of predation. The only significant differences for early instars are for Durham (low risk) vs FermiLab and Ashland (high risk). Interestingly, Livdahl's (1979) test of vulnerability of first instar A. triseriatus to predation used larvae from Durham and FermiLab, and he found that larvae from Durham were killed at a lower rate than larvae from FermiLab. Livdahl's (1979) result is exactly what would be expected for early instars based on the activity risk scored given in Fig. 2, suggesting that the difference observed by Livdahl (1979) may be a product of differ- ences in activity patterns among first instars. Among late instar larvae, there are more differences in risk scores, but the trends observed among early instar lar- vae are absent. The most striking result for late instars is that risk of predation is very high for Durham and Olive Branch populations, and very low for Ashland and Vero Beach populations (see Fig. 2). The differences in inter- population pattern of activity risk scores between early and late instar larvae indicate that experiments testing vulnerability to predation at a single stage (e.g., Livdahl 1979) may not lead to accurate predictions of the total impact of predation, because relative vulnerability changes over ontogeny.
Food availability during the 24 h preceding observa- tion affected frequencies of three activities (browsing, thrashing, and in late instars, resting) and all four posi- tions in one or more populations. Food availability pre- sumably alters behavior by affecting level of hunger. Our risk scores for activities indicate that for late instar larvae, increasing food availability prior to observation (= decreasing hunger) results in lower risk scores. and presumably lower risk of predation. supporting the hypothesis that hunger induces riskier behavior patterns in A. triseriatus larvae. Among late instar larvae, chang- es in freauencies of individual activities vield no clear prediction of how hunger changes risk of predation. Increased hunger leads to decreases in both thrashing and resting, the riskiest and safest activities, respec- tively (Juliano and Reminger 1992). Our risk score in- dicates that decreased risk associated with decreased thrashing in hungry larvae is more than offset by in- creased risk due to decreased resting and increased browsing, an activity with intermediate risk. Risk asso- ciated with activity pattern was more consistently re- lated to hunger than was risk associated with positions. As noted by Juliano and Reminger (1992) activity and position are correlated in A. triseriatus, and it is difficult to say which is biologically more important. It appears. however, that activity is more closely correlated with this measure of risk.
Whether the risk index we used and the risk scores
239

- -
derived from this index are the best and most bio- logically meaningful measures of risk of predation in A. triseriatus is not known. If these risk scores are good indicators of risk of predation, then we would predict that: 1)hungrier larvae should have a higher short-term death rate than better fed larvae; and 2) populations with lower risk scores should have lower short-term death rates than populations with higher risk scores. It is important to emphasize that only short term (<24 h) death rates may be predicted based solely on the risk score. Over longer periods, developmental changes in behavior and differences in development rate and time to pupation may also affect death rate. If short-term death rates are related to hunger, low food availability or crowding should dramatically increase overall death from predation in A. triseriatus, because hungrier larvae will experience greater mortality, and because poorly fed larvae develop more slowly, they will be exposed to T. rutilus predation for a longer period.
Finally, the significant observer effects found throughout this study illustrate the importance of con- trolling for differences among observers (e.g., differ- ences in technique or perception). In our study, because both observers took data from all populations, we can control statistically for these observer effects. Observer effects should be considered likely in behavioral studies of mosquito larvae.
Acknowledgements -We thank L. P. Lounibos, M. Willey, and C. B. Knisley for sending us larvae, C. B. Knisley, R. Escher, W. A. Frankino, P. M. LConard. C. P. Grill, L. Reminger, M. Nannini, and J. Fuller for aid in the laboratory and field, V. A. Borowicz, L. P. Lounibos, E. D. Walker. T. P. Livdahl, P. M. LConard and W. A . Frankino for comments on the manuscript or useful discussion, and The Parklands Foundation (Normal. IL), Fermi National Accelerator Laboratory (FermiLab, IL), Horseshoe Lake State Park (Ollve Branch, IL), Duke Uni- versity (Durham, NC), Stony Creek Metro Park (Romeo, MI), Randolph Macon College (Ashland, VA), and Florida Medical Entomology Laboratory (Vero Beach, FL) for access to col- lecting sites. This research was supported by grants from NIH (1 R15 AI29629-OI), NSF (BSR9(M6452), and Illinois State University to SAJ.
References Arnold, S. J. and Bennett, A . F. 1984. Behavioral variation in
natural populations 111. Antipredator displays in the garter snake Thamnophls radix. - Anim. Behav. 34: 1108-1118.
Bradshaw, W. E. and Holzapfel, C. M. 1983. Predator-medi- ated non-equilibrium coexistence of tree-hole mosquitoes in southeastern North America. - Oecologia 57: 239-256.
- and Holzapfel, C. M. 1985. The distribution and abundance of treehole mosquitoes in eastern North America: Perspec- tives from Florida. - In: Lounibos, L. P., Rey, J. R., and Frank, J. H. (eds), Ecology of mosquitoes: proceedings of a workshov. Florida Medical Entomolo~v Laboratorv. Vero ", Beach, GL, pp. 3-24.
Darsie. R. F. Jr. and Ward. R. A. 1981. Identification and geographical distribution of the mosquitoes of North America, north of Mexico. - Mosq. Syst. Suppl. 1: 1-313.
Dill, L. M. and Fraser, A. H. G. 1984. Risk of predation and the feeding behavior of juvenile coho salmon (Oncorhyn- chus kisutch). - Behav. Ecol. Sociobiol. 16: 65-71.
Fawcett, M. H. 1984. Local and latitudinal variation in predation on an herbivorous marine snail. - Ecology 65: 1214-1230.- --.-
Fraser, D. F. and Gilliam, J. F. 1987. Feeding under predation hazard: response of the guppy and Hart's rivulus from sites with contrasting predation risk. - Behav. Ecol. Sociobiol. 21: 203-209.
Giles, N. J. and Huntingford, F. A. 1984. Predation risk and interpopulation variation in anti-predator behaviour in the three-spined stickleback, Gasterosteus aculeatus L. -Anim. Behav. 32: 264-375.
Gilliam, J. F. and Fraser, D. F. 1987. Habitat selection under predation hazard: A test of a model with foraging minnows. - Ecology 68: 1856-1862.
Godin, J. J. and Sproul. C. D. 1988. Risk taking in parasitized sticklebacks under threat of predation: effects of energetic need and food availability. - Can. J. Zool. 66: 2360-2367.
Herzog, H. A, , Jr. and Schwartz, J . M. 1990. Geographic variation in the anti-predator behaviour of neonate garter snakes, Thamnophis sirta1i.s. - Anim. Behav. 30: 597401.
Holomuzki, J . R. and Short, T. M. 1988. Habitat use and fish avoidance behaviors by the stream-dwelling isopod Lirceus fontinalis. - Oikos 52: 79-86.
Juliano, S. A. 1989. Geographic variation in vulnerability to predation and starvation in larval treehole mosquitoes. -Oikos 55: 99-108.
- and Reminger, L. 1992. The relationship between vulner- ability to predation and behavior of larval treehole mosqui- toes: geographic and ontogenetic differences. - Oikos 63: 465-476.
Kats, L. B.. Petranka. J . W. and Sih, A. 1988. Antipredator defenses and the uersistence of am~hibian larvae with fish. - Ecology 65: 1865-1870.
Lechowicz, M. J. 1982. The sampling characteristics of elec- tivity indices. - Oecologia 52: 22-30.
Livdahl, T. P. 1979. Evolution of handling time: The functional response of a predator to the density of sympatric and allopatric strains of prey. - Evolution 33: 765-768.
- 1984. Interspecific interactions and the r-K continuum: Laboratory comparisons of geographic strains of Aedes tri- seriatus. - Oikos 42: 193-202.
Magurran, A. E . 1990. The inheritance and development of minnow anti-predator behaviour. - Anim. Behav. 39: 834-842.
Martin, P. and Bateson. P. 1986. Measuring behaviour. An introductory guide. - Cambridge Univ. Press, Cambridge.
Merritt, R. W., Dadd. R. H.. and Walker, E. D. 1992. Feeding behavior, natural food, and nutritional relationships of lar- val mosquitoes. - Annu. Rev. Entomol. 37: 349-376.
Milinski. M. 1985. Risk of predation of parasitized sticklebacks (Gasterosteus aculeatus L.) under competition for food. -Behaviour 93: 203-216.
- and Heller, R. 1978. Influence of a predator on the optimal foraging behaviour of sticklebacks (Gasterosteus aculeatus). - Nature 275: 642444.
Neter, J. and Wasserman, W. 1974. Applied linear statistical models. Regression, analysis of variance, and experimental designs. - Richard D. Erwin. Homewood, IL.
Novak. R. J. and Shroyer, D . A. 1978. Eggs of Aedes rriseria- tus and A. het~dersoni: A method to stimulate optimal hatch. - Mosq. News 38: 515-521.
Riechert, S. E. and Hedrick, A. V. 1990. Levels of predation and genetically based anti-predator behaviour in thc spider. Agelenopsis aperta. - Anim. Behav. 40: 679-687,
SAS Institute Inc. 1987. SASlSTAT user's guide for personal computers. version 6 edition. - SAS Institute Inc., Cary, NC.
Sih. A. 1986. Antipredator responses and the perception of danger in mosquito larvae - Ecology 67: 434441.
240 OIKOS 08.2 119O.3i

- 1987. Predators and prey lifestyles: An evolutionary and Aedes triseriatus (Diptera: Culicidae). - J . Med. Entomol. ecological overview. - In: Kerfoot, W. C. and Sih, A. 28: 581-599. (eds). Predation: direct and indirect impacts on aquatic Werner, E. E. , Gilliam, J. F., Hall, D. J . , and Mittlebach, G. communities. Univ. Press of New England, Hanover, NH, G. 1983. An experimental test of the effects of predation pp. 203-224. risk on habitat use. - Ecology 62: 11G125.
Walker, E. D. and Merritt. R. W. 1991. Behavior of larval
16 OIKOS 68:2 (1993)