Before the Federal Communications Commission...
74
Before the Federal Communications Commission Washington, D.C. 20554 In the Matter of ) ) Connect America Fund ) WC Docket No. 10-90 ) A National Broadband Plan for Our Future ) GN Docket No. 09-51 ) High-Cost Universal Service Support ) WC Docket No. 05-337 AFFIDAVIT OF TREVOR R. ROYCROFT, PH.D. ON BEHALF OF THE NATIONAL ASSOCIATION OF STATE UTILITY CONSUMER ADVOCATES, THE MAINE OFFICE OF PUBLIC ADVOCATE, OFFICE OF THE OHIO CONSUMERS’ COUNSEL, PENNSYLVANIA OFFICE OF CONSUMER ADVOCATE, AND THE UTILITY REFORM NETWORK JULY 12, 2010
Transcript of Before the Federal Communications Commission...

Before the Federal Communications Commission
Washington, D.C. 20554 In the Matter of ) ) Connect America Fund ) WC Docket No. 10-90 ) A National Broadband Plan for Our Future ) GN Docket No. 09-51 ) High-Cost Universal Service Support ) WC Docket No. 05-337
AFFIDAVIT OF TREVOR R. ROYCROFT, PH.D.
ON BEHALF OF
THE NATIONAL ASSOCIATION OF STATE UTILITY CONSUMER ADVOCATES,
THE MAINE OFFICE OF PUBLIC ADVOCATE, OFFICE OF THE OHIO CONSUMERS’ COUNSEL, PENNSYLVANIA
OFFICE OF CONSUMER ADVOCATE, AND THE UTILITY REFORM NETWORK
JULY 12, 2010

Affidavit of Trevor R. Roycroft, Ph.D. On Behalf of NASUCA
WC Docket No. 10-90; GN Docket No. 09-51; WC Docket No. 05-337 _________________________________________________________________________________________________________
ii
Contents I. Statement of Qualification and Introduction ........................................................................ 1
A. Statement of Qualifications .............................................................................................. 1 B. Introduction ...................................................................................................................... 3
II. Preliminary Comments ........................................................................................................ 4 A. Auditing USF Recipients will Promote the Commission’s Broadband Objectives ......... 4 B. Shared Facilities must be Addressed ................................................................................ 6 C. Costs and Revenues Must be Addressed .......................................................................... 6 D. The Broadband Speed Target Impacts Modeling ............................................................. 7 E. Staff’s “Second Price” Interpretation of Necessary Support Reflects an Unpleasant Reality about “Market Based” Distribution of Support .............................................................. 9 F. The Commission Must Clearly Separate Support for Fixed Broadband from Mobility Broadband Support ................................................................................................................... 10
III. Specific Issues for the NBP Model .................................................................................... 11 A. The FCC’s Previous Universal Service Cost Modeling ................................................. 11 B. The FCC 97-157 Cost Criteria ....................................................................................... 13 C. The NBP Model does not determine least-cost technology, excludes network functions or elements, and does not apply a Long Run Incremental Cost Approach—FCC 97-157 Criteria (1), (2), and (3) ............................................................................................................. 14 D. Compliance Costs Should be Considered ...................................................................... 16 E. The NBP Model’s Cost of Capital is not Reflective of Risk—FCC 97-157 Criterion (4) 17 F. Depreciation Rates—FCC 97-157 Criterion (5) ............................................................ 19 G. The Cost Model Must Estimate the Cost of Providing Service for all Businesses and Households within a Geographic Region—FCC 97-157 Criterion (6) .................................... 20
1. Staff’s Approach to Demand Prevents the Modeling of a Reasonable Technology Upgrade Path ................................................................................................................................. 22 2. Staff’s Approach to Demand Modeling will Deny Broadband Benefits to Rural Areas 23
H. The NBP Model’s Short-Run View Results in the Implicit and Inappropriate Allocation of Costs to Voice Services—FCC 97-157 Criterion (7) ........................................................... 24 I. Only an inappropriate allocation of shared facilities costs between voice and broadband would support voice rate rebalancing. ...................................................................................... 26 J. The NBP Model is a Closed Model—FCC 97-157 Criteria (8) and (9) ........................ 27 K. Granularity of the Cost Estimate—FCC 97-157 Criteria (10) ....................................... 29 L. Other Issues with the Transparency of the NBP Model ................................................. 30
1. Revenue Modeling ......................................................................................................... 30 2. The Model Should Run on a PC ..................................................................................... 31 3. Development of Annual Charge Factors and Investment Levels is not Explained ........ 31 4. Data Weakness ............................................................................................................... 32 5. Fixed 4G Business Model .............................................................................................. 34 6. Incorporation of Scale Economies is not Clear .............................................................. 35
M. Conclusion on the Broadband Model ............................................................................. 36 IV. Issues with Auctions .......................................................................................................... 36
A. Little Evidence Supports the Proposition that Auctions will Succeed ........................... 37 1. Market Entry is Critical to Auction Success .................................................................. 37 2. Experience in Other Nations Shows a Mixed Bag of Results ........................................ 38
B. Alternative Approaches Given the Likelihood of Auction Failures .............................. 39
Affidavit of Trevor R. Roycroft, Ph.D. On Behalf of NASUCA
WC Docket No. 10-90; GN Docket No. 09-51; WC Docket No. 05-337 _________________________________________________________________________________________________________
iii
C. Expedited Process for Distributing Support ................................................................... 42 D. Recommendations for Auction Structure ....................................................................... 44
1. Prequalification and Post-Grant Outcomes .................................................................... 44 2. A Model Should be used to Set Reserve Prices ............................................................. 45 3. Sealed Bid Auctions are Likely Superior for Universal Service Auctions .................... 46 4. Bidding for Support Must Account for the Price of Supported Services ....................... 48 5. Compliance of Auction Winners .................................................................................... 49
E. Conclusion of Auction Discussion ................................................................................. 49 V. Conclusion ......................................................................................................................... 50 Appendix: The FCC 97-157 Criteria ............................................................................................ 51

Affidavit of Trevor R. Roycroft, Ph.D. On Behalf of NASUCA
WC Docket No. 10-90; GN Docket No. 09-51; WC Docket No. 05-337 _________________________________________________________________________________________________________
1
Before the Federal Communications Commission
Washington, D.C. 20554 In the Matter of ) ) Connect America Fund ) WC Docket No. 10-90 ) A National Broadband Plan for Our Future ) GN Docket No. 09-51 ) High-Cost Universal Service Support ) WC Docket No. 05-337
I. Statement of Qualification and Introduction
A. Statement of Qualifications
My name is Trevor R. Roycroft. My business address is 51 Sea Meadow Lane, Brewster,
MA, 02631. I am an independent consultant providing economic and policy analysis related to
telecommunications, public utility, and information technology industries.
With regard to my educational background, I hold three degrees. I received the Bachelor
of Arts degree in Economics with a minor in Statistics from California State University,
Sacramento. The degree was awarded with honors. I also hold the Master’s and Doctor of
Philosophy in Economics from the University of California, Davis. My Ph.D. fields of
specialization are Economic Theory, Industrial Organization, Public Sector Economics, and
Economic History.
I have nineteen years of experience in the public utility field. My experience began with
my employment at the Indiana Office of Utility Consumer Counselor (OUCC) during the years
1991 to 1994. For most of my tenure at the OUCC, I was Chief Economist. My primary areas
of analytical responsibility at the OUCC related to telecommunications regulation and policy.
I have been involved in higher education related to the telecommunications field. From
1994 to 2004, I was a professor in the J. Warren McClure School of Communication Systems

Affidavit of Trevor R. Roycroft, Ph.D. On Behalf of NASUCA
WC Docket No. 10-90; GN Docket No. 09-51; WC Docket No. 05-337 _________________________________________________________________________________________________________
2
Management at Ohio University. At Ohio University I was granted tenure and promoted to
Associate Professor in the spring of 2000. My primary areas of teaching responsibility were
graduate and undergraduate courses covering regulatory policy, the economics of the
telecommunications industry, consumer issues with telecommunications markets, and
telecommunications technology. I left Ohio University to pursue consulting on a full-time basis
at the end of 2004.
I have published research in refereed journals including The Journal of Regulatory
Economics, Contemporary Economic Policy, and Telecommunications Policy. I have
contributed chapters that have been published in book volumes related to the telecommunications
field. I have provided referee service to various academic journals including: The Journal of
Regulatory Economics, Telecommunications Policy, Social Science Computer Review, Utilities
Policy, Journal of Economic Studies, and Communications of the Association for Information
Systems.
I have provided analysis and testimony as an independent consultant since 1994. In my
role as a consultant, I have addressed a wide variety of issues including: incentive regulation
plans, cost-of-service studies, cost modeling, service quality, merger review, and competition. I
have filed testimony, reports, and affidavits before state regulatory commissions, before the
Federal Communications Commission (FCC), and before the Canadian Radio-Television and
Telecommunications Commission. I have also provided expert services in class action lawsuits
associated with the public utility field.
With regard to the matters the Commission is considering in this Notice of Inquiry (NOI),
I have been involved in numerous cost modeling proceedings at the state level, including those
that addressed UNE pricing. I participated, at the FCC’s request, in a 1997 FCC workshop on
cost modeling. I have prepared affidavits or assisted with the preparation of comments in FCC
proceedings related to both universal service funding and broadband policy. I have advised

Affidavit of Trevor R. Roycroft, Ph.D. On Behalf of NASUCA
WC Docket No. 10-90; GN Docket No. 09-51; WC Docket No. 05-337 _________________________________________________________________________________________________________
3
TURN in California on matters relating to reverse auctions, and have participated in a working
group process initiated by the California Public Utilities Commission (CPUC) regarding the use
of reverse auctions to establish high-cost support for voice services in that state. I have also
advised TURN on matters relating to the California Advanced Services Fund (CASF), which was
initiated by the CPUC to provide support for broadband deployment in unserved and
underserved areas in that state. A copy of my curriculum vitae is provided as Attachment 1 to
this Affidavit.
B. Introduction
The FCC staff has pursued an ambitious modeling agenda, and the staff should be
commended for their efforts in developing the National Broadband Plan (NBP) model.1 The
FCC staff’s modeling offers a valuable start to a process that can be used by the Commission to
address the important questions associated with expanding the availability of affordable
broadband services to all Americans. However, the staff’s model is only an initial step in the
process of universal service reform. For example, the staff’s model does not address key
questions, such as what constitutes affordable broadband service, existing implicit support for
ILEC broadband, or how state and federal broadband programs will be coordinated. The main
advantage of the staff’s approach lies in evaluating both expected costs and revenues, rather than
focusing on costs alone, as was the case with current approach to high-cost support, which
applies the Hybrid Cost Proxy Model (HCPM) results to a cost benchmark. By examining costs
and revenues, the staff’s approach takes a step in the right direction.
1 The NOI refers to the staff’s model as the “National Broadband Plan model.” However, the staff documentation identifies the model alternatively as the “Broadband Availability Gap model” or the “Broadband Assessment Model (BAM).” For consistency, I will use the “NBP model” designation, although direct quotations from documents may contain any of these names.

Affidavit of Trevor R. Roycroft, Ph.D. On Behalf of NASUCA
WC Docket No. 10-90; GN Docket No. 09-51; WC Docket No. 05-337 _________________________________________________________________________________________________________
4
The staff report and associated documentation2 leave many questions unanswered. The
information that has been provided by the staff—in these reports, through the workshop, and
through the web site—is insufficient to allow for a full evaluation of the model. What is clear
from these materials is that the current iteration of the NBP model has serious deficiencies that
prevent it from being a useful tool for the Commission. Certain choices made by the staff with
regard to modeling introduce fatal flaws in the analysis. This Affidavit will address the shortfalls
that I have been able to identify to date through the review of the available information.
II. Preliminary Comments
Before turning to a discussion of the NBP model, I will provide some preliminary
comments on matters that ultimately tie into the modeling objectives, and which also reflect the
confluence of factors that the Commission must address when developing its approach to deliver
affordable and high-quality broadband to all Americans.
A. Auditing USF Recipients will Promote the Commission’s Broadband Objectives
The Commission has requested comment on the merits of jointly supporting voice and
broadband services.3 There is little doubt that significant economies can be gained if voice and
broadband services are jointly supplied by a single company in high-cost areas.4 To begin the
process of exploiting these economies, there is a critical need for a thorough audit of the current
2 “The Broadband Availability Gap,” OBI Technical Paper No. 1; “Broadband Assessment Model (BAM),” “Data from the Technical Paper”; Transcript of the May 6, 2010 workshop. 3 NOI, ¶ 17. 4 While it is likely that overall efficiencies can be improved by the joint provision of voice and broadband, the Commission should not rule out the possibility that diseconomies of joint provision exist and could be substantial for some consumers. As the “Broadband Availability Gap” points out, substantial costs could be avoided if 250,000 housing units were served by satellite. “Broadband Availability Gap,” p. 5. Given the current deficiencies associated with the use of satellite for voice services, this would suggest that separate provision of voice and broadband could be more efficient for some households. The Commission must ultimately weigh the impact of relying on satellite, which reduces costs, with the fact that satellite technology will not be able to keep up with terrestrial wireline broadband speeds, thus creating a disparity of available speeds between urban and rural areas.
Affidavit of Trevor R. Roycroft, Ph.D. On Behalf of NASUCA
WC Docket No. 10-90; GN Docket No. 09-51; WC Docket No. 05-337 _________________________________________________________________________________________________________
5
high-cost universal service program, including the production of a detailed account of the level
of broadband service already available from supported voice-service providers. An audit of
current high-cost funding recipients can contribute to the accurate assessment of broadband
deployment and better identify funds that can be freed up to enable new broadband service in
unserved areas. An audit has the distinct advantage of providing factual information, which can
reduce the reliance on model-based projections. The ability of the FCC to manage the size of the
fund and to efficiently target support depends on improved verification procedures. The FCC
should conduct a baseline audit of supported companies that collects key information on:
» Which supported companies have deployed broadband; » The extent of broadband availability within supported companies’ service areas; » The quality of broadband, as measured in upload and download speeds available from
supported companies;
» The technologies used and specific investments made that have enabled broadband; » The price of broadband services available from supported companies; » Current voice and broadband subscription rates and revenues for each supported
company, and;
» Specific technical impediments that have limited ubiquitous broadband deployment in a supported broadband provider’s service area.
Adding this information to that currently required by the Commission will enable a better
assessment of the impact of current universal service funding on broadband deployment. Such
an audit will also help the FCC determine the investments necessary to make high-quality
broadband universally available, and will also allow the Commission to identify best practices.
Support for a unified network platform that delivers voice and broadband can help to ensure
high-quality voice and broadband services at lower costs.

Affidavit of Trevor R. Roycroft, Ph.D. On Behalf of NASUCA
WC Docket No. 10-90; GN Docket No. 09-51; WC Docket No. 05-337 _________________________________________________________________________________________________________
6
B. Shared Facilities must be Addressed
As the Commission moves forward to address the revision of universal service funding,
and the addition of broadband to the services that are eligible to receive support, the Commission
must be prepared to address issues surrounding the sharing of facilities associated with the joint
provision of voice and broadband services. The Commission’s current universal service funding
approach does not address the fact that broadband services are being provided by some supported
companies, and thus already share significant investments with the supported voice services.
This is an unreasonable outcome, as current support comes only from voice services—broadband
deployment has been implicitly supported through funds raised to support universal service
objectives associated with voice services.
As will be discussed in more detail below, a reasonable forward-looking perspective
regarding residential telecommunications networks points to the growth of integrated provision
of voice and broadband, and possibly video services. Evidence also points to the declining
impact of voice service on the overall cost of the delivery of residential bandwidth. As a result, a
reasonable evaluation of the costs of shared facilities should result in a growing proportion of
costs being associated with broadband services (i.e., data, and where available, video services).
C. Costs and Revenues Must be Addressed
When the FCC last addressed the appropriate cost methods to determine support for voice
services, it appropriately identified a forward-looking economic cost methodology.5 While the
Commission discussed the application of a revenue benchmark to determine the appropriate level
of support for non-rural carriers,6 the Commission ultimately decided on a cost-based
benchmark, which continues to this day.7 As a result of the failure to evaluate revenues, the true
5 In the Matter of Federal-State Joint Board on Universal Service, CC Docket 96-45, Report and Order, May 8, 1997, FCC 97-157 (“USF First Report and Order”), ¶ 223. 6 Id., ¶ 15. 7 See, e.g., In the Matter of High-Cost Universal Service Support, Federal-State Joint Board on
Affidavit of Trevor R. Roycroft, Ph.D. On Behalf of NASUCA
WC Docket No. 10-90; GN Docket No. 09-51; WC Docket No. 05-337 _________________________________________________________________________________________________________
7
level of support needed to provide voice services is unknown. Moving forward, the Commission
must refocus its vision on the determination of support needed for the combined provision of
voice and data services. The Commission must accurately evaluate both the costs and revenues
associated with the provision of all supported services (and also consider the revenues that may
be accruing to the service provider over supported facilities from non-supported services, e.g.,
video services).8
D. The Broadband Speed Target Impacts Modeling
Another preliminary matter relates to the broadband speed objectives that are pursued in
the National Broadband Plan and modeled by the staff. The 4 Mbps downstream / 1 Mbps
upstream speeds (4/1) in the NBP model and National Broadband Plan do not reflect forward-
looking technology, and certainly do not comport with current U.S. service availability in urban
areas. According to a recent study by Akamai, a company which has the ability to
geographically track connection speeds of Internet users, the current U.S. national average
download speed is 3.8 Mbps, just shy of the 4 Mbps level targeted by the Commission. This
suggests that the 4 Mbps standard is not forward-looking, especially given the 20-year planning
horizon utilized by the NBP model. However, the Commission must address the disparity in
urban and rural data speeds that is implicit in the 3.8 Mbps average reported by Akamai. The
Akamai report also shows that in U.S. urban areas speeds already outstrip the 4 Mbps target, as
Universal Service, Joint Petition of the Wyoming Public Service commission and the Wyoming Office of Consumer Advocate for Supplemental Federal Universal Service Funds for Customers of Wyoming’s Non-Rural Incumbent Local Exchange Carrier. WC Docket No. 05-337, CC Docket 96-45. Order on Remand and Memorandum Opinion and Order, April 16, 2010, FCC 10-56, ¶ 7. 8 The staff model assumes that average revenue per unit will “evolve slowly over time.” The underpinnings of this assumption must be explored in detail.

Affidavit of Trevor R. Roycroft, Ph.D. On Behalf of NASUCA
WC Docket No. 10-90; GN Docket No. 09-51; WC Docket No. 05-337 _________________________________________________________________________________________________________
8
Table 1: Average Download Speeds in U.S. urban areas identified by Akamai (4th Quarter 2009)9
City Connection Speed (Mbps)
Oakland, CA 6.7 San Jose, CA 6.5 Austin, TX 5.8 Las Vegas, NV 5.6 Baltimore, MD 5.4 San Diego, CA 5.3 Rochester, NY 5.2 Providence, RI 5.2 New York, NY 5.1 Pittsburgh, PA 5.1
shown in Table 1, above.10 Thus, it is clear that the 4 Mbps download standard does not reflect a
“reasonably comparable” standard with regard to speeds that are already available in urban areas
in the U.S. The Akamai data clearly show that the FCC’s 4 Mbps download objective is out of
synch with current broadband speeds available in urban areas in the U.S.11 The use of the 4/1
standard substantially tilts the playing field against rural areas, especially in the context of the
National Broadband Plan’s proposal to bring 100Mbps service to 100 million households.12 The
4/1 speed target is troubling given that the FCC’s stated objective is to correct the market failure
associated with the outright unavailability of broadband in rural areas, and to ensure “broadband
access to all people of the United States.”13 Given the current average U.S. broadband speeds,
9 “The State of the Internet, 4th Quarter 2009,” Akamai Technologies. http://www.akamai.com/stateoftheinternet/, p. 15. 10 “The State of the Internet, 4th Quarter 2009,” Akamai Technologies. http://www.akamai.com/stateoftheinternet/, p. 15. The Akamai report also shows much higher speeds associated with urban areas that have a major university. 11 The National Broadband Plan (p. 135) states that the 4/1 standard is consistent with the “typical” user’s experience today. However, this reliance on average speeds overlooks the statutory provisions that state that urban and rural areas should have reasonably comparable access to advanced services. Thus, a more appropriate metric is the level of service available in urban areas [Telecom Act §254(b)(3)]. 12 “Connecting America: The National Broadband Plan,” p. 9. 13 Title VI Sec. 6000(k)(2)(A).

Affidavit of Trevor R. Roycroft, Ph.D. On Behalf of NASUCA
WC Docket No. 10-90; GN Docket No. 09-51; WC Docket No. 05-337 _________________________________________________________________________________________________________
9
the 4/1 standard will simply replace the market failure of outright unavailability with another
market failure of slow broadband.
It should also be noted that the 4/1 standard has had a substantial impact on the modeling
efforts undertaken by staff. As will be discussed in more detail later in this Affidavit, the staff’s
demand projections and technology modeling are hindered by the 4/1 standard. The staff makes
unreasonable assumptions regarding demand growth and the need for network management
practices that reflect the constrictive 4/1 standard. Rather than modeling actual projected
demand, staff chooses to model a truncated version of that demand. This is unacceptable, and
results in a distorted assessment of the costs of delivering high-quality broadband in rural areas.
E. Staff’s “Second Price” Interpretation of Necessary Support Reflects an Unpleasant Reality about “Market Based” Distribution of Support
The results of the staff’s modeling indicate that the broadband gap is about $8 billion if
the least-cost technology is utilized.14 However, staff estimates the overall gap at $23 billion,
i.e., $15 billion higher than the least-cost solution.15 The size of the gap reflects the staff’s
application of auction theory to conclude that the costs of the second-most-inefficient technology
are the ones that matter. This conclusion reflects the apparent belief on the part of the staff that a
market-based mechanism will be used to distribute support, but that bidding competition will be
weak:
Let’s just take a simplified example, so imagine that Rob and I are operating competing companies with competing technologies. I can do something for $10, he can do it for $100. Let me also, for simplicity, assume a disbursement mechanism, don’t know if this is what it’s going to look like but imagine a world where the government is auctioning off support levels. . . . But if I have perfect information that I can do it for $10, but it’s going to take him a hundred, I would want to do it for $99.99. So I want to hold out for as much as I can.
14 “The Broadband Availability Gap,” p. 39. 15 “The Broadband Availability Gap,” p. 1.

Affidavit of Trevor R. Roycroft, Ph.D. On Behalf of NASUCA
WC Docket No. 10-90; GN Docket No. 09-51; WC Docket No. 05-337 _________________________________________________________________________________________________________
10
Now, we may complain as taxpayers that, you know, that’s not what we would want to have happen, but with the market mechanism, if there’s relatively few competitors, it may be it may be hard to prevent that from happening.16
If the staff is correct regarding the lack of bidding competition (and I believe that there is ample
evidence to support the staff’s assumption), then the use of a market mechanism will come at
much too high a cost, as shown by the staff discussion. While the staff report correctly states
that only a profitable business case will induce investment,17 the market-based approach will
likely result in excessive profits, due to weak bidding competition. The Commission must
prepare to address the distribution of support without resorting to a reverse auction. The problem
here is deploying broadband where markets have failed, and it is unlikely that robust bidding
competition will emerge in these areas.
F. The Commission Must Clearly Separate Support for Fixed Broadband from Mobility Broadband Support
The National Broadband Plan indicates that a mobility broadband fund should be created
to ensure that no states lag in the deployment of 3G wireless services.18 The Commission must
ensure that support for fixed and mobility services are treated separately to avoid duplicative
support and the waste of support monies. Unfortunately, the staff’s approach opens the door to
the overlapping support of fixed and mobility services. The staff model identifies 4G wireless as
the least-cost method to deliver fixed broadband to many areas of the country, and to about 90
percent of all unserved households.19 To reach this conclusion, the staff allocates costs between
fixed and mobility broadband services.20 The potential for implicit subsidization of mobility
broadband services from fixed broadband subsidies emerges due to the shared broadband
wireless platform. 16 Transcript of May 6, 2010 workshop, pp 55-56. 17 “The Broadband Availability Gap,” p. 33. 18 “Connecting America: The National Broadband Plan,” p. xiii. 19 “The Broadband Availability Gap,” p. 13. 20 “The Broadband Availability Gap,” p. 54.
Affidavit of Trevor R. Roycroft, Ph.D. On Behalf of NASUCA
WC Docket No. 10-90; GN Docket No. 09-51; WC Docket No. 05-337 _________________________________________________________________________________________________________
11
However, an equally important issue associated with the staff’s approach is whether fixed
wireless broadband is a reasonable technology to pursue, given demand growth projections, and
the Commission’s long-term goal of delivering 100 Mbps downstream service to 100 million
households by 2020.21 As the staff notes “if required speeds continue to double roughly every
three years, demand will outstrip the capabilities of 4G and 12,000-foot-loop DSL.”22 As will be
discussed further in this Affidavit, it is apparent that given observed trends in consumer demand
for bandwidth, 4G wireless is already at its limit for fixed deployments, and demand will outstrip
the capabilities of this technologies within the first five-year planning period (i.e., by 2015).
Thus, it is likely that the Commission’s ultimate objectives will be best served if it creates a
firewall between the support of fixed and mobility services by focusing support for fixed services
on wireline solutions, leaving any support for wireless services to the mobility fund.23 Once
initiated, the provision of support to fixed wireless service providers could be difficult for the
Commission to undo, and any “leakage” of fixed support to mobility services could undermine
the overarching objective of delivering 100 Mbps service to 100 million households.
III. Specific Issues for the NBP Model
A. The FCC’s Previous Universal Service Cost Modeling The Commission has previously addressed criteria that were appropriate for cost studies
or cost models utilized to estimate costs associated with universal service funding. In its 97-157
Order the FCC identified forward-looking economic cost as the correct measure to be used to
establish funding for universal service:
21 “Connecting America: The National Broadband Plan,” p. 9. 22 “The Broadband Availability Gap,” p. 42. 23 This recommendation is based on the capabilities of existing (or reasonably envisioned) wireless technologies. Given the ten-year planning horizon associated with the National Broadband Plan’s 100 Mbps to 100 million household goal, the Commission might reconsider fixed wireless if technology evolved to enable that technology to meet the 100 Mbps downstream/ 50 Mbps upstream objective.

Affidavit of Trevor R. Roycroft, Ph.D. On Behalf of NASUCA
WC Docket No. 10-90; GN Docket No. 09-51; WC Docket No. 05-337 _________________________________________________________________________________________________________
12
We agree with the Joint Board that the use of forward-looking economic cost will lead to support mechanisms that will ensure that universal service support corresponds to the cost of providing the supported services, and thus, will preserve and advance universal service and encourage efficiency because support levels will be based on the costs of an efficient carrier. Because forward-looking economic cost is sufficient for the provision of the supported services, setting support levels in excess of forward-looking economic cost would enable the carriers providing the supported services to use the excess to offset inefficient operations or for purposes other than “the provision, maintenance, and upgrading of facilities and services for which the support is intended.” This excess, by increasing the burden on all contributors to the support mechanisms, would also unnecessarily reduce the demand for other telecommunications services.24
Forward-looking economic costs continue to be the appropriate metric to gauge universal service
support, especially if the Commission transitions to the joint support of voice and data services.25
As will be discussed in more detail below, the Commission’s previously prescribed approach
took a “total cost” perspective, which properly addressed the application of the technology
needed to meet the demand for voice services. It is reasonable for the Commission to address the
level of subsidy needed for all supported services. Addressing both the forward-looking
economic costs of producing all supported services, and all carrier revenues arising from services
provided over the supported facilities is required to generate the economically efficient outcome.
As the Commission has also identified “technological neutrality” as an objective,26 the
use of total forward-looking economic costs is all the more important. Because voice services
are already supported, and because broadband services are already implicitly supported on the
ILEC technology platform (at least for rural companies), the Commission must fully account for
the pre-existing support in its determination of the appropriate level of overall support for voice
and broadband. Unfortunately, the staff’s approach does not enable the appropriate evaluation:
One issue with this approach (i.e., the staff’s incremental cost approach) is that it assumes that existing networks will be available on an ongoing basis. To the extent that existing
24 In the Matter of Federal-State Joint Board on Universal Service, CC Docket 96-45, Report and Order, May 8, 1997, FCC 97-157, ¶ 225 (footnotes omitted). 25 “We seek comment on whether, if the Commission replaces its current high-cost funding mechanism with a new Connect America Fund to support both broadband and voice service, the Commission should adopt a total cost rather than an incremental cost model.” NOI, ¶ 34. 26 Connecting America: The National Broadband Plan, p. 60; NOI, ¶ 42.

Affidavit of Trevor R. Roycroft, Ph.D. On Behalf of NASUCA
WC Docket No. 10-90; GN Docket No. 09-51; WC Docket No. 05-337 _________________________________________________________________________________________________________
13
networks depend on public support, such as USF disbursements, the total gap for providing service in unserved areas could be significantly higher than the incremental calculation indicates.27
The staff’s modeling approach does not correctly address the problem that the Commission
ultimately hopes to solve. The Commission hopes to address the support of voice and broadband
services, and to allow competitive and technical neutrality,28 thus the Commission must be able
to make “apples-to-apples” comparisons of model results. A reasonable forward-looking
economic modeling approach will provide this capability. However, the staff’s approach is
incapable of generating the needed comparisons.
B. The FCC 97-157 Cost Criteria
Returning to the Commission’s previous decision regarding the appropriate cost
methodology in the FCC 97-157 Order, the Commission identified ten (10) criteria that it
considered necessary to develop a reasonable economic costing methodology.29 Table 2, below
on the following page, summarizes these ten criteria.30 I believe that these criteria continue to
provide a reasonable general framework for assessing modeling associated with universal
service.31 While the primary focus of the cost modeling at the time these criteria were developed
was associated with ILEC facilities and voice services, the criteria continue to provide general
guidance on important factors associated with any forward-looking modeling exercise. I believe
that the Commission should continue to apply the general reasoning voiced in the FCC 97-157
Order, and consider the NBP model in light of these criteria.
27 “The Broadband Availability Gap,” p. 35. 28 NOI, ¶ 24. 29 In the Matter of Federal-State Joint Board on Universal Service, CC Docket 96-45, Report and Order, May 8, 1997, FCC 97-157, ¶ 250. 30 Appendix A contains a more detailed discussion. 31 The NBP model addresses both cost and revenue modeling. Many of the cost principles identified in FCC 97-157 (e.g., forward-looking, all services considered, all data and formulae available, modification of critical assumptions) also apply to modeling revenues.

Affidavit of Trevor R. Roycroft, Ph.D. On Behalf of NASUCA
WC Docket No. 10-90; GN Docket No. 09-51; WC Docket No. 05-337 _________________________________________________________________________________________________________
14
Table 2: Cost Study Criteria from FCC 97-157 Criteria Summary 1 The technology assumed in the cost study or model must be the least-cost, most-efficient, and
reasonable technology for providing the supported services that is currently being deployed. 2 Any network function or element must have an associated cost. 3 Only long-run forward-looking economic cost may be included. The long-run period used must be a
period long enough that all costs may be treated as variable and avoidable. 4 Cost of capital set at 11.25%, however, will re-evaluate the cost of capital as needed to ensure that it
accurately reflects the market situation for carriers. 5 Economic lives and future net salvage percentages used in calculating depreciation expense must be
within the FCC-authorized range. 6 The cost study or model must estimate the cost of providing service for all businesses and households
within a geographic region. 7 A reasonable allocation of joint and common costs must be assigned to the cost of supported services.
This allocation will ensure that the forward-looking economic cost does not include an unreasonable share of the joint and common costs for non-supported services.
8 The cost study or model and all underlying data, formulae, computations, and software associated with the model must be available to all interested parties for review and comment. All underlying data should be verifiable, engineering
9 The cost study or model must include the capability to examine and modify the critical assumptions and engineering principles.
10 The cost study or model must deaverage support calculations to the wire center serving area level at least, and, if feasible, to even smaller areas such as a Census Block Group, Census Block, or grid cell.
In the discussion that follows, aspects of the NBP model will be evaluated in light of
these criteria. In many respects, the NBP model fails to satisfy the forward-looking modeling
criteria identified in the FCC 97-157 Order. As a result, the NBP model does not generate
satisfactory answers to the questions the Commission hopes to answer.
C. The NBP Model does not determine least-cost technology, excludes network functions or elements, and does not apply a Long Run Incremental Cost Approach—FCC 97-157 Criteria (1), (2), and (3)
In previous evaluations of costing methodology the Commission has carefully
distinguished between the “long run” and the “short run.” In economic terms:
The term “long run,” in the context of “long run incremental cost,” refers to a period long enough so that all of a firm's costs become variable or avoidable.32
32 In the Matter of Implementation of the Local Competition Provisions in the Telecommunications Act of 1996 Interconnection between Local Exchange Carriers and Commercial Mobile Radio Service Providers, CC Docket Nos. 96-98 & 95-185, First Report and Order, August 8, 1996, FCC 96-325, ¶ 677.

Affidavit of Trevor R. Roycroft, Ph.D. On Behalf of NASUCA
WC Docket No. 10-90; GN Docket No. 09-51; WC Docket No. 05-337 _________________________________________________________________________________________________________
15
On the other hand, the “short run” is a period of time where at least one production input is fixed.
The Commission’s HCPM, while allowing wire center locations to remain fixed, allowed all
other inputs to vary. The fixed wire center location protocol established by the Commission
came to be known as a “scorched node” approach.33
The NBP model has been applied with a “mix and match” approach to the “run”
associated with the various technology options that it models. When the staff conducts modeling
using a “brownfield” approach for one technology, the modeling assumptions are “short run,” as
the staff allows substantial inputs to be treated as fixed. When the staff performs “greenfield”
modeling for another technology, the assumptions are closer to “long run,” with far fewer fixed
inputs. The staff evaluates the results of these studies on a side-by-side basis, but this approach
is not reasonable due to the difference in the modeling horizon.
For example, the modeling approach for both digital subscriber line (DSL) deployment
with 12,000-foot loop length (12 kft DSL) and 4G wireless, which are the two “least cost”
technologies on which the staff report places its primary focus, cannot be described as a “long-
run incremental cost” approach. The modeling for 12 kft DSL utilizes existing central office
locations, support structures, and distribution plant.34 The modeling for 4G wireless also appears
to utilize existing structures where they are available.35 Thus, it is not surprising that these two
technologies are identified as the “least cost,” as it is more likely that the ILEC and voice-
wireless platforms have a higher presence in unserved areas than do, for example, cable
providers. When the staff models fiber to the customer’s premise (FTTP), however, a
substantially larger portion of inputs vary, and thus generate higher costs. However, the lack of a
33 A “scorched node” model is one that models the network using the existing wire center location. A “greenfield” model, by contrast, does not use the existing wire center, but models a completely new network, including new wire centers. Universal Service First Report and Order, Appendix J, 12 FCC Rcd at 9435, n. 628. 34 “Broadband Assessment Model (BAM),” p. 25. 35 “Broadband Assessment Model (BAM), Attachment 6, pp. 5 & 11.

Affidavit of Trevor R. Roycroft, Ph.D. On Behalf of NASUCA
WC Docket No. 10-90; GN Docket No. 09-51; WC Docket No. 05-337 _________________________________________________________________________________________________________
16
comparable economic run prevents the proper assessment of the difference between the
economic costs of the two alternative technologies.
Furthermore, in FCC 97-157 criterion (2) the Commission specified that any network
function or element must have an associated cost. This condition would not allow the exclusion
of “sunk” costs.36 Because the NBP model allows for substantial sunk costs with both 12 kft
DSL and 4G wireless,37 the NBP model allows facilities to exist that provide supported services
without having any associated cost. In addition to assuming sunk costs of loop plant with the 12
kft DSL scenario, the NBP model also assumes differing levels of sunk costs associated with
distribution plant with the 3 kft and 5 kft DSL deployment, assuming that fiber investment is
extended to the point where the distribution plant is between 3 kft and 5 kft from the end user.
The NBP model also assumes sunk costs with cable broadband in areas where cable video
services are available.38 Because they are based on cost analyses that assume substantial fixed
(or sunk) costs that vary by technology, or by the specific network configuration within a
technology deployment, the staff’s application of the model does not provide an “apples-to-
apples” cost comparison. The modeling results, by allowing for varying degrees of sunk costs,
does not enable a reasonable evaluation of the economic costs of alternative technologies.
D. Compliance Costs Should be Considered
FCC 97-157 criterion (1) states that the technology assumed in the cost study or model
must be the least-cost, most-efficient, and reasonable for providing the supported services. The
FCC’s previous cost modeling, directed at ILEC wireline facilities, modeled a technology that
delivered highly predictable service levels, i.e., if you connect a household to a loop and switch,
voice grade service results. Given that the Commission has now stated that it wants to be
36 Sunk costs are historical costs that have already been incurred and which cannot be recovered. 37 “The Broadband Availability Gap,” pp. 85 and 106. 38 “The Broadband Availability Gap,” pp. 101, 105, & 106.

Affidavit of Trevor R. Roycroft, Ph.D. On Behalf of NASUCA
WC Docket No. 10-90; GN Docket No. 09-51; WC Docket No. 05-337 _________________________________________________________________________________________________________
17
“technology neutral” (or “agnostic”) with regard to providing support for broadband services,39
the modeling must be directed at alternative technologies.
To enable a reasonable comparison of the costs of alternative technologies (e.g., wireline
v. wireless), the Commission must consider the costs of the verification of compliance with the
Commission’s broadband standard. The costs of verifying compliance are more likely to be
similar across technologies in the middle-mile facilities, however, the costs of verifying
compliance in the last mile are likely to vary. For example, wireless signal strength is likely to
be influenced by a variety of factors, including terrain and foliage. While the NBP model
estimates the costs of constructing wireless facilities, the NBP model does not estimate the costs
of the carrier or the Commission verifying the level of service to the newly served area. Given
the numerous factors that can influence the ability of a consumer to receive wireless service at
their residence, the verification process could involve household-level testing. This type of
testing is costly and should be anticipated and accounted for.
Costs of verifying compliance must also be determined for wireline alternatives. It is
reasonable to expect that these costs will be lower for wireline than for wireless, but verification
costs associated with the 12 kft DSL are likely to be more substantial than, for example, FTTP.40
It is reasonable for these costs to be anticipated and included in the overall cost estimates.
E. The NBP Model’s Cost of Capital is not Reflective of Risk—FCC 97-157 Criterion (4)
The FCC has relied upon an 11.25% cost of capital value since 1990, in many different
contexts. When considering capital costs, it is reasonable to evaluate a risk premium and a risk
free rate. Ceteris paribus, falling risk-free rates should lead to declining capital costs. Chart 1
shows the trend in a representative risk-free rate from 1990 to present. 39 “Connecting America: The National Broadband Plan,” p. 60. 40 Once fiber reaches the premises, there are few factors in the last mile that can interfere with the delivery of targeted bandwidth. DSL service faces more impediments, and will likely require more testing.

Affidavit of Trevor R. Roycroft, Ph.D. On Behalf of NASUCA
WC Docket No. 10-90; GN Docket No. 09-51; WC Docket No. 05-337 _________________________________________________________________________________________________________
18
With regard to the appropriate risk premium, given that the support is to be provided to a single
provider in each service area, the supported firm will effectively be a protected monopoly.
While other factors may influence the risk premium, the lack of competition substantially
mitigates risk.
It is notable that recent estimates of capital costs in the telecommunications industry
have been developed by the financial advisors of Qwest and CenturyLink, associated with their
proposed merger. CenturyLink utilized the services of Lazard, Deutsche Bank and Morgan
Stanley.
For their calculation, Lazard, Deutsche Bank and Morgan Stanley used discount rates ranging from 8.5% to 9.5% and 8.00% to 9.00% for Qwest and CenturyLink, respectively. The discount rates applicable to Qwest and CenturyLink were based on Lazard’s, Deutsche Bank’s and Morgan Stanley’s judgment of the estimated range of weighted average cost of capital.41
Qwest used the services of Perella Weinberg, which also addressed the appropriate weighted
average cost of capital:
Perella Weinberg used discount rates ranging from 7.50% to 8.50% based on estimates of the weighted average cost of capital for Qwest. . . . Perella Weinberg chose this
41 CenturyLink Form S-4, June 4, 2010, p. 72.

Affidavit of Trevor R. Roycroft, Ph.D. On Behalf of NASUCA
WC Docket No. 10-90; GN Docket No. 09-51; WC Docket No. 05-337 _________________________________________________________________________________________________________
19
discount rate range based on the weighted average cost of capital for public companies in the RLEC and RBOC industries deemed by Perella Weinberg to be relevant to its analysis (based on its experience working with corporations on various merger and acquisition transactions) and the relative capital structures of Qwest.42
Similarly, Evercore and Citigroup Global Markets, when evaluating the Frontier acquisition of
Verizon exchanges in 2009, identified a cost of capital range of 8.5% to 9.5%.43
The range of capital costs identified in the CenturyLink S-4 provide a clear indication
that the 11.25% figure utilized by the FCC is well above what could be considered a reasonable
cost of capital for modeling purposes. I recommend that the FCC address the cost of capital
issue in a separate proceeding.
F. Depreciation Rates—FCC 97-157 Criterion (5)
In FCC 97-157 the Commission noted the importance of economic depreciation.44
Pointing to the fact that the rural ILECs were likely to face fewer competitive pressures than
their urban counterparts, the Commission went on to state that if competitive pressures were to
increase, depreciation lives would need to change.45 However, FCC 97-157 Criterion (5)
specifies that the economic lives and future net salvage percentages should be required to fall
within the FCC’s prescribed range. The NBP model utilizes FCC lives.46 The cost modeling
exercise now before the Commission must address economic depreciation anew in light of the
rapid growth in consumer demand for bandwidth, and Commission’s overarching objective to
deliver 100 Mbps service. Any modeling must accurately account for the anticipated
obsolescence of plant along any modeled technology deployment path, and must also correctly
identify the associated salvage values of plant. Another reason to address depreciation in a more
comprehensive fashion is the fact that depreciation lives prescribed by the FCC may not be 42 CenturyLink Form S-4, June 4, 2010, p. 79. 43 Frontier Communications Form S-4, p. 66. 44 FCC 97-157, ¶ 26. 45 FCC 97-157, ¶ 250. 46 “Broadband Assessment Model (BAM),” p. 37.

Affidavit of Trevor R. Roycroft, Ph.D. On Behalf of NASUCA
WC Docket No. 10-90; GN Docket No. 09-51; WC Docket No. 05-337 _________________________________________________________________________________________________________
20
sufficiently specific for non-ILEC technology deployments. The FCC should address economic
depreciation and salvage value issues to support high-quality modeling in a separate proceeding.
G. The Cost Model Must Estimate the Cost of Providing Service for all Businesses and Households within a Geographic Region—FCC 97-157 Criterion (6)
FCC 97-157 Criterion (6) requires the cost modeling process to correctly address the
level of demand within the geographic region where service is to be provided.47 Modeling
demand for a wireline voice network was straight forward, as the identification of housing units
and business locations in the geographic area provided a reliable gauge for sizing the network
needed to serve these customer locations. However, modeling demand to determine broadband
support is more complex than for voice services. Demand for bandwidth is dynamic at a specific
customer location, and consumers are likely to consume more bandwidth over time, and also
have purchased faster connections over time.48 Data presented by staff also indicate that average
Busy Hour Offered Load (BHOL) is directly related to the speed tier associated with the user.
Higher speed tiers lead to higher BHOL.49
The FCC Staff’s approach to demand for bandwidth begins by assuming that the average
customer currently downloads 10 Gigabytes of data per month.50 This results in a BHOL of 111
kbps.51 However, the staff is modeling over a 20-year period.52 Thus, given that network
47 The National Broadband Plan contains numerous references to the broadband needs of small businesses (see, for example, pp. xiv, 10, 16, 17, 23, 35, etc). However, the NOI does not address the provision of broadband services to small business customers. Small business customers may face broadband limitations similar to those experienced by residential customers. In the discussion that follows, I will only address residential issues, but note that by excluding small business from the discussion the Commission may be prevented from properly measuring economies of scale that can arise due to the joint provision of residential and small business broadband. 48 The staff report notes that download consumption will double every three years. Not surprisingly, data in the staff report also shows that consumers download more with higher-speed connections. See, “The Broadband Availability Gap,” p. 44 and p. 112. 49 “The Broadband Availability Gap,” p. 112. 50 “The Broadband Availability Gap,” p. 90. 51 Assuming a 30 day month.
Affidavit of Trevor R. Roycroft, Ph.D. On Behalf of NASUCA
WC Docket No. 10-90; GN Docket No. 09-51; WC Docket No. 05-337 _________________________________________________________________________________________________________
21
demand has been doubling every three years, the staff projects future usage.53 The staff’s
demand projection focuses on the period ending in 2015.54 Staff makes the assumption that the
forward-looking BHOL modeled for 2015 should be 160 kbps.55 This increase would imply an
average customer will be projected to download about 14 Gigabytes per month by 2015.56 This
assumption is troubling from more than one perspective.
Under the staff’s “double every three years” rule of thumb and a 10 GB per month
starting point, the average user will be downloading about 32 GB per month by 2015, which
would imply a BHOL of about 400 kbps, i.e., more than double the staff’s 160 kbps projection.57
The staff’s approach substantially underestimates demand, and the staff goes on to suggest an
unacceptable solution to the actual projected growth rate—i.e., staff suggests that in the future
“heavy users” will be excluded from contributing to the growth in BHOL through usage
restrictions.58 If the HCPM had been designed to exclude the most costly 10% of loops, it would
be clear that the modeling would distort outcomes. A similar distortion emerges here as a result
of the staff’s assumption regarding the treatment of users that cause higher network costs.
The staff’s approach to modeling residential demand is unacceptable, and is not
consistent with FCC 97-157 Criterion (6). The staff’s demand assumption will disadvantage
52 “The Broadband Availability Gap,” p. 34. 53 “The Broadband Availability Gap,” p. 90. 54 “The Broadband Availability Gap,” p. 113. 55 “The Broadband Availability Gap,” p. 111. 56 As will be discussed further below, the staff’s modeling of the period up to 2015, while modeling capacity expansion in the middle-mile, does not appear to allow bandwidth to expand in the last mile. In other words, consumers are assumed to download more data over last-mile connections with fixed data speeds. 57 This calculation assumes a compound growth rate that is sufficient for demand to double every three years (i.e., 25.99%) applied over a 5.5-year horizon. The staff report identifies a range of projected average BHOL for 2015 of between 370 and 444 kbps. 58 “The Broadband Availability Gap,” p. 111. AdTran correctly points out that the staff’s efforts to control offered load are misdirected. Offered load is what the user demands from the network. Network management will crimp available bandwidth, and thus impact not what the user offers, but what the network will carry for that user. See, Adtran “Comments on OBI Technical Paper No. 1: The Broadband Availability Gap,” May 28, 2010.

Affidavit of Trevor R. Roycroft, Ph.D. On Behalf of NASUCA
WC Docket No. 10-90; GN Docket No. 09-51; WC Docket No. 05-337 _________________________________________________________________________________________________________
22
rural areas, as an insufficient level of support will be estimated for a reasonably projected level
of demand. Suggesting that broadband users in rural areas be subject to restricted usage and
insufficient capacity is unreasonable policy, and does not provide “reasonably comparable”
service. Modeling the demand for broadband should not begin with the imposition of a set of
restrictions that will throttle usage in high-cost areas, and calculating the costs of deploying a
broadband network should not be based on a highly restrictive approach to network management.
Rather, the Commission should consider the impact of expected demand on network costs, and
the relative merits of alternative technologies that are capable of supporting projected demand;
the staff’s application of the model does not allow this.
1. Staff’s Approach to Demand Prevents the Modeling of a Reasonable Technology Upgrade Path
The staff report asserts that “future-proof” buildouts may not be the best strategy.59 The
staff report presents the results of a study that evaluates alternative technology upgrade paths,
considering the relative merits of starting with 12 kft DSL or fixed wireless, followed by future
upgrades to 3 kft or 5 kft DSL or FTTP.60 It would be desirable to project the gap to account for
a reasonable demand projection and identify the merits of alternative technology upgrade paths.
To conduct this study the staff abandons the “gap” modeling approach that considers
costs and revenues, and focuses on costs alone. By doing this, the staff excludes all revenues
that could be earned due to the deployment of the higher capacity technologies, including video
revenues. No explanation is offered for the alteration in methodology used to evaluate
alternative network upgrade paths. The results of the staff’s projection shows the lowest cost
“investment path” to start with 12 kft DSL, and then to proceed to 5 kft DSL, and FTTP.
59 “The Broadband Availability Gap,” p. 41. A “future-proof” technology is one, like fiber to the customer’s premise. Once installed, fiber can be upgraded at low cost to provide ever-increasing amounts of bandwidth. 60 “The Broadband Availability Gap,” p. 41.
Affidavit of Trevor R. Roycroft, Ph.D. On Behalf of NASUCA
WC Docket No. 10-90; GN Docket No. 09-51; WC Docket No. 05-337 _________________________________________________________________________________________________________
23
It is important to note, however, that to make its projection, the staff makes the key
demand assumption that broadband deployment will begin at 1 Mbps in 2010, and then last-mile
speeds will grow at 26% per year. Why the 1 Mbps assumption is made is not explained,
however, it likely reflects the impact of early obsolescence of 12 kft DSL under higher starting
data speed assumptions. Under the staff’s 1 Mbps start assumption, the modeled speed will be
about 3.6 Mbps by 2015, and 12 kft DSL is still a viable solution. If the modeling begins with
the 4 Mbps standard (or even a 2 Mbps standard), 12 kft DSL is not viable technology by 2015.
Thus, this highly restrictive assumption regarding demand has a substantial influence on the
results of the staff technology path study.61
The staff’s assumptions tilt the field toward the obsolete 12 kft DSL wireline technology.
The staff’s approach also results in 4G wireless service as being identified as an acceptable fixed
solution, when it too will not be able to keep up with demand growth—even within the first 5-
year planning period. The staff’s assumptions about demand, as well as the exclusion of
revenues, do not generate a reasonable assessment of alternative technology upgrade paths. The
staff’s approach to modeling demand should be revised to reflect a reasonable forward-looking
projection of consumer usage, and should reflect forward-looking assumptions regarding
supported speeds.62
2. Staff’s Approach to Demand Modeling will Deny Broadband Benefits to Rural Areas
The staff’s proposed usage restriction should also be viewed in light of the economic
impact on end users in high-cost areas. The staff report notes that certain applications are not
61 When modeling the “gap,” the staff report does not allow growth in bandwidth demand in the last mile facilities before 2015. If the staff assumed 4 Mbps service in 2010, and allowed for last-mile speeds to grow at 26% per year, 12 kft DSL (or fixed wireless) would not be a viable technology. 62 See Exhibit 3-I and the associated discussion on pages 41 and 42 of “The Broadband Availability Gap” for the staff’s example.

Affidavit of Trevor R. Roycroft, Ph.D. On Behalf of NASUCA
WC Docket No. 10-90; GN Docket No. 09-51; WC Docket No. 05-337 _________________________________________________________________________________________________________
24
compatible with the level of downstream speed modeled by the staff.63 Usage restrictions would
only make this negative impact more severe. Certainly, more applications are emerging that
require even higher levels of bandwidth. Thus, the 4/1 speed cap will foreclose rural households
from the use of current and future applications. The staff report correctly observes “[s]imply put:
if required speeds continue to double roughly every three years, demand will outstrip the
capabilities of 4G and 12-thousand-foot DSL.”64 Thus, staff admits the technologies that they
model (and ultimately identify as “least cost”) are obsolete within the first 5-year segment of the
overall 20-year planning period.
H. The NBP Model’s Short-Run View Results in the Implicit and Inappropriate Allocation of Costs to Voice Services—FCC 97-157 Criterion (7)
Given the staff’s assumptions regarding sunk costs, the staff’s modeling approach
implicitly allocates costs. The modeling approach is of particular concern with regard to DSL,
especially 12 kft DSL. Because significant investments in support structures and distribution
plant inputs are not allowed to vary, the staff model takes a “short run” view that implicitly and
inappropriately assigns all shared costs, including substantial loop costs, to voice services. If a
long-run approach were applied, the loop costs would be properly associated with the joint
production of voice and broadband services. Support could then be appropriately determined
jointly for voice and broadband.
The NBP model’s treatment of shared facilities in the “middle mile” is also of concern.
The Staff report notes that:
The cost of a particular middle-mile facility cannot be allocated solely to the consumer broadband users of that facility. Since that facility is shared with other provider services such as residential and enterprise voice, wholesale carrier services, enterprise data services and other management services utilized by the provider, the cost needs to be allocated appropriately.65
63 “The Broadband Availability Gap,” p. 44. 64 “The Broadband Availability Gap,” p. 42. 65 “The Broadband Availability Gap,” p. 117.

Affidavit of Trevor R. Roycroft, Ph.D. On Behalf of NASUCA
WC Docket No. 10-90; GN Docket No. 09-51; WC Docket No. 05-337 _________________________________________________________________________________________________________
25
The Staff model’s solution to this allocation problem is troubling, as it does not reflect the likely
traffic loads associated with the use of middle-mile facilities. According to the staff:
The model assumes that the total cost of the facility is allocated thus: 1/3 for service provider voice service, 1/3 wholesale and enterprise carrier services and 1/3 consumer broadband services. This is an estimation of the allocation of traffic within a typical ILEC transport environment, but the allocation of cost to any single product or customer group is speculative at this point.66
There is no evidence to support the equal allocation that the Staff model employs. For example,
as noted in the Staff report, the typical data usage for a fixed broadband user is about 10
Gigabytes per month.67 It is reasonable to expect that a fixed voice customer will generate voice
usage that would not exceed 340 Megabytes per month.68 Thus, in terms of overall data usage,
the typical voice user currently transmits about 3% as much data as the typical broadband data
user.69 Given the staff’s projected doubling of data usage every three years, the typical voice
user’s share would fall to about 1% of the typical data user’s share by 2015.
On a network where multiple services are provided in a shared data stream, use of the
proportionate shares of data usage is a reasonable means to allocate the joint and common costs
of provision. Cost allocation for the middle-mile facilities can be accomplished by identifying
the total amount of traffic on the network associated with voice, broadband, and wholesale and
enterprise customers, and developing an allocation factor. Given the market migration to
technologies such as FTTP, coax, and VDSL, which all are capable of delivering voice as a 66 “The Broadband Availability Gap,” p. 117. 67 “The Broadband Availability Gap,” p. 90. 68 This is highly conservative estimate. The last publicly available data for local dial equipment minutes (DEMs), based on 2001 Federal-State Joint Board Monitoring Reports, indicates that DEMs averaged about 1,400 per line per month. It is likely that local usage has fallen since that time. Total DEMs measure both originating and terminating holding time (47 CFR §36.125(a)(3)). Thus, a household with usage of 1,400 DEMs will only generate demand for one 64 kbps channel for each of the originating minutes, and total household voice demand for the 64 kbps channel will be 700 minutes per month. To generate the 340 MB estimate, a 64 kbps voice channel is assumed. 69 The difference in the magnitude of voice and data traffic swamps any subscription impact. Assuming an integrated voice and broadband network with 35% broadband subscription and 85% voice subscription results in traffic proportions of 92% data vs. 8% voice.

Affidavit of Trevor R. Roycroft, Ph.D. On Behalf of NASUCA
WC Docket No. 10-90; GN Docket No. 09-51; WC Docket No. 05-337 _________________________________________________________________________________________________________
26
component of an overall data stream in the last mile, relative use of bandwidth to allocate loop
costs is also a reasonable approach.70
I. Only an inappropriate allocation of shared facilities costs between voice and broadband would support voice rate rebalancing.
The Staff report notes that “since DSL is deployed over the same existing twisted-pair
copper network used to deliver telephone service, it benefits from sunk costs incurred when first
deploying the telephone network.”71 However, the Staff’s approach, by assuming that those loop
costs are sunk in the modeling process, incorrectly allocates all shared loop costs to voice
services, and allocates all of the scope economies arising from the sharing of loop plant between
voice and DSL to DSL service. This approach is unacceptable. The expansion of scope
economies has an impact on the cost of providing all services that share the local loop. This lack
of the proper cost perspective is all the more troubling given language in the National Broadband
Plan:
To offset the impact of decreasing ICC revenues, the FCC should permit gradual increases in the subscriber line charges (SLC) and consider deregulating the SLC in areas where states have deregulated local rates. The FCC should also encourage states to complete rebalancing of local rates to offset the impact of lost access revenues. Even with SLC increases and rate rebalancing, some carriers may also need support from the reformed Universal Service Fund to ensure adequate cost recovery. When calculating support levels under the new CAF, the FCC could impute residential local rates that meet an established benchmark. Doing so would encourage carriers and states to “rebalance” rates to move away from artificially low $8–$12 residential rates that represent old implicit subsidies to levels that are more consistent with costs.72
70 The need for cost allocation in the local loop will depend on whether the Commission intends to jointly support voice and broadband. The ultimate resolution of this issue is unclear, especially in light of comments made in the National Broadband Plan regarding the need for voice rate rebalancing (see below). If the Commission were to jointly support voice and broadband services on an integrated network, cost allocation for shared facilities will be much less of an issue—i.e., to determine the “gap,” revenues from all sources would be compared to forward looking costs of the full service set. 71 “The Broadband Availability Gap,” p. 85. 72 “Connecting America: The National Broadband Plan,” p. 148.

Affidavit of Trevor R. Roycroft, Ph.D. On Behalf of NASUCA
WC Docket No. 10-90; GN Docket No. 09-51; WC Docket No. 05-337 _________________________________________________________________________________________________________
27
The alleged need for rate rebalancing places the cart well before the horse. The Commission
currently has no idea of what its current levels of support are delivering in terms of services (e.g.,
voice, broadband data, video). Based on the current usage of the network, it is just as likely that
$8-$12 voice rates—where these low rates may exist—are too high. Any reasonable evaluation
of costs on an integrated broadband network indicates that voice’s share should be going down.
As was noted above, voice usage, as a portion of all data transmitted over shared facilities is
shrinking.
J. The NBP Model is a Closed Model—FCC 97-157 Criteria (8) and (9)
Criteria (8) and (9) from FCC 97-157 address the openness of the cost model, and the
ability of interested parties to alter assumptions and conduct alternative model runs.
Unfortunately, the NBP model does not comply with these criteria.
The staff report discusses model results, sensitivity of broadband funding to alternative
technologies, and sensitivity to alternative assumptions regarding the level of competition
associated with a geographic deployment. However, the staff report focuses on results and does
not provide sufficient information regarding the structure and operations of the underlying
model. There is additional documentation for the model provided in the document titled
“Broadband Assessment Model (BAM).”73 However, this additional model documentation still
does not provide sufficient information to understand how the modeling process is structured.
One of the problems of understanding the NBP model is that it is not an integrated model.
For example, the documentation indicates that the NBP model does not produce the analysis
associated with investment. Rather, “BAM accepts as inputs key input files produced by runs of
CostPro.”74 Thus, the NBP model is not a stand-alone model, but an overlay of CostPro.
CostPro is CostQuest’s proprietary cost-modeling program, thus, this model is not available for 73 “Broadband Assessment Model (BAM).” Available at: http://www.broadband.gov/plan/broadband-working-reports-technical-papers.html 74 “Broadband Assessment Model (BAM),” p. 23.

Affidavit of Trevor R. Roycroft, Ph.D. On Behalf of NASUCA
WC Docket No. 10-90; GN Docket No. 09-51; WC Docket No. 05-337 _________________________________________________________________________________________________________
28
review. The fact that the NBP model does not stand on its own, and is entirely dependent on
separate runs of CostPro models raises questions about how this layered approach to modeling
works. This does not seem to be the most desirable structure for a model that will be used to
determine support levels for universal service/broadband deployment costs.
The lack of clarity in the documentation is also cause for concern. For example, while
the NBP model is described “bottom-up”75 and is used to produce “county-level”76 estimates of
the broadband gap, other documentation also indicates that the CostPro model runs utilized to
create the cost estimates are developed from the Census Block level,77 but are ultimately
developed “for each state.”78 Based on this description, it is not clear how the model is
structured, and whether there are state-level cost modeling implications that are disaggregated to
the county level, or whether the cost model builds strictly from the CBG level up.
The staff report recognizes the difficulties associated with addressing scale economies,
and indicates that county-level modeling represents a reasonable compromise.79 It is not clear
whether the staff performed any sensitivity analysis regarding the scale associated with
modeling. The results of such an analysis would assist in the evaluation of the impact of scale
economies on the model’s results.
The Staff has also provided “Data from the Technical Paper” on a web site,80 however,
this additional data does not provide information that is of much use to the outside reviewer. The
“Data from the Technical Paper” comes with no explanation, which makes interpretation of the
information difficult (e.g., column headings in the spreadsheets are undefined; the spreadsheets
have no active cells, making an audit of the results virtually impossible). An open modeling
75 “Broadband Assessment Model (BAM),” p. 23. 76 “The Broadband Availability Gap,” p. x. 77 “Broadband Assessment Model (BAM), pp. 5-6. 78 “Broadband Assessment Model (BAM),” Attachment 5, p. 22. 79 “The Broadband Availability Gap,” pp. 36-37. 80 http://www.broadband.gov/plan/deployment-cost-model.html

Affidavit of Trevor R. Roycroft, Ph.D. On Behalf of NASUCA
WC Docket No. 10-90; GN Docket No. 09-51; WC Docket No. 05-337 _________________________________________________________________________________________________________
29
approach will allow users to understand the inner workings of the model, and to modify
assumptions and input values; such an approach is not present with the Staff’s model. CostQuest
indicates that “CostProLoop has been used by firms with operations in 30 states. It has been
approved as a mechanism for calculating UNE loop investment in 8 states.”81 This is not
sufficient validation of the model. The Commission must ensure that any model employed for
universal service funding purposes is open and available to all parties for review.
K. Granularity of the Cost Estimate—FCC 97-157 Criteria (10)
FCC 97-157 criteria (10) states that the model must deaverage support calculations to the
wire center serving area, or if feasible, to even smaller areas such as a Census Block Group,
Census Block, or grid cell.82 Unfortunately, the NBP model does not accurately predict specific
results in any granular geographic area. The model documentation states that the model is
designed to “approximate the size of the national broadband challenge under different scenarios.
. .”83 In other words, the model’s national level of precision is based on the fact that for any
specific geographic area, some estimates will be too high and others will be too low. The overall
result that produces the dollar amount of the shortfall (i.e., the “national broadband challenge”)
will have the various under-estimates and over-estimates balance out.
Fundamentally, it is not clear how the FCC intends to, or will be able to, utilize the NBP
model, or any successor model. The NOI indicates that it is being considered as both a means to
replace existing funding mechanisms84 and as a means to establish a reserve price for an auction-
based approach to distributing support.85 Either of these two alternatives would require that the
81 http://www.costquest.com/costquest/costpro.aspx 82 FCC 97-157, ¶ 250. 83 “Broadband Assessment Model (BAM),” p. 7. 84 NOI, ¶ 14 “We also seek comment on what modifications to the National Broadband Plan model would be required if the CAF is eventually to replace all of the legacy high-cost programs.” 85 NOI, ¶ 21 “If we ultimately use some form of market-based mechanism to determine CAF support, we seek comment on whether a model should be used to set reserve prices.”

Affidavit of Trevor R. Roycroft, Ph.D. On Behalf of NASUCA
WC Docket No. 10-90; GN Docket No. 09-51; WC Docket No. 05-337 _________________________________________________________________________________________________________
30
model produce accurate granular information. If the model is used to reset support levels for
specific carriers, the model must be capable of accurately estimating costs in a specific service
area. Similarly, if the Commission intends to hold a reverse auction and use the model to set the
reserve prices, the model’s results should be accurate at the level of the auction bidding area.
Thus, the usefulness of the NBP model to estimate specific support levels, or to provide
information that might be used to establish reserve prices in some type of competitive bidding
process, is limited. Quoting from the NBP model’s documentation:
[T]he precision of the model outcomes will be impacted by the quality of available input data. In general, these limitations will have a more significant impact on the precision of derived results at the small area (such as census tract) than will be the case for larger areas such as larger market area (sic), the state or nation.
In addition to this lack of granularity, it is also important to note that the model does not address
all business models, including those from public-sector providers and/or nonprofits. As a result,
the feasibility of some broadband deployments may be ignored.
L. Other Issues with the Transparency of the NBP Model
1. Revenue Modeling
The documentation of revenue projections associated with the NBP model is not
sufficient to fully evaluate the staff’s revenue assumptions. It is clear that the NBP model’s
general assumption regarding sunk costs carries over to revenues. For certain business cases,
e.g., with 12 kft DSL and 4G wireless only incremental revenues are considered. As a result, for
these technology deployments, the NBP model excludes not only voice service revenues, but
also the ability to model the provision of any bundled services by the voice provider.86 This is an
unreasonable approach. Furthermore, the NBP model does not appear to account for existing
support for voice services in any way, which ignores a significant source of revenues entirely.
86 “The Broadband Availability Gap,” p. 49.

Affidavit of Trevor R. Roycroft, Ph.D. On Behalf of NASUCA
WC Docket No. 10-90; GN Docket No. 09-51; WC Docket No. 05-337 _________________________________________________________________________________________________________
31
As has been mentioned earlier, the Commission should focus on the total costs of integrated
provision, and evaluate all revenue sources.
2. The Model Should Run on a PC
The transparency of the model depends on how easy it is for interested parties to run the
model, modify assumptions, and produce alternative results to examine the model’s sensitivity.
CostQuest states that its models can be run on a personal computer.87 However, the
documentation indicates that the NBP model developed by Staff and CostQuest requires a
database server. It is not clear whether this can be modified into a more accessible format, e.g.,
PC or web-based interface. A June 16, 2010 AT&T ex parte filing indicates that staff is
endeavoring to make a public version of the model available later this year.88
3. Development of Annual Charge Factors and Investment Levels is not Explained
The development of Annual Charge Factors (ACFs) is heavily dependent on data that
CostQuest has supplied.89 Only general information is provided on the data used to develop
ACFs. The model documentation provides a list of “user adjustable investment inputs,” such as
cable sizes, fill/utilization, and structure sharing, however, no information on these values is
provided.
Engineering cost models typically begin by identifying the investments needed to
produce the desired service. These investments are then multiplied by Annual Charge Factors
(ACFs) to develop recurring costs. The model documentation does not provide a discussion of
the investment amounts (or input prices utilized). When the FCC developed the HCPM, it
87 “CostPro Loop Product Profile,” available at: http://www.costquest.com/costquest/docs/CostProLoop.pdf 88 Letter from Mary L. Henze to Marlene Dortch, June 16, 2010. http://fjallfoss.fcc.gov/ecfs/document/view?id=7020505662 89 “Broadband Assessment Model (BAM),” p. 37.

Affidavit of Trevor R. Roycroft, Ph.D. On Behalf of NASUCA
WC Docket No. 10-90; GN Docket No. 09-51; WC Docket No. 05-337 _________________________________________________________________________________________________________
32
conducted a proceeding to develop the input prices that would be utilized.90 With regard to the
NBP model sufficient information on the development and application of the ACFs in the
broadband model is not provided.91 Given the importance of investment levels and ACFs, these
elements of cost modeling must be fully explained, and open to modification. The NBP model
documentation states that because the wireline model has been “tested in multiple states and
subject to expert cross-examination in adjudicated regulatory proceedings”92 that these
assumptions have been validated. This is not a satisfactory resolution.93
4. Data Weakness
The FCC’s 97-157 criterion eight (8) specifies that the data associated with the cost
model must be available to any party. The data underlying the NBP model are not available, and
admitted weaknesses in the data raise additional concerns. The Staff report admits that there are
numerous data limitations.94 As a result, the NBP model utilizes various sources to estimate the
costs of providing service where service is currently unavailable. For example, for ILEC service
areas, regression analysis is used to predict the availability of DSL broadband, based on
geographic and demographic factors. In a attempt to validate this methodology, the Staff
indicates that their predictions were between 80% and 90% accurate based on a very limited
evaluation of data where detailed DSL deployment data was available.95 That degree of
90 FCC 99-304, Input Order. 91 The documentation (p. 37) indicates that the cost of capital utilized is 11.25% and that the most recently prescribed FCC depreciation rates are utilized, which provides some insight into the capital carrying charge component of the ACF. The plant specific component is much less clear. 92 “Broadband Assessment Model,” p. 26. 93 While the HCPM model was not designed to address the broadband deployment problem now facing the Commission, the HCPM could still play a role in benchmarking the performance of the new model. Understanding the relative predictions of CostPro and HCPM would shed some light on the results of the NBP model. It is conceivable that proceeding with an updated HCPM might be preferred following a full evaluation of the CostPro model. 94 “The Broadband Availability Gap,” p. 1. 95 “The Broadband Availability Gap,” p. 24.

Affidavit of Trevor R. Roycroft, Ph.D. On Behalf of NASUCA
WC Docket No. 10-90; GN Docket No. 09-51; WC Docket No. 05-337 _________________________________________________________________________________________________________
33
accuracy regarding service availability is not sufficient for a model used for these important
purposes.
Further, the modeling conventions for DSL rely on a newly created geographic unit—the
intersection of Census blocks and wire centers—which is designated a “fragment.”96 A Census
block is considered as “entirely served” by DSL if any point in a fragment located in a block is
served.97 The documentation admits that this approach likely overstates DSL availability.98
However, when layered on top of the overarching estimation of DSL availability, the bias is
likely to be compounded.99
Also, with regard to cable broadband availability, the NBP model has utilized data that
CostQuest itself has previously rejected as being unreliable. The Staff modeling exercise has
relied on data from a commercial source, MediaPrints. CostQuest, in a 2006 broadband study
performed for the Wyoming Telecommunications Council, found the MediaPrints data to be
unreliable. CostQuest did not use the MediaPrints data for its Wyoming study.100
I have examined MediaPrints cable data and found it to be unreliable. In a study
performed for TURN in California, I compared the geographic depictions of cable service
availability contained in the MediaPrints information with the representations of service
providers, either through their web sites or customer service representatives. I found that the
MediaPrints data was unreliable and contained incorrect information.101 Important MediaPrints
96 “Broadband Assessment Model (BAM),” p. 9. 97 “Broadband Assessment Model (BAM),” p. 9. 98 “Broadband Assessment Model (BAM),” footnote iv, p. 45. 99 The creation of the “fragment” geography nicely illustrates the problems that emerge when considering the creation of market areas that could be associated with some type of reverse auction. Incumbent service areas do not overlap with governmental geographic areas. 100 CostQuest Associates, “Costs and Benefits of Universal Broadband Access in Wyoming,” October 24, 2006, p. 9. 101 “The Limits of Choice in California’s Residential Telecommunications Markets: Why ‘Competition’ is Failing to Protect Consumers,” March 25, 2009. Available at: “The Limits of Choice in California’s Residential Telecommunications Markets: Why ‘Competition’ is Failing to Protect Consumers,” March 25, 2009, p. A-2. Available at:

Affidavit of Trevor R. Roycroft, Ph.D. On Behalf of NASUCA
WC Docket No. 10-90; GN Docket No. 09-51; WC Docket No. 05-337 _________________________________________________________________________________________________________
34
information, such as the number of homes passed by the cable operator and whether a system has
two-way capability, is based on cable provider self-reporting.102 This is an unacceptable
approach for determining service availability.
With regard to the operations expense (opex) data, the NBP model documentation states:
“there is simply no existing readily available source for the detailed open cost information
preferred for the BAM.”103 Detailed information on input prices is not provided with the
documentation.104
These limitations in data are likely to have a cumulative, and potentially multiplicative,
negative impact on the accuracy of the model’s results. Numerous weak links in the data are not
likely to generate reliable results. The Commission must develop a more reliable source of
information on customer location, broadband availability, input prices, and operations expenses.
5. Fixed 4G Business Model
The staff report identifies a fixed wireless 4G deployment as one of the potential
solutions to the broadband gap. To generate the performance identified in the staff report, fixed
wireless deployment will require additional investment on the part of wireless carriers, including
a base station or directional antenna at the subscriber’s premise.105 Given industry direction to
date, whether the fixed wireless business model is viable is not entirely clear. Clearwire has
deployed some fixed wireless services, but this carrier appears to be refocusing on a mobility 4G
http://www.turn.org/downloads/TURN-Telco-Competition-Is-Failing-Full-Report.pdf 102 MediaPrints 2010 “Data Dictionary.” This file is provided by MediaPrints with map files. 103 “Broadband Assessment Model,” p. 28. 104 As was mentioned earlier, the development of recurring costs (typically done through investment values and ACFs) is not adequately explained in the documentation. It may be that the NBP model approach utilizes investment values and ACFs for the recurring capital costs, and relies on a separate opex component to develop the full estimate of recurring costs. However, the data limitations admitted with regard to opex do not assuage the overall concern that recurring costs are not reasonably represented with the NBP model. 105 “The Broadband Availability Gap,” p. 72.
Affidavit of Trevor R. Roycroft, Ph.D. On Behalf of NASUCA
WC Docket No. 10-90; GN Docket No. 09-51; WC Docket No. 05-337 _________________________________________________________________________________________________________
35
approach.106 Whether there will be sufficient carrier interest in fixed broadband deployment will
be an important consideration if some type of auction process is used to assign support. Absent
participation by fixed wireless providers, competitive bidding for subsidy would likely be very
limited.
6. Incorporation of Scale Economies is not Clear
According to CostQuest:
Consistent with the directive Statement of Work, the model is designed, built and executed at a sufficiently granular level, both geographically (e.g., at the Census Block level) and economically (e.g., to account for scale benefits and the coarseness of actual capital investment), to ensure sufficient precision of results to accurately identify incremental economic costs and incremental revenues associated with broadband augmentation within sub-state economic regions.107
However, the staff’s approach appears to limit the aggregation of deployment to the county level:
There is no perfect solution to this problem. If the geography is too big there will be portions that would be more efficiently served by an alternate technology, but if the geography is too small it will be subscale, thereby driving up costs. Although the model is capable of evaluating at any aggregation of census blocks, in order to avoid a patchwork of technologies that are all subscale, we have evaluated the cost of technologies at the county level. Counties appear large enough in most cases to provide the scale benefits but not so large as to inhibit the deployment of the most cost-effective technology.108
Thus, it appears that the staff model’s approach to scale economies is focused strictly on the
impact of county geography. Other scale factors associated with firm size, such as buying
power, expanded middle-mile economies, or the ability to utilize nationwide back-office systems
do not appear to be addressed in the staff model. It would be useful to evaluate sensitivity
analysis of costs at various levels of operating scale.
106 “We are focused on expediting the deployment of the first nationwide 4G mobile broadband network to provide a true mobile broadband experience for consumers, small businesses, medium and large enterprises and educational institutions.” Clearwire 10-Q, May 6, 2010, p. 7. 107 “Broadband Assessment Model (BAM),” p. 7. 108 “The Broadband Availability Gap,” p. 37.
Affidavit of Trevor R. Roycroft, Ph.D. On Behalf of NASUCA
WC Docket No. 10-90; GN Docket No. 09-51; WC Docket No. 05-337 _________________________________________________________________________________________________________
36
M. Conclusion on the Broadband Model
As the discussion above has demonstrated, the NBP model has serious deficiencies that
prevent it from being used by the Commission to determine broadband support, or reform
universal service funding mechanisms. However, the staff’s efforts have provided a first step in
the overall process that must be pursued by this Commission. The Commission should continue
to rely on the general costing principles identified in the FCC 97-157 Order as it establishes a
unified funding mechanism for voice and broadband services. In addition, open proceedings
should be utilized to further develop the modeling of costs and revenues.
IV. Issues with Auctions
The Commission raises questions relating to the potential use of market-based
mechanisms to distribute support, and the potential role for a model should a market-based
approach be utilized.109 The NOI points to the National Broadband Plan’s emphasis on market-
based mechanisms to determine support:
One of the principles underlying the creation of the CAF is that the Commission “should identify ways to drive funding to efficient levels, including market-based mechanisms where appropriate, to determine the firms that will receive CAF support and the amount of support they will receive.”110
The Commission also references the Comments of the 71 Concerned Economists, and requests
specific comment on the mechanism proposed in that document that could be used for expedited
delivery of support to unserved areas.111
As was discussed earlier in this Affidavit, the FCC staff has the entirely reasonable
expectation that a market-based mechanism will result in weak bidding due to limited auction
entry. Furthermore, as the ultimate objective of the National Broadband Plan is to deliver 100
Mbps service, the technology alternatives capable of satisfying this objective are likely to be
109 NOI, ¶¶ 20, 21, & 22. 110 NOI, ¶ 18, footnote omitted. 111 NOI, ¶ 13.

Affidavit of Trevor R. Roycroft, Ph.D. On Behalf of NASUCA
WC Docket No. 10-90; GN Docket No. 09-51; WC Docket No. 05-337 _________________________________________________________________________________________________________
37
even fewer in number than those capable of satisfying the initial 4/1 objective. Fewer suitable
technology platforms will likely lower the level of potential auction entry over time. As a result,
rather than planning for an auction, I believe that it would be more reasonable for the
Commission to plan for the failure of auctions. Thus, the discussion that follows explores the
theoretical basis for the reasonableness of the staff’s conclusion that bidding competition will be
weak, and offers some guidance on potential alternative approaches to distributing support. I
will also address the mechanism proposed by the 71 Concerned Economists to address the
expedited delivery of support. Finally, should the Commission decide to pursue reverse
auctions, in spite of the likelihood that bidding competition will be weak, I provide observations
on how auctions might be structured to minimize the impact of the weak bidding problem.
A. Little Evidence Supports the Proposition that Auctions will Succeed
1. Market Entry is Critical to Auction Success
As a general matter, if the Commission holds an auction to determine the level of
universal service support, the success or failure of that auction will depend on the degree of
market entry associated with the auction. This Commission must carefully consider the
prospects for auction entry. An auction with many bidders is likely to exhibit fundamentally
different outcomes than an auction with few bidders. As noted by Paul Klemperer, a highly
regarded expert on auctions, in addition to the number of bidders, the relative position of the
bidders will also influence auction outcomes:
The received theory described above takes the number of bidders as given. But the profitability of an auction depends crucially on the number of bidders who participate, and different auctions vary enormously in their attractiveness to entry; participating in an auction can be a costly exercise that bidders will only undertake if they feel they have realistic chances of winning. In an ascending auction a stronger bidder can always top any bid that a weaker bidder makes, and knowing this the weaker bidder may not enter the auction in the first place—which may then allow the stronger bidder to win at a very low price. . . .112
112 Klemperer, Paul, “Using and Abusing Economic Theory,” 2002 Alfred Marshall Lecture to the European Economic Association, p. 9.

Affidavit of Trevor R. Roycroft, Ph.D. On Behalf of NASUCA
WC Docket No. 10-90; GN Docket No. 09-51; WC Docket No. 05-337 _________________________________________________________________________________________________________
38
While Professor Klemperer frames this discussion in terms of an ascending bid auction, the
moral of his story applies equally to a descending bid, reverse, or procurement auction. In the
context of a descending bid auction, a stronger bidder (say an ILEC) can always undercut a
weaker bidder, and this may deter entry from occurring, which may result in the incumbent
facing little competitive pressure as few (or no) other firms will may enter the auction, thus
resulting in an auction outcome with little subsidy reduction.
2. Experience in Other Nations Shows a Mixed Bag of Results
The 71 Concerned Economists state that “other countries have proposed and
implemented procurement auctions for universal service rapidly and successfully,” citing to a
2009 study by Scott Wallsten appearing in the Federal Communications Law Journal.113 It is
notable, however, that the Wallsten study actually documents a mixed performance record with
regard to auctions. Many of the auctions documented by Wallsten failed, or are reported to have
generated results that did not meet expectations.114 The success of some international auctions
also may not be relevant given the simplicity of the project, as compared to the issues facing this
Commission. For example, some auctions identified in the Wallsten paper were for deployments
that are not comparable to broadband, such as the deployment of pay telephones in low-income
urban and rural areas.115 Alternatively, gauging the success of the international experience with
auctions is very difficult, as the metric available to Wallsten was the difference between what the
relevant regulatory agency believed it might have to spend versus the final auction outcome. http://www.nuff.ox.ac.uk/economics/papers/2003/W2/usingandabusing.pdf 113 “Using Procurement Auctions to Allocate Broadband Stimulus Grants,” p. 9, citing to Scott J. Wallsten. 2009. “Reverse Auctions and Universal Telecommunications Service: Lessons from Global Experience.” Federal Communications Law Journal, Volume 61, No. 2, March 2009. http://www.law.indiana.edu/fclj/pubs/v61/no2/9-WALLSTENFINAL.pdf 114 For example, Wallsten reports that a pilot auction in Australia failed to generate any bidders due to incumbency, and auctions in Chile decreased in efficiency over time (initial auctions commanding about 40% of the maximum subsidy, with later auctions commanding close to 100% of the available subsidy). 115 Wallsten, p. 383.

Affidavit of Trevor R. Roycroft, Ph.D. On Behalf of NASUCA
WC Docket No. 10-90; GN Docket No. 09-51; WC Docket No. 05-337 _________________________________________________________________________________________________________
39
Specifically, the Wallsten article references the experience in Peru, where the regulator had
allocated $150 million to the project in question, while being able to complete the project for $50
million. Wallsten does not discuss the source of the Peruvian regulator’s estimate, but the
outcome sheds as much light on the inability of the regulator to correctly estimate the ultimate
amount that was expended on the project as on the efficacy of the auction process. Wallsten
describes a similar outcome for auctions conducted in Colombia, where the amount “available”
($71 million) exceeded the amount that was awarded through bidding ($32 million).116 It is not
clear how the amounts that were “available” to fund these projects were determined, thus the
efficacy of the auction cannot be fully evaluated.
Wallsten also identifies a number of other auction failures. For example, as noted, the
presence of incumbents led to auction failure (no entry) in an Australian auction pilot.117 A
December 2000 Colombian auction was declared invalid due to problems with the information
supplied by the sole bidding company.118 In two Indian auctions, weak bidding resulted in no
competition.119 Alternatively, Wallsten also describes a “successful” Indian auction to provide
services on a network that was constructed by a third party. However, as Wallsten notes,
“[b]ecause these appeared to be bids to operate on a network being built by someone else, it is
unclear why subsidies would be offered in the first place.”120 In addition to these specific
examples, a key takeaway from Wallsten’s article is the importance of entry in the success of
auctions.
B. Alternative Approaches Given the Likelihood of Auction Failures
The Commission must carefully consider the appropriate means to distribute support
given the reasonable expectation that auctions will fail to generate any bidders, or will only 116 Wallsten, p. 385. 117 Wallsten, p. 381. 118 Wallsten, p. 386. 119 Wallsten, p. 387. 120 Wallsten, p. 390.

Affidavit of Trevor R. Roycroft, Ph.D. On Behalf of NASUCA
WC Docket No. 10-90; GN Docket No. 09-51; WC Docket No. 05-337 _________________________________________________________________________________________________________
40
deliver weak bidding competition. As was discussed earlier, given the more demanding
objective of 100 Mbps/50 Mbps service, the Commission may face a decreasing number of
technology platforms that are capable of delivering this service objective, thus reducing both the
potential number of bidders and the potential of auctions to deliver benefits. Regulatory
mechanisms typically reflect a set of carrots and sticks which are designed to achieve a public
policy objective. The Commission must develop a new incentive structure to enable the
successful pursuit of its broadband objectives in high-cost areas. The ultimate design of any new
regulatory mechanism with regard to broadband deployment hinges in no small part on the
results of the modeling process. Projecting the least costly technology deployment path will
necessarily influence how the Commission should proceed. While the specific details of this
new regulatory mechanism should be addressed through a separate rulemaking, I believe that the
Commission should consider developing a regulatory approach that leverages legacy universal
service support mechanisms, but which also encourages entry if it finds that the ILEC unwilling
or unable to deliver the Commission’s desired broadband objectives within the constraints that
are projected by a robust broadband model.
For example, if the Commission were to determine that the anticipated least cost
technology deployment path were 12 kft DSL followed by FTTP, the Commission’s pre-existing
relationship with (and regulatory authority over) ILECs will likely result in this industry sector
offering the most expedient vehicle for pursuing the Commission’s initial broadband goals.
ILECs are likely to have facilities in the broadest service areas, and are likely already receiving
voice support. The Commission will have more leverage with service providers that already
receive voice support. The Commission should utilize this leverage to assist with the extension
of broadband into areas where the ILEC receives voice support, but does not have broadband, or
needs to upgrade existing broadband to meet the Commission’s speed objectives. As was
discussed earlier, gaining information about the impact of existing voice subsidies on service

Affidavit of Trevor R. Roycroft, Ph.D. On Behalf of NASUCA
WC Docket No. 10-90; GN Docket No. 09-51; WC Docket No. 05-337 _________________________________________________________________________________________________________
41
providers, and understanding the services the voice support has enabled will improve the
Commission’s ability to efficiently determine where services need to be upgraded, and on the
support that is needed to meet the Commission’s objectives.
As the Commission’s ultimate goal is to deploy 100 Mbps service, it must face the fact
that legacy ILEC technology platforms are unlikely to be capable of delivering this level of
service. Sooner or later the Commission will confront the prospect of supporting the deployment
of a new technology platform. Keeping all options open with regard to the encouragement of
alternative providers, such as municipal fiber, or cable television systems, would appear to be a
reasonable course of action.
In areas where broadband service does not exist, and where there is no supported voice
provider, an alternative approach could be pursued. The Commission, after identifying unserved
areas, could publicly notice the desired technology specifications, and its intention to distribute
support in the geographic area. The Commission could then enter into negotiation with any
adjacent ILEC, any facilities-based CLECs, fixed or mobility wireless providers, or other entities
(municipalities) that would consider operating in the target area and negotiate the delivery of the
specified grade of services and the level of subsidy. By developing a robust model, the
Commission could identify the level of minimum support that the modeling projected, and allow
interested parties to respond by either accepting the level of support, or by making a
counterproposal that would require the interested party to explain why the model is wrong, and
to specifically identify the differences between the Commission’s identified level of support and
the support claimed to be needed by the interested party.121 Under this scenario, the results of
the model could again be leveraged by the Commission and serve as a starting point of
121 Use of this approach would likely benefit from anti-collusion rules and a bilateral negotiation format, should there be more than one interested party.

Affidavit of Trevor R. Roycroft, Ph.D. On Behalf of NASUCA
WC Docket No. 10-90; GN Docket No. 09-51; WC Docket No. 05-337 _________________________________________________________________________________________________________
42
negotiation. Furthermore, the Commission would gain information as it utilized the broadband
model’s information and entered into agreements around the country.
Finally, it is important that the process for the distribution of support includes the states.
As is evident from the staff report, the geographic scope of this problem is vast, and the size of
the project will only increase over time as the Commission pursues its 100 Mbps objective.
Furthermore, many states are already pursuing broadband expansion programs,122 and
coordinating the efforts of the Commission and state agencies will improve the overall efficiency
of the process of expanding broadband availability.
C. Expedited Process for Distributing Support
The NOI seeks comment on the potential to deliver support on an expedited basis to
unserved areas, and references the proposal made by the 71 Concerned Economists for the
distribution of stimulus grants.123 The NOI mentions that the “bidding parties themselves would
be allowed to specifically define the geographic units and other service characteristics associated
with their bids.124 The idea floated in the NOI to deliver expedited support has elements that are
similar to the California Public Utilities Commission’s “California Advanced Services Fund”
(CASF). This fund was established using monies typically targeted for voice service support in
high cost areas, and relied on the nomination of unserved and underserved areas, based on a
broadband speed standard of 3 Mbps downstream and 1 Mbps upstream.125 The CASF grant is
one-time money, and the recipient is expected to provide 60% of the project’s financing.126
122 See, for example, “Pew Report Finds States are Essential to Broadband Expansion,” June 21, 2010. The full Pew study “Bringing America Up to Speed: States’ Role in Expanding Broadband,” is available at: http://www.pewtrusts.org/uploadedFiles/wwwpewtrustsorg/Reports/Economic_Competitiveness/broadband_report.pdf 123 NOI, ¶ 43. 124 NOI, ¶ 45. 125 CPUC Decision 07-12-054, December 20, 2007. 126 The CASF program was later modified to allow applicants to take advantage of the broadband funding available through the American Recovery and Reinvestment Act (Recovery Act)

Affidavit of Trevor R. Roycroft, Ph.D. On Behalf of NASUCA
WC Docket No. 10-90; GN Docket No. 09-51; WC Docket No. 05-337 _________________________________________________________________________________________________________
43
CASF evaluates proposals, but does not employ a cost model. Thus, the approach lacks the
additional grounding that the existence of a model would provide. According to data released
by the CPUC, the CASF program had earmarked $91.37 million for 44 projects as of May 5,
2010.127 Table 3, below, summarizes the CASF earmarks.
Table 3: CASF Fund Earmarks
Project Type CASF Funds Earmarked
Number of Projects
Unserved Areas $12,040,000 17
Underserved Areas $79,330,000 27
What is clear from the data contained in Table 3 is that the CASF program has been much more
successful in attracting projects for “underserved” areas, rather than unserved areas. The CASF
program has earmarked 6.6 times as much funding to underserved areas as to unserved areas.
The experience of the CASF may point to difficulties in attracting firms into unserved areas.
In addition, the majority of the grants identified in Table 3 (totaling $66.92 million) were
made contingent on the applicant receiving funding through the Recovery Act. On May 20,
2010, the California Commission rescinded over $38 million in awards due to the failure of the
applicant to secure the needed Recovery Act funding.128 More research is needed to fully
evaluate the CASF program and any lessons that it may have for the Commission.
As is the case with the CASF, the downside of the self-selection of geographic areas by
the service provider that is advocated by the 71 Concerned Economists is that the Commission
has more limited ability to establish priorities with regard to the deployment of broadband. Even
if the Commission were to limit projects to unserved areas, self-selection would likely target the
programs. Under this modification, the CASF would provide 10% of the needed funds for a project, thus leaving the applicant to supply 10% of their own funds (assuming the receipt of the 80% federal grant). See CPUC Decision D.09-07-020, available at: http://docs.cpuc.ca.gov/WORD_PDF/FINAL_DECISION/104225.PDF 127 CPUC Resolution T-17274, May 20, 2010, p. 2. 128 CPUC Resolution T-17272, May 20, 2010. Available at: http://docs.cpuc.ca.gov/WORD_PDF/FINAL_RESOLUTION/118542.PDF

Affidavit of Trevor R. Roycroft, Ph.D. On Behalf of NASUCA
WC Docket No. 10-90; GN Docket No. 09-51; WC Docket No. 05-337 _________________________________________________________________________________________________________
44
low-hanging fruit, leaving the more difficult cases unaddressed. Similarly, the process could
yield substantially differing levels of entry depending on whether there was an ILEC in place
that did not provide broadband, but which received subsidy for voice-service provision. The
expedited approach could result in an insufficient evaluation of the joint provision of voice and
broadband by the ILEC, and could result in excessive support. The existence of incumbents
complicates the picture and raises doubts regarding the merits of self-selection as a general
component of universal service reform.129
D. Recommendations for Auction Structure
In the preceding discussion, I have focused on the likelihood that auctions will not
perform well, and have suggested an alternative approach to leverage the information gained
from the model to assist with the determination of subsidy levels. In the discussion below, I
address the structure of auctions, should the Commission decide to proceed with the reverse
auction approach.
1. Prequalification and Post-Grant Outcomes
The 71 Concerned Economists state that prescreening should be established for “weeding
out and correcting frivolous bidding.”130 The Commission should obviously be concerned about
who will get the support, and what happens to those firms following the auction’s close. Should
the Commission decide to pursue auctions, potential bidders should be required to file a plan
with the Commission which identifies the technology that they propose to provide if they are the
auction winner, and how their technology proposal satisfies the Commission’s standards. It also
makes sense, as part of the qualification process, to assess the financial fitness of the bidder.
129 Furthermore, how self-selection would be applied should the Commission decide to address reform of the existing voice subsidy program in areas that already have a broadband provider that is supported under the existing voice service support program is not clear. 130 Statement of 71 Concerned Economists, p. 7.

Affidavit of Trevor R. Roycroft, Ph.D. On Behalf of NASUCA
WC Docket No. 10-90; GN Docket No. 09-51; WC Docket No. 05-337 _________________________________________________________________________________________________________
45
The auction process should also have provisions which limit the potential for “hold up,”
i.e., a bidder wins the auction through a low bid and later announces that it cannot meet the
obligation associated with the winning bid, and demands higher compensation. This problem
has occurred in some auctions conducted in Latin America.131 The Commission should also take
to heart the lessons learned from the NextWave spectrum auction experience. NextWave won
spectrum licenses, and then filed for bankruptcy. In spite of the fact that NextWave had not paid
off the licenses, the U.S. Supreme Court allowed NextWave to keep the licenses.132 Carrier
bankruptcy problems with universal service auctions could tie up support payments in a similar
fashion.
2. A Model Should be used to Set Reserve Prices
Should the Commission apply an auction approach to the distribution of support, it would
be well-advised to utilize the information from the model to set reserve prices at some small
increment above the model’s projected support-level associated with the least-cost technology.133
Use of existing support levels is not a reasonable starting point for setting reserves, especially
given the likelihood of weak bidding competition. Should the Commission pursue reverse
auctions, using the model to set reserve prices would be likely to improve the efficiency of the
outcome by leveraging the information generated by the model. Setting a reserve price well
below the second-lowest-cost technologies’ threshold value would also encourage the firm that is
131“Leveraging Telecommunications Policies for Pro-Poor Growth—Universal Access Funds with Minimum-Subsidy Auctions,” OECD Document, October 22, 2004, p. 18. 132See “NextWave, FCC Settle Wireless Spectrum Battle,” e-Week.com, April 21, 2004. http://www.eweek.com/article2/0,1895,1571739,00.asp 133 The Commission must recognize that if it is used in conjunction with a market-based distribution mechanism, the existence of the NBP model and its results will necessarily influence the behavior of bidders. Only the bidders know the true minimum level of subsidy that they are willing to accept. While the model might produce some “benchmark” results, the knowledge of these results could distort a competitive bidding process, leading bidders to focus on the model’s results, and how to strategically respond to the model’s results. The model’s results may generate an undesired “floor” in the bidding process. This may be an unavoidable problem.

Affidavit of Trevor R. Roycroft, Ph.D. On Behalf of NASUCA
WC Docket No. 10-90; GN Docket No. 09-51; WC Docket No. 05-337 _________________________________________________________________________________________________________
46
associated with the second-lowest-cost technology to “sharpen its pencil” by weighing the level
of subsidy in light of aspects of its business plan that can never be fully considered by an
independent model (e.g., specific marketing strategies, “add-on” services offered by the firm,
purchasing economies or unused equipment that may be specific to the firm, economies of scale
that may be available due to the proximity of the unserved area to other areas that are already
served by the company, etc.).
Of course, if the number of potential bidders is small (which seems to be a reasonable
expectation), then the bidders may behave collusively and cause the auction to fail at the lower
reserve price. The lack of entry in an auction is a risk that the Commission must recognize in the
larger context of whether auctions hold any promise as a mechanism to distribute support.
3. Sealed Bid Auctions are Likely Superior for Universal Service Auctions
Auctions with small numbers of bidders are more susceptible to collusion, and an open
bidding process would be more likely to encourage collusion. Returning to Professor Klemperer
on the issue of collusion:
Another elegant example of bidders' ability to “collude” is provided by the 1999 German DCS 1800 auction in which ten blocks of spectrum were sold by ascending auction, with the rule that any new bid on a block had to exceed the previous high bid by at least 10 percent. There were just two credible bidders, the two largest German mobile phone companies T Mobil and Mannesman, and Mannesman's first bids were 18.18 million deutschmarks per megahertz on blocks 1-5 and 20 million deutschmarks per MHz on blocks 6-10. T Mobil--who bid even less in the first round--later said “There were no agreements with Mannesman. But [we] interpreted Mannesman's first bid as an offer.” The point is that 18.18 plus a 10 percent raise equals 20.00. It seems T Mobil understood that if it bid 20 million deutschmarks per MHz on blocks 1-5, but did not bid again on blocks 6-10, the two companies would then live and let live with neither company challenging the other on the other's half. Exactly that happened. So the auction closed after just two rounds with each of the bidders acquiring half the blocks for the same low price, which was a small fraction of the valuations that the bidders actually placed on the blocks.134
134 Klemperer, Paul, “Using and Abusing Economic Theory,” 2002 Alfred Marshall Lecture to the European Economic Association, p. 13. http://www.nuff.ox.ac.uk/economics/papers/2003/W2/usingandabusing.pdf

Affidavit of Trevor R. Roycroft, Ph.D. On Behalf of NASUCA
WC Docket No. 10-90; GN Docket No. 09-51; WC Docket No. 05-337 _________________________________________________________________________________________________________
47
It is all too easy to envision bid signaling emerging if an auction was characterized by a
small number of bidders.
Auctions can be structured with an open outcry or sealed bid format. Outcry auction
formats, such as the FCC’s spectrum auctions, encourage the exchange of information. The
exchange of information among bidders can be beneficial to the seller when the item to be
auctioned has “common value” characteristics. Common values exist when the item to be
auctioned will have similar value to any bidder, but the bidders don’t know with certainty what
that value is. Bidders must use their private information and abilities to estimate the value of the
item, and formulate bids.135 When common values are present, an open outcry auction is more
likely to generate a better outcome for the seller (i.e., higher revenues in the event of an
ascending bid process, or lower expenditures in the event of a descending bid process).
However, in the case of universal service subsidies, there is less likelihood that common
values exist. A cable operator or municipal broadband provider will have a very different cost
structure than an ILEC, thus there is no reason to expect that a cable operator or municipal
broadband provider would gain any useful information regarding the formulation of its bid by
observing the bids of an incumbent wireline carrier.136 If, for example, a cable operator could
offer the broadband service at a substantially lower cost than the ILEC, observing an
incumbent’s very reluctant reductions in bids could easily result in the cable operator winning
the auction with an unnecessarily high subsidy margin above its costs.
It is notable that the staff’s projection of the broadband “gap” reflects the apparent belief
on staff’s part that there will not be much auction entry. The staff uses a Vickrey or “second
price” auction interpretation of determining the size of the gap. Based on comments made
135 Baye, M. Managerial Economics and Business Strategy, 3rd Ed. Irwin McGraw-Hill, 2000, p. 466. See also, Klemperer, P. Auctions: Theory and Practice, Princeton University Press, 2004, p. 13. 136 I.e., useful from the seller’s point of view.

Affidavit of Trevor R. Roycroft, Ph.D. On Behalf of NASUCA
WC Docket No. 10-90; GN Docket No. 09-51; WC Docket No. 05-337 _________________________________________________________________________________________________________
48
during the May 6, 2010 workshop, the staff's logic appears to be based on the assumption that if
support was auctioned off, the lowest-cost technology provider would place bids that only
slightly undercut the next most inefficient technology.137 In other words, the staff's underlying
assumption is that there will not be much competitive bidding for subsidy, such as that which
might occur if multiple low-cost providers entered the auction. Presumably, the application of a
model will provide the Commission with information that is outside the scope of what normally
might be expected in the information economics of an auction setting—the Commission should
leverage that information to the fullest.
4. Bidding for Support Must Account for the Price of Supported Services
If the Commission does not constrain the price for basic broadband service, evaluation of
a winning bid in an auction will be impossible. Absent a price constraint on the supported
service, bidders could game the system by offering a low bid, but charging a higher price for the
supported service. As the Commission has indicated that the extension of broadband into
unserved areas will be on a monopoly basis,138 there is every reason to expect that the winning
bidder will have market power. The price charged by the winning bidder will have an impact on
the level of broadband penetration, and on the objective of affordable broadband.139 Regardless
of the distribution mechanism utilized for broadband support, the Commission must recognize
that a key element in determining the efficient level of support is the price of the supported
service. The Commission must review the prices of supported services and ensure that they are
affordable and reasonably comparable to those in urban areas.
137 Workshop Transcript, p. 56. 138 “Connecting America: The National Broadband Plan,” p. 145. “There should be at most one subsidized provider of broadband per geographic area.” The NBP model also assumes only one supported provider (p. 38). 139 Id., p. xiii.

Affidavit of Trevor R. Roycroft, Ph.D. On Behalf of NASUCA
WC Docket No. 10-90; GN Docket No. 09-51; WC Docket No. 05-337 _________________________________________________________________________________________________________
49
5. Compliance of Auction Winners
The NOI does not discuss issues associated with compliance monitoring in an auction
environment. Regulatory compliance should be focused on ensuring that the build-out satisfies
the Commission’s standards and benchmarks; the satisfaction of minimum quality standards; and
that prices charged for basic service do not exceed those specified in the auction process.
Follow-up and audit is a natural part of the use of reverse auctions. For example, reverse
auctions held in Peru for the deployment of payphone deployments in unserved areas linked the
payment of subsidy monies over time with the satisfaction of government-established
performance standards.140 Audit processes necessary to ensure compliance may include
evaluation of network deployment and the ability of all households in the specified area to utilize
the supported service. The Commission must carefully consider the impact of the compliance
monitoring needed to ensure successful auction outcomes.
E. Conclusion of Auction Discussion
Reliance on a “market-based” mechanism to determine funding levels for universal
service support will introduce new risks into an already challenging process. The Commission
should expect that a market-based approach will not generate substantial bidding competition in
many, if not most, market areas. The Commission can rest assured that the application of
auctions with a small number of bidders will generate inefficient results. The Commission must
develop a robust cost and revenue model to assist with the distribution of support. Information
on projected costs and revenues will give the Commission some leverage in working with
potential service providers to deliver an efficient level of support.
140 Cannock, G. “Telecom Subsidies: Output-Based Contracts for Rural Services in Peru,” World Bank Note Number 234, June 2001. http://rru.worldbank.org/Documents/PapersLinks/Peru-605.pdf

Affidavit of Trevor R. Roycroft, Ph.D. On Behalf of NASUCA
WC Docket No. 10-90; GN Docket No. 09-51; WC Docket No. 05-337 _________________________________________________________________________________________________________
50
V. Conclusion
Delivering affordable broadband service to all Americans will require a disciplined effort
on the part of the Commission. Given the existing state of universal service funding, the
Commission would be well advised to use the opportunity to extend high-quality and affordable
broadband to put its house in order with respect to existing universal service support. As the
Commission confronts these challenges, it must have high-quality information. The Commission
has benefited from the development of cost models in the past, and given the complexity of the
process of revising the universal service program to support both voice and broadband, the
development of a robust broadband model can only help the Commission make the appropriate
choices as the process unfolds. While I do not advise the Commission to apply a reverse auction
approach to determine support levels, a robust model will likely generate better outcomes in the
reverse auction setting than if the Commission does not employ a model to assist with that
process. Thus, efforts directed at the development of a model are likely to yield benefits
regardless of the ultimate path selected by the Commission regarding the determination of
support levels.

Affidavit of Trevor R. Roycroft, Ph.D. On Behalf of NASUCA
WC Docket No. 10-90; GN Docket No. 09-51; WC Docket No. 05-337 _________________________________________________________________________________________________________
51
Appendix: The FCC 97-157 Criteria
The criteria from the FCC 97-157 Order are reproduced below. While the FCC was
focused on supporting voice services at the time, the general economic cost principles
enumerated by the FCC continue to be valid. Brief comment is provided following each
criterion to focus on the general principles identified by the Commission.
(1) The technology assumed in the cost study or model must be the least-cost, most-efficient, and reasonable technology for providing the supported services that is currently being deployed A model, however, must include the ILECs' wire centers as the center of the loop network and the outside plant should terminate at ILECs' current wire centers. The loop design incorporated into a forward-looking economic cost study or model should not impede the provision of advanced services. For example, loading coils should not be used because they impede the provision of advanced services. We note that the use of loading coils is inconsistent with the Rural Utilities Services guidelines for network deployment by its borrowers. Wire center line counts should equal actual ILEC wire center line counts, and the study's or model's average loop length should reflect the incumbent carrier's actual average loop length.
Comment: This criterion appropriately focuses on the modeling of least-cost, most-efficient and reasonable technology. In light of the Commission’s technical neutrality objective for broadband networks, multiple technologies must be assessed, using consistent methodology, to identify the economic costs of the various alternatives. This criterion also contains the important requirement that the cost modeling must be able to meet all demand in the geographic area to be modeled.
The discussion of ILEC wire centers as the center of “loop network” introduces a fixed component in network design. This may raise costs off of the true least-cost point, however, to the extent that this criteria is applied to other technology platforms, e.g., existing wireless towers and existing cable head-end locations, any cost bias will be reflected in the cost modeling of all alternatives.
(2) Any network function or element, such as loop, switching, transport, or signaling, necessary to produce supported services must have an associated cost.
Comment: While this criterion is directed at wireline ILEC technology, the underlying principal continues to be valid. The Commission should continue to ensure that costs associated with each function or element of any technology needed to produce supported service has an associated cost.
(3) Only long-run forward-looking economic cost may be included. The long-run period used must be a period long enough that all costs may be treated as variable and avoidable. The costs must not be the embedded cost of the facilities, functions, or elements. The study or model, however, must be based upon an examination of the current cost of purchasing facilities and equipment, such as switches and digital loop carriers (rather than list prices).

Affidavit of Trevor R. Roycroft, Ph.D. On Behalf of NASUCA
WC Docket No. 10-90; GN Docket No. 09-51; WC Docket No. 05-337 _________________________________________________________________________________________________________
52
Comment: This criterion identifies the critical “forward-looking” perspective and correctly specifies the “run” that is appropriate for conducting cost studies for universal service support—i.e., the “long run.” The true least-cost solution can be identified only when modeling treats all costs as variable. Likewise, the requirement that current costs rather than list prices be applied continues to be an appropriate component of modeling costs of supported services.
(4) The rate of return must be either the authorized federal rate of return on interstate services, currently 11.25 percent, or the state's prescribed rate of return for intrastate services. . . We will re-evaluate the cost of capital as needed to ensure that it accurately reflects the market situation for carriers.
Comment: As suggested in the last sentence of this criterion, the Commission must re-evaluate the cost of capital. Forward-looking capital costs are significantly different from those associated with conditions existing in 1990.
(5) Economic lives and future net salvage percentages used in calculating depreciation expense must be within the FCC-authorized range. . . .
Comment: The cost modeling exercise now before the Commission must address economic depreciation anew in light of the rapid growth in consumer demand for bandwidth, and Commission’s overarching objective to deliver 100 Mbps service. Any modeling must accurately account for the anticipated obsolescence of plant along any modeled technology deployment path, and must also correctly identify the associated salvage values of plant. Another reason to address depreciation in a more comprehensive fashion is the fact that depreciation lives prescribed by the FCC may not be sufficiently specific for non-ILEC technology deployments. The FCC should address economic depreciation and salvage value issues to support high-quality modeling in a separate proceeding.
(6) The cost study or model must estimate the cost of providing service for all businesses and households within a geographic region. This includes the provision of multi-line business services, special access, private lines, and multiple residential lines. Such inclusion of multi-line business services and multiple residential lines will permit the cost study or model to reflect the economies of scale associated with the provision of these services.
Comment: This provision regarding the level of demand associated with the geographic scope of services continues to be appropriate. All carrier networks jointly provide business and residential services. As a result, scale economies are generated. If these scale economies are not recognized by modeling only a network that is capable of delivering supported services to a single customer class, the projected support levels will not be accurate.
(7) A reasonable allocation of joint and common costs must be assigned to the cost of supported services. This allocation will ensure that the forward-looking economic cost does not include an unreasonable share of the joint and common costs for non-supported services.
Comment: The scope of supported services is expanding to include broadband, as well as voice. The issue of the allocation of joint and common costs is a necessary

Affidavit of Trevor R. Roycroft, Ph.D. On Behalf of NASUCA
WC Docket No. 10-90; GN Docket No. 09-51; WC Docket No. 05-337 _________________________________________________________________________________________________________
53
outcome of modeling the total cost of provision, and will ensure that service families, especially voice services, benefit from the expansion of scope economies that result from the addition of broadband services.
(8) The cost study or model and all underlying data, formulae, computations, and software associated with the model must be available to all interested parties for review and comment. All underlying data should be verifiable, engineering assumptions reasonable, and outputs plausible.
Comment: The cost modeling process must be open. This criterion continues to be a valid component of modeling universal service support.
(9) The cost study or model must include the capability to examine and modify the critical assumptions and engineering principles. These assumptions and principles include, but are not limited to, the cost of capital, depreciation rates, fill factors, input costs, overhead adjustments, retail costs, structure sharing percentages, fiber-copper cross-over points, and terrain factors.
Comment: The cost modeling process must allow for alternative runs of any cost model. Proprietary models that cannot be controlled by any interested party do not provide a reasonable foundation for developing universal service support.
(10) The cost study or model must deaverage support calculations to the wire center serving area level at least, and, if feasible, to even smaller areas such as a Census Block Group, Census Block, or grid cell. We agree with the Joint Board's recommendation that support areas should be smaller than the carrier's service area in order to target efficiently universal service support.
Comment: The general principle described in this continues to be appropriate. The potential for support must be calculated at a relatively granular level to ensure that support levels can be kept at a minimum, and so that alternative technologies can be appropriately evaluated.

Affidavit of Trevor R. Roycroft, Ph.D. On Behalf of NASUCA
WC Docket No. 10-90; GN Docket No. 09-51; WC Docket No. 05-337 _________________________________________________________________________________________________________
Attachment 1
Dr. Roycroft’s Vitae
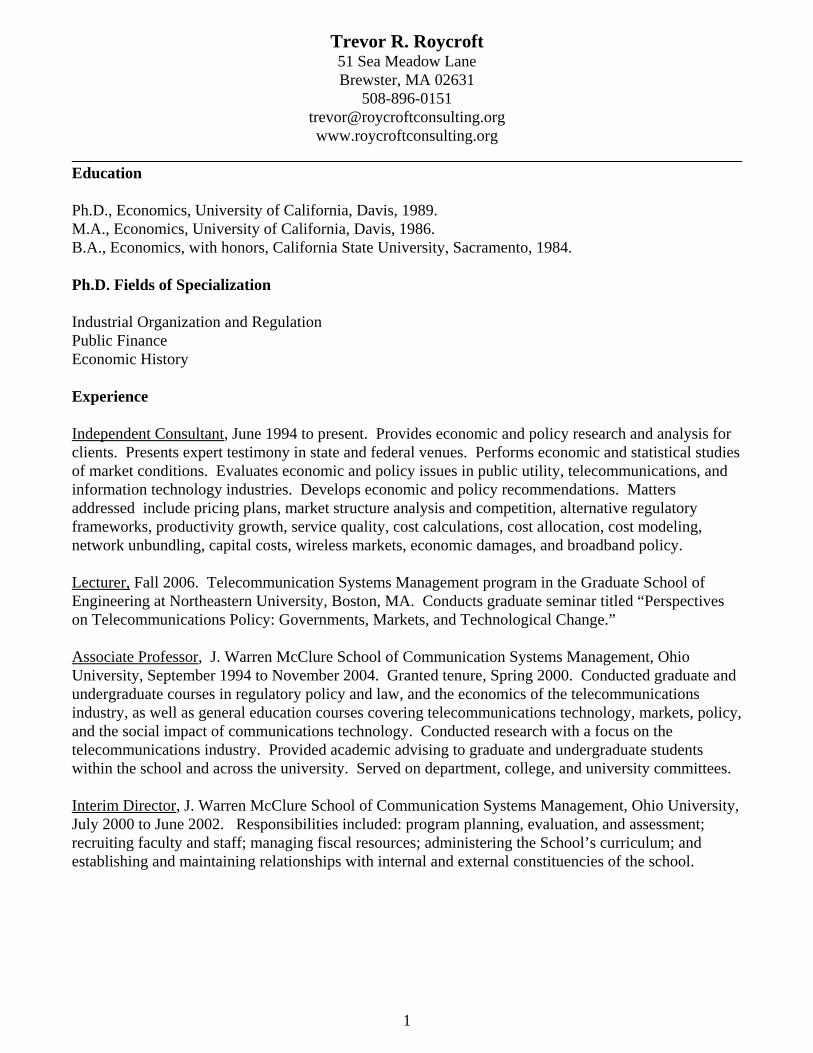
1
Trevor R. Roycroft51 Sea Meadow LaneBrewster, MA 02631
508-896-0151trevor@roycroftconsulting.orgwww.roycroftconsulting.org
Education
Ph.D., Economics, University of California, Davis, 1989.M.A., Economics, University of California, Davis, 1986.B.A., Economics, with honors, California State University, Sacramento, 1984.
Ph.D. Fields of Specialization
Industrial Organization and RegulationPublic FinanceEconomic History
Experience
Independent Consultant, June 1994 to present. Provides economic and policy research and analysis forclients. Presents expert testimony in state and federal venues. Performs economic and statistical studiesof market conditions. Evaluates economic and policy issues in public utility, telecommunications, andinformation technology industries. Develops economic and policy recommendations. Mattersaddressed include pricing plans, market structure analysis and competition, alternative regulatoryframeworks, productivity growth, service quality, cost calculations, cost allocation, cost modeling,network unbundling, capital costs, wireless markets, economic damages, and broadband policy.
Lecturer, Fall 2006. Telecommunication Systems Management program in the Graduate School ofEngineering at Northeastern University, Boston, MA. Conducts graduate seminar titled “Perspectiveson Telecommunications Policy: Governments, Markets, and Technological Change.”
Associate Professor, J. Warren McClure School of Communication Systems Management, OhioUniversity, September 1994 to November 2004. Granted tenure, Spring 2000. Conducted graduate andundergraduate courses in regulatory policy and law, and the economics of the telecommunicationsindustry, as well as general education courses covering telecommunications technology, markets, policy,and the social impact of communications technology. Conducted research with a focus on thetelecommunications industry. Provided academic advising to graduate and undergraduate studentswithin the school and across the university. Served on department, college, and university committees.
Interim Director, J. Warren McClure School of Communication Systems Management, Ohio University,July 2000 to June 2002. Responsibilities included: program planning, evaluation, and assessment;recruiting faculty and staff; managing fiscal resources; administering the School’s curriculum; andestablishing and maintaining relationships with internal and external constituencies of the school.
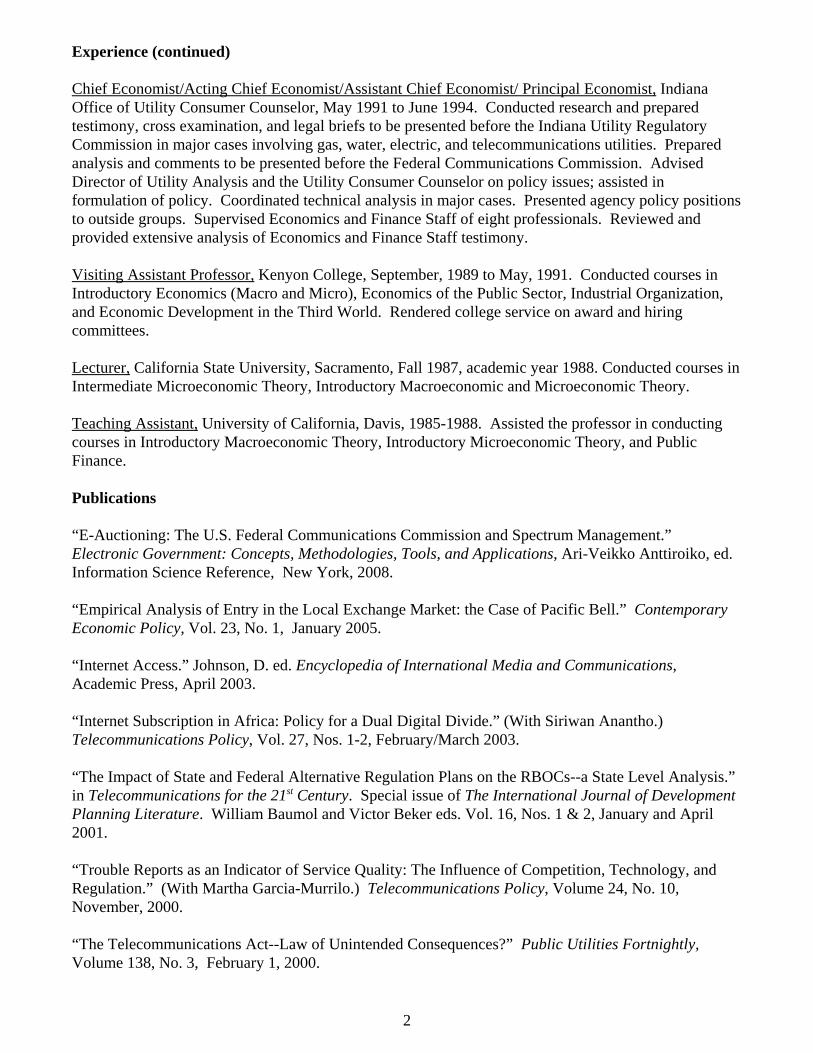
2
Experience (continued)
Chief Economist/Acting Chief Economist/Assistant Chief Economist/ Principal Economist, IndianaOffice of Utility Consumer Counselor, May 1991 to June 1994. Conducted research and preparedtestimony, cross examination, and legal briefs to be presented before the Indiana Utility RegulatoryCommission in major cases involving gas, water, electric, and telecommunications utilities. Preparedanalysis and comments to be presented before the Federal Communications Commission. AdvisedDirector of Utility Analysis and the Utility Consumer Counselor on policy issues; assisted informulation of policy. Coordinated technical analysis in major cases. Presented agency policy positionsto outside groups. Supervised Economics and Finance Staff of eight professionals. Reviewed andprovided extensive analysis of Economics and Finance Staff testimony.
Visiting Assistant Professor, Kenyon College, September, 1989 to May, 1991. Conducted courses inIntroductory Economics (Macro and Micro), Economics of the Public Sector, Industrial Organization,and Economic Development in the Third World. Rendered college service on award and hiringcommittees.
Lecturer, California State University, Sacramento, Fall 1987, academic year 1988. Conducted courses inIntermediate Microeconomic Theory, Introductory Macroeconomic and Microeconomic Theory.
Teaching Assistant, University of California, Davis, 1985-1988. Assisted the professor in conductingcourses in Introductory Macroeconomic Theory, Introductory Microeconomic Theory, and PublicFinance.
Publications
“E-Auctioning: The U.S. Federal Communications Commission and Spectrum Management.” Electronic Government: Concepts, Methodologies, Tools, and Applications, Ari-Veikko Anttiroiko, ed.Information Science Reference, New York, 2008.
“Empirical Analysis of Entry in the Local Exchange Market: the Case of Pacific Bell.” ContemporaryEconomic Policy, Vol. 23, No. 1, January 2005.
“Internet Access.” Johnson, D. ed. Encyclopedia of International Media and Communications,Academic Press, April 2003.
“Internet Subscription in Africa: Policy for a Dual Digital Divide.” (With Siriwan Anantho.)Telecommunications Policy, Vol. 27, Nos. 1-2, February/March 2003.
“The Impact of State and Federal Alternative Regulation Plans on the RBOCs--a State Level Analysis.” in Telecommunications for the 21st Century. Special issue of The International Journal of DevelopmentPlanning Literature. William Baumol and Victor Beker eds. Vol. 16, Nos. 1 & 2, January and April2001.
“Trouble Reports as an Indicator of Service Quality: The Influence of Competition, Technology, andRegulation.” (With Martha Garcia-Murrilo.) Telecommunications Policy, Volume 24, No. 10,November, 2000.
“The Telecommunications Act--Law of Unintended Consequences?” Public Utilities Fortnightly,Volume 138, No. 3, February 1, 2000.

3
Publications, Continued
“Alternative Regulation and the Efficiency of Local Exchange Carriers--Evidence from the AmeritechStates.” Telecommunications Policy, Volume 23, No. 6, July, 1999.
“The Billy Goats Gruff. A Fairy Tale for the Third Anniversary of the Telecommunications Act of1996.” Info: The Journal of Policy, Regulation and Strategy for Telecommunications, Information and Media, Volume 1, No. 2, April, 1999.
“A Dynamic Model of Incumbent LEC Response to Entry Under the Terms of the TelecommunicationsAct of 1996.” Journal of Regulatory Economics, Volume 14, November, 1998.
“Ma Bell’s Legacy: Time for a Second Divestiture?” Public Utilities Fortnightly. Vol 136, No. 12, June15, 1998.
“The Telecommunications Act of 1996: An Unfunded Mandate for the States.” (With Phyllis Bernt.) Central Business Review, Volume XV, No. 2, Summer 1996.
Reports and White Papers
“The Limits of Choice in California’s Residential Telecommunications Markets: Why ‘Competition’ isFailing to Protect Consumers,” March 25, 2009. Available at: http://www.turn.org/article.php?id=839
“Reverse Auctions for Universal Service Funding?”, February 1, 2008. Available athttp://www.roycroftconsulting.org/Roycroft_Consulting_Auction_White_Paper_2-1-08.pdf
“Evaluating Telecommunications Trends: Commission Responsibilities in Evolving Markets.” PolicyWhite Paper Prepared for the Public Counsel Section of the Washington State Office of AttorneyGeneral, September 5, 2007.
“Economic Analysis and Network Neutrality: Separating Empirical Facts from Theoretical Fiction,”May 2006. Available at: http://www.freepress.net/docs/roycroft_study.pdf
“Network Neutrality, Product Differentiation, and Social Welfare. A Response to Phoenix Center PolicyPaper No. 24.” Roycroft Consulting Policy White Paper. May 3, 2006. Available at: http://www.roycroftconsulting.org/response_to_Ford.pdf
“Network Diversity—A Misguided Policy. A Response to Christopher S. Yoo’s ‘Promoting BroadbandThrough Network Diversity’.” Roycroft Consulting Policy White Paper. March 1, 2006. Available at:http://www.roycroftconsulting.org/response_to_Yoo.pdf
“Wireless Consumer Protection: A Model Bill for the States.” AARP Research Center, September,2003.
“The End of Telecommunications? An Epilogue to Tangled Web: The Internet and Broadband OpenAccess Policy.” AARP Research Center, June, 2002.Available at:http://www.aarp.org/research/ppi/cons-prot/telecom/articles/aresearch-import-123-2002-10.html

4
Reports and White Papers (Continued)
“Tangled Web: The Internet and Broadband Open Access Policy.” AARP Research Center, January,2001. Available at:http://www.aarp.org/research/ppi/cons-prot/telecom/articles/tangled_web__the_internet_and_broadband_open_access_policy.html
Conference Papers
“The Impact of State and Federal Alternative Regulation Plans on the RBOCs--a State Level Analysis,”July 1999. Presented at the Western Economic Association International Annual Meeting, San Diego,California.
“The Billy Goats Gruff. A Fairy Tale for the Third Anniversary of the Telecommunications Act of1996,” June, 1999. Presented at the Academic Seminar at the 1999 National Cable TelevisionAssociation Convention, Chicago, Illinois.
“Alternative Regulation and the Efficiency of Local Exchange Carriers--Evidence from the AmeritechStates.” November, 1998. Presented at the 68th Annual Conference of the Southern EconomicAssociation, Baltimore, Maryland.
“A Dynamic Model of Incumbent LEC Response to Entry Under the Terms of the TelecommunicationsAct of 1996.” July 1998. Presented at the Western Economic Association International AnnualMeeting, Lake Tahoe, Nevada.
“Do We have the Bugs Out of Telephone Deregulation?” April 1998. Presented at the Law and PolicyDivision of the Broadcast Education Association, Las Vegas, Nevada.
“The Telecommunications Act of 1996 and Imposed Costs in the Local Exchange Market: A DynamicModel of Incumbent Behavior.” September 1997. Presented at the Telecommunications PolicyResearch Conference, Arlington Virginia.
“Towards an Advanced Information Infrastructure,” August 1995. Presented to the NationalAssociation of Regulatory Utility Commissions' Annual Regulatory Studies Program at Michigan StateUniversity.
“Sorting, Bonding, and Barriers to Entry: Strategies of the Entry Concerned Firm,” July 1990. Presented at the Western Economic Association Meetings, San Diego, California.
Additional Presentations
“Regulatory Response to Rising Residential Rates.” Presented at the Mid-Year Meetings of theNational Association of Utility Consumer Advocates. June, 2009. Boston, MA.
“Overview of Technology Transformation in the PSTN.” Presented at the 2008 Annual Meetings of theNational Association of Utility Consumer Advocates. November 2008. New Orleans, LA.
“Economics and Network Neutrality.” Presented at the 2006 Mid-year Meetings of the NationalAssociation of Utility Consumer Advocates. June 2006. Memphis, TN.

5
Additional Presentations (Continued)
“Consumer Education and Telecommunications Competition.” Presented at the 2006 Mid-year Meetingsof the National Association of Utility Consumer Advocates. June 2006. Memphis, TN.
“Broadband Open Access.” Presented to AARP’s National Legislative Council. October, 2000. Washington, D.C.
“Telecommunications Policy, Markets, and Regulation–Who’s On First?” Presented to the MarylandOffice of Peoples’ Counsel and Maryland Public Service Commission. October, 2000. Baltimore, MD.
“Broadband Open Access–Implications for the Internet and Consumers.” November 1999. Panelist atthe National Association of Utility Consumer Advocates Annual Convention. San Antonio, Texas.
“Validation of Proxy Cost Models.” January 1997. Panel discussant at the Federal CommunicationsCommission workshops on proxy cost models (CC Docket 96-45).
“Impact of the Telecommunications Act of 1996 on Telecommunications Managers.” December 1996.Presented to members of the Association of Telecommunications Professionals. Columbus Ohio.
“Caveat emptor! Local competition, possible effects on prices and the reality of choice.” October 1995.Presented at the Public Information Session on Telephone Competition. Dayton, Ohio.
“Cost Allocation in Network Industries,” August 1995. Presented to the National Association ofRegulatory Utility Commissions' Annual Regulatory Studies Program at Michigan State University.
“Incremental Cost Methodology in Telecommunications,” June 1995. Presented to the Ohio Office ofConsumers' Counsel.
“Regulatory Issues Connected with the Implementation of the Clean Air Act Amendments of 1990,”August 1993. Presented at the Indiana Bar Association's Utility Law Section Summer Meetings.
“Consumer Perspectives on the Ameritech Customer's First Plan,” August 1993. Presented at theAmeritech Regional Regulatory Committee Ad Hoc Working Group Meeting.
“Consumer Perspectives on Universal Telecommunications Service,” December 1992. Presented at theIndiana Utility Regulatory Commission Workshops on Regulatory Flexibility in Telecommunications.
Honors
Competitive paper finalist. The Academic Seminar at the 1999 National Cable Television AssociationConvention, Chicago, Illinois. Paper title: “The Billy Goats Gruff. A Fairy Tale for the ThirdAnniversary of the Telecommunications Act of 1996.”
Courses Taught
Perspectives in Telecommunications Policy: Governments, Markets, and Technological Change Northeastern UniversityCompetition and Market Structure in Network Industries, Ohio University

6
Courses Taught (Continued)
Communication Regulatory Policy, Ohio UniversityApplications of Common Carrier Regulation, Ohio UniversityIntroduction to Common Carrier Regulation, Ohio UniversityIntroduction to Communication Systems Management, Ohio UniversityConsumer Issues in Communication Systems Management, Ohio UniversityTopical Seminar (New Technologies and Telecommunication Policy), Ohio UniversityTopical Seminar (The Telecommunications Act of 1996), Ohio UniversitySpecial Studies in Communication Systems Management, Ohio UniversityEconomics of the Public Sector, Kenyon CollegeIndustrial Organization, Kenyon CollegeEconomic Development in the Third World, Kenyon CollegeIntermediate Microeconomics, California State University, SacramentoMicroeconomic Principles, Kenyon College; California State University, SacramentoMacroeconomic Principles, Kenyon College; California State University, Sacramento
College and University Service
Faculty Advisor, University College, Ohio University, 1998-2004Member, Baker Fund Committee, Ohio University, 2003-2004Member, College of Communication Curriculum Committee, Ohio University, 2003-2004Chair, College of Communication Dean’s Evaluation Committee, Ohio University, 2003-2004Faculty Advisor, Communication Week, Ohio University, 1994-2002Faculty Advisor, Students in Communication Systems Management, Ohio University, 1994-1996Member, University General Education Review Committee, Ohio University, 1998-1999Member, College of Communication Curriculum Committee, Ohio University, 1998-2000Member, College of Communication Graduate Committee, Ohio University, 1997-2002Member, University Calendar Review Task Force, Ohio University, 1996-1997Member, Outstanding Civil Service Award Committee, Ohio University, 1995-1996Member, Mathematics Department Search Committee, Kenyon College, 1990-1991Member, Williams Memorial Award Committee, Kenyon College, 1989-1991
Professional Membership American Economic Association
Ph.D. Dissertation Supervision
“The Examination of Strategic Interactions in One Local Access Telephone Market, the Effects onExpected Price for Access and Universal Access.” Judith Ann Molka-Danielsen. School of InformationSciences, Telecommunications Program, University of Pittsburgh, 1998.
Referee Service
Journal of Regulatory Economics Journal of Economic StudiesTelecommunications Policy Southern Economic JournalSocial Science Computer ReviewUtilities PolicyCommunications of the Association for Information Systems

7
Expert Testimony Presented
California (On behalf of The Utility Reform Network [TURN])
CPUC Cause No. Title Topic
Rulemaking Order Instituting Rulemaking Reverse auctions for universal 06-06-028 into the Review of the California service funding.(June 24, 2008) High Cost Fund B Program
Rulemaking Order Instituting Post-deregulation monitoring.05-04-005 Rulemaking to Assess(March 30, 2007) and Revise Regulation
of TelecommunicationsUtilities
Rulemaking Review of the California Approach to Calculating High Cost 06-06-028 California High Cost Funding.(October 16, 2006) Fund B Program
Rulemaking Review of Affordability of Basic Service.06-05-028 Telecommunications(September 15, 2006) Public Policy Programs
Application: Verizon/MCI Merger Market Structure and Market Power. 05-04-020(August 15, 2005)
Rulemaking Order Instituting Local exchange Competition05-04-005 Rulemaking to Assess and Policy.Direct Declaration and Revise Regulation(May 31, 2005) of TelecommunicationsReply Declaration Utilities(September 2, 2005)
Applications: Review of TELRIC Compliance01-02-024, 01-02-035 UNE Rates of UNE Rates.02-02-031, 02-02-032 Progress of local exchange02-02-034, 02-03-002 competition.(February 7, 2003)Reply Declaration(March 12, 2003)Rebuttal Declaration
Rulemaking Permanent Pricing and Cost Allocation for the93-04-003 Line Sharing High Frequency Portion of theInvestigation Phase II Local Loop in the NGDLC93-04-002 Environment.(Phase II)(July, 2001)

8
California (On behalf of The Utility Reform Network [TURN]) Continued.
CPUC Cause No. Title Topic
Rulemaking Permanent Pricing and Cost Allocation for the93-04-003 Line Sharing High Frequency Portion of theInvestigation Phase I Local Loop.93-04-002(Phase I)(June, 2001)
Canadian Radio-Television and Telecommunications Commission (On Behalf of Action Réseau Consommateur, et al.)
CRTC Case No. Title TopicPublic Notice Review of Price Cap Plan, Productivity and CRTC 2006-5 Price Cap Advanced Services, Competition.(July, 2006) Framework
Public Notice Price Cap Review Price cap regulation and CRTC 2001-37 and Related Issues productivity growth. (August, 2001) Accommodative entry policy.
Colorado (On behalf of AARP)
CPUC Docket No. Title Topic
04A-411T In the Matter of Qwest Analysis of local exchange (February, 2005) Corporation Application market. For Service Reclassification
and Deregulation.
Indiana (On behalf of the AARP and Citizens Action Coalition of Indiana)
IURC Cause No. Title Topic
42405 SBC Indiana’s Request for Analysis of local competition,(October, 2003) Alternative Regulation Price Cap Regulation
and Productivity.
41911 Commission’s Investigation Service Quality Performance.(July, 2001) of Ameritech Indiana Service
Quality
40785-S1, 40849, Approval of Settlement Alternative Regulation, 41058 Agreement between Advanced Services (January, 2001) Ameritech and other Parties Deployment, Service quality.

9
Indiana (On behalf of the AARP and Citizens Action Coalition of Indiana) (Continued)
IURC Cause No. Title Topic
41058 Agreement between Ameritech Cost of Service, Cost (August, 2000) And other Parties Modeling, Compliance with
§254(k)ofthe Telecommunications Act of1996.
40785-S1 Commission’s Investigation Economic Cost of Service/(September, 1999) Ameritech Indiana’s Compliance Cost Allocation.
With Section 254(k) of theTelecommunication Act
40849(November, 1997) Commission’s Own Motion Interim and Permanent
On Ameritech Indiana’s AlternativeRequest for Interim Relief Regulation/Rate Design.
40849 Ameritech Indiana Interim Alternative (September, 1997) Request for Interim Regulation/Rate Design.
Relief
Kansas (On behalf of the Citizens’ Utility Ratepayer Board [CURB])
KCC Docket No. Title Topic
05-SWBT-997-PDR In the Matter of SWBT’s Analysis of local exchange Application for Price market.
(May, 2005) Deregulation of CertainResidential and Business Services
Maryland (On behalf of the Maryland People's Counsel)
MPSC Docket No. Title Topic
8730 Bell Atlantic ISDN pricing and cost of service.(Rebuttal Testimony) ISDN Tariff(November, 1996) Proposal
8730 Bell Atlantic ISDN pricing and cost of service.(Direct Testimony) ISDN Tariff(October, 1996) Proposal

10
Maryland (On behalf of the Maryland People's Counsel) (Continued)
MPSC Docket No. Title Topic
8715 MCI Request Price Cap(Rebuttal Testimony) for Alternative Regulation,(April, 1996) Regulation for Cost Allocation and
Bell Atlantic Loop Cost Recovery.Maryland
8715 MCI Request Price Cap(Direct Testimony) for Alternative Regulation,(March, 1996) Regulation for Cost Allocation and
Bell Atlantic Loop Cost Recovery.Maryland
Ohio (On behalf of the Ohio Consumers’ Counsel)
PUCO Case Nos. Title Topic
09-454-TP-ACO Frontier/Verizon Evaluation of Proposed Frontier/(October, 2009) Merger Approval Verizon Merger
07-829-GA-AIR et al. Dominion East Ohio Automatic Meter Reading, Prudency(June, 2008) Gas Rate Case of Investment.
06-1013-TP-BLS AT&T Ohio Request for Competition for Basic Local(October, 2006) Alternative Regulation Exchange Service.
For Basic Local Exchange
06-1002-TP-BLS Cincinnati Bell Request for Competition for Basic Local(September, 2006) Alternative Regulation Exchange Service.
For Basic Local ExchangeService
05-13050TP-ORD Implementation of H.B. Existence of entry barriers.(December, 2005) 218 Concerning Alternative Appropriate competitive test.(March, 2006) Regulation of Basic Local
Exchange Service.
02-1280-TP-UNC SBC Ohio’s TELRIC TELRIC cost modeling,(May, 2004) Costs for Unbundled Local Competition.
Network Elements
98-1082-TP-AMT SBC/Ameritech Sharing of cost saving.(December, 1998) Request for Approval Total factor productivity
of Merger growth.

11
Ohio (On behalf of the Ohio Consumers’ Counsel, continued.)
PUCO Case Nos. Title Topic
96-899-TP-ALT Cincinnati Bell Price Cap Regulation/(December, 1997) Alternative Rate Rebalancing/
Regulation Rate Design.
94-2019-TP-ACE MFS INTELENET Financial, Managerial,(May, 1995) and Technical Ability to
Provide Local Exchange Service.
93-487-TP-ALT and Ohio Bell: Incremental Costs/93-576-CSS Alternative Fully Distributed Costs/(September, 1994) Regulation Alternative Regulation.
Pennsylvania (On behalf of the Pennsylvania Office of Consumer Advocate)
PUCP Docket No. Title Topic
Docket Nos. Windstream/D&E Evaluation of Proposed Merger;A-2009-2109528, Communications Merger ApprovalA-2009-2109530,A-2009-2109531, and A-2009-3109532(September, 2009)
A-2008-2076038 CenturyTel/Embarq Evaluation of Proposed Merger;(February, 2009) Merger Approval
Virginia (On behalf of Consumer Counsel Section of the Virginia Office of Attorney General)
SCC Docket No. Title Topic
PUC-2007-00008 Verizon Petition Local Exchange Competition;(June, 2007) for Deregulation Market Analysis.
and Detariffing
Washington (On behalf of Public Counsel Section of the Washington Attorney General)
WUTC Docket No. Title Topic
UT-09-0842 Frontier/Verizon Evaluation of Proposed Frontier/(October, 2009) Merger Approval Verizon Merger
UT-08-2119 CenturyTel/Embarq Evaluation of Proposed Merger;(March, 2009) Merger Approval Merger Conditions

12
Washington (On behalf of Public Counsel Section of the Washington Attorney General,continued.)
WUTC Docket No. Title Topic
UT-050814 Verizon/MCI Merger Market Structure and Market Power.(September, 2005) Merger Conditions.
West Virginia (On behalf of the Consumer Advocate Division of the West Virginia Public ServiceCommission)
WVSPC Case No. Title Topic
09-0871-T-PC Frontier/Verizon Evaluation of Proposed Frontier/(November, 2009) Merger Approval Verizon Merger
Indiana (On behalf of the Indiana Consumer Counselor).
IURC Cause No. Title Topic
40611 Ameritech Indiana Approval Analysis of TELRIC studies.(June, 1997) of Statement of Generally
Available Terms
Indiana (On behalf of the Indiana Consumer Counselor).*Testimony prepared, but not filed due to case settlement.
IURC Cause No. Title Topic
39853 Teleport Communications Group Authority to provide intraLATA(March, 1994) of Indiana, Inc. and interLATA Private Line
Services.
39705 Indiana Bell Telephone Alternative Regulation/(January, 1994) Competition/Infrastructure
Deployment/Imputation.
39474 Indiana Payphone Association v. Imputation/separate subsidiary.(May, 1994) Indiana Bell Telephone
39755 GTE North Inc./GTE Divestiture of Assets/Policy.(September, 1993) Intelligent Network
Service Inc.
39718 Ameritech Advanced Data Affiliate Relationships.(August, 1993) Services
39475 Indiana Payphone Association Dial-Around Compensation.(March, 1993)

13
Indiana (On behalf of the Indiana Consumer Counselor, Continued).*Testimony prepared, but not filed due to case settlement.
IURC Cause No. Title Topic
38269-S4 IntraLATA Toll Compensation Toll Rate Deaveraging.(February, 1993)
39369 IURC Investigation into Access Charge Parity/Recovery(February, 1993) Access Charge Parity of Non-Traffic-Sensitive
Costs/Policy.
39618 IURC Investigation into Collocation Policy.(January, 1993) Special Access Collocation
39385 Indiana Bell Telephone: Evaluation of Competition in(October, 1992) Competition and Pricing Dedicated Communications
Flexibility Market/Policy.
39353* Indiana Gas Company Temperature Normalization Tracker/Demand Side
Management/Reproduction Costof Rate Base/Capital Costs.
39314 Indiana Michigan Power Co. Clean Air Act Amendments(September, 1992) /Demand Side Management.
39221 American Telecommunications Financial Viability.(January, 1992) Corporation
39215 Indiana American Water Co. Reproduction Cost of Rate(January, 1992) Base/Capital Costs.
39166 Indiana Cities Water Co. Reproduction Cost of Rate(November, 1991) Base/Capital Costs.
39164/39165 Ohio Valley Gas Corp. Reproduction Cost of Rate(October, 1991) Base/Capital Costs.
39017* IURC Investigation into Reproduction Cost of RateIndiana Bell Earning Base/Capital Costs.

14
Comments Filed
Federal Communications Commission (On Behalf of AARP)
In the Matter of High-Cost Universal Service Support Federal-State Joint Board on Universal Service,WC Docket No. 05-337; CC Docket No. 96-45 (Universal Service Reform and Reverse Auctions). Assisted AARP with preparation of Comments (Filed April 17, 2008), and Reply Comments (Filed June2, 2008).
California Public Utilities Commission (On Behalf of TURN)
Order Instituting Rulemaking into the Review of The California High Cost Fund B Program. (Auctionsfor Universal Service Funding. With Regina Costa and Christine Mailloux. November 9, 2007.)
Federal Communications Commission (On Behalf of Consumer Federation of America,Consumers Union, Free Press, US PIRG).
In the Matter of Broadband Industry Practices. WC Docket No. 07-52. (Supporting documents attachedto Comments. June 15, 2007.)
Federal Communications Commission (On Behalf of Consumer Federation of America,Consumers Union, Free Press, US PIRG).
In the Matter of AT&T Inc. and BellSouth Corporation Applications for Approval of Transfer OfControl, WC Docket No. 06-74. (June 6, 2006.) With Mark Cooper.
Federal Communications Commission (On Behalf of National Association of Utility ConsumerAdvocates)
In the Matter of Federal-State Joint Board on Universal Service, CC Docket 96-45. Affidavitaddressing application of forward-looking economic cost methodology to rural ILECs with 100,000 ormore access lines. (December 14, 2004.)
Federal Communications Commission (On behalf of AARP)
In the Matter of Inquiry into High-Speed Access to the Internet Over Cable and Other Facilities. GNDocket No. 00-185, FCC No. 00-355. “Tangled Web: The Internet and Broadband Open AccessPolicy.” (January 10, 2001).
Indiana Utility Regulatory Commission (On behalf of the Indiana Consumer Counselor)
A Comprehensive Approach to Local Exchange Competition in Indiana (October, 1995).
Indiana Utility Regulatory Commission (On behalf of the Indiana Consumer Counselor)
Comments of the Office of the Office of Utility Consumer Counselor to the TelecommunicationsRegulatory Flexibility Committee (1993).

15
Comments Filed (Continued)
New York Public Service Commission (On behalf of Independent Telephone Companies [NYNEXand Rochester excluded])
Proceeding on Motion of the Commission to Examine Issues Related to the Continued Provision ofUniversal Service and to Develop a Regulatory Framework for the Transition to Competition in theLocal Exchange Market: "Comments on Compensation Arrangements Related to Module 2" (April,1995).
Maine Public Service Commission (On behalf of Independent Telephone Companies [NYNEXexcluded])
Inquiry Into the Provision of Competitive Telecommunications Services (Chapter 280), Docket 94-114: "Reply Comments to the `Preliminary Proposal for a Revision and Restructuring of the Access ChargeProvision of Chapter 280'" (June, 1995).Comments Filed (Continued)
Federal Communications Commission (On behalf of the Indiana Consumer Counselor)
Comments of the Indiana Office of Utility Consumer Counselor on the Ameritech Customers First Plan(1993).
Reply Comments of the Indiana Office of Utility Consumer Counselor on the Ameritech CustomersFirst Plan (1993).
Civil Litigation
Jason Bond and David Lear, individually and as class representatives of those similarly situated v.Veolia Water North America Operating Services, Inc.; Veolia Water North America Operating service,LLC; and Veolia Water Indianapolis, LLC. In the Marion County, Indiana, Superior Court. Analysisand litigation support. 2008; United States District Court, Southern District of Indiana, IndianapolisDivision, Affidavit, June 16, 2008.
Baxter Air, Inc., and for all others similarly situated, Plaintiffs, v. NOS Communications, Inc., NOSVALimited Partnership, Affinity Network, Inc., Robert A. Lichtenstein, and Joseph T. Koppy, Defendants. In the Superior Court of the State of Washington in and for the County of King. Declaration, July 2007.
Brooke Randolph and John Girad, et al, Plaintiffs, v. AT&T Wireless Services Inc., et al. Superior Courtof the State of California in and for the County of Alameda, Unlimited Jurisdiction. Declaration,February 12, 2007. Reply Declaration, April 25, 2007. Declaration, March 4, 2009.
Christopher W. Hesse, Plaintiff v. Sprint Spectrum L.P., Defendant. Nathaniel Olson, Plaintiff v. SprintSpectrum L.P., et al v. Sprint Spectrum L.P. et al. United States District Court Western District ofWashington at Seattle. Declaration, April 30, 2007.
Dawn M. Black, et al, Plaintiffs, v. Indiana Bell Telephone Company, Inc. d/b/a Ameriech Indiana. State of Indiana, Marion County Superior Court. Analysis and litigation support. 2006-2007.

16
Civil Litigation (continued)
Robert Young, et al, Plaintiffs, v. United Telephone of Indiana, Inc. d/b/a Sprint. State of Indiana,Marion County Superior Court. Analysis and litigation support. 2003-2004.
Mark Webber, et al, Plaintiffs, v. Indiana Bell Telephone Company, Inc. d/b/a Ameriech Indiana. Stateof Indiana, Marion County Superior Court. Analysis and litigation support. 2003-2004.
July 2010