BEETROOT VALUE CHAIN PROFILE - nda.agric.za Publications...2.6 Market value Chain for beetroot 25 3....
35
A PROFILE OF THE SOUTH AFRICAN BEETROOT MARKET VALUE CHAIN 2015 Directorate Marketing Tel: 012 319 8455 Private Bag X 15 Fax: 012 319 8131 Arcadia E-mail:[email protected] 0007 www.daff.gov.za
Transcript of BEETROOT VALUE CHAIN PROFILE - nda.agric.za Publications...2.6 Market value Chain for beetroot 25 3....
A PROFILE OF THE SOUTH AFRICAN BEETROOT MARKET VALUE CHAIN
2015
Directorate Marketing Tel: 012 319 8455 Private Bag X 15 Fax: 012 319 8131 Arcadia E-mail:[email protected] 0007 www.daff.gov.za

2
TABLE OF CONTENT 1. DESCRIPTION OF THE INDUSTRY 3
1.1 Production Areas 4
1.2 Production Trends 4
1.3 Production vs. Consumption of beetroot 5
2. MARKET STRUCTURE 5
2.1 Domestic market and price 5
2.2 South Africa Beetroot Exports 7
2.3 Share Analysis 15
2.4 South African beetroot Imports 18
2.5 Processing 23
2.6 Market value Chain for beetroot 25
3. MARKET INTELLEGENCE 26
3.1 Tariffs 26
3.2 Non tariff barriers 28
4. GENERAL DISTRIBUTION CHANNELS 30
5. LOGISTICAL ISSUES 30
5.1 Mode of transport 30
5.2 Cold chain management 31
5.3 Packaging 31
6. COMPETIVENESS OF SOUTH AFRICA BEETROOT EXPORTS 31
7. ACKNOWLEDGEMENTS 35
3
1. DESCRIPTION OF THE INDUSTRY
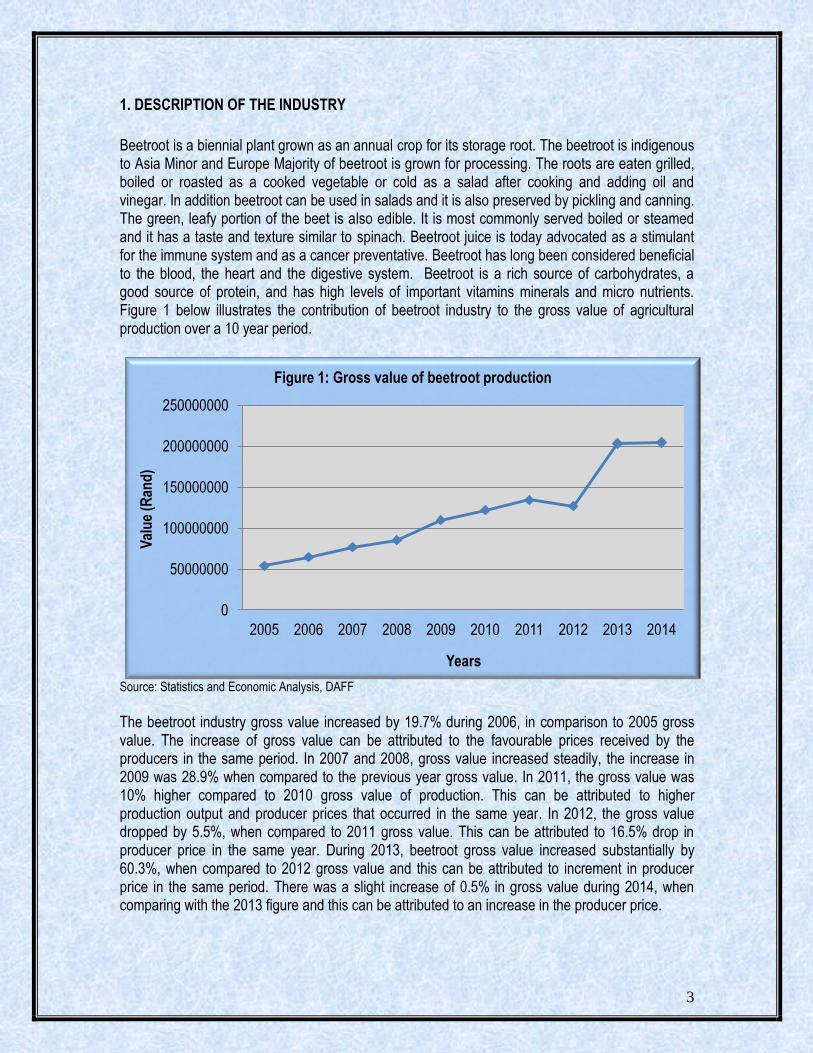
Beetroot is a biennial plant grown as an annual crop for its storage root. The beetroot is indigenous to Asia Minor and Europe Majority of beetroot is grown for processing. The roots are eaten grilled, boiled or roasted as a cooked vegetable or cold as a salad after cooking and adding oil and vinegar. In addition beetroot can be used in salads and it is also preserved by pickling and canning. The green, leafy portion of the beet is also edible. It is most commonly served boiled or steamed and it has a taste and texture similar to spinach. Beetroot juice is today advocated as a stimulant for the immune system and as a cancer preventative. Beetroot has long been considered beneficial to the blood, the heart and the digestive system. Beetroot is a rich source of carbohydrates, a good source of protein, and has high levels of important vitamins minerals and micro nutrients. Figure 1 below illustrates the contribution of beetroot industry to the gross value of agricultural production over a 10 year period.
Source: Statistics and Economic Analysis, DAFF
The beetroot industry gross value increased by 19.7% during 2006, in comparison to 2005 gross value. The increase of gross value can be attributed to the favourable prices received by the producers in the same period. In 2007 and 2008, gross value increased steadily, the increase in 2009 was 28.9% when compared to the previous year gross value. In 2011, the gross value was 10% higher compared to 2010 gross value of production. This can be attributed to higher production output and producer prices that occurred in the same year. In 2012, the gross value dropped by 5.5%, when compared to 2011 gross value. This can be attributed to 16.5% drop in producer price in the same year. During 2013, beetroot gross value increased substantially by 60.3%, when compared to 2012 gross value and this can be attributed to increment in producer price in the same period. There was a slight increase of 0.5% in gross value during 2014, when comparing with the 2013 figure and this can be attributed to an increase in the producer price.
0
50000000
100000000
150000000
200000000
250000000
2005 2006 2007 2008 2009 2010 2011 2012 2013 2014
Val
ue
(Ran
d)
Years
Figure 1: Gross value of beetroot production
4
1.1 Production Areas
Beetroot is a cool weather crop that is hardy and tolerates some freezing. It grows best in spring and autumn, but does well in summer in the Highveld and in winter in the Lowveld. The best quality beetroot is obtained if the crop is grown to maturity in the shortest possible time. The main producing regions are North West, Gauteng, Mpumalanga, Kwazulu Natal and Western Cape. Globally, France, Russia, Germany, United States, and Turkey are top five countries producing beetroot (FAOSTAT 2014).
1.2 Production Trends
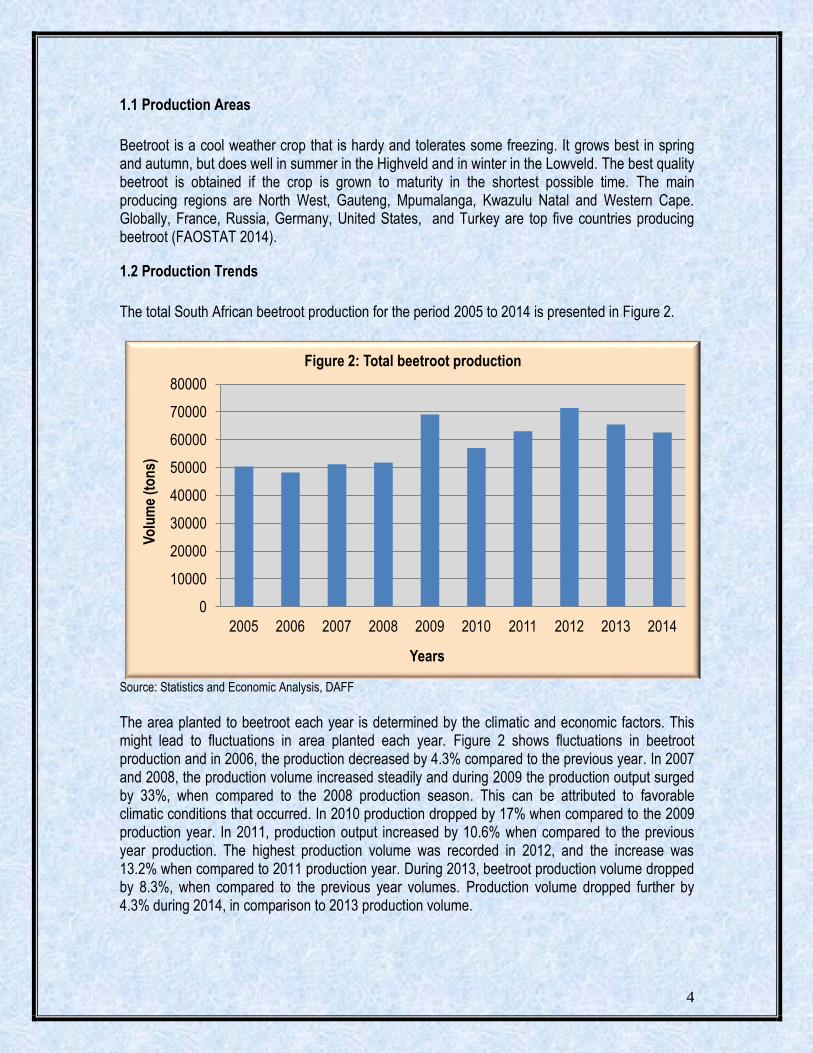
The total South African beetroot production for the period 2005 to 2014 is presented in Figure 2.
Source: Statistics and Economic Analysis, DAFF
The area planted to beetroot each year is determined by the climatic and economic factors. This might lead to fluctuations in area planted each year. Figure 2 shows fluctuations in beetroot production and in 2006, the production decreased by 4.3% compared to the previous year. In 2007 and 2008, the production volume increased steadily and during 2009 the production output surged by 33%, when compared to the 2008 production season. This can be attributed to favorable climatic conditions that occurred. In 2010 production dropped by 17% when compared to the 2009 production year. In 2011, production output increased by 10.6% when compared to the previous year production. The highest production volume was recorded in 2012, and the increase was 13.2% when compared to 2011 production year. During 2013, beetroot production volume dropped by 8.3%, when compared to the previous year volumes. Production volume dropped further by 4.3% during 2014, in comparison to 2013 production volume.
0
10000
20000
30000
40000
50000
60000
70000
80000
2005 2006 2007 2008 2009 2010 2011 2012 2013 2014
Vo
lum
e (t
on
s)
Years
Figure 2: Total beetroot production

5
1.3 Production vs. Consumption of beetroot
Figure 3 below depicts local consumption of beetroot compared to the production over the 10 year period. The figure indicates that the production of beetroot is higher compared to local consumption. The average beetroot consumption is approximately 47 849 tons per annum. This indicates that South Africa is self sufficient in terms of beetroot production and the surplus beetroot is exported. Australian are the highest consumers of beetroot in the world, mainly contributed by the Australian tradition of using sliced processed beetroot on hamburgers.
Source: Statistics and Economic Analysis, DAFF
2. MARKET STRUCTURE
There is no regulation or restriction in the marketing of beetroot. The prices of beetroot are determined by the market forces of demand and supply. The industry uses fresh produce market, informal market, processor and direct selling to wholesalers and retailers. Beetroots are also exported to other countries through export agents and marketing companies. South Africa also imports beetroot from other countries.
2.1 Domestic market and price
The distribution of the annual beetroot crop is given in Table 1 below.
0
10000
20000
30000
40000
50000
60000
70000
80000
2004 2005 2006 2007 2008 2009 2010 2011 2012 2013 2014
Vo
lum
e (t
on
s)
Years
Figure 3: Beetroot production vs consumption
Production (tons) Consumption (tons)
6
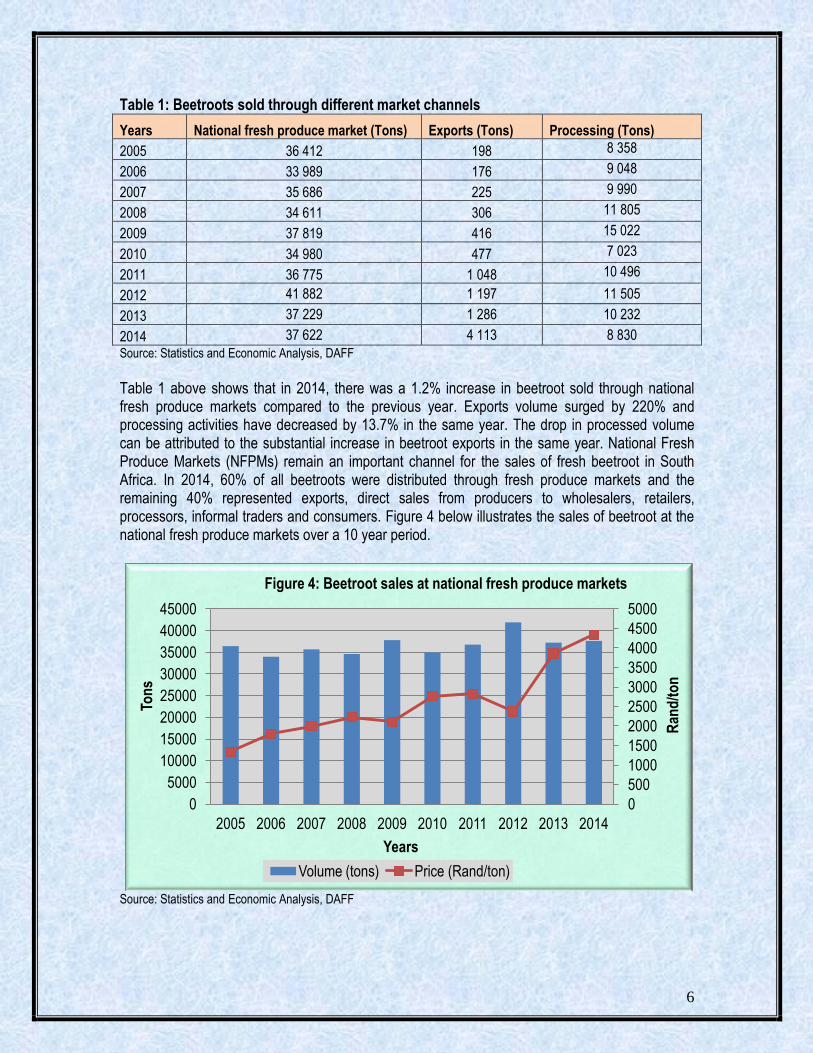
Table 1: Beetroots sold through different market channels
Years National fresh produce market (Tons) Exports (Tons) Processing (Tons)
2005 36 412 198 8 358
2006 33 989 176 9 048
2007 35 686 225 9 990
2008 34 611 306 11 805
2009 37 819 416 15 022
2010 34 980 477 7 023
2011 36 775 1 048 10 496
2012 41 882 1 197 11 505
2013 37 229 1 286 10 232
2014 37 622 4 113 8 830
Source: Statistics and Economic Analysis, DAFF
Table 1 above shows that in 2014, there was a 1.2% increase in beetroot sold through national fresh produce markets compared to the previous year. Exports volume surged by 220% and processing activities have decreased by 13.7% in the same year. The drop in processed volume can be attributed to the substantial increase in beetroot exports in the same year. National Fresh Produce Markets (NFPMs) remain an important channel for the sales of fresh beetroot in South Africa. In 2014, 60% of all beetroots were distributed through fresh produce markets and the remaining 40% represented exports, direct sales from producers to wholesalers, retailers, processors, informal traders and consumers. Figure 4 below illustrates the sales of beetroot at the national fresh produce markets over a 10 year period.
Source: Statistics and Economic Analysis, DAFF
0
500
1000
1500
2000
2500
3000
3500
4000
4500
5000
0
5000
10000
15000
20000
25000
30000
35000
40000
45000
2005 2006 2007 2008 2009 2010 2011 2012 2013 2014
Ran
d/t
on
Ton
s
Years
Figure 4: Beetroot sales at national fresh produce markets
Volume (tons) Price (Rand/ton)
7
Low price was recorded in 2005, due to high in volume supplied across the markets. The price increased steadily from 2006 to 2008 and in 2009, the prices decreased by 5.4% due to high volume supplied to the markets. In 2010, beetroot prices increased by 31% due to 7.5% decrease in beetroot volumes supplied to the market. Market prices eased higher by 2% in 2011, despite a 5% increase in beetroot volumes and this can be attributed to strong demand of beetroot. In 2012, market prices dropped by 16%, when compared to 2011 market prices and this can be attributed to 14% increase in beetroot supplied in the market. During 2013, market prices surged by 63% due to an 11.1% drop in volume supplied in the market. In 2014, the market price increased by 12.3%, despite a 1.1% increase in beetroot supplied at the market and this can be attributed to the strong beetroot demand in the same year.
2.2 South Africa Beetroot Exports
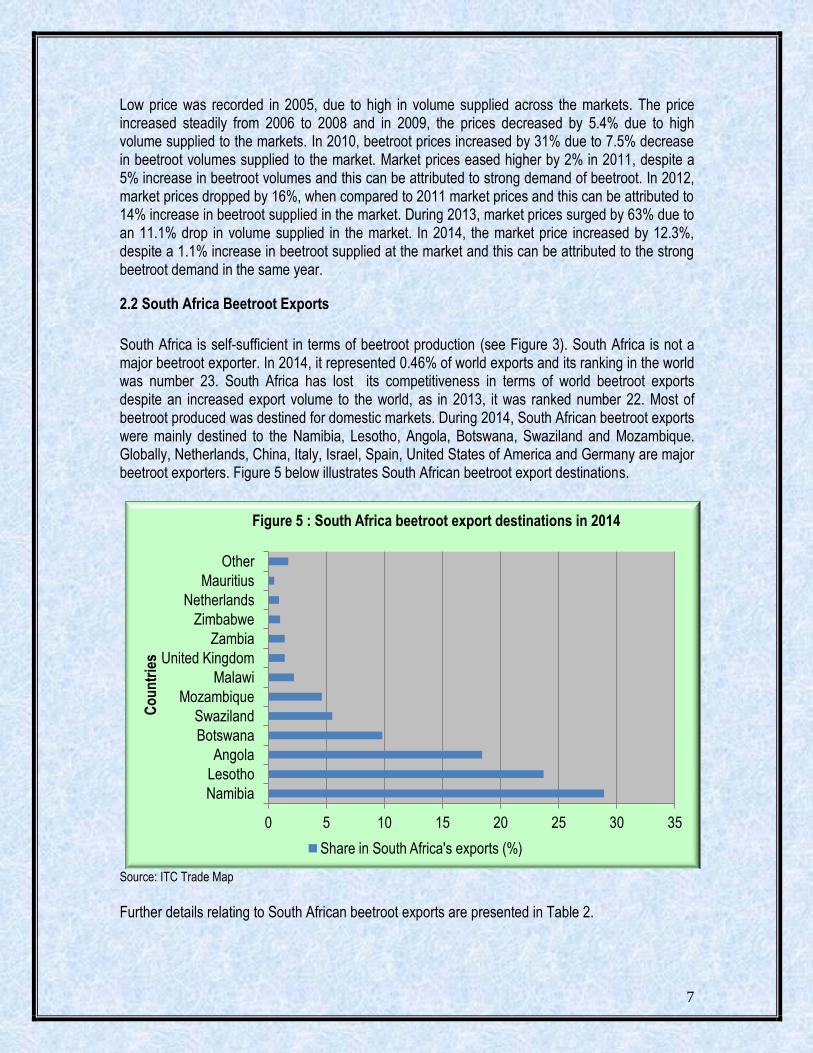
South Africa is self-sufficient in terms of beetroot production (see Figure 3). South Africa is not a major beetroot exporter. In 2014, it represented 0.46% of world exports and its ranking in the world was number 23. South Africa has lost its competitiveness in terms of world beetroot exports despite an increased export volume to the world, as in 2013, it was ranked number 22. Most of beetroot produced was destined for domestic markets. During 2014, South African beetroot exports were mainly destined to the Namibia, Lesotho, Angola, Botswana, Swaziland and Mozambique. Globally, Netherlands, China, Italy, Israel, Spain, United States of America and Germany are major beetroot exporters. Figure 5 below illustrates South African beetroot export destinations.
Source: ITC Trade Map
Further details relating to South African beetroot exports are presented in Table 2.
0 5 10 15 20 25 30 35
Namibia
Lesotho
Angola
Botswana
Swaziland
Mozambique
Malawi
United Kingdom
Zambia
Zimbabwe
Netherlands
Mauritius
Other
Co
un
trie
s
Figure 5 : South Africa beetroot export destinations in 2014
Share in South Africa's exports (%)
8
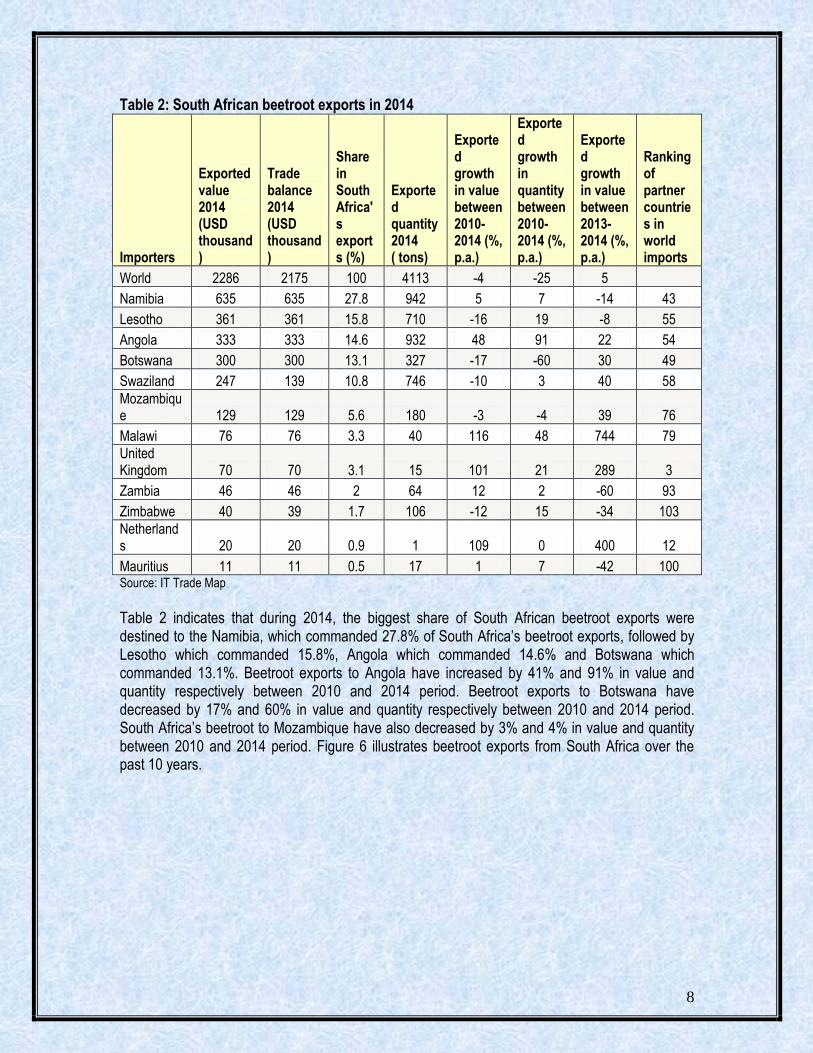
Table 2: South African beetroot exports in 2014
Importers
Exported value 2014 (USD thousand)
Trade balance 2014 (USD thousand)
Share in South Africa's exports (%)
Exported quantity 2014 ( tons)
Exported growth in value between 2010-2014 (%, p.a.)
Exported growth in quantity between 2010-2014 (%, p.a.)
Exported growth in value between 2013-2014 (%, p.a.)
Ranking of partner countries in world imports
World 2286 2175 100 4113 -4 -25 5 Namibia 635 635 27.8 942 5 7 -14 43
Lesotho 361 361 15.8 710 -16 19 -8 55
Angola 333 333 14.6 932 48 91 22 54
Botswana 300 300 13.1 327 -17 -60 30 49
Swaziland 247 139 10.8 746 -10 3 40 58
Mozambique 129 129 5.6 180 -3 -4 39 76
Malawi 76 76 3.3 40 116 48 744 79
United Kingdom 70 70 3.1 15 101 21 289 3
Zambia 46 46 2 64 12 2 -60 93
Zimbabwe 40 39 1.7 106 -12 15 -34 103
Netherlands 20 20 0.9 1 109 0 400 12
Mauritius 11 11 0.5 17 1 7 -42 100 Source: IT Trade Map
Table 2 indicates that during 2014, the biggest share of South African beetroot exports were destined to the Namibia, which commanded 27.8% of South Africa’s beetroot exports, followed by Lesotho which commanded 15.8%, Angola which commanded 14.6% and Botswana which commanded 13.1%. Beetroot exports to Angola have increased by 41% and 91% in value and quantity respectively between 2010 and 2014 period. Beetroot exports to Botswana have decreased by 17% and 60% in value and quantity respectively between 2010 and 2014 period. South Africa’s beetroot to Mozambique have also decreased by 3% and 4% in value and quantity between 2010 and 2014 period. Figure 6 illustrates beetroot exports from South Africa over the past 10 years.
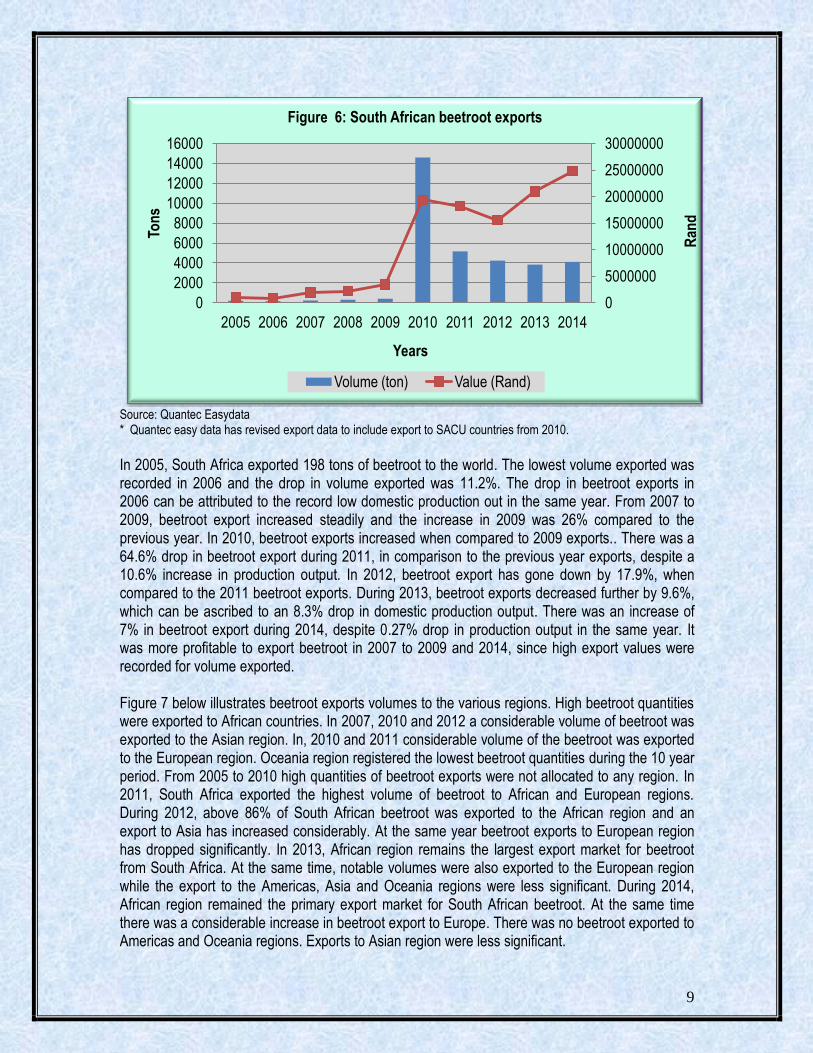
9
Source: Quantec Easydata * Quantec easy data has revised export data to include export to SACU countries from 2010.
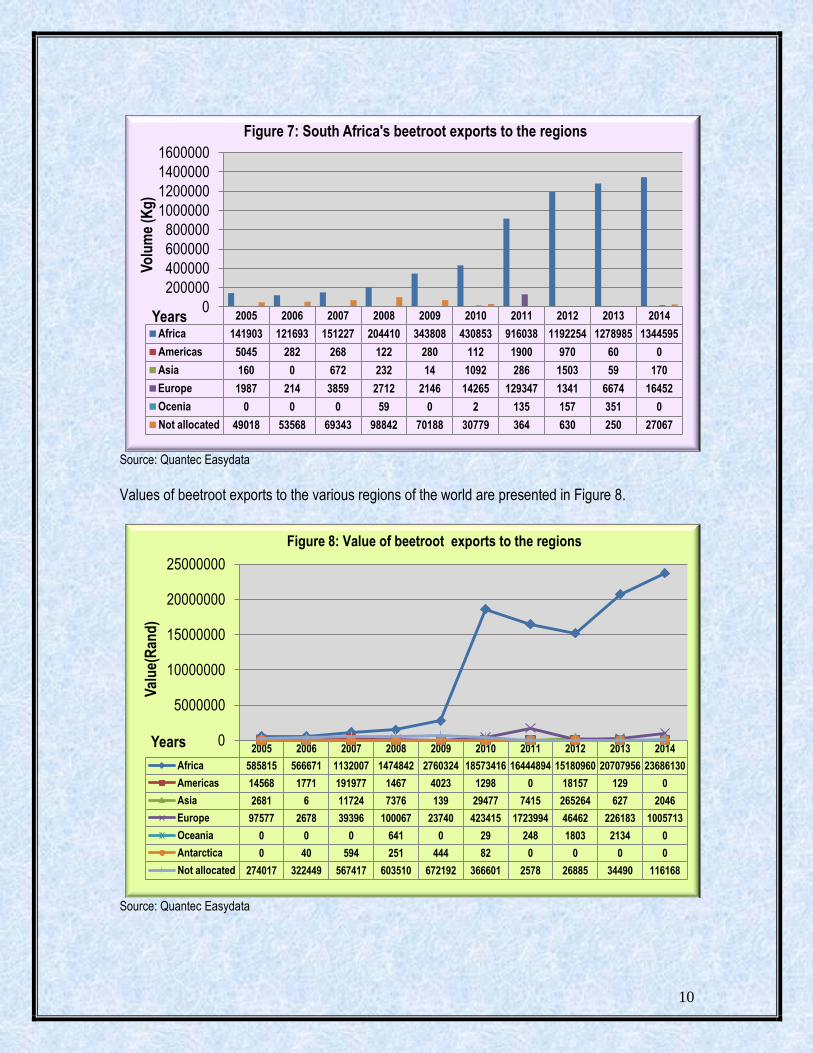
In 2005, South Africa exported 198 tons of beetroot to the world. The lowest volume exported was recorded in 2006 and the drop in volume exported was 11.2%. The drop in beetroot exports in 2006 can be attributed to the record low domestic production out in the same year. From 2007 to 2009, beetroot export increased steadily and the increase in 2009 was 26% compared to the previous year. In 2010, beetroot exports increased when compared to 2009 exports.. There was a 64.6% drop in beetroot export during 2011, in comparison to the previous year exports, despite a 10.6% increase in production output. In 2012, beetroot export has gone down by 17.9%, when compared to the 2011 beetroot exports. During 2013, beetroot exports decreased further by 9.6%, which can be ascribed to an 8.3% drop in domestic production output. There was an increase of 7% in beetroot export during 2014, despite 0.27% drop in production output in the same year. It was more profitable to export beetroot in 2007 to 2009 and 2014, since high export values were recorded for volume exported. Figure 7 below illustrates beetroot exports volumes to the various regions. High beetroot quantities were exported to African countries. In 2007, 2010 and 2012 a considerable volume of beetroot was exported to the Asian region. In, 2010 and 2011 considerable volume of the beetroot was exported to the European region. Oceania region registered the lowest beetroot quantities during the 10 year period. From 2005 to 2010 high quantities of beetroot exports were not allocated to any region. In 2011, South Africa exported the highest volume of beetroot to African and European regions. During 2012, above 86% of South African beetroot was exported to the African region and an export to Asia has increased considerably. At the same year beetroot exports to European region has dropped significantly. In 2013, African region remains the largest export market for beetroot from South Africa. At the same time, notable volumes were also exported to the European region while the export to the Americas, Asia and Oceania regions were less significant. During 2014, African region remained the primary export market for South African beetroot. At the same time there was a considerable increase in beetroot export to Europe. There was no beetroot exported to Americas and Oceania regions. Exports to Asian region were less significant.
0
5000000
10000000
15000000
20000000
25000000
30000000
0
2000
4000
6000
8000
10000
12000
14000
16000
2005 2006 2007 2008 2009 2010 2011 2012 2013 2014
Ran
d
Ton
s
Years
Figure 6: South African beetroot exports
Volume (ton) Value (Rand)
10
Source: Quantec Easydata
Values of beetroot exports to the various regions of the world are presented in Figure 8.
Source: Quantec Easydata
2005 2006 2007 2008 2009 2010 2011 2012 2013 2014
Africa 141903 121693 151227 204410 343808 430853 916038 1192254 1278985 1344595
Americas 5045 282 268 122 280 112 1900 970 60 0
Asia 160 0 672 232 14 1092 286 1503 59 170
Europe 1987 214 3859 2712 2146 14265 129347 1341 6674 16452
Ocenia 0 0 0 59 0 2 135 157 351 0
Not allocated 49018 53568 69343 98842 70188 30779 364 630 250 27067
0
200000
400000
600000
800000
1000000
1200000
1400000
1600000 V
olu
me
(Kg
)
Years
Figure 7: South Africa's beetroot exports to the regions
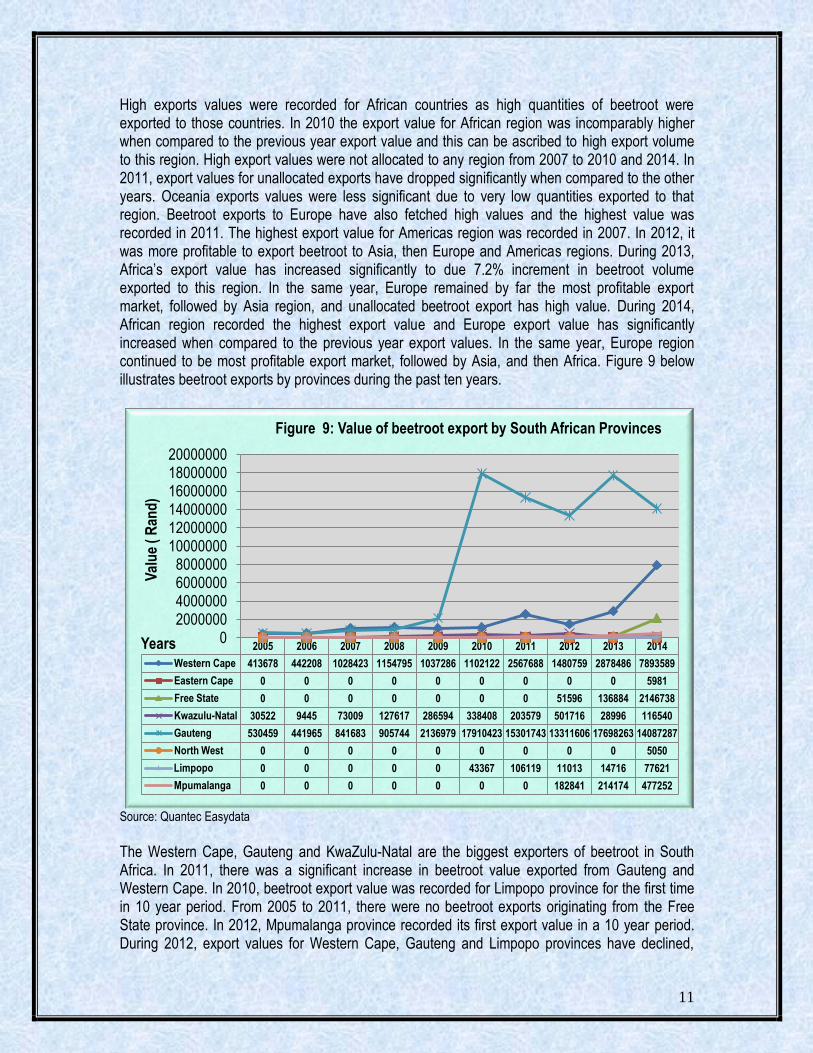
2005 2006 2007 2008 2009 2010 2011 2012 2013 2014
Africa 585815 566671 1132007 1474842 2760324 18573416 16444894 15180960 20707956 23686130
Americas 14568 1771 191977 1467 4023 1298 0 18157 129 0
Asia 2681 6 11724 7376 139 29477 7415 265264 627 2046
Europe 97577 2678 39396 100067 23740 423415 1723994 46462 226183 1005713
Oceania 0 0 0 641 0 29 248 1803 2134 0
Antarctica 0 40 594 251 444 82 0 0 0 0
Not allocated 274017 322449 567417 603510 672192 366601 2578 26885 34490 116168
0
5000000
10000000
15000000
20000000
25000000
Val
ue(
Ran
d)
Years
Figure 8: Value of beetroot exports to the regions
11
High exports values were recorded for African countries as high quantities of beetroot were exported to those countries. In 2010 the export value for African region was incomparably higher when compared to the previous year export value and this can be ascribed to high export volume to this region. High export values were not allocated to any region from 2007 to 2010 and 2014. In 2011, export values for unallocated exports have dropped significantly when compared to the other years. Oceania exports values were less significant due to very low quantities exported to that region. Beetroot exports to Europe have also fetched high values and the highest value was recorded in 2011. The highest export value for Americas region was recorded in 2007. In 2012, it was more profitable to export beetroot to Asia, then Europe and Americas regions. During 2013, Africa’s export value has increased significantly to due 7.2% increment in beetroot volume exported to this region. In the same year, Europe remained by far the most profitable export market, followed by Asia region, and unallocated beetroot export has high value. During 2014, African region recorded the highest export value and Europe export value has significantly increased when compared to the previous year export values. In the same year, Europe region continued to be most profitable export market, followed by Asia, and then Africa. Figure 9 below illustrates beetroot exports by provinces during the past ten years.
Source: Quantec Easydata
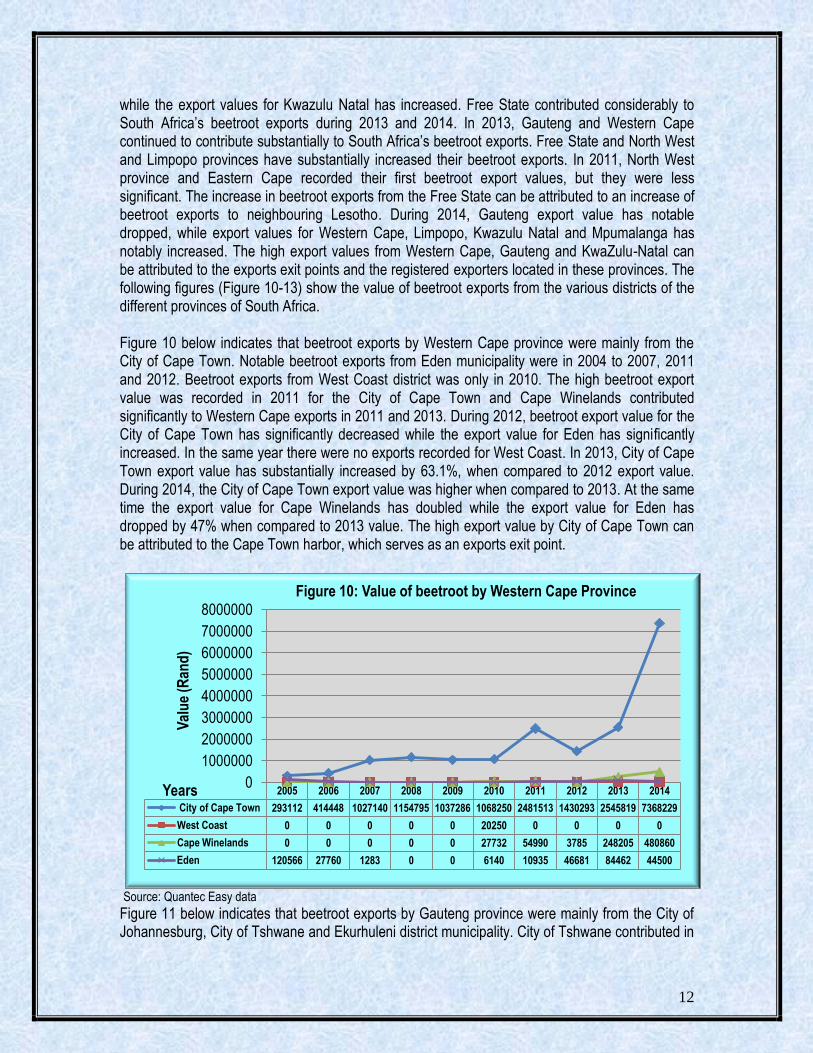
The Western Cape, Gauteng and KwaZulu-Natal are the biggest exporters of beetroot in South Africa. In 2011, there was a significant increase in beetroot value exported from Gauteng and Western Cape. In 2010, beetroot export value was recorded for Limpopo province for the first time in 10 year period. From 2005 to 2011, there were no beetroot exports originating from the Free State province. In 2012, Mpumalanga province recorded its first export value in a 10 year period. During 2012, export values for Western Cape, Gauteng and Limpopo provinces have declined,
2005 2006 2007 2008 2009 2010 2011 2012 2013 2014
Western Cape 413678 442208 1028423 1154795 1037286 1102122 2567688 1480759 2878486 7893589
Eastern Cape 0 0 0 0 0 0 0 0 0 5981
Free State 0 0 0 0 0 0 0 51596 136884 2146738
Kwazulu-Natal 30522 9445 73009 127617 286594 338408 203579 501716 28996 116540
Gauteng 530459 441965 841683 905744 2136979 17910423 15301743 13311606 17698263 14087287
North West 0 0 0 0 0 0 0 0 0 5050
Limpopo 0 0 0 0 0 43367 106119 11013 14716 77621
Mpumalanga 0 0 0 0 0 0 0 182841 214174 477252
0 2000000 4000000 6000000 8000000
10000000 12000000 14000000 16000000 18000000 20000000
Val
ue
( R
and
)
Years
Figure 9: Value of beetroot export by South African Provinces
12
while the export values for Kwazulu Natal has increased. Free State contributed considerably to South Africa’s beetroot exports during 2013 and 2014. In 2013, Gauteng and Western Cape continued to contribute substantially to South Africa’s beetroot exports. Free State and North West and Limpopo provinces have substantially increased their beetroot exports. In 2011, North West province and Eastern Cape recorded their first beetroot export values, but they were less significant. The increase in beetroot exports from the Free State can be attributed to an increase of beetroot exports to neighbouring Lesotho. During 2014, Gauteng export value has notable dropped, while export values for Western Cape, Limpopo, Kwazulu Natal and Mpumalanga has notably increased. The high export values from Western Cape, Gauteng and KwaZulu-Natal can be attributed to the exports exit points and the registered exporters located in these provinces. The following figures (Figure 10-13) show the value of beetroot exports from the various districts of the different provinces of South Africa. Figure 10 below indicates that beetroot exports by Western Cape province were mainly from the City of Cape Town. Notable beetroot exports from Eden municipality were in 2004 to 2007, 2011 and 2012. Beetroot exports from West Coast district was only in 2010. The high beetroot export value was recorded in 2011 for the City of Cape Town and Cape Winelands contributed significantly to Western Cape exports in 2011 and 2013. During 2012, beetroot export value for the City of Cape Town has significantly decreased while the export value for Eden has significantly increased. In the same year there were no exports recorded for West Coast. In 2013, City of Cape Town export value has substantially increased by 63.1%, when compared to 2012 export value. During 2014, the City of Cape Town export value was higher when compared to 2013. At the same time the export value for Cape Winelands has doubled while the export value for Eden has dropped by 47% when compared to 2013 value. The high export value by City of Cape Town can be attributed to the Cape Town harbor, which serves as an exports exit point.
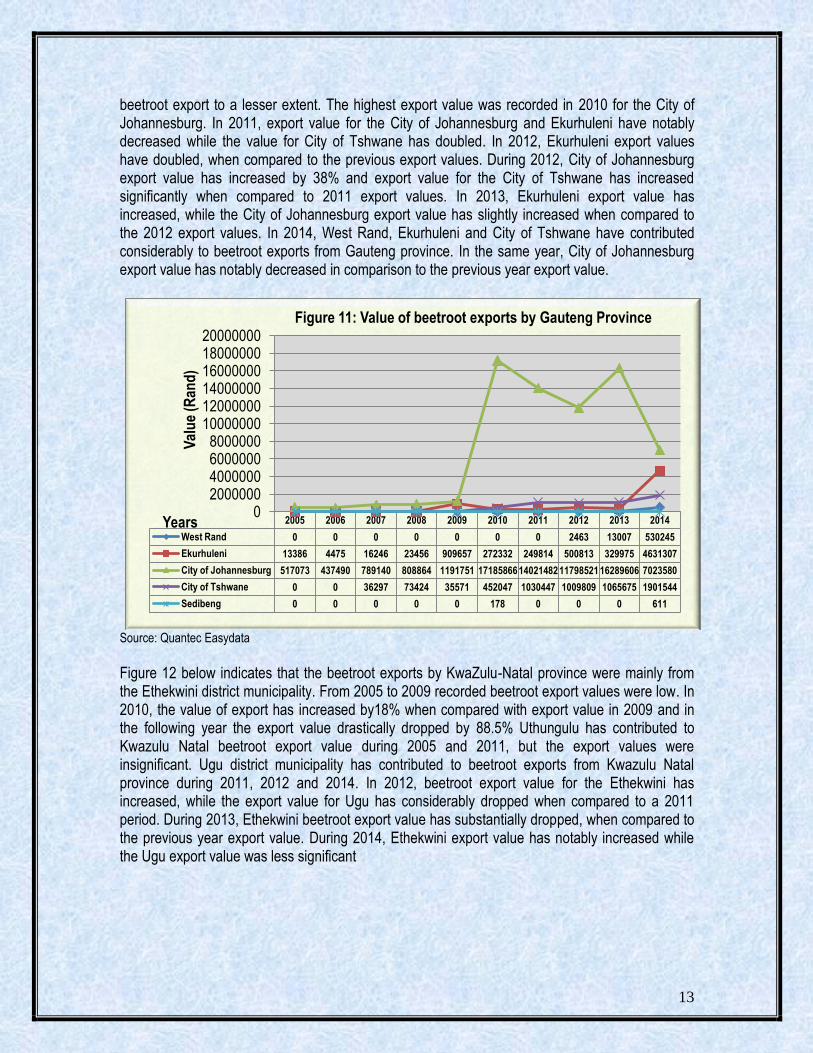
Source: Quantec Easy data Figure 11 below indicates that beetroot exports by Gauteng province were mainly from the City of Johannesburg, City of Tshwane and Ekurhuleni district municipality. City of Tshwane contributed in
2005 2006 2007 2008 2009 2010 2011 2012 2013 2014
City of Cape Town 293112 414448 1027140 1154795 1037286 1068250 2481513 1430293 2545819 7368229
West Coast 0 0 0 0 0 20250 0 0 0 0
Cape Winelands 0 0 0 0 0 27732 54990 3785 248205 480860
Eden 120566 27760 1283 0 0 6140 10935 46681 84462 44500
0
1000000
2000000
3000000
4000000
5000000
6000000
7000000
8000000
Val
ue
(Ran
d)
Years
Figure 10: Value of beetroot by Western Cape Province
13
beetroot export to a lesser extent. The highest export value was recorded in 2010 for the City of Johannesburg. In 2011, export value for the City of Johannesburg and Ekurhuleni have notably decreased while the value for City of Tshwane has doubled. In 2012, Ekurhuleni export values have doubled, when compared to the previous export values. During 2012, City of Johannesburg export value has increased by 38% and export value for the City of Tshwane has increased significantly when compared to 2011 export values. In 2013, Ekurhuleni export value has increased, while the City of Johannesburg export value has slightly increased when compared to the 2012 export values. In 2014, West Rand, Ekurhuleni and City of Tshwane have contributed considerably to beetroot exports from Gauteng province. In the same year, City of Johannesburg export value has notably decreased in comparison to the previous year export value.
Source: Quantec Easydata
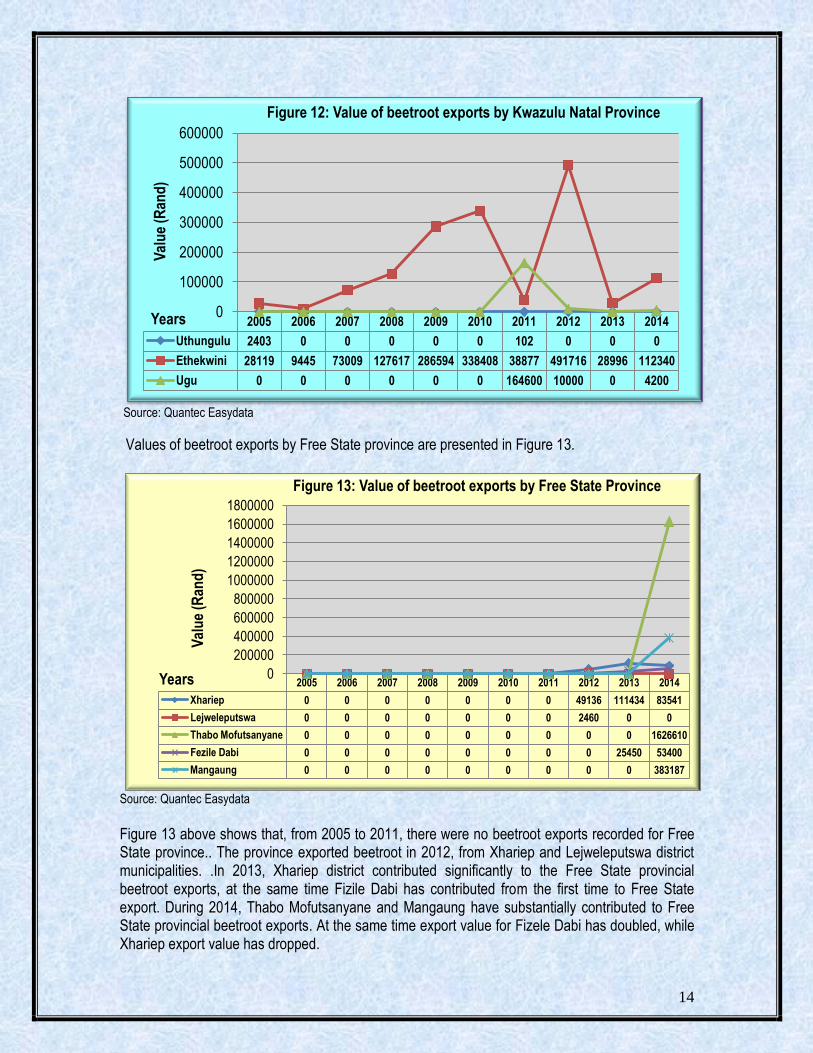
Figure 12 below indicates that the beetroot exports by KwaZulu-Natal province were mainly from the Ethekwini district municipality. From 2005 to 2009 recorded beetroot export values were low. In 2010, the value of export has increased by18% when compared with export value in 2009 and in the following year the export value drastically dropped by 88.5% Uthungulu has contributed to Kwazulu Natal beetroot export value during 2005 and 2011, but the export values were insignificant. Ugu district municipality has contributed to beetroot exports from Kwazulu Natal province during 2011, 2012 and 2014. In 2012, beetroot export value for the Ethekwini has increased, while the export value for Ugu has considerably dropped when compared to a 2011 period. During 2013, Ethekwini beetroot export value has substantially dropped, when compared to the previous year export value. During 2014, Ethekwini export value has notably increased while the Ugu export value was less significant
2005 2006 2007 2008 2009 2010 2011 2012 2013 2014
West Rand 0 0 0 0 0 0 0 2463 13007 530245
Ekurhuleni 13386 4475 16246 23456 909657 272332 249814 500813 329975 4631307
City of Johannesburg 517073 437490 789140 808864 1191751 17185866 14021482 11798521 16289606 7023580
City of Tshwane 0 0 36297 73424 35571 452047 1030447 1009809 1065675 1901544
Sedibeng 0 0 0 0 0 178 0 0 0 611
0 2000000 4000000 6000000 8000000
10000000 12000000 14000000 16000000 18000000 20000000
Val
ue
(Ran
d)
Years
Figure 11: Value of beetroot exports by Gauteng Province
14
Source: Quantec Easydata
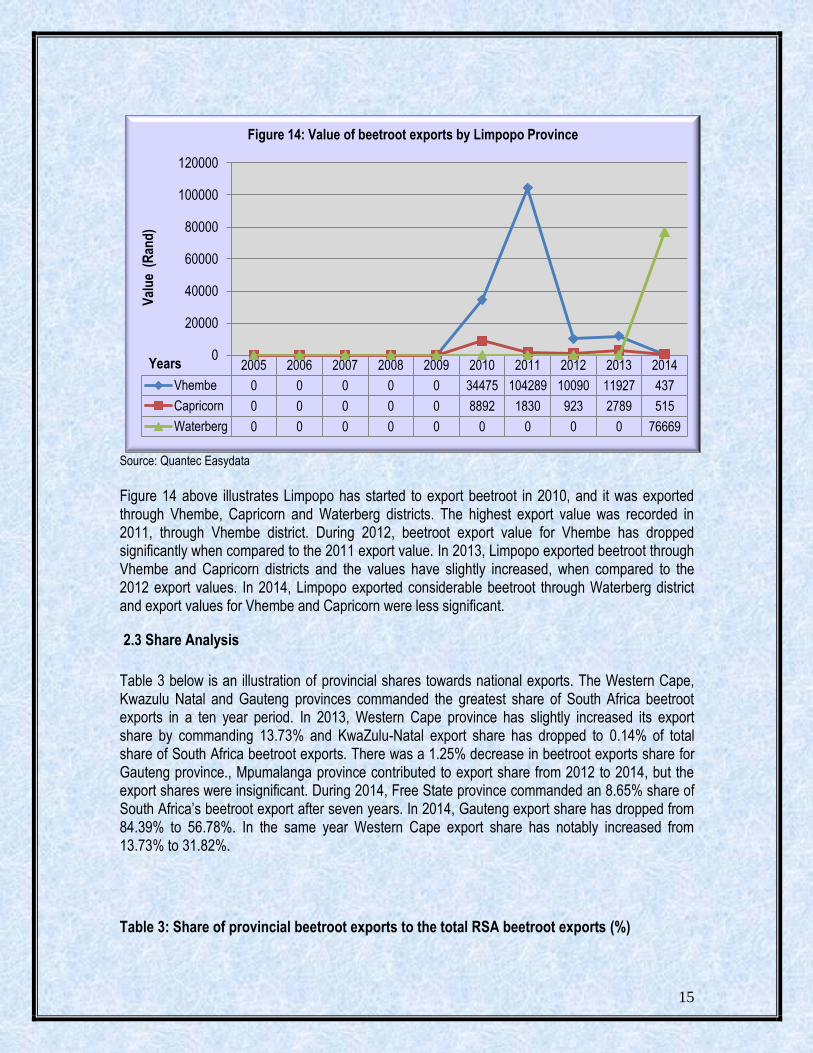
Values of beetroot exports by Free State province are presented in Figure 13.
Source: Quantec Easydata
Figure 13 above shows that, from 2005 to 2011, there were no beetroot exports recorded for Free State province.. The province exported beetroot in 2012, from Xhariep and Lejweleputswa district municipalities. .In 2013, Xhariep district contributed significantly to the Free State provincial beetroot exports, at the same time Fizile Dabi has contributed from the first time to Free State export. During 2014, Thabo Mofutsanyane and Mangaung have substantially contributed to Free State provincial beetroot exports. At the same time export value for Fizele Dabi has doubled, while Xhariep export value has dropped.
2005 2006 2007 2008 2009 2010 2011 2012 2013 2014
Uthungulu 2403 0 0 0 0 0 102 0 0 0
Ethekwini 28119 9445 73009 127617 286594 338408 38877 491716 28996 112340
Ugu 0 0 0 0 0 0 164600 10000 0 4200
0
100000
200000
300000
400000
500000
600000
Val
ue
(Ran
d)
Years
Figure 12: Value of beetroot exports by Kwazulu Natal Province
2005 2006 2007 2008 2009 2010 2011 2012 2013 2014
Xhariep 0 0 0 0 0 0 0 49136 111434 83541
Lejweleputswa 0 0 0 0 0 0 0 2460 0 0
Thabo Mofutsanyane 0 0 0 0 0 0 0 0 0 1626610
Fezile Dabi 0 0 0 0 0 0 0 0 25450 53400
Mangaung 0 0 0 0 0 0 0 0 0 383187
0
200000
400000
600000
800000
1000000
1200000
1400000
1600000
1800000
Val
ue
(Ran
d)
Years
Figure 13: Value of beetroot exports by Free State Province
15
Source: Quantec Easydata
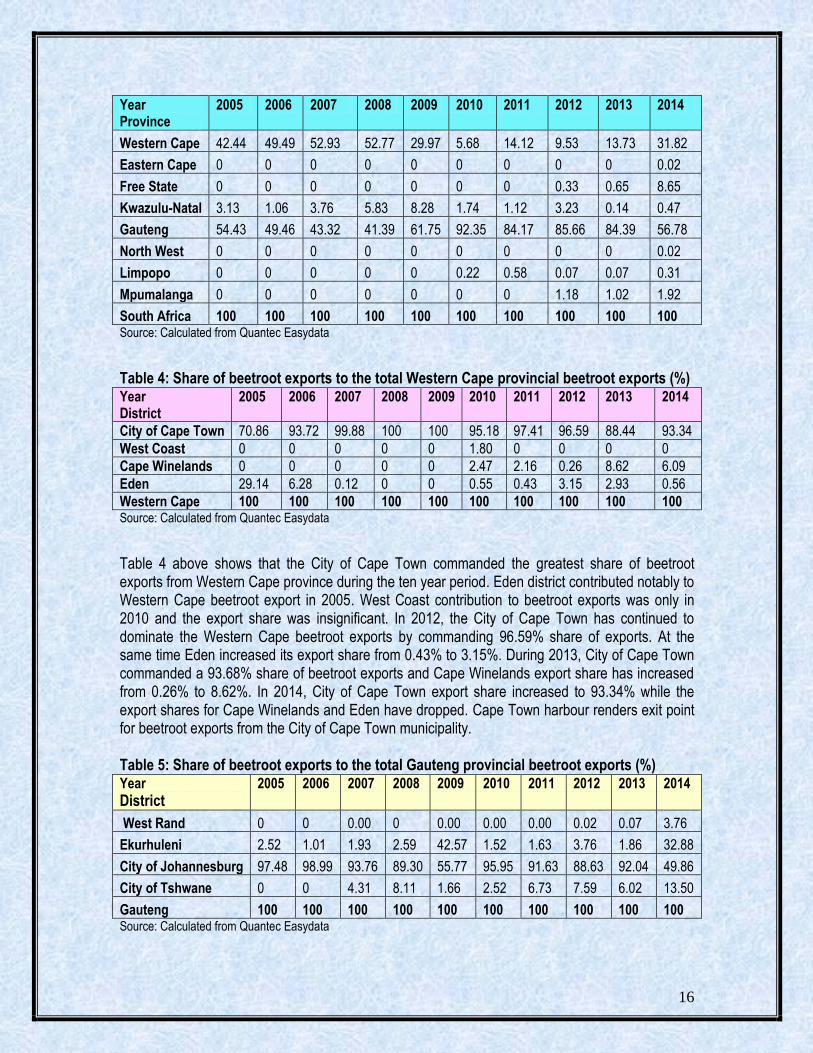
Figure 14 above illustrates Limpopo has started to export beetroot in 2010, and it was exported through Vhembe, Capricorn and Waterberg districts. The highest export value was recorded in 2011, through Vhembe district. During 2012, beetroot export value for Vhembe has dropped significantly when compared to the 2011 export value. In 2013, Limpopo exported beetroot through Vhembe and Capricorn districts and the values have slightly increased, when compared to the 2012 export values. In 2014, Limpopo exported considerable beetroot through Waterberg district and export values for Vhembe and Capricorn were less significant.
2.3 Share Analysis
Table 3 below is an illustration of provincial shares towards national exports. The Western Cape, Kwazulu Natal and Gauteng provinces commanded the greatest share of South Africa beetroot exports in a ten year period. In 2013, Western Cape province has slightly increased its export share by commanding 13.73% and KwaZulu-Natal export share has dropped to 0.14% of total share of South Africa beetroot exports. There was a 1.25% decrease in beetroot exports share for Gauteng province., Mpumalanga province contributed to export share from 2012 to 2014, but the export shares were insignificant. During 2014, Free State province commanded an 8.65% share of South Africa’s beetroot export after seven years. In 2014, Gauteng export share has dropped from 84.39% to 56.78%. In the same year Western Cape export share has notably increased from 13.73% to 31.82%.
Table 3: Share of provincial beetroot exports to the total RSA beetroot exports (%)
2005 2006 2007 2008 2009 2010 2011 2012 2013 2014
Vhembe 0 0 0 0 0 34475 104289 10090 11927 437
Capricorn 0 0 0 0 0 8892 1830 923 2789 515
Waterberg 0 0 0 0 0 0 0 0 0 76669
0
20000
40000
60000
80000
100000
120000 V
alu
e (
Ran
d)
Years
Figure 14: Value of beetroot exports by Limpopo Province
16
Year Province
2005 2006 2007 2008 2009 2010 2011 2012 2013 2014
Western Cape 42.44 49.49 52.93 52.77 29.97 5.68 14.12 9.53 13.73 31.82
Eastern Cape 0 0 0 0 0 0 0 0 0 0.02
Free State 0 0 0 0 0 0 0 0.33 0.65 8.65
Kwazulu-Natal 3.13 1.06 3.76 5.83 8.28 1.74 1.12 3.23 0.14 0.47
Gauteng 54.43 49.46 43.32 41.39 61.75 92.35 84.17 85.66 84.39 56.78
North West 0 0 0 0 0 0 0 0 0 0.02
Limpopo 0 0 0 0 0 0.22 0.58 0.07 0.07 0.31
Mpumalanga 0 0 0 0 0 0 0 1.18 1.02 1.92
South Africa 100 100 100 100 100 100 100 100 100 100 Source: Calculated from Quantec Easydata
Table 4: Share of beetroot exports to the total Western Cape provincial beetroot exports (%) Year District
2005 2006 2007 2008 2009 2010 2011 2012 2013 2014
City of Cape Town 70.86 93.72 99.88 100 100 95.18 97.41 96.59 88.44 93.34
West Coast 0 0 0 0 0 1.80 0 0 0 0
Cape Winelands 0 0 0 0 0 2.47 2.16 0.26 8.62 6.09
Eden 29.14 6.28 0.12 0 0 0.55 0.43 3.15 2.93 0.56
Western Cape 100 100 100 100 100 100 100 100 100 100 Source: Calculated from Quantec Easydata
Table 4 above shows that the City of Cape Town commanded the greatest share of beetroot exports from Western Cape province during the ten year period. Eden district contributed notably to Western Cape beetroot export in 2005. West Coast contribution to beetroot exports was only in 2010 and the export share was insignificant. In 2012, the City of Cape Town has continued to dominate the Western Cape beetroot exports by commanding 96.59% share of exports. At the same time Eden increased its export share from 0.43% to 3.15%. During 2013, City of Cape Town commanded a 93.68% share of beetroot exports and Cape Winelands export share has increased from 0.26% to 8.62%. In 2014, City of Cape Town export share increased to 93.34% while the export shares for Cape Winelands and Eden have dropped. Cape Town harbour renders exit point for beetroot exports from the City of Cape Town municipality. Table 5: Share of beetroot exports to the total Gauteng provincial beetroot exports (%) Year District
2005 2006 2007 2008 2009 2010 2011 2012 2013 2014
West Rand 0 0 0.00 0 0.00 0.00 0.00 0.02 0.07 3.76
Ekurhuleni 2.52 1.01 1.93 2.59 42.57 1.52 1.63 3.76 1.86 32.88
City of Johannesburg 97.48 98.99 93.76 89.30 55.77 95.95 91.63 88.63 92.04 49.86
City of Tshwane 0 0 4.31 8.11 1.66 2.52 6.73 7.59 6.02 13.50
Gauteng 100 100 100 100 100 100 100 100 100 100 Source: Calculated from Quantec Easydata

17
Table 5 above indicates that, City of Johannesburg has commanded the greatest share of beetroot exports from Gauteng province. Ekurhuleni has commanded high share of 42.57% in 2009. In 2010, the export share for Ekurhuleni has dropped to 1.52% and City of Johannesburg export share has increased to 95.95% when compared to a 2009 beet-root export share. During 2011, City of Tshwane commanded a 6.73% and City of Johannesburg commanded a 91.63% share of beetroot exports by Gauteng province. In 2012, City of Johannesburg beetroot export share has dropped from 91.63% to 88.63%, while the Ekurhuleni has increased its share from 1.63% to 3.76%. In the same year, the City of Tshwane export share has increased from 6.73% to 7.59% share when compared to 2011. During 2013, City of Johannesburg continued to dominate in beetroot export share by commanding 92.04% share. In 2014, Ekurhuleni has notable increased its beetroot export share by commanding 32.88% share and City of Johannesburg export share has dropped drastically to 49.86%. Table 6: Share of beetroot exports to the total Kwazulu Natal provincial beetroot exports (%) Year District
2005 2006 2007 2008 2009 2010 2011 2012 2013 2014
Uthungulu 7.87 0 0 0 0 0 0.05 0 0 0
Ethekwini 92.13 100 100 100 100 100 19.10 98.01 100 96.40
Ugu 0 0 0 0 0 0 80.85 1.99 0 3.60
Kwazulu Natal 100 100 100 100 100 100 100 100 100 100 Source: Calculated from Quantec Easydata
Table 6 above illustrates that from 2006 to 2010, Ethekwini commanded 100% share of beetroot exports from KwaZulu-Natal province during the period under review. Uthungulu contributed notably to export share only in 2005. During 2011, Ugu has commanded 82.50% share of beetroot exported through Kwazulu Natal province. In the same year, Ethekwini export share has decreased by 82.65% when compared to 2010 export share. During 2012, Ethekwini increased its export share from 17.35% to 97.94% while Ugu dropped from 82.50% to 1.99% share. In 2013, Ethekwini commanded 100% export share. During 2014, export share dropped slightly to 96.40% while Ugu has commanded 3.60% export share. The greatest share by Ethekwini can be attributed to Durban harbour which renders exports exit point. Table 7: Share of beetroot exports to the total Free State provincial beetroot exports (%) Year District
2005 2006 2007 2008 2009 2010 2011 2012 2013 2014
Xhariep 0 0 0 0 0 0 0 95.23 81.41 3.89
Lejweleputswa 0 0 0 0 0 0 0 4.77 0 0
Thabo Mofutsanyane 0 0 0 0 0 0 0 0 0 75.77
Fezile Dabi 0 0 0 0 0 0 0 0 18.59 2.49
Mangaung 0 0 0 0 0 0 0 0 0 17.85
Free State 0 0 0 0 0 0 0 100 100 100 Source: Calculated from Quantec Easy data
18
From 2005 to 2011, the Free State province has recorded zero trade in beetroot. In 2012, Xhariep
commanded 95.23% of beetroot export share and Lejweleputswa has commanded 4.77% share
from Free State province. During 2013, Xhariep beetroot export share has dropped to 81.41%
while Fizile Dabi has commanded 18.59%. In 2014, Thabo Mofutsanyane commanded 75.77% and
Mangaung has commanded 17.85% of Free State provincial beetroot export share. In the same
year Xhariep export share has dropped from 84.41% to 3.89%.
Table 8: Share of beetroot exports to the total Limpopo provincial beetroot exports (%)
Year District
2005 2006 2007 2008 2009 2010 2011 2012 2013 2014
Vhembe 0 0 0 0 0 79.50 98.28 91.62 81.05 0.56
Capricorn 0 0 0 0 0 20.50 1.72 8.38 18.95 0.66
Waterberg 0 0 0 0 0 0 0 0 0 98.77
Limpopo 0 0 0 0 0 100 100 100 100 100 Source: Calculated from Quantec Easy data
Table 8 above illustrates that Vhembe district was a major role player in beetroot export from
Limpopo province. From 2005 to 2009, Limpopo province has recorded zero beetroot trade. In
2010 Vhembe district has commanded 79.50% and Capricorn has commanded 20.50% share of
Limpopo provincial beetroot export share. During 2012, Vhembe export share has slightly dropped
from 98.28% to 91.62%, while the Capricorn export share has gone up from 1.72% to 8.38%
share. Vhembe export share declined further to 81.05% and Capricorn export share has gone up to
18.95% during 2013. In 2014, Waterberg has commanded 98.77% share of Limpopo beetroot
exports and in the same year, Vhembe export share has drastically dropped from 81.05% to
0.56%.
2.4 South African beetroot Imports
South Africa is not a major beetroot importer. In 2014, it represented 0.02% of world imports and its ranking in the world import was 72. South Africa’s beetroot import has gone up when compared to 2013 beetroot imports. During 2013, South Africa was ranked 79 in the world beetroot imports. In 2014, South Africa imported beetroot from Swaziland, China, India and Zimbabwe. Globally, Germany, Russian Federation, United Kingdom, Republic of Korea, Japan United States of America and France, are the top countries importing beetroot.
19
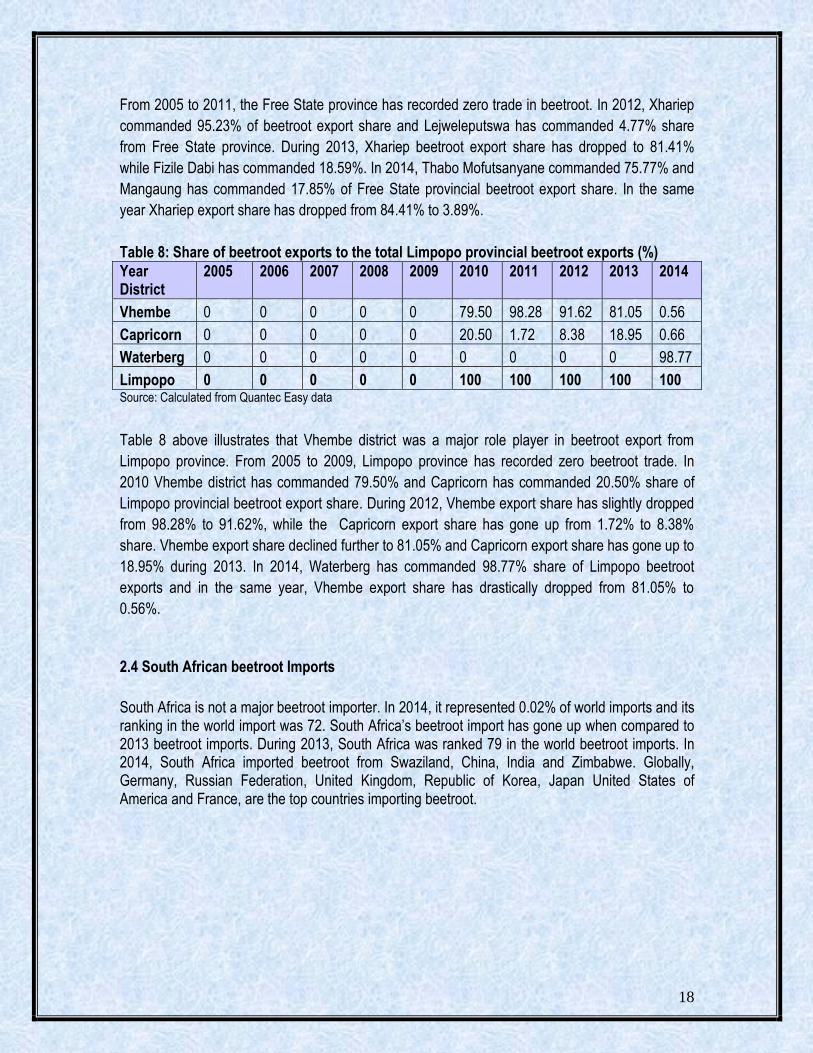
Source: Quantec Easydata
Figure 15 above shows the beetroot imports by South Africa in the ten year period. The significant import volumes were in 2007 and 2008 despite high domestic production during the same period. It was cheaper for South Africa to import beetroot in 2005 to 2006, since more volumes were imported at a lesser value. In 2009, beetroot imports volume decreased by 86% compared to 2008. This can be attributed to high domestic beetroot production that occurred in the same year. In 2010, South Africa’s beetroot import has gone up by 130% as compared to 2009. Beetroot imports have decreased by 91% in 2011 and this can be attributed to 10.6% increase in domestic production. In 2012, South Africa’s beetroot imports grew higher, when compared to 2011 imports, despite 13.2% increase in the domestic production output. During 2013, South Africa beetroot imports have dropped by an 83% when compared to the previous year beetroot import. Beetroot imports have gone down, despite an 8.3% decrease in domestic beetroot output. Beetroot imports notably increased by 62.5% during 2014. This can be ascribed to 4.3% drop in the domestic production output during the same year.
0
1000000
2000000
3000000
4000000
5000000
6000000
7000000
0
100
200
300
400
500
600
700
800
2005 2006 2007 2008 2009 2010 2011 2012 2013 2014
Ran
d
Ton
s
Years
Figure 15: South Africa's beetroot imports
Volume (Tons) Value (Rand)
20
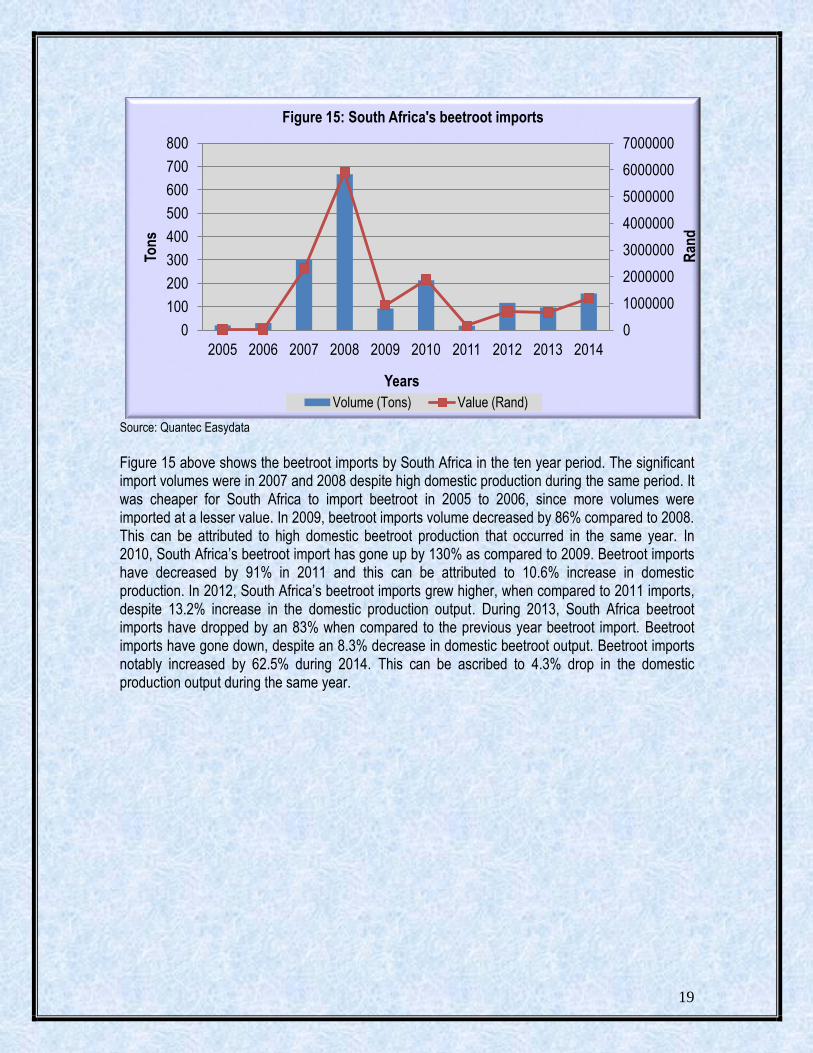
Source: Quantec Easydata
Figure 16 above shows South Africa’s provincial beetroot imports. Beetroot was imported through Gauteng, Western Cape, Kwazulu Natal and Free State provinces. In Kwazulu Natal notable beetroot import values were recorded in 2005 and 2006. From 2007 to 2009, South Africa’s beetroot was mainly imported through Western Cape province. From 2010 to 2014, beetroot imports entered South Africa mainly through Gauteng province.
Source: Quantec Easydata
2005 2006 2007 2008 2009 2010 2011 2012 2013 2014 2014
Western Cape 0 0 2273708 5876126 867735 0 2611 582 0 3421 3421
Free State 0 0 0 0 0 0 0 0 0 1755 1755
KwaZulu-Natal 19158 15073 0 0 19281 37235 12163 0 0 6984 6984
Gauteng 939 0 23999 23269 40080 1854309 145031 686972 656307 1188227 1188227
0
1000000
2000000
3000000
4000000
5000000
6000000
7000000
Imp
ort
Val
ue
(Ran
d)
Years
Figure 16: Value of SA provincial beetroot imports
2005 2006 2007 2008 2009 2010 2011 2012 2013 2014
Africa 18978 30011 27644 4402 11745 192043 17012 94134 66189 152899
Americas 0 0 272798 660969 69716 0 0 0 0 0
Asia 0 21 2 1983 11099 20910 1630 528 88 3975
Europe 1200 0 32 0 27 0 289 8 0 1
Not allocated 0 0 0 0 0 142 0 22000 30250 0
0
100000
200000
300000
400000
500000
600000
700000
Vo
lum
e (K
g)
Years
Figure 17: Beetroot import from the regions
21
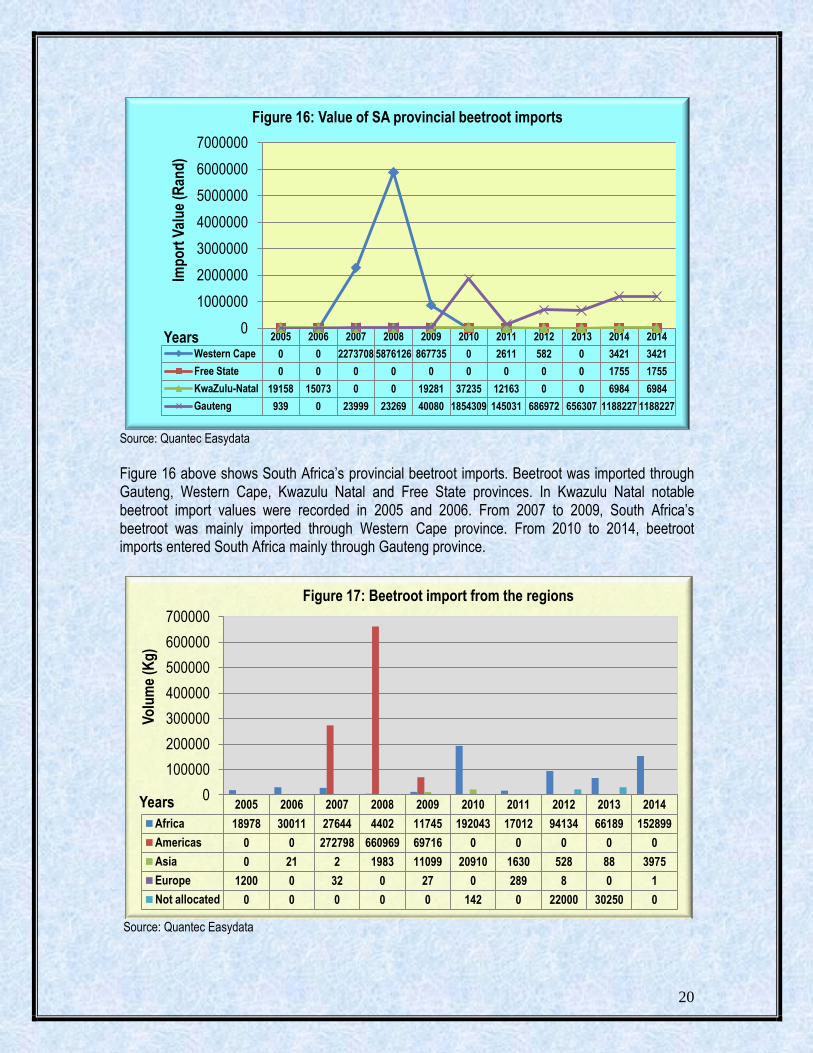
Figure 17 above illustrates imports of beetroot from various regions during the last ten years. South Africa import beetroot mainly from African countries. In 2005, considerable volumes of beetroot were imported from the European region. From 2007 to 2009, South Africa has imported high volumes of beetroot from Americas region. In Asia considerable beetroot import volumes were recorded in 2009 and 2010. From 2010 to 2014, there were no beetroot imports from Americas region. During 2012, South Africa’s beetroot imports were sourced from Africa, Asia and Europe, but the import from Europe was insignificant. In 2013, South Africa beetroot imports were sourced from Africa and Asia region. In the same year, there was no beetroot import from the Americas and Europe regions. During 2012 and 2013 a notable volume was not allocated to any region. In 2014, South Africa sourced high volume of beetroot from African region and notable the volume was imported from Asia region. Values of beetroot imports from the various regions of the world are presented in Figure 18.
Source: Quantec Easydata
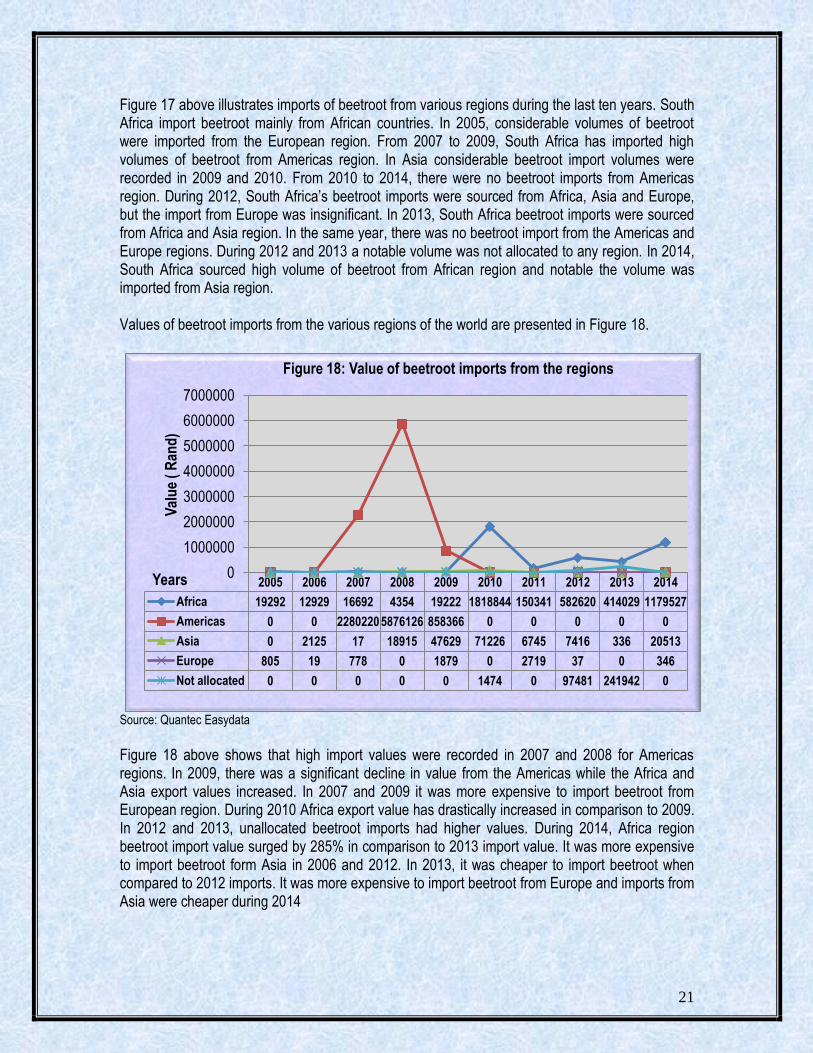
Figure 18 above shows that high import values were recorded in 2007 and 2008 for Americas regions. In 2009, there was a significant decline in value from the Americas while the Africa and Asia export values increased. In 2007 and 2009 it was more expensive to import beetroot from European region. During 2010 Africa export value has drastically increased in comparison to 2009. In 2012 and 2013, unallocated beetroot imports had higher values. During 2014, Africa region beetroot import value surged by 285% in comparison to 2013 import value. It was more expensive to import beetroot form Asia in 2006 and 2012. In 2013, it was cheaper to import beetroot when compared to 2012 imports. It was more expensive to import beetroot from Europe and imports from Asia were cheaper during 2014
2005 2006 2007 2008 2009 2010 2011 2012 2013 2014
Africa 19292 12929 16692 4354 19222 1818844 150341 582620 414029 1179527
Americas 0 0 2280220 5876126 858366 0 0 0 0 0
Asia 0 2125 17 18915 47629 71226 6745 7416 336 20513
Europe 805 19 778 0 1879 0 2719 37 0 346
Not allocated 0 0 0 0 0 1474 0 97481 241942 0
0
1000000
2000000
3000000
4000000
5000000
6000000
7000000
Val
ue
( R
and
)
Years
Figure 18: Value of beetroot imports from the regions
22
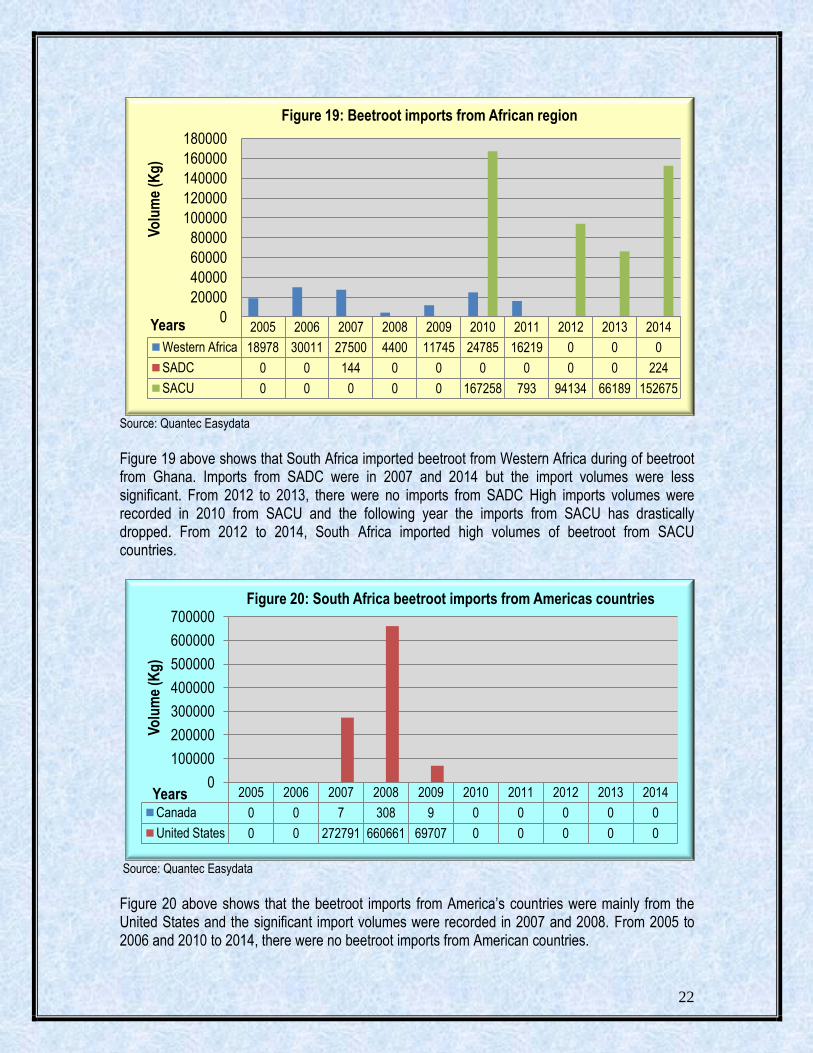
Source: Quantec Easydata Figure 19 above shows that South Africa imported beetroot from Western Africa during of beetroot from Ghana. Imports from SADC were in 2007 and 2014 but the import volumes were less significant. From 2012 to 2013, there were no imports from SADC High imports volumes were recorded in 2010 from SACU and the following year the imports from SACU has drastically dropped. From 2012 to 2014, South Africa imported high volumes of beetroot from SACU countries.
Source: Quantec Easydata
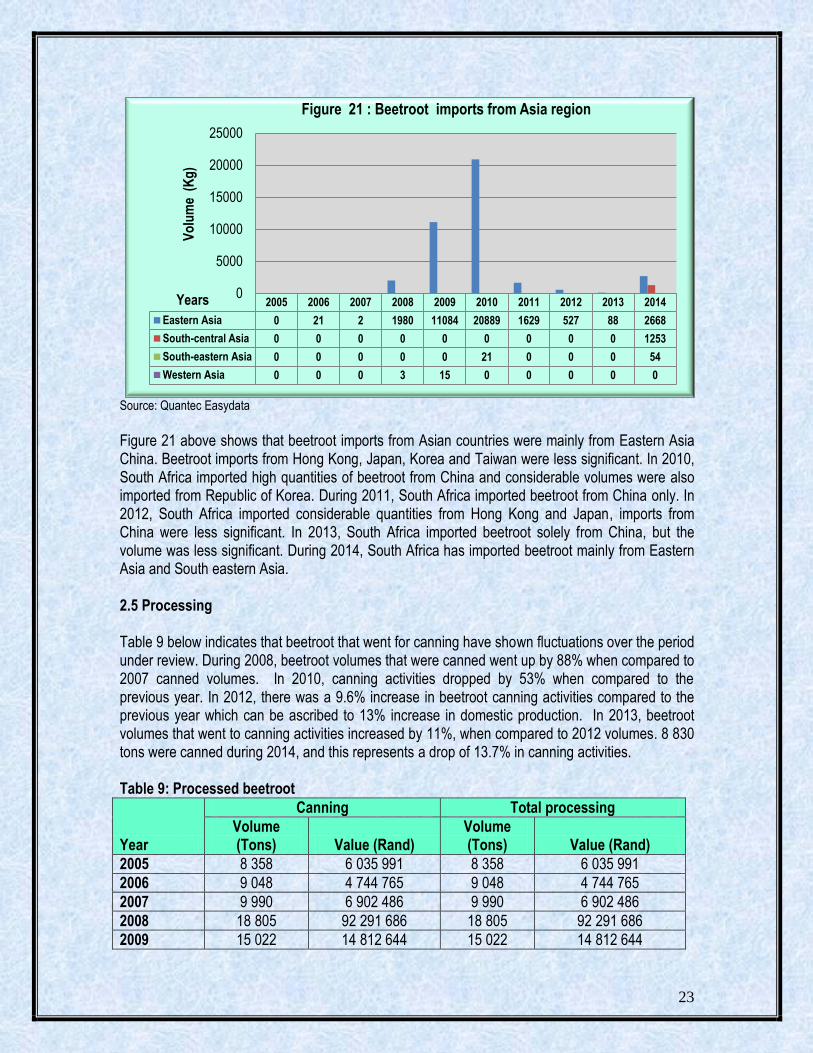
Figure 20 above shows that the beetroot imports from America’s countries were mainly from the United States and the significant import volumes were recorded in 2007 and 2008. From 2005 to 2006 and 2010 to 2014, there were no beetroot imports from American countries.
2005 2006 2007 2008 2009 2010 2011 2012 2013 2014
Western Africa 18978 30011 27500 4400 11745 24785 16219 0 0 0
SADC 0 0 144 0 0 0 0 0 0 224
SACU 0 0 0 0 0 167258 793 94134 66189 152675
0
20000
40000
60000
80000
100000
120000
140000
160000
180000 V
olu
me
(Kg
)
Years
Figure 19: Beetroot imports from African region
2005 2006 2007 2008 2009 2010 2011 2012 2013 2014
Canada 0 0 7 308 9 0 0 0 0 0
United States 0 0 272791 660661 69707 0 0 0 0 0
0
100000
200000
300000
400000
500000
600000
700000
Vo
lum
e (K
g)
Years
Figure 20: South Africa beetroot imports from Americas countries
23
Source: Quantec Easydata
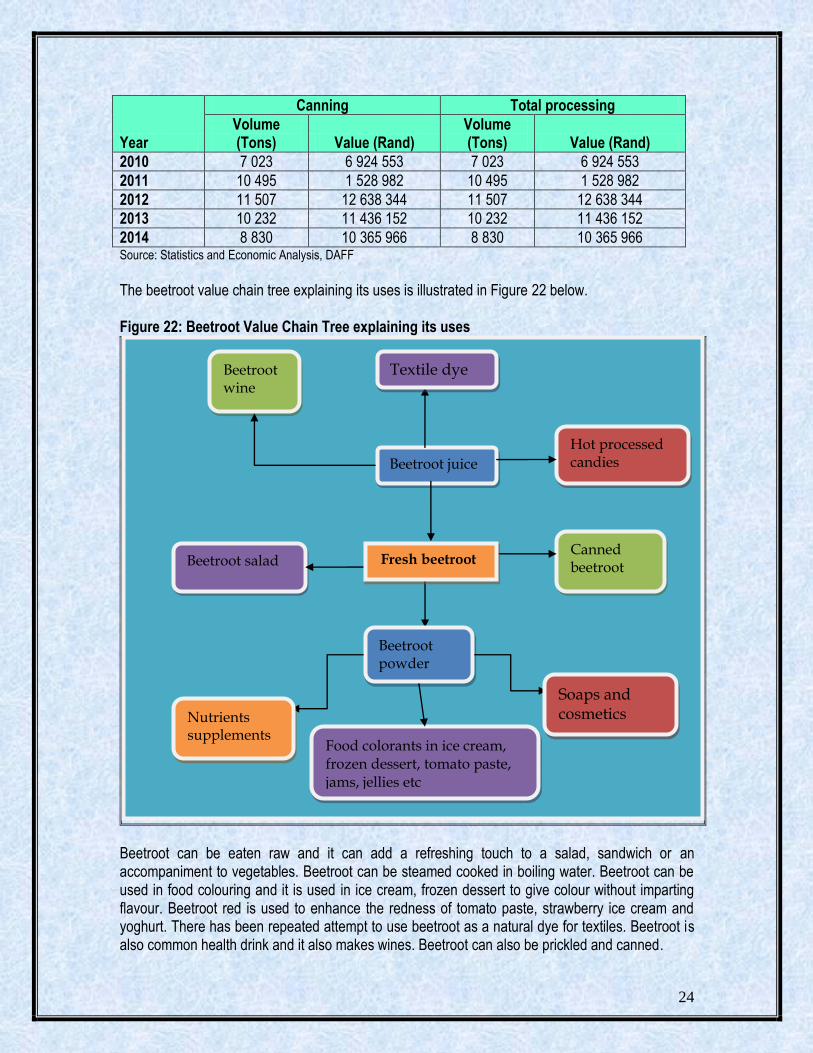
Figure 21 above shows that beetroot imports from Asian countries were mainly from Eastern Asia China. Beetroot imports from Hong Kong, Japan, Korea and Taiwan were less significant. In 2010, South Africa imported high quantities of beetroot from China and considerable volumes were also imported from Republic of Korea. During 2011, South Africa imported beetroot from China only. In 2012, South Africa imported considerable quantities from Hong Kong and Japan, imports from China were less significant. In 2013, South Africa imported beetroot solely from China, but the volume was less significant. During 2014, South Africa has imported beetroot mainly from Eastern Asia and South eastern Asia. 2.5 Processing Table 9 below indicates that beetroot that went for canning have shown fluctuations over the period under review. During 2008, beetroot volumes that were canned went up by 88% when compared to 2007 canned volumes. In 2010, canning activities dropped by 53% when compared to the previous year. In 2012, there was a 9.6% increase in beetroot canning activities compared to the previous year which can be ascribed to 13% increase in domestic production. In 2013, beetroot volumes that went to canning activities increased by 11%, when compared to 2012 volumes. 8 830 tons were canned during 2014, and this represents a drop of 13.7% in canning activities. Table 9: Processed beetroot
Year
Canning Total processing
Volume (Tons) Value (Rand)
Volume (Tons) Value (Rand)
2005 8 358 6 035 991 8 358 6 035 991
2006 9 048 4 744 765 9 048 4 744 765
2007 9 990 6 902 486 9 990 6 902 486
2008 18 805 92 291 686 18 805 92 291 686
2009 15 022 14 812 644 15 022 14 812 644
2005 2006 2007 2008 2009 2010 2011 2012 2013 2014
Eastern Asia 0 21 2 1980 11084 20889 1629 527 88 2668
South-central Asia 0 0 0 0 0 0 0 0 0 1253
South-eastern Asia 0 0 0 0 0 21 0 0 0 54
Western Asia 0 0 0 3 15 0 0 0 0 0
0
5000
10000
15000
20000
25000
Vo
lum
e (
Kg
)
Years
Figure 21 : Beetroot imports from Asia region
24
Year
Canning Total processing
Volume (Tons) Value (Rand)
Volume (Tons) Value (Rand)
2010 7 023 6 924 553 7 023 6 924 553
2011 10 495 1 528 982 10 495 1 528 982
2012 11 507 12 638 344 11 507 12 638 344
2013 10 232 11 436 152 10 232 11 436 152
2014 8 830 10 365 966 8 830 10 365 966 Source: Statistics and Economic Analysis, DAFF
The beetroot value chain tree explaining its uses is illustrated in Figure 22 below. Figure 22: Beetroot Value Chain Tree explaining its uses
Beetroot can be eaten raw and it can add a refreshing touch to a salad, sandwich or an accompaniment to vegetables. Beetroot can be steamed cooked in boiling water. Beetroot can be used in food colouring and it is used in ice cream, frozen dessert to give colour without imparting flavour. Beetroot red is used to enhance the redness of tomato paste, strawberry ice cream and yoghurt. There has been repeated attempt to use beetroot as a natural dye for textiles. Beetroot is also common health drink and it also makes wines. Beetroot can also be prickled and canned.
Beetroot juice
Beetroot powder
Beetroot salad Canned beetroot
Beetroot wine
Food colorants in ice cream, frozen dessert, tomato paste, jams, jellies etc
Nutrients supplements
Soaps and cosmetics
Textile dye
Fresh beetroot
Hot processed candies

25
2.6 Market value Chain for beetroot
The market value chain for beetroot is illustrated in Figure 23. The beetroot value chain can be broken down into the following levels: the producers of beetroot (farmers); pack house owners (cleans, grade and quality control); cold storage and transport facilities (store and transport beetroot on behalf of farmers); traders in beetroot (market and sell beetroot); processors (add value to beetroot and process beetroot to other usable forms); and end users (consumers) Figure 23: Market value chain for beetroot
Input Suppliers Farmers/Producers
Harvesting
Cleaning /Handling
Imports Quality grade standards and packaging
Storage, transportation and distribution
Exports
Fresh Produce Markets, Wholesalers, Supermarkets, Retailers and Informal Market
Processors: Canning, Juice extraction and Powder
Consumer

26
3. MARKET INTELLEGENCE
3.1 Tariffs
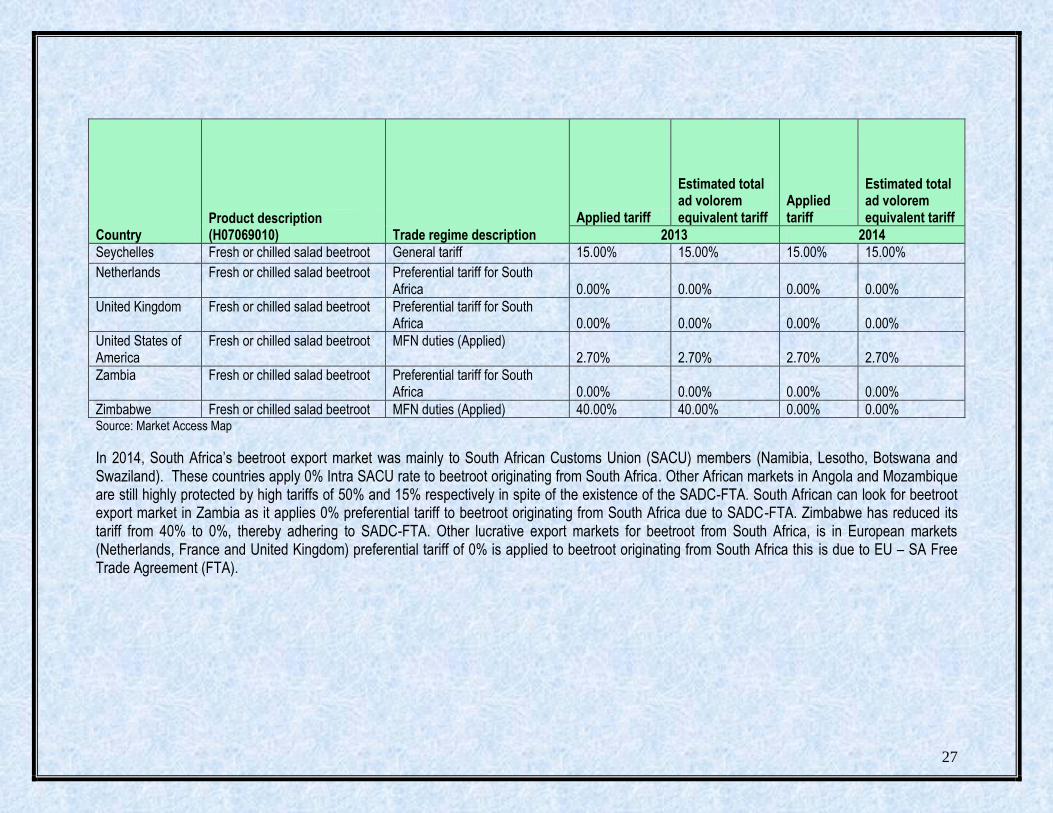
Tariffs applied by the various markets to beetroot originating from South Africa during 2013 and 2014 are presented in Table 10. Table 10: Tariffs applied by various exports markets to beetroot from South Africa.
Country Product description (H07069010) Trade regime description
Applied tariff
Estimated total ad volorem equivalent tariff
Applied tariff
Estimated total ad volorem equivalent tariff
2013 2014
Angola Fresh or chilled salad beetroot MFN duties (Applied) 15.00% 15.00% 50.00% 50.00%
Botswana Fresh or chilled salad beetroot Intra SACU rate 0.00% 0.00% 0.00%% 0.00%
Belgium Fresh or chilled salad beetroot Preferential tariff for South
Africa 0.00% 0.00% 0.00% 0.00%
Lesotho Fresh or chilled salad beetroot Intra SACU rate 0.00% 0.00%% 0.00% 0.00%%
China Fresh or chilled salad beetroot MFN duties (Applied) 13.00% 13.00% 13.00% 13.00%
France Fresh or chilled salad beetroot Preferential tariff for South
Africa 0.00% 0.00% 0.00% 0.00%
Swaziland Fresh or chilled salad beetroot Intra SACU rate 0.00% 0.00%% 0.00% 0.00%%
Ghana Fresh or chilled salad beetroot MFN duties (Applied 20.00% 20.00% 20.00% 20.00%
Namibia Fresh or chilled salad beetroot Intra SACU rate 0.00% 0.00%% 0.00% 0.00%%
Japan Fresh or chilled salad beetroot MFN duties (Applied) 3.00% 3.00% 2.5.00% 2.50%
Mozambique Fresh or chilled salad beetroot Preferential tariff for South
Africa 15.00% 15.00% 15.00% 15.00%
27
Country Product description (H07069010) Trade regime description
Applied tariff
Estimated total ad volorem equivalent tariff
Applied tariff
Estimated total ad volorem equivalent tariff
2013 2014
Seychelles Fresh or chilled salad beetroot General tariff 15.00% 15.00% 15.00% 15.00%
Netherlands Fresh or chilled salad beetroot Preferential tariff for South Africa 0.00% 0.00% 0.00% 0.00%
United Kingdom Fresh or chilled salad beetroot Preferential tariff for South Africa 0.00% 0.00% 0.00% 0.00%
United States of America
Fresh or chilled salad beetroot MFN duties (Applied) 2.70% 2.70% 2.70% 2.70%
Zambia Fresh or chilled salad beetroot Preferential tariff for South Africa 0.00% 0.00% 0.00% 0.00%
Zimbabwe Fresh or chilled salad beetroot MFN duties (Applied) 40.00% 40.00% 0.00% 0.00% Source: Market Access Map
In 2014, South Africa’s beetroot export market was mainly to South African Customs Union (SACU) members (Namibia, Lesotho, Botswana and Swaziland). These countries apply 0% Intra SACU rate to beetroot originating from South Africa. Other African markets in Angola and Mozambique are still highly protected by high tariffs of 50% and 15% respectively in spite of the existence of the SADC-FTA. South African can look for beetroot export market in Zambia as it applies 0% preferential tariff to beetroot originating from South Africa due to SADC-FTA. Zimbabwe has reduced its tariff from 40% to 0%, thereby adhering to SADC-FTA. Other lucrative export markets for beetroot from South Africa, is in European markets (Netherlands, France and United Kingdom) preferential tariff of 0% is applied to beetroot originating from South Africa this is due to EU – SA Free Trade Agreement (FTA).

28
3.2 Non tariff barriers
3.2.1 The European Union Non-tariff barriers can be divided into those that are mandatory and laid out in the EU Commission’s legislature, and those that are as a result of consumers, retailers, importers and other distributions’ preferences. Product legislation: quality and marketing There are a number of pieces of EU legislation that govern the quality of produce that may be imported, marketed and sold within the EU. General Food Law covers matters in procedures of food safety and hygiene (micro-biological and chemical), including provisions on the traceability of food (for example, Hazard Analysis and Critical Control Points, of HACCP). EU Marketing Standards, which govern the quality and labeling of vegetables, are laid out in the CAP framework under regulation EC 2200/96. These regulations include diameter, weight and class specifications, and any produce that does not comply with these standards are not allowed to be sold on the EU markets (detailed lists of products and their standards can be found in the annexes to the directive). The legislation (under EU 1148/2001) also dictates that a Certificate of Conformity must be obtained by anyone wishing to export and sell vegetables in the EU, if that particular vegetable falls under the jurisdiction on the EU marketing standards, vegetables to be used in further processing needs a Certificate of Industrial Use, whilst another legislative directive covers the Maximum Residue Limits (MRL) of various pesticides allowed. 3.2.1 (b) Product legislation: phytosanitary regulations The international standard for phytosanitary measures was set up by the International Plant Protection Committee (IPPC) to protect against the spreading of diseases or insects through the importation of certain agricultural goods. The EU has its own particular rules formalized under EC 2002/89, which attempts to prevent contact of EU crops with harmful organisms from elsewhere in the world. The crux of the directive is that it authorizes the Plant Protection Services to inspect a large number of vegetable products upon arrival in the EU. This inspection consists of a physical examination of a consignment deemed to have a level of phytosanitary risk, identification of any harmful organisms and certification of the validity of any phytosanitary certificate covering the consignment. If the consignment does not comply with the requirements, it may not enter the EU, although certain organisms can be fumigated at the expense of the exporter.
29
3.2.1(c) Product legislation: packaging The EU commission lays down rules for materials that come into contact with food and which may endanger people’s health or bring about an unacceptable change in the composition of the foodstuffs. The framework legislation for this EC 1935/2004. Recycling packaging materials are also emphasized under 94/62/EC, whereby member states are required to recycle between 50% and 65% of packaging waste. If exporters do not ship produce in packaging which is reusable, they may be liable for the costs incurred by the importing companies. Wood packaging is subject to phytosanitary controls (see Directive EC 2002/89) and may need to undergo heat treatment, fumigation, etc. 3.2.1. (d) Non-legal market requirements: social and environmental accountability To access a market, importers must not only comply with the legal requirements set out above, but also with market requirements and demands. For the most part, these revolve around quality and the perceptions of European consumers about the environmental, social, health and safety aspects of both the products and the production techniques. Whilst supplying vegetables that complies with these issues may not be mandatory in the legal sense, they are becoming increasingly important in Europe and cannot be ignored by existing or potential exporters. (i) Social responsibility is becoming important in the industry, not only amongst consumers, but also for retail outlets and wholesalers. The Social Accountability 8000 (SA8000) certification is a management system based on International Labour Organization (ILO) conventions, and deals with issues such as a child labour, health and safety, and freedom of association, and requires an on-site audit to be performed annually. The certificate is seen as necessary for accessing any European market successfully. The major retailers in the EU also play an important role in tackling environmental issues, which means that exporters have to take these into account when negotiating exporting arrangements.
(ii) Environmental issues are becoming increasingly important with European consumers. Consumer movements are lobbying against purchasing non-environmental friendly or non-sustainable produce. To this end, both governments and private partners have created standards (such as ISO 14001 and EUREPGAP) and labels to ensure produce adhere to particular specifications. Labels are an absolute must for exporters attempting to enter the rapidly expanding organic produce market. The EU Commission has recently adopted and EU label for identifying food produced according to EU organic standards in the directive EEC 209/91 3.2.1 (e) Consumer health and safety requirements Increasing consumer conscience about health and safety issues has prompted a number of safety initiatives in Europe, such as EUREPGAP on good agricultural practices (GAP) by the main European retailers, the international management system of HACCP, which is independently certified and required by legislation for European producers as well as food imported into Europe (EC 852/2004), and the ISO 9000 management standards system (for procedures and working methods), which is certified by the International Standards Organization (ISO).
30
3.2.2 The United States The USDA has quality standards for vegetables that provide a basis for domestic and international trade and promote efficiency in marketing and procurement. At the same time the USDA issues quality certificates based on these standards and a comprehensive grading system. Graders are located around the country at terminal markets. These certification services, which facilitate the ordering and purchasing of products by large-volume buyers, assure these buyers that the product they purchase will meet the terms of the contract in terms of quality, processing, size, packaging and delivery. 3.2.3 Asian Market Access Japan’s agricultural sector is heavily protected, with calculations from the Organization for Economic Co-operation and Development (OECD) estimating that almost 60% of the value of Japan’s farm production comes from trade barriers or domestic subsidies. Japan uses tariff rate quotas (TRQ) to protect its most sensitive products, and reserves the right for trading many of these products (within the quota) for one or two state trading enterprises. However, these extremely protective measures apply only to some products; others are able to compete more effectively with outside competition, often on the grounds of higher quality. Perhaps the biggest barrier to trade with Japan in vegetable markets is its strict phytosanitary requirements, which have often been challenged in the WTO as having little or no scientific justification. Other measures that are being challenged include Japan’s use of fumigation on agricultural products when cosmopolitan pests (already found in Japan) are detected. Japan is also increasing its labeling requirements
4. GENERAL DISTRIBUTION CHANNELS
There are roughly three distinct sales channels for exporting vegetables. One can sell directly to an importer with or without the assistance of an agent (usually larger, more established commercial farms). One can supply a vegetable combine, which will then contract out importers/marketers and try to take advantage of economies of scale and increased bargaining power. At the same time vegetable combines might also supply large retail chains. One can also be a member of a private or co-operate export organization (including marketing boards) which will find agents or importers and market the produce collectively. Similar to a vegetable combine, an export organization can either supply wholesale markets or retail chains depending on particular circumstances. Export organizations and marketing boards will wash, sort and package the produce.
5. LOGISTICAL ISSUES
5.1 Mode of transport
The transportation of vegetables falls within two categories – ocean cargo and air cargo – with ocean cargo taking much longer to reach the desired location but costing considerably less. Of course, the choice of transportation method depends, for the most part, on the fragility of the produce and how long it can remain relatively fresh. With the advent of technology and container improvements, the feasibility, cost and attractiveness of sea transportation have improved
31
considerably. As more developing countries begin to export and supply major developed countries markets, so the number and regularity of maritime routes, and the container vessels travelling these routes, increase. Presently South American countries like Peru benefit from the asparagus trade, which has lead to some level of economies of scale with other vegetable products, and this has enabled cheaper transport prices for their other vegetable varieties. Such economic of scale could benefit SADC countries if more producers became exporters and took advantage of the various ports which have special capabilities in handling vegetable produce (for example, the proposed terminal in Maputo). For some products, in order to reach the destination market with an acceptable degree of freshness, air transport is the only option (asparagus, for example, is flown from Peru to the sufficient to cover the transport costs, and collective agreements between farmers of different commodities with different harvest periods can become particularly important. 5.2 Cold chain management Cold chain management is crucial when handling perishable products, from the initial packing houses to the refrigerated container trucks that transport the produce to the shipping terminals, through to the storage facilities at these terminals (and their pre-cooling capability), onto the actual shipping vessels and their containers, and finally on to the importers and distributors that must clear the produce and transport it to the markets/retail outlets, etc. For every 10oC increase above the recommended temperature, the rate of respiration and ripening of produce can increase twice or even thrice. Related to this are the increasingly important traceability standards, which require an efficiently controlled supply chain and internationally accepted business standards. 5.3 Packaging Packaging also plays a vital role in ensuring safe and efficient transport of a product and conforming to handling requirements, uniformity, recyclable materials specifications, phytosanitary requirements, proper storage needs and even attractiveness (for marketing purposes).
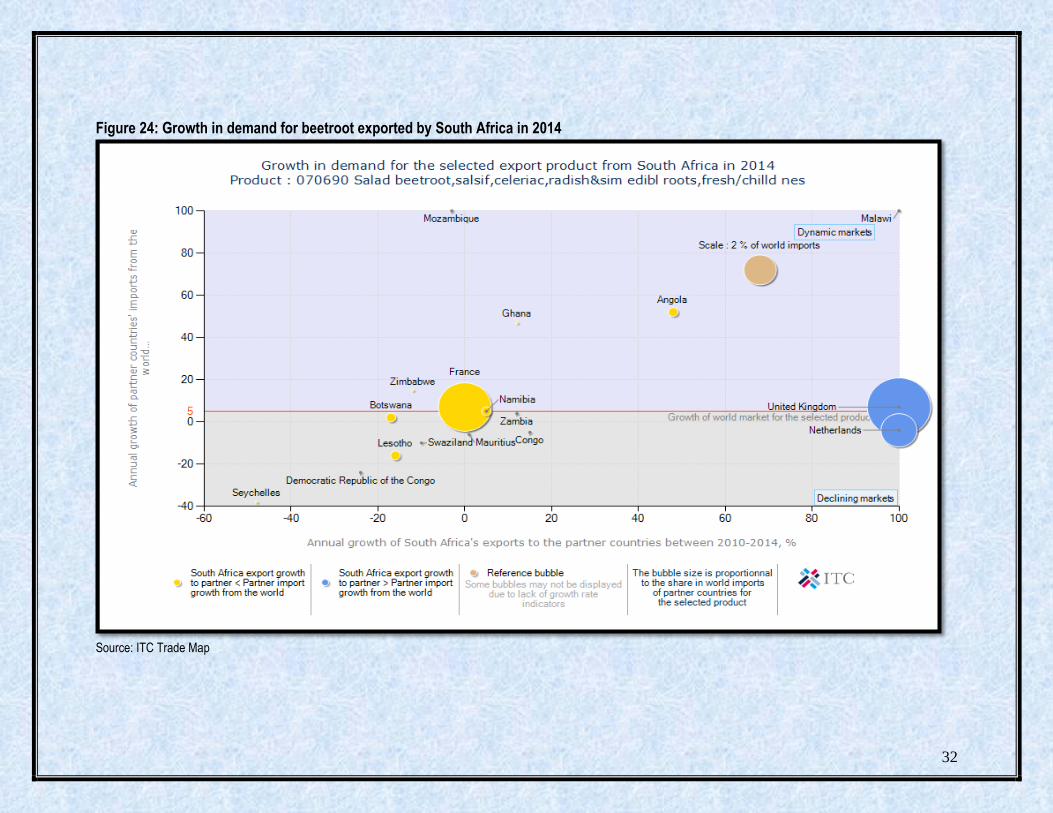
6. COMPETIVENESS OF SOUTH AFRICA BEETROOT EXPORTS
Figure 24 below illustrates that South African beetroot export to Ghana, France, Namibia, Angola and Malawi are growing slower than the world import into these countries. This is regarded as a loss in dynamic markets and South Africa’s performance in these countries is regarded as under achievement. South Africa’s exports to Zambia and United Kingdom are growing faster than the world imports into these countries. South Africa’s performance is regarded as a gain in dynamic markets. South Africa’s exports to Congo and Mauritius are declining not as fast as the world beetroot imports into these countries. South African beetroot exports are declining faster than the world imports into the Seychelles, Democratic Republic of the Congo, Lesotho and Swaziland. South Africa’s exports to Netherlands are growing, while world imports to this country are declining. Beetroot exports to Mozambique, Zimbabwe and Botswana are declining while the world imports are growing to these countries.
32
Figure 24: Growth in demand for beetroot exported by South Africa in 2014
Source: ITC Trade Map
33
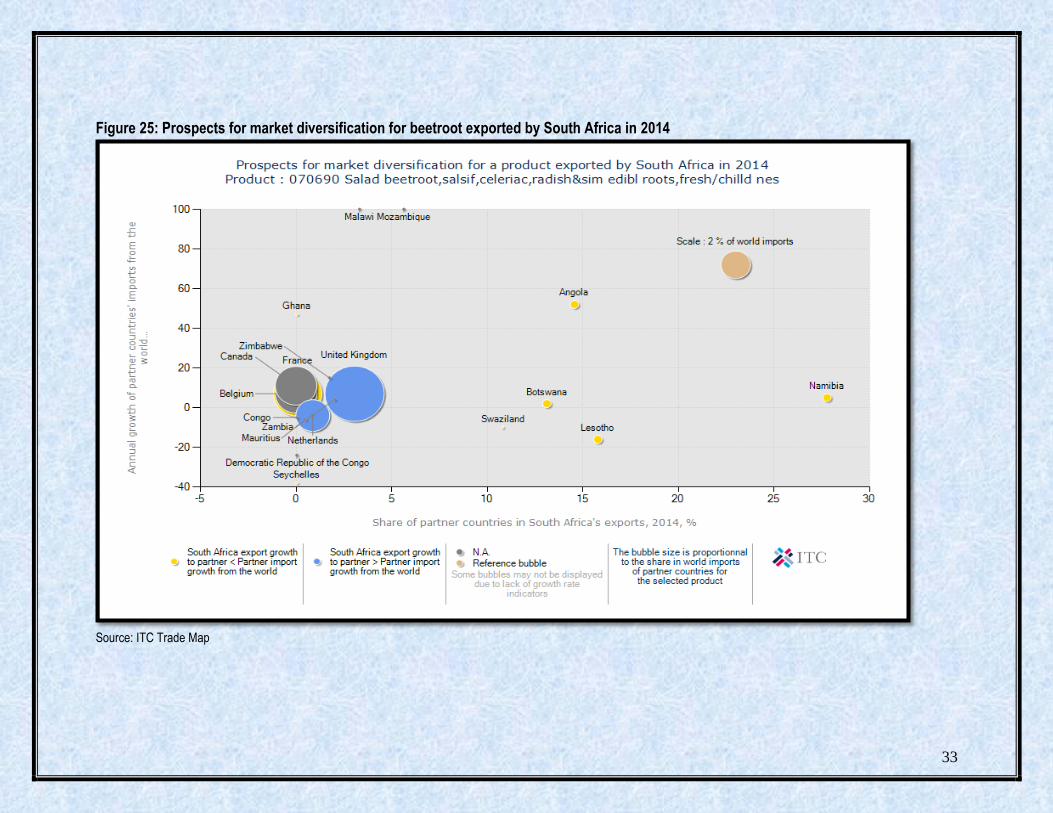
Figure 25: Prospects for market diversification for beetroot exported by South Africa in 2014
Source: ITC Trade Map

34
Figure 25 above shows that during 2014, Namibia, Angola, Lesotho and Botswana are currently the biggest markets for beetroot exports from South Africa. Prospective export markets for beetroot from South Africa are mainly in Ghana, Zimbabwe, Canada and United Kingdom. Other smaller markets exist in Belgium and France. However, if South Africa is to diversify its beetroot exports the most lucrative markets exist in Mozambique and Malawi which have increased their beetroot imports from the world by 189% and 129% respectively. Beetroot imports from the world to the Democratic Republic of the Congo, Netherlands, Mauritius, Congo and Seychelles have declined between 2010– 2014 and as a result these countries have recorded a negative growth rate.
35
7. ACKNOWLEDGEMENTS
The following organizations are acknowledged National Department of Agriculture, Forestry and Fisheries Directorate: Statistics and Economic Analysis Private Bag X246 Pretoria 0001 Tel (012) 930 1134 Fax (012) 319 8031 Trade and Industrial Policy Strategies (TIPS) P.O. Box 11214 Hatfield 0028 Tel (012) 431 7900 Fax (012) 431 7910 Quantec Easy Data www. easydata.co.za Market Access Map www.macmap.org www.trademap.org www.wikipedia.co.za Disclaimer: this document and its contents have been compiled by the Department of Agriculture, Forestry and Fisheries for the purpose of detailing the beetroot industry. Anyone who uses this information does so at his/her own risk. The views expressed in this document are those of the Department of Agriculture, Forestry and Fisheries with regard to the agricultural industry, unless otherwise stated. The Department of Agriculture, Forestry and Fisheries, accepts no liability that can be incurred resulting from the use of this information