BEEF & VEAL MARKET SITUATION - European … · MARKET SITUATION CMO Committee 19 ... BE 956 974 988...
45
BEEF & VEAL MARKET SITUATION CMO Committee 21 June 2018
Transcript of BEEF & VEAL MARKET SITUATION - European … · MARKET SITUATION CMO Committee 19 ... BE 956 974 988...
BEEF & VEAL MARKET SITUATION
CMO Committee 21 June 2018

EU E V O L U T I O N
T O T A L B O V I N E
L I V E S T O C K
DECEMBER SURVEY
Dec %Var %Var %Var %Var
2017 2017 2017 2017
1000 Hd 2014 2015 2016 2017 2016 2014 2015 2016 2017 2016 2014 2015 2016 2017 2016 2014 2015 2016 2017 2016
BE 2 477 2 503 2 501 2 386 -4.6% 745 749 748 700 -6.5% 490 493 492 484 -1.6% 1 243 1 261 1 261 1 202 -4.7%
BG 562 561 570 552 -3.1% 121 109 120 110 -8.4% 65 64 63 57 -10.2% 376 388 387 386 -0.4%
CZ 1 373 1 366 1 340 1 366 +2.0% 413 403 397 407 +2.4% 311 309 295 299 +1.4% 649 654 648 660 +2.0%
DK 1 553 1 566 1 554 1 558 +0.3% 534 538 540 541 +0.2% 307 302 298 294 -1.3% 713 726 715 723 +1.1%
DE 12 742 12 635 12 467 12 281 -1.5% 3 909 3 836 3 795 3 704 -2.4% 3 011 2 993 2 960 2 904 -1.9% 5 823 5 806 5 712 5 673 -0.7%
EE 265 256 248 251 +1.2% 73 70 68 70 +2.5% 54 53 50 49 -2.0% 138 133 130 133 +1.8%
IE 6 243 6 422 6 613 6 674 +0.9% 1 886 2 026 2 077 2 087 +0.5% 1 649 1 660 1 778 1 792 +0.8% 2 709 2 737 2 759 2 795 +1.3%
EL 659 582 554 555 +0.2% 176 154 145 140 -3.4% 119 103 102 107 +4.9% 365 325 306 308 +0.7%
ES 6 079 6 183 6 318 6 467 +2.4% 2 302 2 325 2 404 2 492 +3.7% 746 786 804 822 +2.3% 3 031 3 072 3 110 3 153 +1.4%
FR 19 271 19 406 19 004 18 580 -2.2% 5 546 5 618 5 138 4 844 -5.7% 3 418 3 461 3 493 3 400 -2.7% 10 307 10 327 10 372 10 336 -0.3%
HR 441 455 462 470 +1.7% 132 148 154 156 +1.3% 88 88 89 99 +11.2% 221 219 219 215 -1.8%
IT 6 315 6 350 +0.6% 1 654 1 678 1 745 1 738 -0.4% 1 366 1 379 1 448 1 501 +3.6% 3 106 3 099 3 122 3 111 -0.3%
CY 60 59 63 67 +6.0% 22 21 22 23 +7.0% 10 9 10 11 +9.5% 28 29 32 33 +4.3%
LV 422 419 412 406 -1.6% 118 114 113 108 -4.2% 75 76 73 70 -3.9% 229 229 227 228 +0.5%
LT 737 723 695 676 -2.7% 192 185 179 180 +0.5% 149 152 143 135 -5.5% 395 385 373 362 -3.1%
LU 201 201 202 198 -2.1% 54 54 54 50 -7.1% 47 45 44 44 -0.3% 100 102 104 103 -0.3%
HU 802 821 852 870 +2.1% 219 220 239 243 +1.7% 176 180 176 179 +1.7% 407 421 438 448 +2.3%
MT 15 15 14 14 -1.3% 4 4 4 4 +7.7% 3 4 3 3 -3.4% 7 7 7 7 -4.9%
NL 4 169 4 315 4 294 4 030 -6.1% 1 676 1 707 1 666 1 594 -4.3% 657 660 644 575 -10.7% 1 836 1 948 1 985 1 860 -6.3%
AT 1 961 1 958 1 954 1 943 -0.6% 629 624 632 624 -1.4% 432 439 432 439 +1.5% 899 894 890 881 -1.0%
PL 5 660 5 763 5 970 6 036 +1.1% 1 450 1 617 1 718 1 713 -0.3% 1 445 1 532 1 637 1 669 +1.9% 2 765 2 614 2 615 2 654 +1.5%
PT 1 549 1 606 1 635 1 670 +2.1% 487 510 499 515 +3.1% 214 240 267 256 -4.1% 848 856 869 900 +3.5%
RO 2 069 2 092 2 050 1 989 -2.9% 463 475 447 431 -3.6% 254 261 251 244 -2.8% 1 352 1 357 1 352 1 315 -2.8%
SI 468 484 489 480 -1.9% 148 153 155 153 -1.2% 122 129 131 128 -1.8% 198 202 203 198 -2.4%
SK 466 457 446 440 -1.4% 130 130 130 125 -4.4% 93 91 84 84 +0.0% 243 236 231 231 -0.2%
FI 907 903 887 875 -1.4% 307 308 302 299 -1.1% 223 221 218 213 -2.5% 378 374 367 363 -1.1%
SE 1 436 1 428 1 436 1 449 +0.9% 473 467 468 474 +1.3% 334 342 344 342 -0.6% 629 619 624 633 +1.4%
UK 9 693 9 816 9 806 9 791 -0.2% 2 842 2 967 2 952 2 944 -0.3% 2 332 2 372 2 435 2 435 idem 4 520 4 477 4 419 4 412 -0.2%
EU 82 280 82 996 89 152 88 424 -0.8% 26 705 27 209 26 911 26 468 -1.6% 18 189 18 445 18 764 18 635 -0.7% 43 514 43 498 43 476 43 320 -0.4%
Source : EStat Newcronos EU %Var is calculated considering only countries available in 2016 AND 2017
TOTAL LIVESTOCK BOVINE < 1 Year BOVINE 1-2 Year BOVINE > 2 Year
21 June 2018
L I V E S T O C K
DECEMBER SURVEY
EU E V O L U T I O N
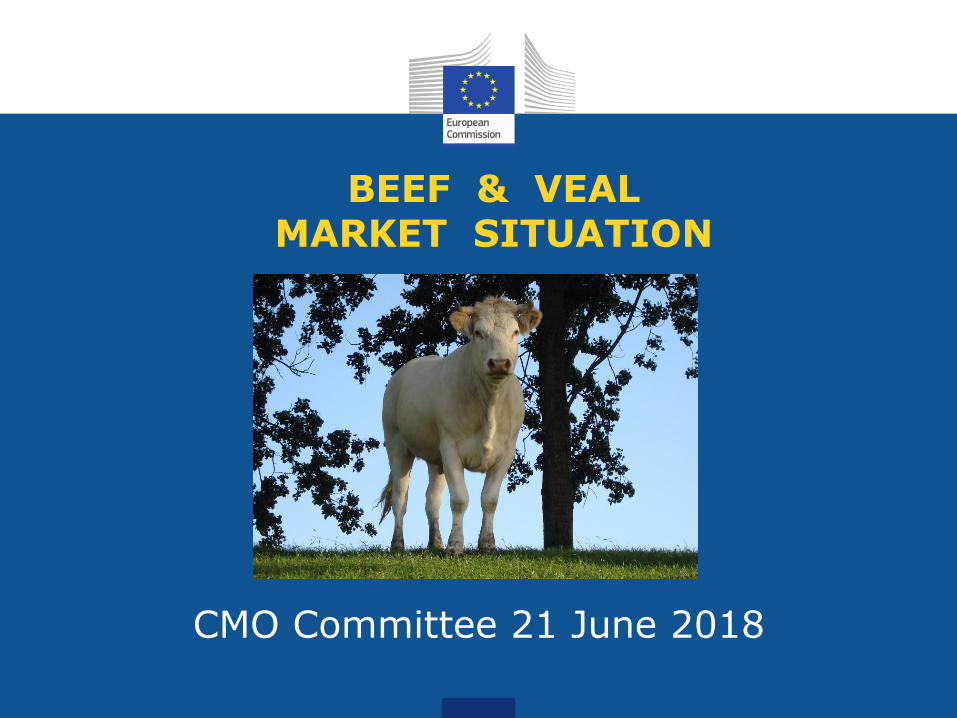
C O W S
Dec %Var %Var %Var
2017 2017 2017
1000 Hd 2014 2015 2016 2017 2016 2014 2015 2016 2017 2016 2014 2015 2016 2017 2016
BE 956 974 988 938 -5.1% 519 529 531 519 -2.2% 436 445 457 419 -8.4%
BG 351 359 365 357 -2.2% 302 283 279 260 -6.7% 49 76 86 97 +12.4%
CZ 566 566 561 571 +1.9% 372 369 367 365 -0.5% 194 197 193 206 +6.4%
DK 643 664 657 664 +1.1% 547 570 565 575 +1.8% 96 94 92 89 -3.3%
DE 4 969 4 966 4 887 4 859 -0.6% 4 296 4 285 4 218 4 199 -0.4% 674 681 670 660 -1.4%
EE 118 116 114 116 +1.8% 96 91 86 86 +0.3% 23 25 28 30 +6.1%
IE 2 169 2 293 2 337 2 362 +1.0% 1 128 1 240 1 295 1 343 +3.7% 1 041 1 053 1 042 1 018 -2.3%
EL 305 274 241 244 +1.2% 135 111 106 103 -2.8% 169 163 135 141 +4.4%
ES 2 669 2 763 2 785 2 823 +1.4% 845 844 834 824 -1.3% 1 824 1 919 1 950 1 999 +2.5%
FR 7 841 7 872 7 856 7 745 -1.4% 3 699 3 661 3 630 3 595 -1.0% 4 142 4 211 4 225 4 151 -1.8%
HR 180 171 167 161 -3.6% 159 152 147 139 -5.4% 21 19 20 22 +10.0%
IT 2 365 2 338 -1.1% 2 060 2 040 -1.0% 305 298 -2.2%
CY 25 26 29 30 +6.2% 25 26 28 30 +6.2% 0 0 0 0 -7.1%
LV 200 201 199 199 +0.1% 166 162 154 150 -2.4% 34 39 45 49 +8.8%
LT 351 343 333 323 -3.1% 314 301 286 273 -4.5% 37 43 47 50 +5.7%
LU 75 77 80 78 -1.7% 47 49 52 52 +0.3% 29 28 28 26 -5.4%
HU 359 368 383 395 +3.1% 255 250 244 244 idem 104 117 138 151 +9.4%
MT 7 7 7 6 -5.1% 7 6 7 6 -5.5% 0 0 0 0 +16.7%
NL 1 694 1 802 1 864 1 723 -7.6% 1 610 1 717 1 794 1 665 -7.2% 84 85 70 58 -17.1%
AT 768 758 757 750 -0.8% 538 534 540 543 +0.7% 230 224 217 207 -4.5%
PL 2 403 2 303 2 304 2 341 +1.6% 2 248 2 134 2 130 2 153 +1.1% 155 169 174 188 +8.2%
PT 697 719 724 728 +0.6% 234 243 239 239 -0.1% 463 476 485 490 +1.0%
RO 1 207 1 207 1 204 1 171 -2.8% 1 188 1 191 1 193 1 159 -2.8% 18 17 12 12 -1.7%
SI 168 170 171 169 -1.5% 108 113 108 109 +0.9% 60 57 64 60 -5.7%
SK 202 200 194 195 +0.3% 143 139 133 130 -2.1% 59 60 62 65 +5.3%
FI 340 339 333 329 -1.2% 283 282 275 271 -1.7% 57 57 57 58 +1.1%
SE 517 513 514 522 +1.7% 344 337 326 323 -0.8% 173 176 188 199 +6.0%
UK 3 419 3 469 3 451 3 444 -0.2% 1 883 1 918 1 898 1 902 +0.2% 1 536 1 551 1 554 1 542 -0.8%
EU 33 198 33 521 35 868 35 581 -0.8% 21 489 21 537 23 525 23 299 -1.0% 11 708 11 983 12 342 12 283 -0.5%
Source : EStat Newcronos EU %Var is calculated considering only countries available in 2016 AND 2017
TOTAL COWS DAIRY COWS OTHER COWS
21 June 2018
P R O D U C T I O N
% E V O L U T I O N
H E A D S
21 June 2018
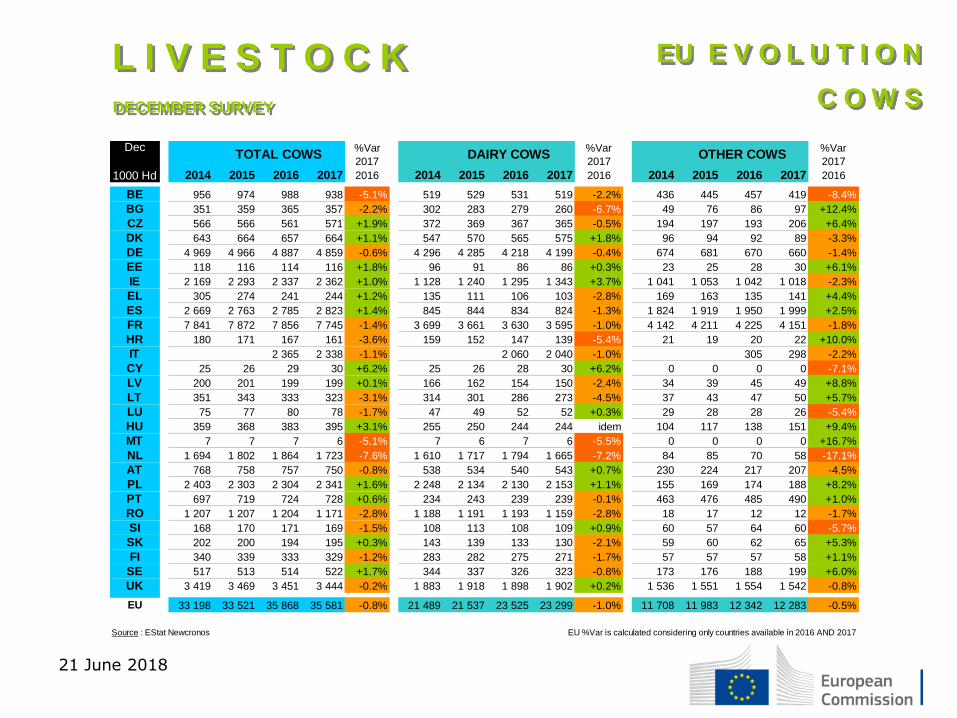
Estimates for last month of period : Source : EStat - Newcronos
Young cattle
+1.3%
-2.4% -2.6%
+1.0%Meat of
bovine
animals
+4.7% +4.4%
+0.7% +0.9%
+0.1% +0.0%
+0.5% +0.4%
Bullock
Bull
Jan-Mar 17/18
EU15 EU28HEADS
+0.5% +2.0%
Cow
Heifer
Calve
-1.6
%
+15.
1%
-1.0
%
+1.9
%
-0.6
%
-5.4
%
+1.4
%
-2.8
%
+0.5
%
+0
.9%
+3.7
%
+4.8
%
+16.
6%
-1.6
%
-0.9
%
+3.0
%
+10.
9%
-14.
4%
-3.6
%
+6.1
%
+6
.6%
+6
.8%
-16.
5%
+1.5
%
+19.
9%
-2.5
%
+4.9
%
+2.0
%
- 20 %
- 10 %
0%
+ 10 %
+ 20 %
- 20 %
- 10 %
0%
+ 10 %
+ 20 %
BE BG CZ DK DE EE IE EL ES FR HR IT CY LV LT LU HU MT NL AT PL PT RO SI SK FI SE UK
EU : + 1.3%
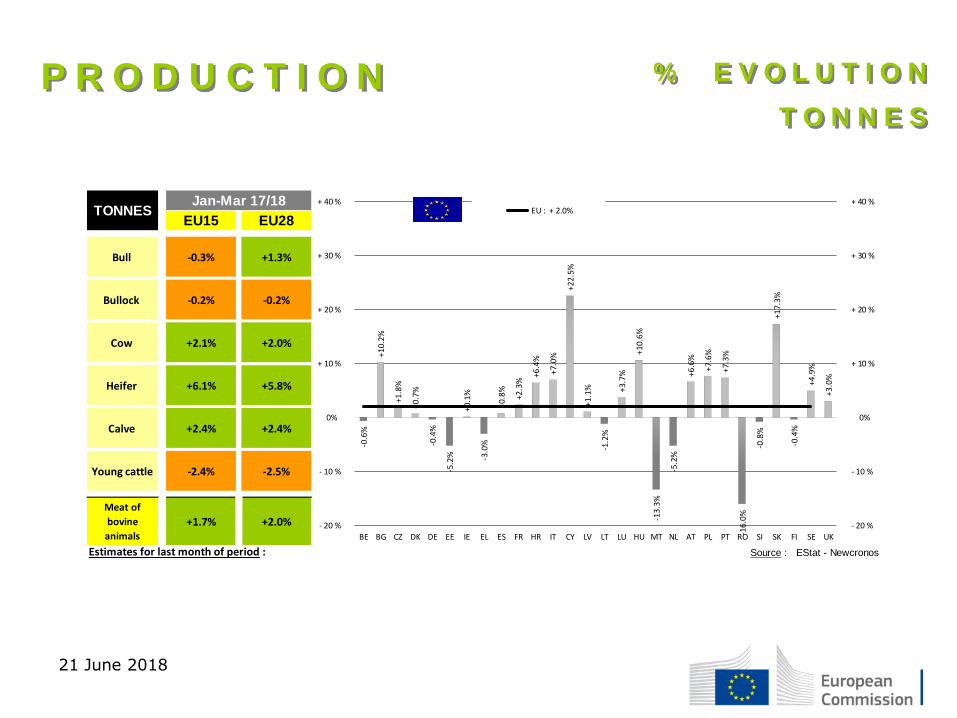
P R O D U C T I O N
% E V O L U T I O N
T O N N E S
21 June 2018
Estimates for last month of period : Source : EStat - Newcronos
TONNESEU15 EU28
Jan-Mar 17/18
+2.0%
+5.8%
+2.4%
-0.3%
Cow
Bullock -0.2%
+6.1%
+2.4%
Meat of
bovine
animals
+2.0%+1.7%
-2.4% -2.5%Young cattle
Calve
+2.1%
Heifer
Bull +1.3%
-0.2%
-0.6
%
+10.
2%
+1.8
%
+0.7
%
-0.4
%
-5.2
%
+0.1
%
-3.0
%
+0.8
%
+2.3
%
+6.4
%
+7.0
%
+22.
5%
+1.1
%
-1.2
%
+3.7
%
+10.
6%
-13.
3%
-5.2
%
+6.6
%
+7.6
%
+7.3
%
-16.
0%
-0.8
%
+17.
3%
-0.4
%
+4.9
%
+3.0
%
- 20 %
- 10 %
0%
+ 10 %
+ 20 %
+ 30 %
+ 40 %
- 20 %
- 10 %
0%
+ 10 %
+ 20 %
+ 30 %
+ 40 %
BE BG CZ DK DE EE IE EL ES FR HR IT CY LV LT LU HU MT NL AT PL PT RO SI SK FI SE UK
EU : + 2.0%

P R O D U C T I O N
H I S T O R I C
T O N N E S
21 June 2018
0
100
200
300
400
500
600
700
800
Jan Feb Mar Apr May Jun Jul Aug Sep Oct Nov Dec
1.0
00
To
nn
es
2 0 1 6 2 0 1 7 2 0 1 8
Beef & Veal Production (E28 Slaughtering) - Tonnes
Source : EStat-Newcronos
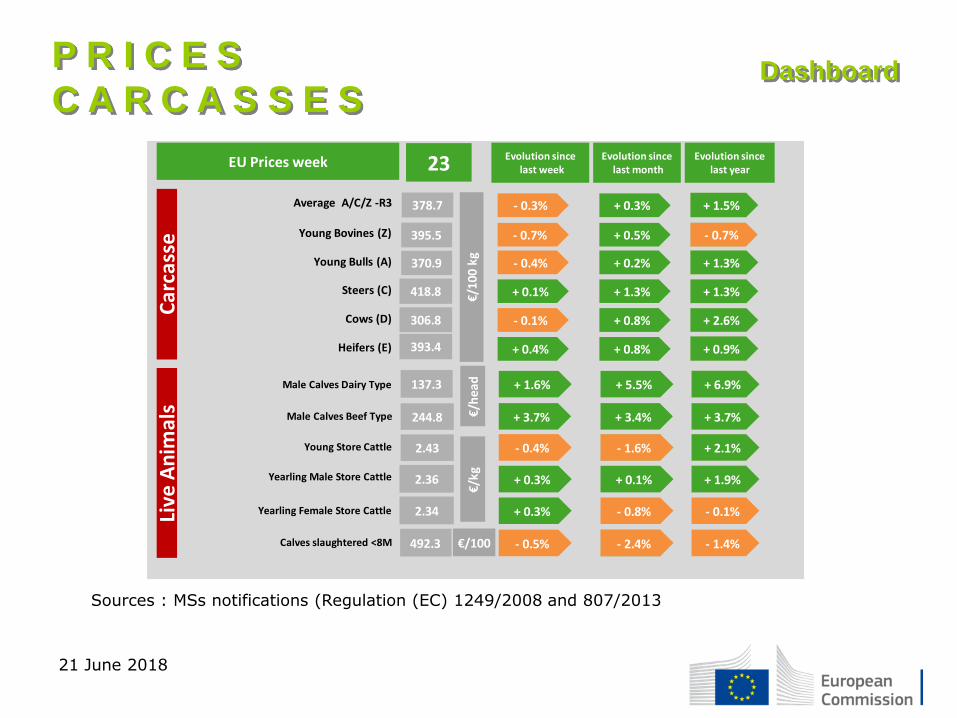
Dashboard
P R I C E S
C A R C A S S E S
21 June 2018
Sources : MSs notifications (Regulation (EC) 1249/2008 and 807/2013
Young Bovines (Z)
Young Bulls (A)
Steers (C)
Cows (D)
Heifers (E)
Average A/C/Z -R3
Live
An
imal
s
244.8
2.43
2.36
2.34
137.3
492.3
€/10
0 kg
393.4
395.5
370.9
418.8
306.8
378.7
- 0.7%
- 0.4%
+ 0.1%
- 0.1%
+ 0.4%
- 0.3%
+ 0.5%
+ 0.2%
+ 1.3%
+ 0.8%
+ 0.8%
+ 0.3%
- 0.7%
+ 1.3%
+ 1.3%
+ 2.6%
+ 0.9%
+ 1.5%
Car
cass
eEU Prices week Evolution since
last weekEvolution since
last monthEvolution since
last year23
Male Calves Beef Type
Young Store Cattle
Yearling Male Store Cattle
Yearling Female Store Cattle
Male Calves Dairy Type
Calves slaughtered <8M
+ 3.7%
- 0.4%
+ 0.3%
+ 0.3%
+ 1.6%
- 0.5%
+ 3.4%
- 1.6%
+ 0.1%
- 0.8%
+ 5.5%
- 2.4%
+ 3.7%
+ 2.1%
+ 1.9%
- 0.1%
+ 6.9%
- 1.4%
€/h
ead
€/kg
€/100
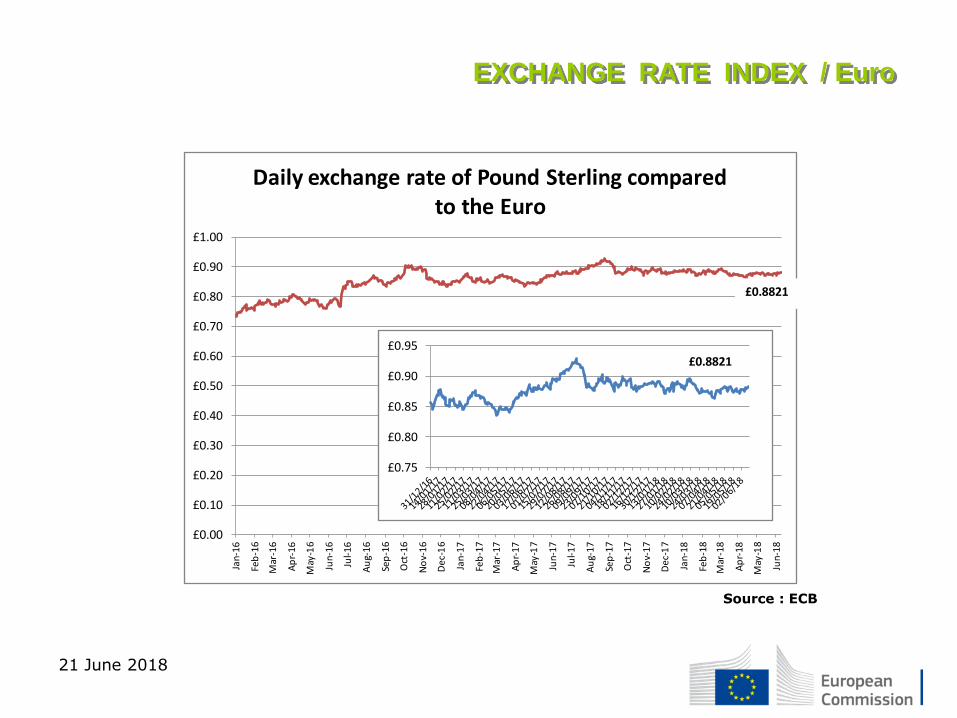
EXCHANGE RATE INDEX / Euro
21 June 2018
Source : ECB
£0.00
£0.10
£0.20
£0.30
£0.40
£0.50
£0.60
£0.70
£0.80
£0.90
£1.00Ja
n-16
Feb
-16
Mar
-16
Ap
r-16
May
-16
Jun-
16
Jul-1
6
Au
g-1
6
Sep
-16
Oct
-16
No
v-1
6
Dec
-16
Jan-
17
Feb
-17
Mar
-17
Ap
r-17
May
-17
Jun-
17
Jul-1
7
Au
g-1
7
Sep
-17
Oct
-17
No
v-1
7
Dec
-17
Jan-
18
Feb
-18
Mar
-18
Ap
r-18
May
-18
Jun-
18
Daily exchange rate of Pound Sterling compared to the Euro
£0.75
£0.80
£0.85
£0.90
£0.95£0.8821
£0.8821
21 June 2018
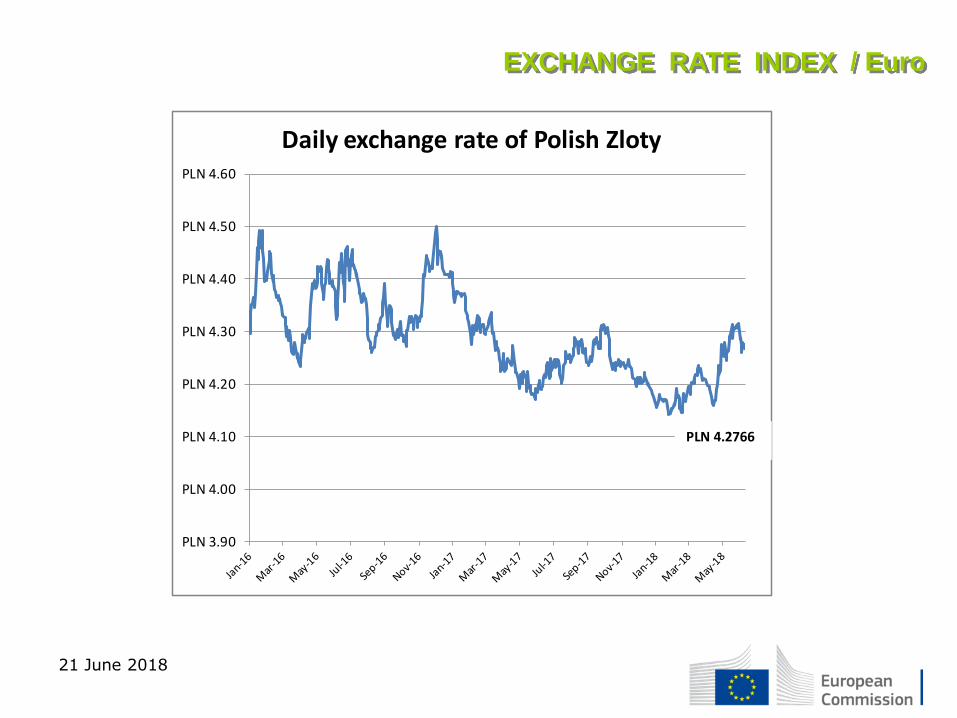
EXCHANGE RATE INDEX / Euro
PLN 3.90
PLN 4.00
PLN 4.10
PLN 4.20
PLN 4.30
PLN 4.40
PLN 4.50
PLN 4.60
Daily exchange rate of Polish Zloty
PLN 4.2766
EU E V O L U T I O N
A / C / Z . R3
P R I C E S
C A R C A S E S
21 June 2018
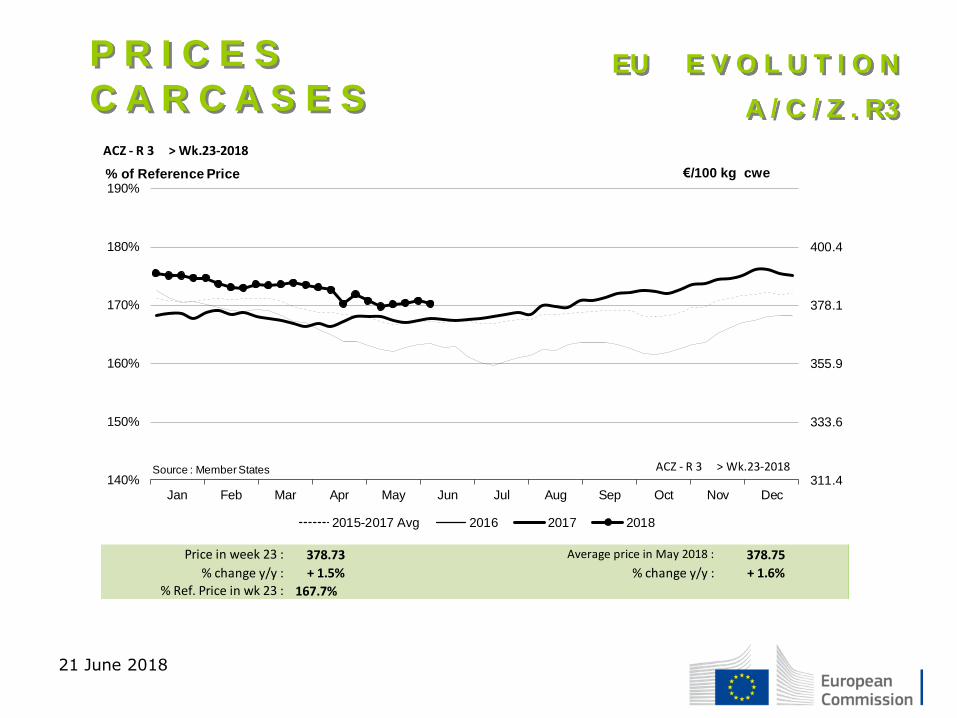
ACZ - R 3 > Wk.23-2018
378.73 378.75
% change y/y : + 1.5% % change y/y : + 1.6%
167.7%% Ref. Price in wk 23 :
Price in week 23 : Average price in May 2018 :
311.4
333.6
355.9
378.1
400.4
140%
150%
160%
170%
180%
190%
Jan Feb Mar Apr May Jun Jul Aug Sep Oct Nov Dec
€/100 kg cwe
2015-2017 Avg 2016 2017 2018
% of Reference Price
Source : Member States ACZ - R 3 > Wk.23-2018
EU E V O L U T I O N
A / C / Z . R3
P R I C E S
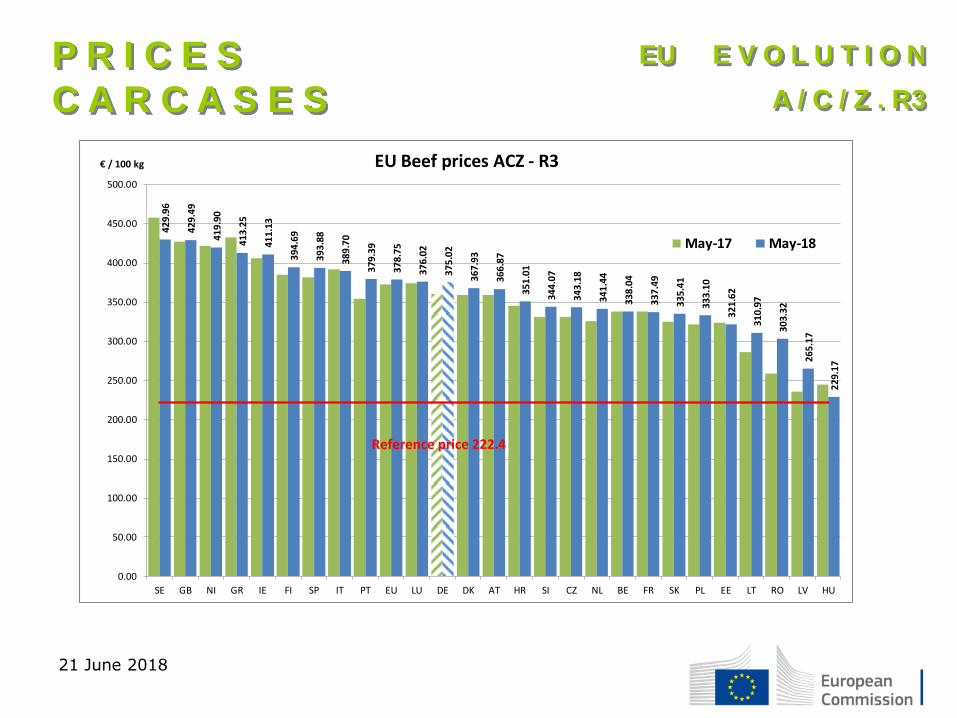
C A R C A S E S
21 June 2018
42
9.9
6
429.
49
419.
90
41
3.2
5
411.
13
394.
69
393.
88
389.
70
379.
39
378.
75
376.
02
375.
02
367.
93
366.
87
351.
01
344.
07
343.
18
341.
44
33
8.0
4
33
7.4
9
335.
41
333.
10
321.
62
310.
97
303.
32
265.
17
229.
17
0.00
50.00
100.00
150.00
200.00
250.00
300.00
350.00
400.00
450.00
500.00
SE GB NI GR IE FI SP IT PT EU LU DE DK AT HR SI CZ NL BE FR SK PL EE LT RO LV HU
€ / 100 kg EU Beef prices ACZ - R3
May-17 May-18
Reference price 222.4

P R I C E S
C A R C A S E S
EU E V O L U T I O N
Y O U N G B U L L – A.R3
21 June 2018
Young Bovines A - R 3 > Wk.01-2018
397.88 397.49
% change y/y : + 5.6% % change y/y : + 2.4%
Price in week 01 : Average price in December 2017 :
Young Bovines A - R 3 > Wk.23-2018
377.17 378.57
% change y/y : + 1.3% % change y/y : + 1.9%
Price in week 23 : Average price in May 2018 :
320
340
360
380
400
420
440
320
340
360
380
400
420
440
Jan Feb Mar Apr May Jun Jul Aug Sep Oct Nov Dec
2015-2017 Avg 2016 2017 2018
Source : Member States Young Bovines A - R 3 > Wk.23-

21 June 2018
P R I C E S
C A R C A S S E S
E.U. E V O L U T I O N
Y O U N G BOVINE 8-12M–
Z.R3
Young Bovines 8-12m Z - R 3 > Wk.23-2018
395.51 10/05/2018 396.24
% change y/y : + 2.5% % change y/y : + 3.3%
Price in week 23 : Average price in May 2018 :
340
360
380
400
420
440
JAN FEB MAR APR MAY JUN JUL AUG SEP OCT NOV DEC
2016 2017 2018 2015-2017 Avg
Source : Member States
In € / 100 kg

E.U. E V O L U T I O N
S T E E R – C.R3
P R I C E S
C A R C A S E S
21 June 2018
Bullocks C - R 3 > Wk.23-2018
413.86 410.52
% change y/y : + 0.6% % change y/y : + 0.3%
Price in week 23 : Average price in May 2018 :
300
325
350
375
400
425
450
475
500
300
325
350
375
400
425
450
475
500
Jan Feb Mar Apr May Jun Jul Aug Sep Oct Nov Dec
2015-2017 Avg 2016 2017 2018
Source : Member States Bullocks C - R 3 > Wk.23-2018
E.U. E V O L U T I O N
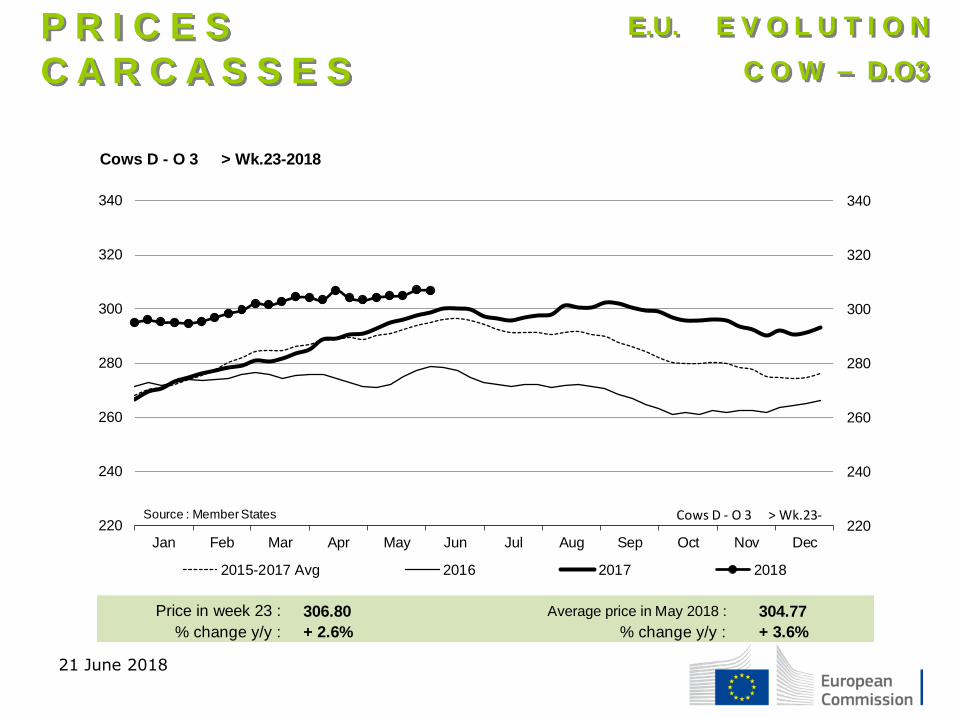
C O W – D.O3
P R I C E S
C A R C A S S E S
21 June 2018
Cows D - O 3 > Wk.23-2018
306.80 304.77
% change y/y : + 2.6% % change y/y : + 3.6%
Price in week 23 : Average price in May 2018 :
220
240
260
280
300
320
340
220
240
260
280
300
320
340
Jan Feb Mar Apr May Jun Jul Aug Sep Oct Nov Dec
2015-2017 Avg 2016 2017 2018
Source : Member States Cows D - O 3 > Wk.23-

EU E V O L U T I O N
H E I F E R – E.R3
P R I C E S
C A R C A S E S
21 June 2018
Heifers E - R 3 > Wk.23-2018
393.49 392.20
% change y/y : + 0.9% % change y/y : + 0.9%
Price in week 23 : Average price in May 2018 :
310
330
350
370
390
410
430
310
330
350
370
390
410
430
Jan Feb Mar Apr May Jun Jul Aug Sep Oct Nov Dec
2015-2017 Avg 2016 2017 2018
Source : Member States Heifers E - R 3 > Wk.23-
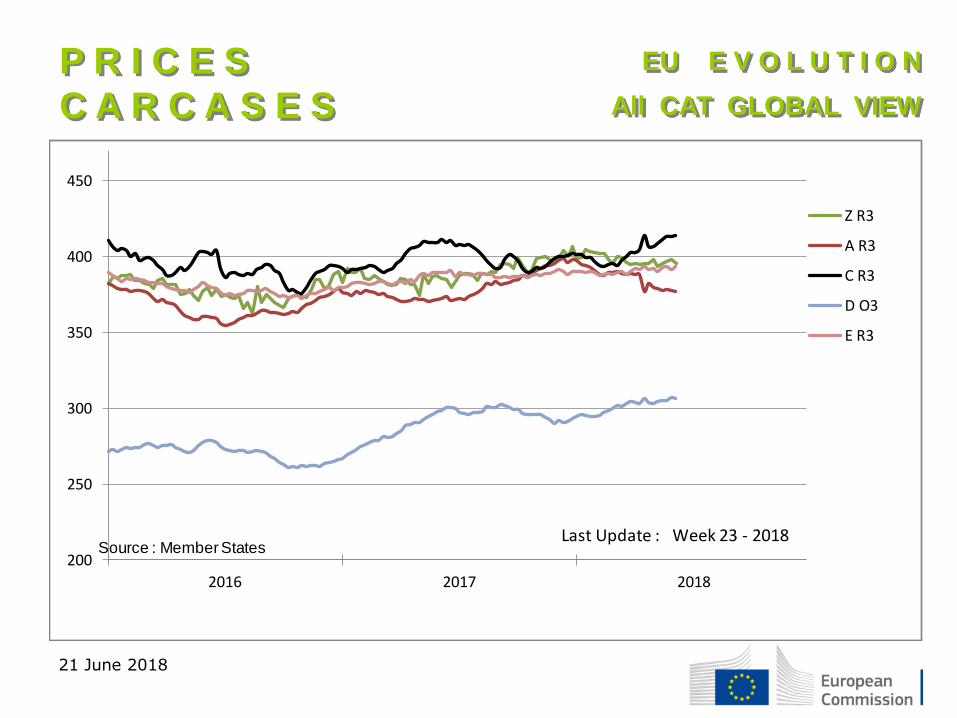
EU E V O L U T I O N
All CAT GLOBAL VIEW
P R I C E S
C A R C A S E S
21 June 2018
200
250
300
350
400
450
2016 2017 2018
Z R3
A R3
C R3
D O3
E R3
Source : Member StatesLast Update : Week 23 - 2018

Store cattle (€/100 kg live weight)
21 June 2018
EU E V O L U T I O N
STORE CATTLE
P R I C E S
L I V E B O V I N E S
Young Store Cattle Price in Week 23 2.43 Yearling Male Store Cattle Price 2.36
Change y/y +2.06% Change y/y +1.94%
Yearling Female Store Cattle Price 2.34
Change y/y -0.10%
1.90
2.00
2.10
2.20
2.30
2.40
2.50
2.60
Young Store Cattle Prices
Young Store Cattle Yearling Male Store Cattle Yearling Female Store Cattle
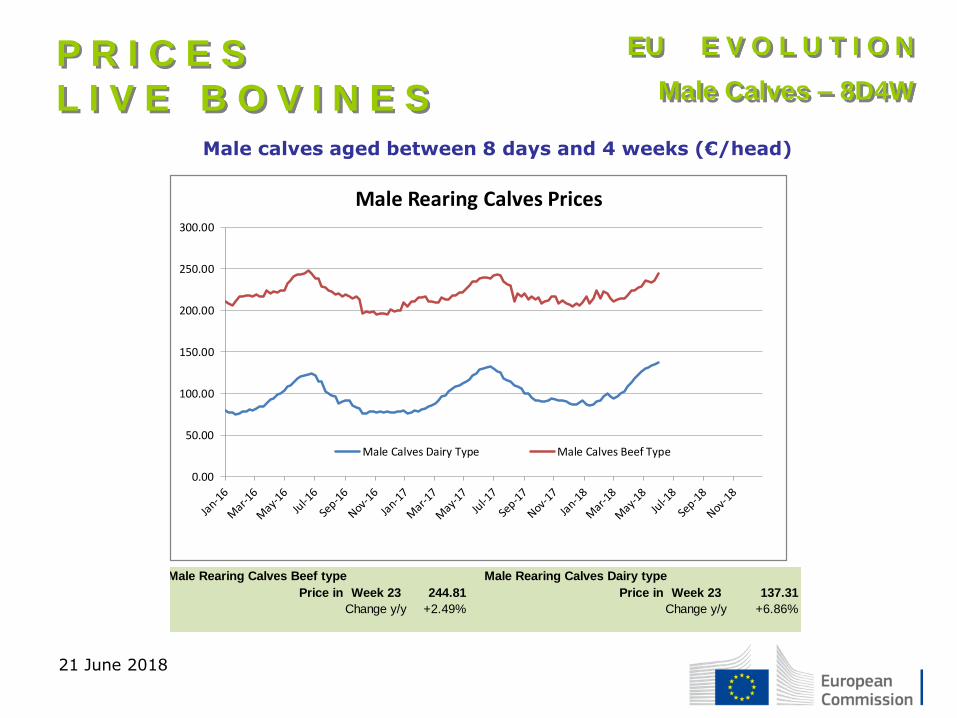
Male calves aged between 8 days and 4 weeks (€/head)
21 June 2018
P R I C E S
L I V E B O V I N E S
EU E V O L U T I O N
Male Calves – 8D4W
Male Rearing Calves Beef type Male Rearing Calves Dairy type
Price in Week 23 244.81 Price in Week 23 137.31
Change y/y +2.49% Change y/y +6.86%
0.00
50.00
100.00
150.00
200.00
250.00
300.00
Male Rearing Calves Prices
Male Calves Dairy Type Male Calves Beef Type
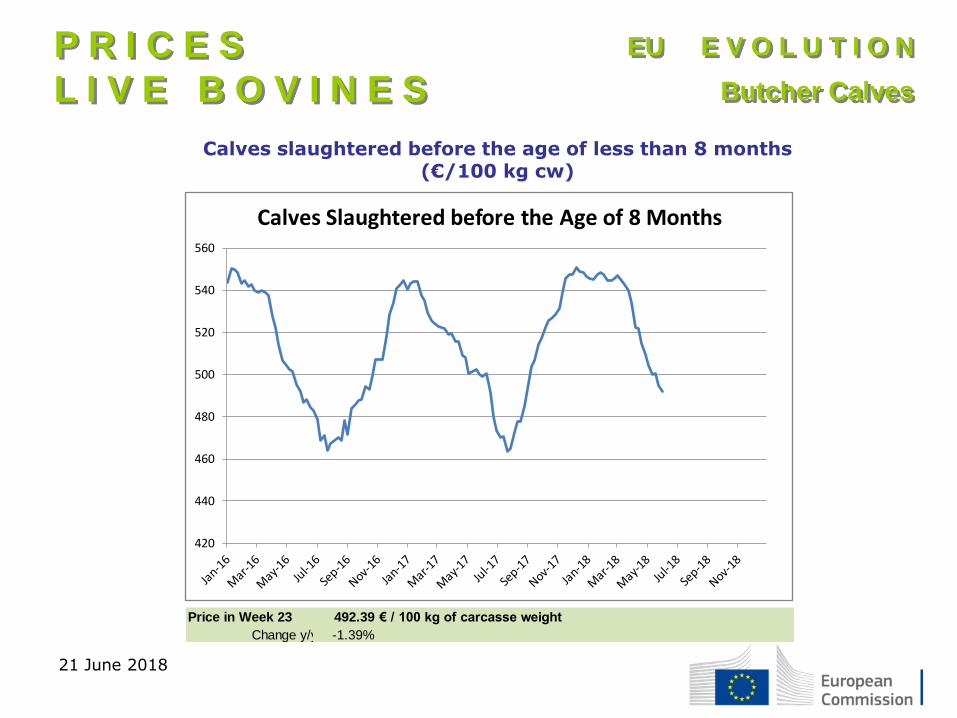
Calves slaughtered before the age of less than 8 months (€/100 kg cw)
21 June 2018
P R I C E S
L I V E B O V I N E S
EU E V O L U T I O N
Butcher Calves
Price in Week 23 492.39 € / 100 kg of carcasse weight
Change y/y -1.39%
420
440
460
480
500
520
540
560
Calves Slaughtered before the Age of 8 Months
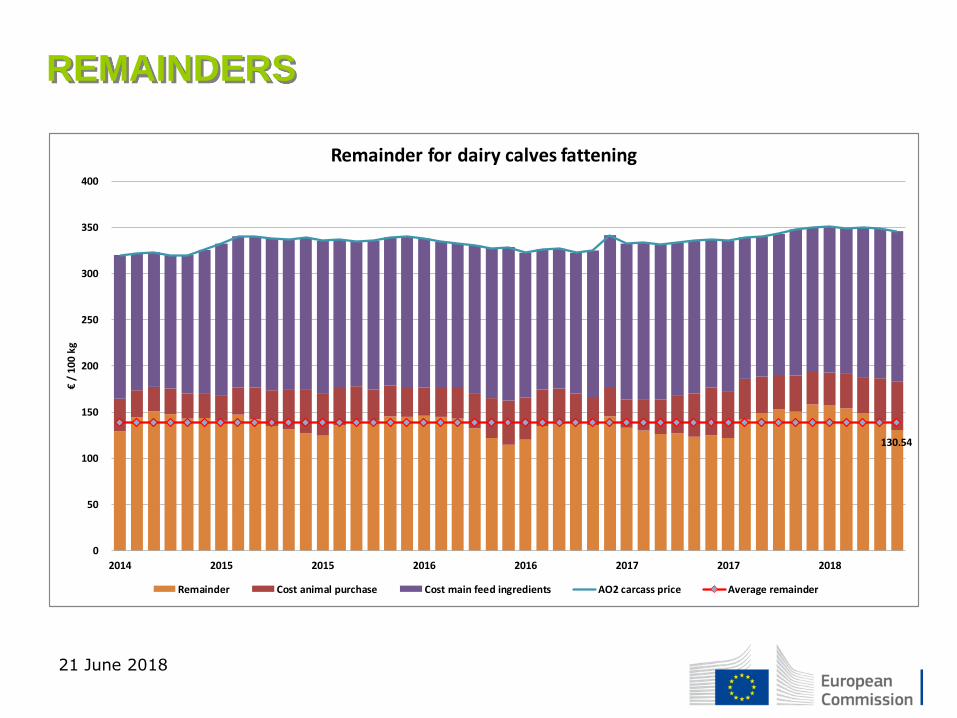
REMAINDERS
21 June 2018
130.54
0
50
100
150
200
250
300
350
400
2014 2015 2015 2016 2016 2017 2017 2018
€/
100
kg
Remainder for dairy calves fattening
Remainder Cost animal purchase Cost main feed ingredients AO2 carcass price Average remainder
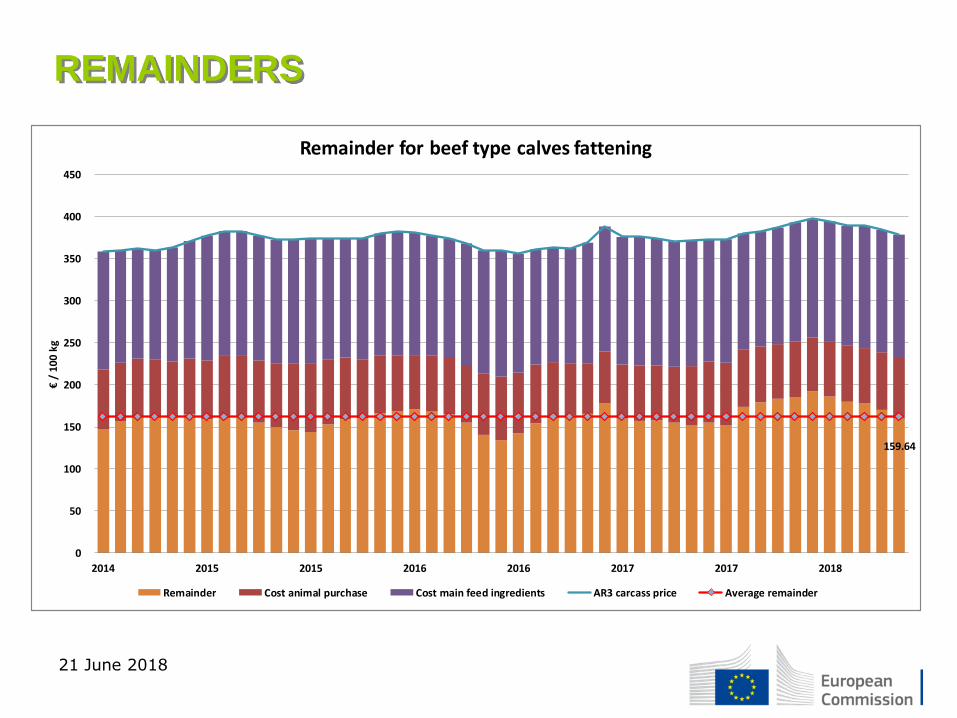
REMAINDERS
21 June 2018
159.64
0
50
100
150
200
250
300
350
400
450
2014 2015 2015 2016 2016 2017 2017 2018
€/
100
kg
Remainder for beef type calves fattening
Remainder Cost animal purchase Cost main feed ingredients AR3 carcass price Average remainder

REMAINDERS
21 June 2018
77.26
0
50
100
150
200
250
300
350
400
450
2014 2015 2015 2016 2016 2017 2017 2018
€/10
0Kg
Remainder for young store cattle fattening
Remainder Cost animal purchase Cost main feed ingredients AR3 carcass price Average remainder
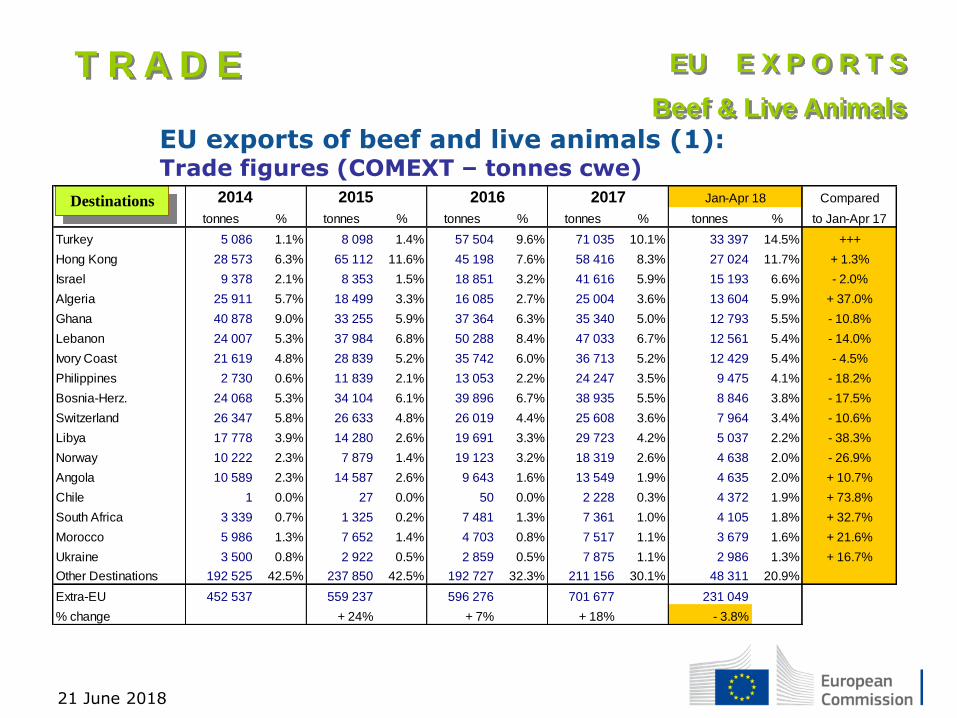
EU exports of beef and live animals (1): Trade figures (COMEXT – tonnes cwe)
21 June 2018
Destinations
T R A D E
EU E X P O R T S
Beef & Live Animals
2014 2015 Compared
tonnes % tonnes % tonnes % tonnes % tonnes % to Jan-Apr 17
Turkey 5 086 1.1% 8 098 1.4% 57 504 9.6% 71 035 10.1% 33 397 14.5% +++
Hong Kong 28 573 6.3% 65 112 11.6% 45 198 7.6% 58 416 8.3% 27 024 11.7% + 1.3%
Israel 9 378 2.1% 8 353 1.5% 18 851 3.2% 41 616 5.9% 15 193 6.6% - 2.0%
Algeria 25 911 5.7% 18 499 3.3% 16 085 2.7% 25 004 3.6% 13 604 5.9% + 37.0%
Ghana 40 878 9.0% 33 255 5.9% 37 364 6.3% 35 340 5.0% 12 793 5.5% - 10.8%
Lebanon 24 007 5.3% 37 984 6.8% 50 288 8.4% 47 033 6.7% 12 561 5.4% - 14.0%
Ivory Coast 21 619 4.8% 28 839 5.2% 35 742 6.0% 36 713 5.2% 12 429 5.4% - 4.5%
Philippines 2 730 0.6% 11 839 2.1% 13 053 2.2% 24 247 3.5% 9 475 4.1% - 18.2%
Bosnia-Herz. 24 068 5.3% 34 104 6.1% 39 896 6.7% 38 935 5.5% 8 846 3.8% - 17.5%
Switzerland 26 347 5.8% 26 633 4.8% 26 019 4.4% 25 608 3.6% 7 964 3.4% - 10.6%
Libya 17 778 3.9% 14 280 2.6% 19 691 3.3% 29 723 4.2% 5 037 2.2% - 38.3%
Norway 10 222 2.3% 7 879 1.4% 19 123 3.2% 18 319 2.6% 4 638 2.0% - 26.9%
Angola 10 589 2.3% 14 587 2.6% 9 643 1.6% 13 549 1.9% 4 635 2.0% + 10.7%
Chile 1 0.0% 27 0.0% 50 0.0% 2 228 0.3% 4 372 1.9% + 73.8%
South Africa 3 339 0.7% 1 325 0.2% 7 481 1.3% 7 361 1.0% 4 105 1.8% + 32.7%
Morocco 5 986 1.3% 7 652 1.4% 4 703 0.8% 7 517 1.1% 3 679 1.6% + 21.6%
Ukraine 3 500 0.8% 2 922 0.5% 2 859 0.5% 7 875 1.1% 2 986 1.3% + 16.7%
Other Destinations 192 525 42.5% 237 850 42.5% 192 727 32.3% 211 156 30.1% 48 311 20.9%
Extra-EU 452 537 559 237 596 276 701 677 231 049
% change + 24% + 7% + 18% - 3.8%
2016 Jan-Apr 182017
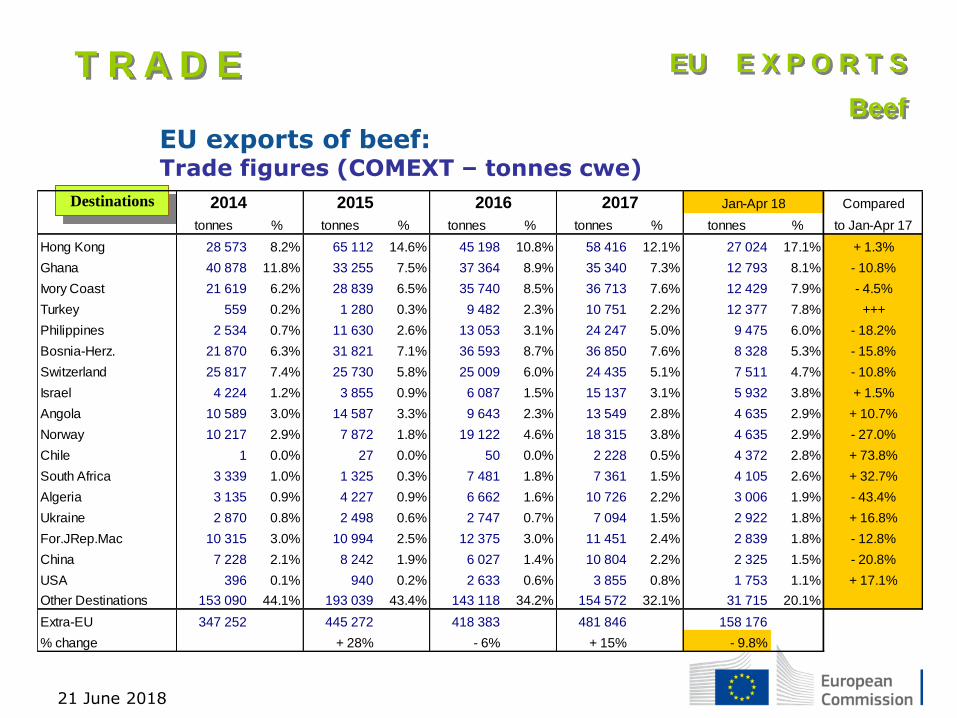
EU exports of beef: Trade figures (COMEXT – tonnes cwe)
21 June 2018
Destinations
T R A D E
EU E X P O R T S
Beef
2014 2015 Compared
tonnes % tonnes % tonnes % tonnes % tonnes % to Jan-Apr 17
Hong Kong 28 573 8.2% 65 112 14.6% 45 198 10.8% 58 416 12.1% 27 024 17.1% + 1.3%
Ghana 40 878 11.8% 33 255 7.5% 37 364 8.9% 35 340 7.3% 12 793 8.1% - 10.8%
Ivory Coast 21 619 6.2% 28 839 6.5% 35 740 8.5% 36 713 7.6% 12 429 7.9% - 4.5%
Turkey 559 0.2% 1 280 0.3% 9 482 2.3% 10 751 2.2% 12 377 7.8% +++
Philippines 2 534 0.7% 11 630 2.6% 13 053 3.1% 24 247 5.0% 9 475 6.0% - 18.2%
Bosnia-Herz. 21 870 6.3% 31 821 7.1% 36 593 8.7% 36 850 7.6% 8 328 5.3% - 15.8%
Switzerland 25 817 7.4% 25 730 5.8% 25 009 6.0% 24 435 5.1% 7 511 4.7% - 10.8%
Israel 4 224 1.2% 3 855 0.9% 6 087 1.5% 15 137 3.1% 5 932 3.8% + 1.5%
Angola 10 589 3.0% 14 587 3.3% 9 643 2.3% 13 549 2.8% 4 635 2.9% + 10.7%
Norway 10 217 2.9% 7 872 1.8% 19 122 4.6% 18 315 3.8% 4 635 2.9% - 27.0%
Chile 1 0.0% 27 0.0% 50 0.0% 2 228 0.5% 4 372 2.8% + 73.8%
South Africa 3 339 1.0% 1 325 0.3% 7 481 1.8% 7 361 1.5% 4 105 2.6% + 32.7%
Algeria 3 135 0.9% 4 227 0.9% 6 662 1.6% 10 726 2.2% 3 006 1.9% - 43.4%
Ukraine 2 870 0.8% 2 498 0.6% 2 747 0.7% 7 094 1.5% 2 922 1.8% + 16.8%
For.JRep.Mac 10 315 3.0% 10 994 2.5% 12 375 3.0% 11 451 2.4% 2 839 1.8% - 12.8%
China 7 228 2.1% 8 242 1.9% 6 027 1.4% 10 804 2.2% 2 325 1.5% - 20.8%
USA 396 0.1% 940 0.2% 2 633 0.6% 3 855 0.8% 1 753 1.1% + 17.1%
Other Destinations 153 090 44.1% 193 039 43.4% 143 118 34.2% 154 572 32.1% 31 715 20.1%
Extra-EU 347 252 445 272 418 383 481 846 158 176
% change + 28% - 6% + 15% - 9.8%
2016 Jan-Apr 182017
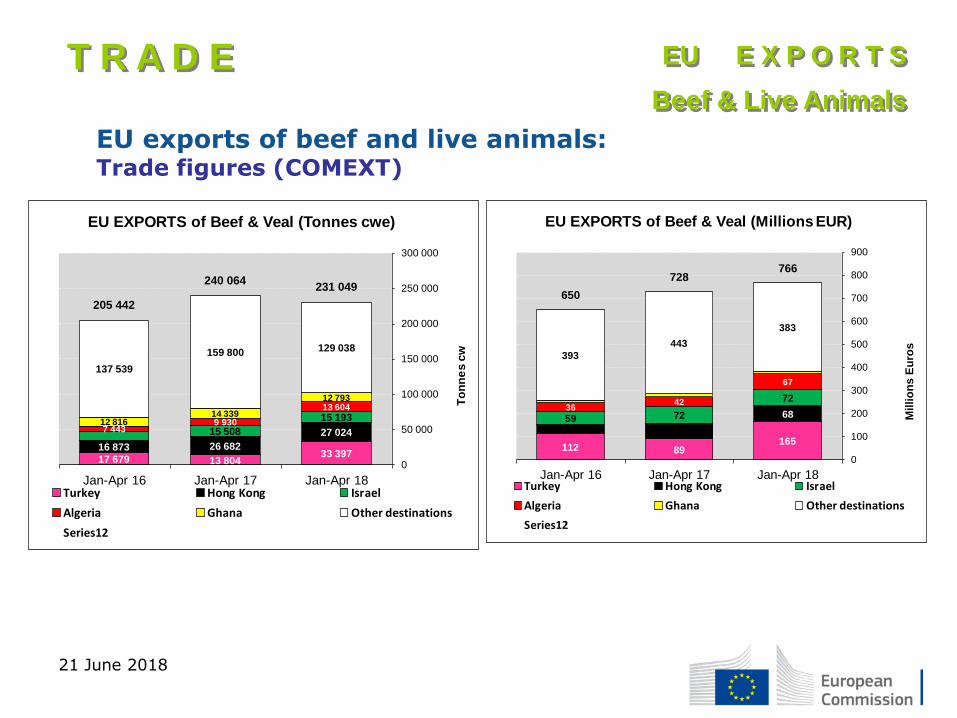
EU exports of beef and live animals: Trade figures (COMEXT)
21 June 2018
T R A D E
EU E X P O R T S
Beef & Live Animals
17 679 13 80433 397
16 873 26 682
27 02415 508
15 1937 443
9 930
13 604
12 81614 339
12 793
137 539
159 800 129 038
205 442
240 064231 049
0
50 000
100 000
150 000
200 000
250 000
300 000
Jan-Apr 16 Jan-Apr 17 Jan-Apr 18
To
nn
es
cw
EU EXPORTS of Beef & Veal (Tonnes cwe)
Turkey Hong Kong Israel
Algeria Ghana Other destinations
Series12
112 89165
6859 72
7236
42
67
393
443
383
650
728766
0
100
200
300
400
500
600
700
800
900
Jan-Apr 16 Jan-Apr 17 Jan-Apr 18
Millio
ns E
uro
s
EU EXPORTS of Beef & Veal (Millions EUR)
Turkey Hong Kong Israel
Algeria Ghana Other destinations
Series12
21 June 2018
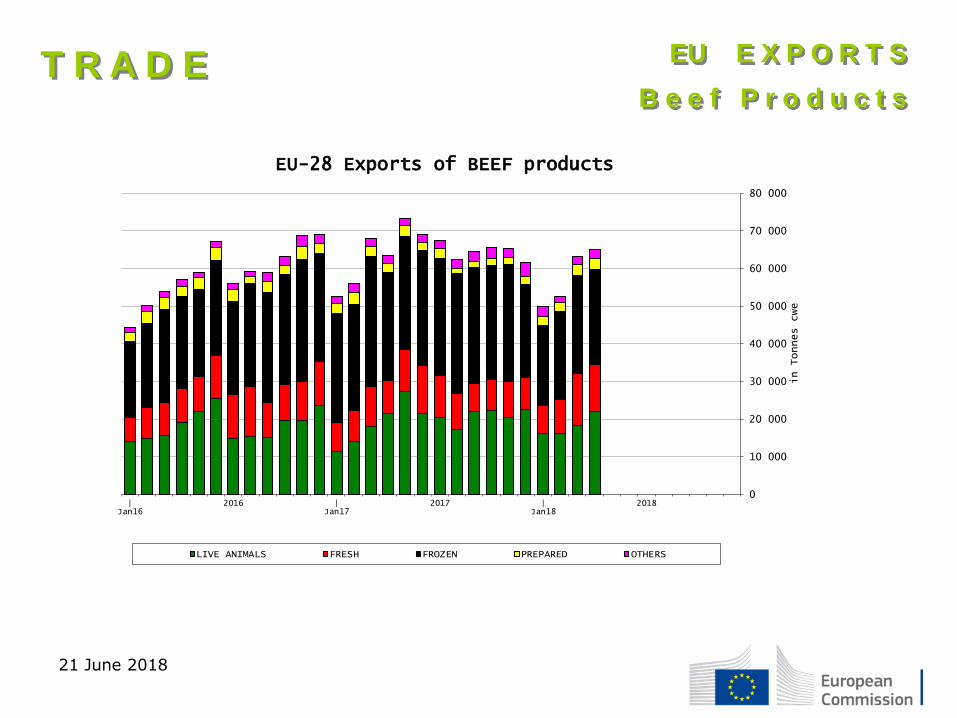
0
10 000
20 000
30 000
40 000
50 000
60 000
70 000
80 000
|Jan16
2016 |Jan17
2017 |Jan18
2018
in Tonnes cwe
EU-28 Exports of BEEF products
LIVE ANIMALS FRESH FROZEN PREPARED OTHERS
T R A D E
EU E X P O R T S
B e e f P r o d u c t s
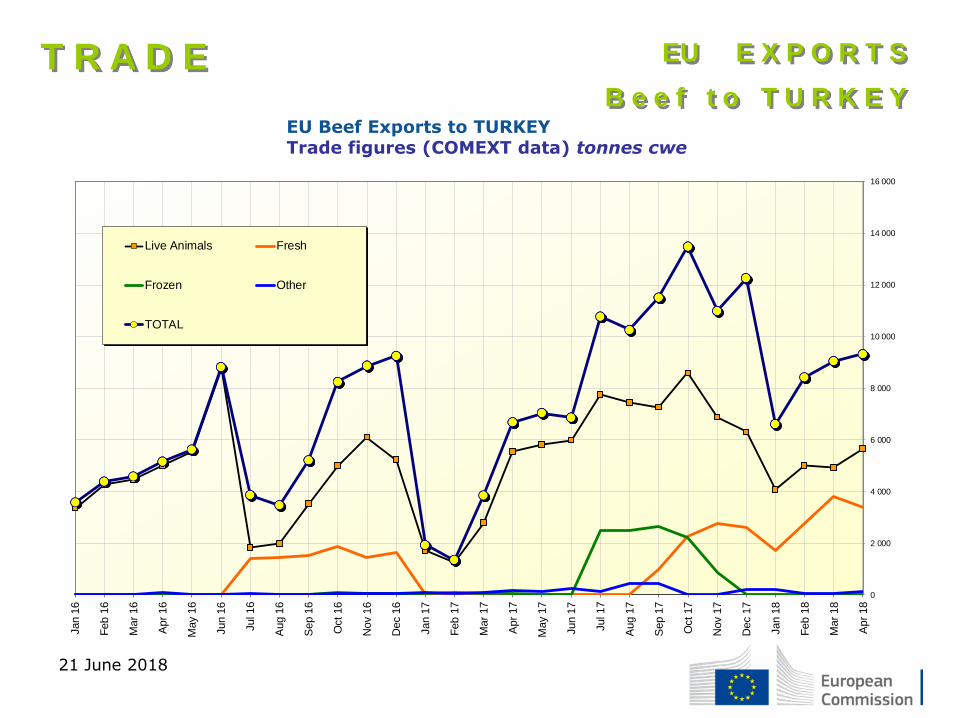
EU Beef Exports to TURKEY Trade figures (COMEXT data) tonnes cwe
21 June 2018
T R A D E
EU E X P O R T S
B e e f t o T U R K E Y
0
2 000
4 000
6 000
8 000
10 000
12 000
14 000
16 000
Jan 1
6
Feb 1
6
Mar
16
Apr
16
May
16
Jun 1
6
Jul 16
Aug 1
6
Sep 1
6
Oct 16
Nov 1
6
Dec 1
6
Jan 1
7
Feb 1
7
Mar
17
Apr
17
May
17
Jun 1
7
Jul 17
Aug 1
7
Sep 1
7
Oct 17
Nov 1
7
Dec 1
7
Jan 1
8
Feb 1
8
Mar
18
Apr
18
Live Animals Fresh
Frozen Other
TOTAL
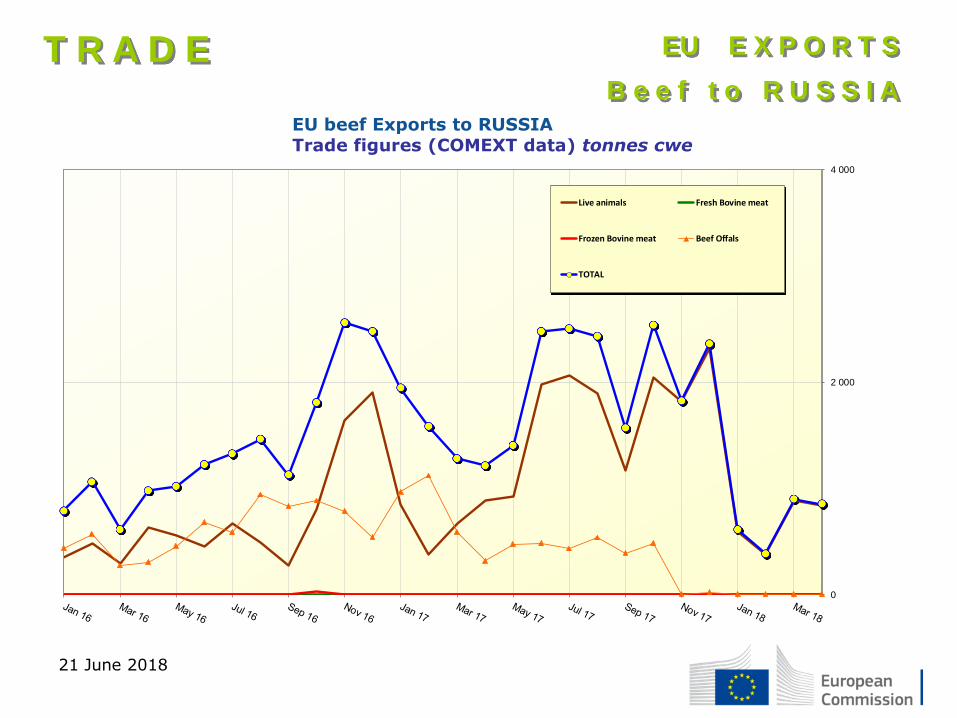
EU beef Exports to RUSSIA Trade figures (COMEXT data) tonnes cwe
T R A D E
EU E X P O R T S
B e e f t o R U S S I A
0
2 000
4 000
Live animals Fresh Bovine meat
Frozen Bovine meat Beef Offals
TOTAL
21 June 2018
T R A D E
EU E X P O R T S
L i v e A n i m a l s
4 3
38
4 6
38
3 4
25 4 3
43
4 5
02
5 05
0
5 5
91
8 7
89
1 8
28
1 9
77 3 6
58
6 2
51 7 3
16
7 5
48
1 8
41
1 2
54
3 74
8
6 6
01
7 01
4
6 8
16 8 2
58
7 7
33
7 8
68 8 9
66
7 2
16 8 3
68
4 7
36
5 4
39
5 0
48
5 79
6
990 88
6 1 9
45 89
5
1 4
34
83
4 358
388
682 38
0
957
1 4
93 1 82
5
1 3
57
481
657
2 1
79
975
809 99
1 32
5
1 7
25 3 1
78
1 4
94 4 20
1
4 56
1
.
3 7
54
.
3 6
76
.
4 4
39
.
3 9
42
.
4 6
83
.
4 7
41
.
3 0
98
.
3 6
52
.
3 9
65
.
3 6
37
.
4 55
9
.
3 4
53
.
3 54
4
.
3 6
21
.
2 65
0
.
3 7
31
.
5 9
53
.
3 5
28
.
4 3
93
.
3 5
53
.
3 4
48
.
3 6
27
.
4 2
78
.
2 62
4
.
3 6
37
.
3 51
6
.
4 2
56
.
4 97
6
.
2 3
13
.
4 3
72
.
1 6
59
.
3 3
62
. 2
164
.
2 7
49
. 3
350
.
3 0
55
. 2
83
2
.
3 3
66
.
2 75
4
.
3 15
9
.
4 6
34
. 5 6
08
.
4 7
08
.
5 5
88
.
5 6
14
.
6 4
09
.
6 0
98
.
7 5
07
.
7 5
11
.
8 0
14
.
6 89
2
.
6 1
68
.
6 1
23
.
6 0
31
.
9 63
3
. 11 4
40
.
9 8
08
.
8 8
27
.
8 6
01
.
6 8
50
.
8 6
45
.
7 9
23
.
9 4
43
.
6 20
0
.
6 8
57
.
9 72
3
.
9 7
92
.
14 2
44
.
11 3
27
.
7 0
22
.
7 4
16
.
9 6
91
.
8 4
63
.
9 5
34
.
9 2
78
.
6 6
92
.
4 6
41
.
8 5
17
.
9 39
8
.
0
.
0
.
0
.
0
.
0
.
0
.
0
.
0
5 000
10 000
15 000
20 000
25 000
30 000
Jan
15
Feb
15
Mar
15
Ap
r 15
May 1
5
Ju
n 1
5
Ju
l 15
Au
g 1
5
Sep
15
Oct
15
No
v 1
5
Dec 1
5
Jan
16
Feb
16
Mar
16
Ap
r 16
May 1
6
Ju
n 1
6
Ju
l 16
Au
g 1
6
Sep
16
Oct
16
No
v 1
6
Dec 1
6
Jan
17
Feb
17
Mar
17
Ap
r 17
May 1
7
Ju
n 1
7
Ju
l 17
Au
g 1
7
Sep
17
Oct
17
No
v 1
7
Dec 1
7
Jan
18
Feb
18
Mar
18
Ap
r 18
May 1
8
Ju
n 1
8
Ju
l 18
Au
g 1
8
Sep
18
Oct
18
No
v 1
8
Dec 1
8
To
nn
es C
WE
.
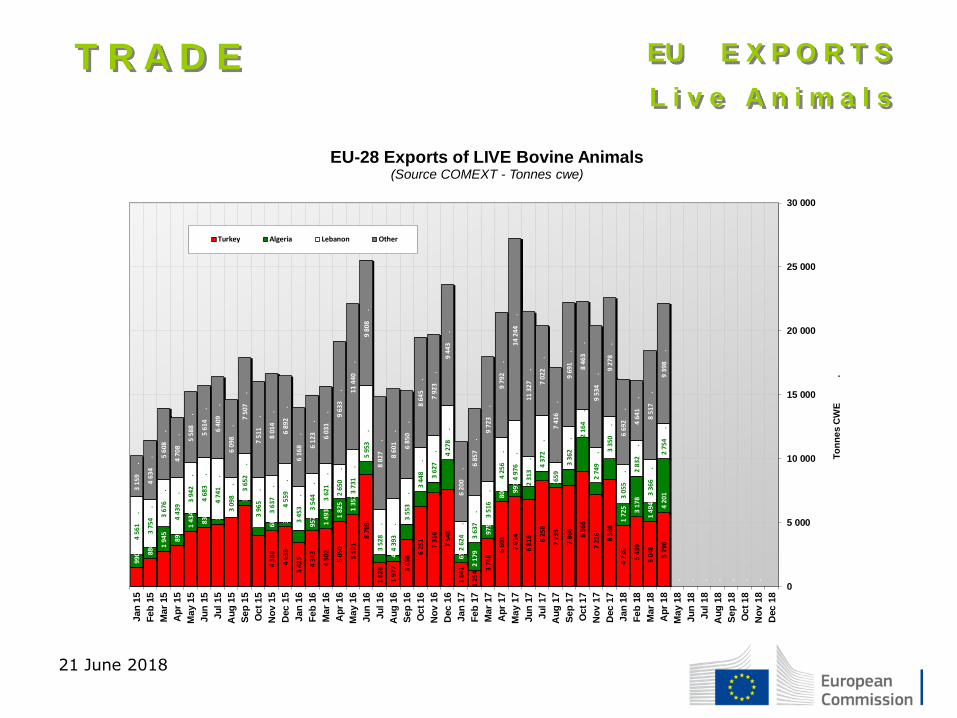
EU-28 Exports of LIVE Bovine Animals(Source COMEXT - Tonnes cwe)
Turkey Algeria Lebanon Other
21 June 2018
T R A D E
EU E X P O R T S
L i v e A n i m a l s
21 June 2018
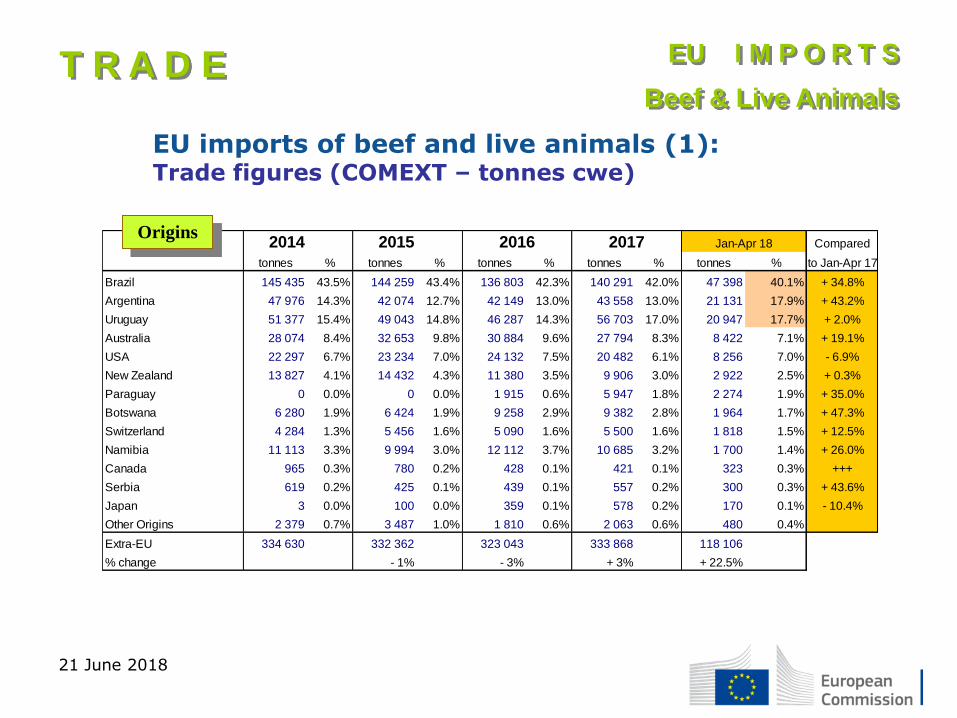
EU imports of beef and live animals (1): Trade figures (COMEXT – tonnes cwe)
21 June 2018
T R A D E
EU I M P O R T S
Beef & Live Animals
2014 2015 Compared
tonnes % tonnes % tonnes % tonnes % tonnes % to Jan-Apr 17
Brazil 145 435 43.5% 144 259 43.4% 136 803 42.3% 140 291 42.0% 47 398 40.1% + 34.8%
Argentina 47 976 14.3% 42 074 12.7% 42 149 13.0% 43 558 13.0% 21 131 17.9% + 43.2%
Uruguay 51 377 15.4% 49 043 14.8% 46 287 14.3% 56 703 17.0% 20 947 17.7% + 2.0%
Australia 28 074 8.4% 32 653 9.8% 30 884 9.6% 27 794 8.3% 8 422 7.1% + 19.1%
USA 22 297 6.7% 23 234 7.0% 24 132 7.5% 20 482 6.1% 8 256 7.0% - 6.9%
New Zealand 13 827 4.1% 14 432 4.3% 11 380 3.5% 9 906 3.0% 2 922 2.5% + 0.3%
Paraguay 0 0.0% 0 0.0% 1 915 0.6% 5 947 1.8% 2 274 1.9% + 35.0%
Botswana 6 280 1.9% 6 424 1.9% 9 258 2.9% 9 382 2.8% 1 964 1.7% + 47.3%
Switzerland 4 284 1.3% 5 456 1.6% 5 090 1.6% 5 500 1.6% 1 818 1.5% + 12.5%
Namibia 11 113 3.3% 9 994 3.0% 12 112 3.7% 10 685 3.2% 1 700 1.4% + 26.0%
Canada 965 0.3% 780 0.2% 428 0.1% 421 0.1% 323 0.3% +++
Serbia 619 0.2% 425 0.1% 439 0.1% 557 0.2% 300 0.3% + 43.6%
Japan 3 0.0% 100 0.0% 359 0.1% 578 0.2% 170 0.1% - 10.4%
Other Origins 2 379 0.7% 3 487 1.0% 1 810 0.6% 2 063 0.6% 480 0.4%
Extra-EU 334 630 332 362 323 043 333 868 118 106
% change - 1% - 3% + 3% + 22.5%
2016 Jan-Apr 182017Origins
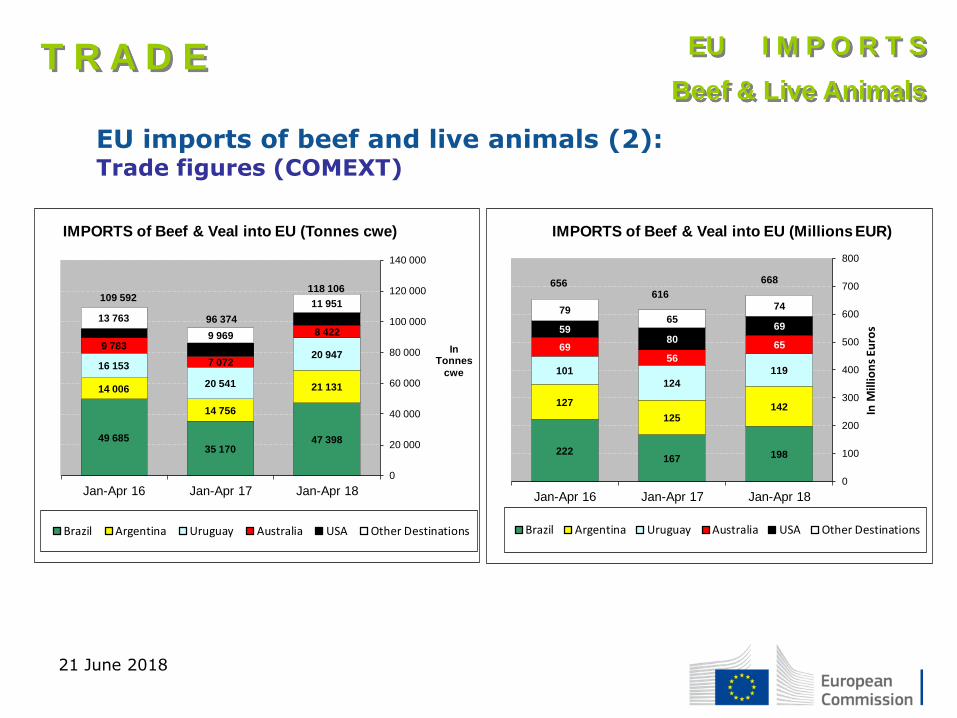
EU imports of beef and live animals (2): Trade figures (COMEXT)
21 June 2018
T R A D E
EU I M P O R T S
Beef & Live Animals
49 68535 170
47 398
14 006
14 756
21 131
16 153
20 541
20 9479 783
7 072
8 422
13 763
9 969
11 951109 592
96 374
118 106
0
20 000
40 000
60 000
80 000
100 000
120 000
140 000
Jan-Apr 16 Jan-Apr 17 Jan-Apr 18
InTonnes
cwe
IMPORTS of Beef & Veal into EU (Tonnes cwe)
Brazil Argentina Uruguay Australia USA Other Destinations
222167 198
127
125142
101
124
119
6956
65
5980
69
7965
74
656616
668
0
100
200
300
400
500
600
700
800
Jan-Apr 16 Jan-Apr 17 Jan-Apr 18
In M
illio
ns
Eu
ros
IMPORTS of Beef & Veal into EU (Millions EUR)
Brazil Argentina Uruguay Australia USA Other Destinations
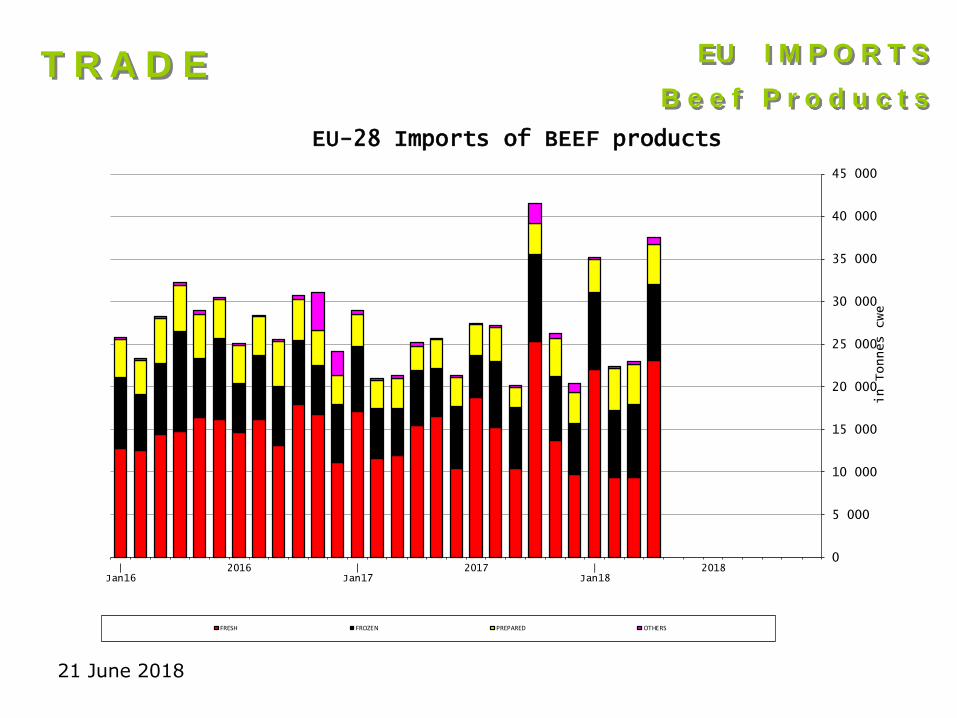
T R A D E
EU I M P O R T S
B e e f P r o d u c t s
0
5 000
10 000
15 000
20 000
25 000
30 000
35 000
40 000
45 000
|Jan16
2016 |Jan17
2017 |Jan18
2018
in Tonnes cwe
EU-28 Imports of BEEF products
FRESH FROZEN PREPARED OTHERS
21 June 2018
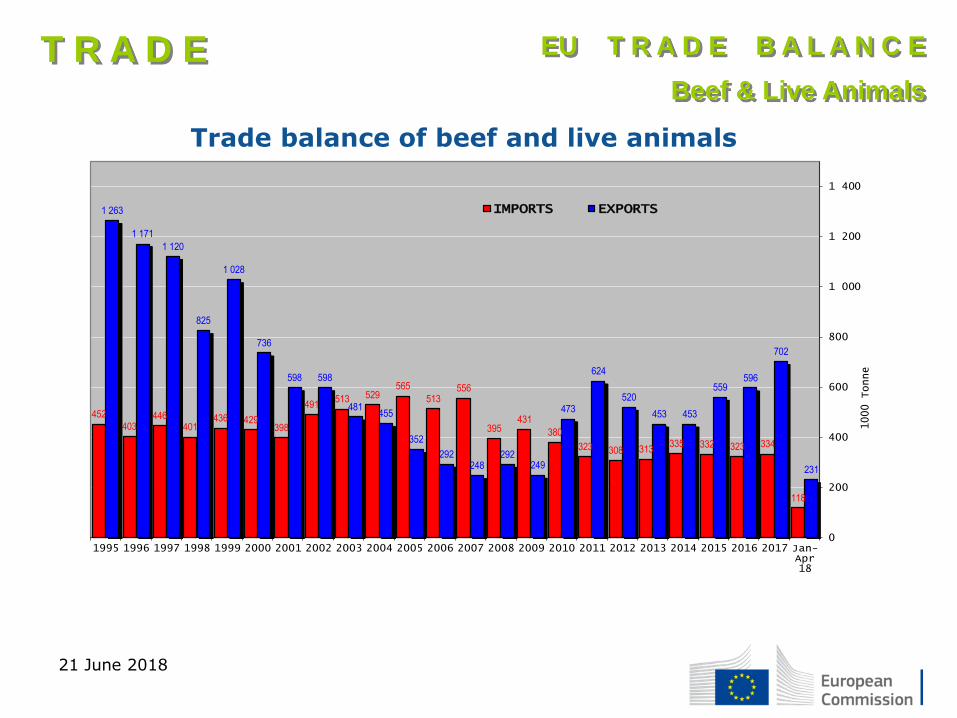
452
403446
401436 429
398
491513 529
565
513556
395431
380
323 308 313335 332 323 334
118
1 263
1 171
1 120
825
1 028
736
598 598
481455
352
292248
292249
473
624
520
453 453
559596
702
231
0
200
400
600
800
1 000
1 200
1 400
1995 1996 1997 1998 1999 2000 2001 2002 2003 2004 2005 2006 2007 2008 2009 2010 2011 2012 2013 2014 2015 2016 2017 Jan-Apr18
1000 Tonne
IMPORTS EXPORTS
Trade balance of beef and live animals
21 June 2018
T R A D E
EU T R A D E B A L A N C E
Beef & Live Animals
21 June 2018
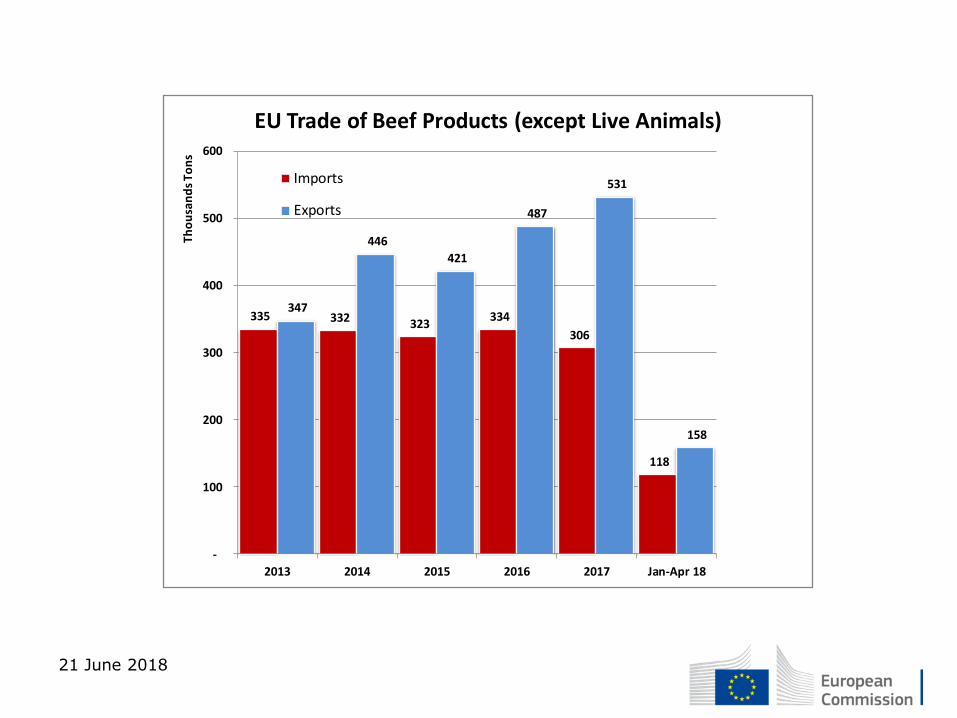
335 332 323 334
306
118
347
446
421
487
531
158
-
100
200
300
400
500
600
2013 2014 2015 2016 2017 Jan-Apr 18
Th
ou
san
ds
To
ns
EU Trade of Beef Products (except Live Animals)
Imports
Exports
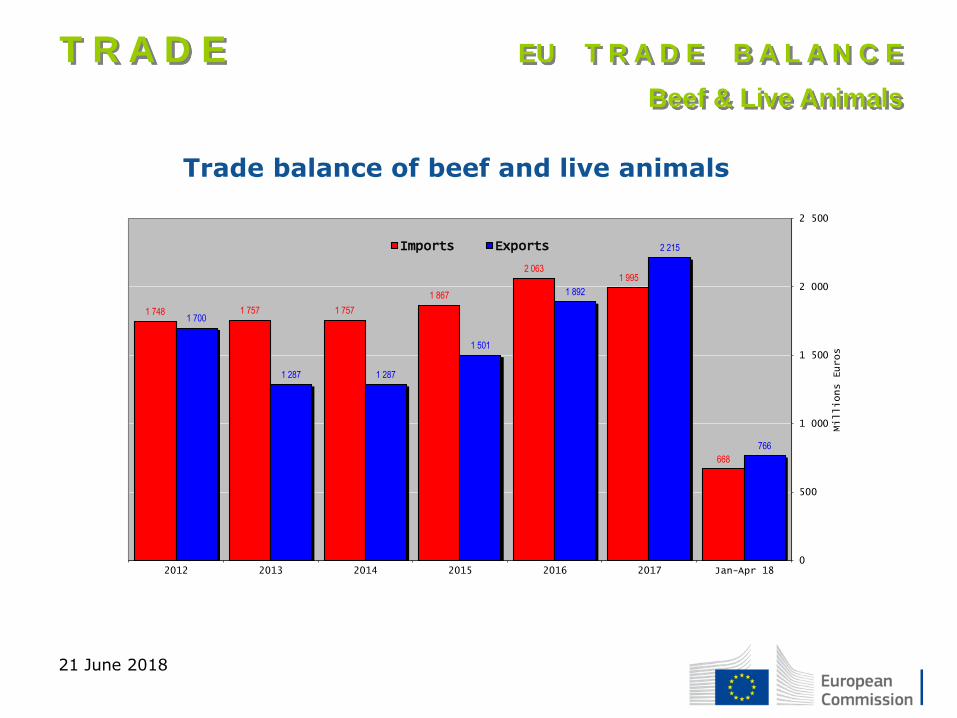
Trade balance of beef and live animals
21 June 2018
T R A D E
EU T R A D E B A L A N C E
Beef & Live Animals
1 748 1 757 1 757
1 867
2 0631 995
668
1 700
1 287 1 287
1 501
1 892
2 215
766
0
500
1 000
1 500
2 000
2 500
2012 2013 2014 2015 2016 2017 Jan-Apr 18
Millions Euros
Imports Exports
21 June 2018
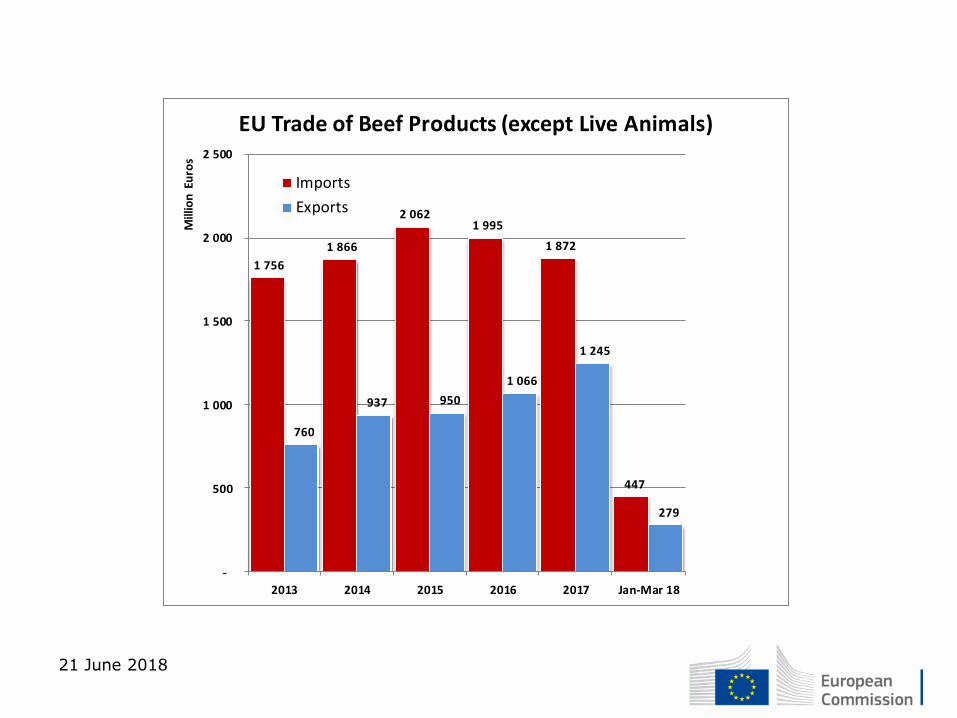
1 756
1 866
2 062 1 995
1 872
447
760
937 950
1 066
1 245
279
-
500
1 000
1 500
2 000
2 500
2013 2014 2015 2016 2017 Jan-Mar 18
Mill
ion
Eu
ros
EU Trade of Beef Products (except Live Animals)
Imports
Exports
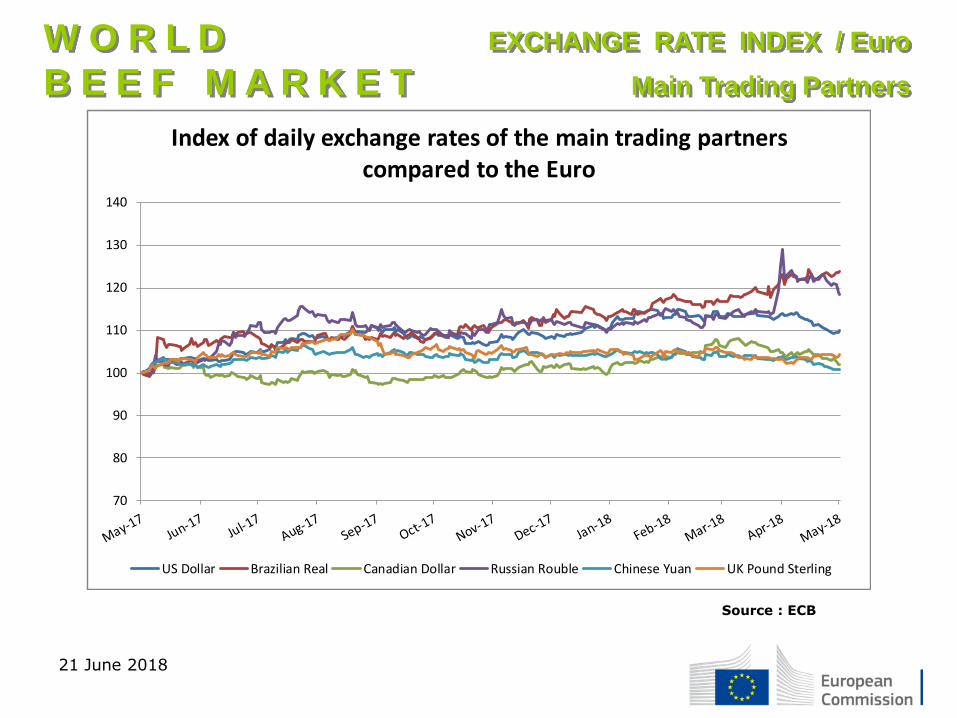
W O R L D
B E E F M A R K E T
EXCHANGE RATE INDEX / Euro
Main Trading Partners
21 June 2018
Source : ECB
70
80
90
100
110
120
130
140
Index of daily exchange rates of the main trading partners compared to the Euro
US Dollar Brazilian Real Canadian Dollar Russian Rouble Chinese Yuan UK Pound Sterling
W O R L D
B E E F M A R K E T
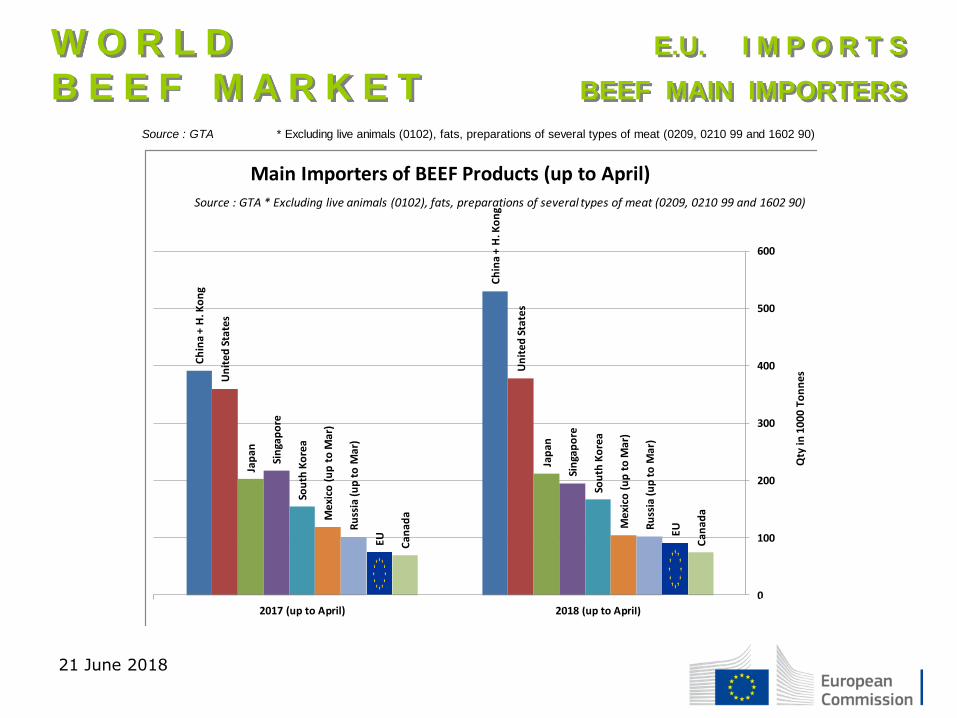
E.U. I M P O R T S
BEEF MAIN IMPORTERS
Source : GTA * Excluding live animals (0102), fats, preparations of several types of meat (0209, 0210 99 and 1602 90)
Ch
ina
+ H
. Ko
ng
Ch
ina
+ H
. Ko
ng
Un
ite
d S
tate
s
Un
ite
d S
tate
s
Jap
an
Jap
an
Sin
gap
ore
Sin
gap
ore
Sou
th K
ore
a
Sou
th K
ore
a
Me
xico
(u
p t
o M
ar)
Me
xico
(u
p t
o M
ar)
Ru
ssia
(up
to
Mar
)
Ru
ssia
(u
p t
o M
ar)
EU
EU
Can
ada
Ca
na
da
0
100
200
300
400
500
600
2017 (up to April) 2018 (up to April)
Qty
in 1
000
Ton
nes
Main Importers of BEEF Products (up to April)
No 2103 figures available for : Mexico, Taiwan, Chile, ...
Source : GTA * Excluding live animals (0102), fats, preparations of several types of meat (0209, 0210 99 and 1602 90)
21 June 2018
W O R L D
B E E F M A R K E T
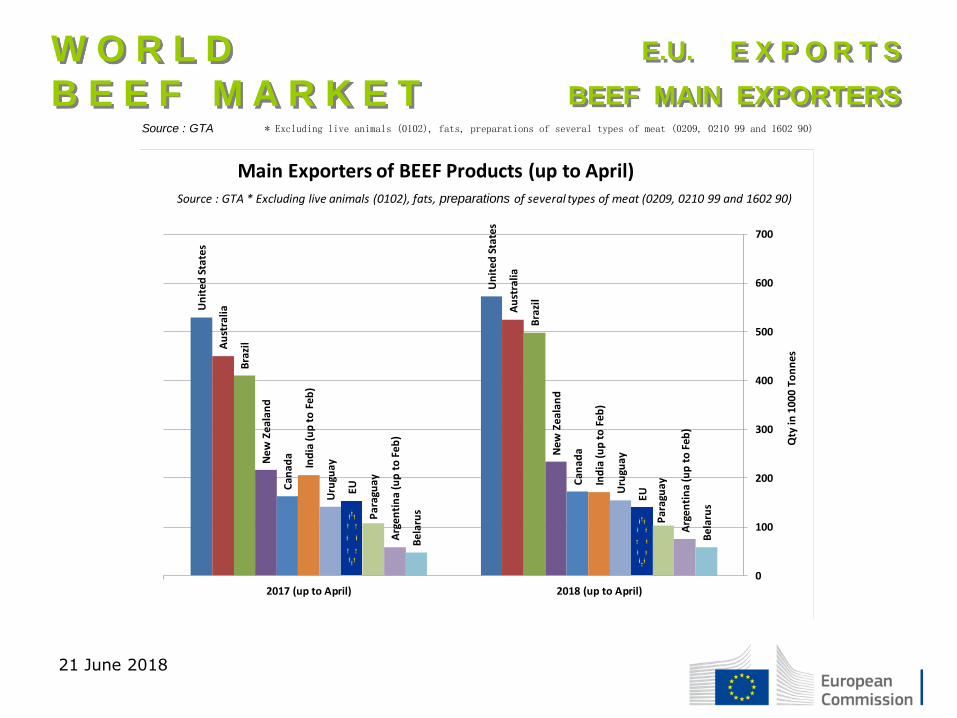
E.U. E X P O R T S
BEEF MAIN EXPORTERS Source : GTA * Excluding live animals (0102), fats, preparations of several types of meat (0209, 0210 99 and 1602 90)
Un
ite
d S
tate
s
Un
ite
d S
tate
s
Au
stra
lia
Au
stra
lia
Bra
zil
Bra
zil
Ne
w Z
eal
and
New
Zea
lan
d
Can
ada
Can
ada
Ind
ia (u
p t
o F
eb)
Ind
ia (u
p t
o F
eb)
Uru
guay
Uru
guay
EU
EU
Par
agu
ay
Par
agu
ay
Arg
en
tin
a (u
p t
o F
eb
)
Arg
enti
na
(up
to
Feb
)
Bel
aru
s
Bel
aru
s
0
100
200
300
400
500
600
700
2017 (up to April) 2018 (up to April)
Qty
in 1
000
Ton
nes
Main Exporters of BEEF Products (up to April)Source : GTA * Excluding live animals (0102), fats, preparations of several types of meat (0209, 0210 99 and 1602 90)
21 June 2018
W O R L D
B E E F M A R K E T
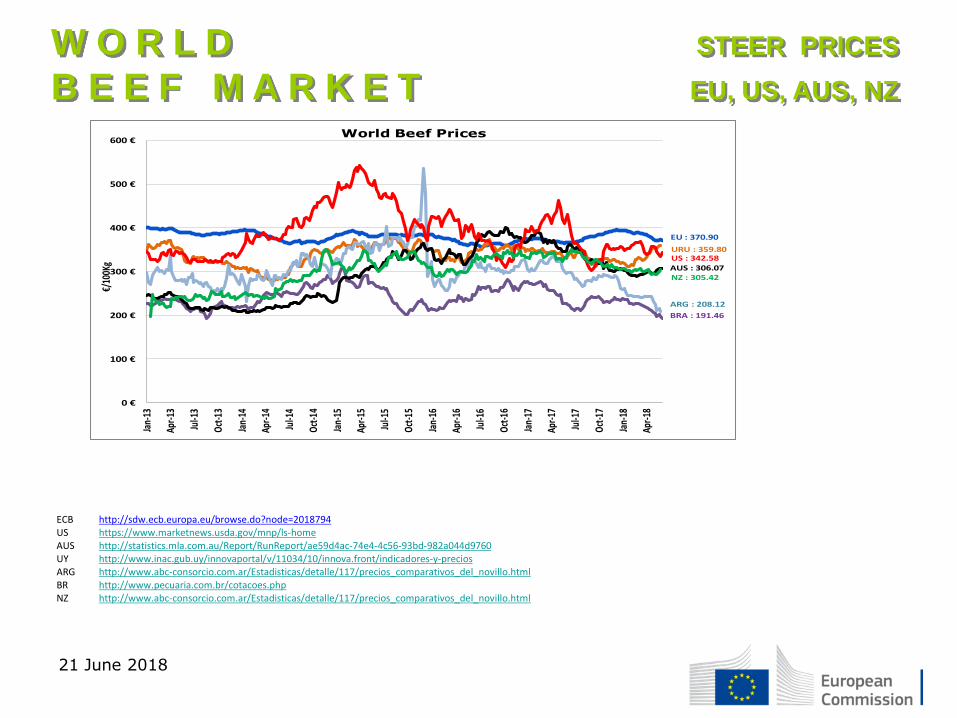
STEER PRICES
EU, US, AUS, NZ
21 June 2018
ECB http://sdw.ecb.europa.eu/browse.do?node=2018794 US https://www.marketnews.usda.gov/mnp/ls-home AUS http://statistics.mla.com.au/Report/RunReport/ae59d4ac-74e4-4c56-93bd-982a044d9760 UY http://www.inac.gub.uy/innovaportal/v/11034/10/innova.front/indicadores-y-precios ARG http://www.abc-consorcio.com.ar/Estadisticas/detalle/117/precios_comparativos_del_novillo.html BR http://www.pecuaria.com.br/cotacoes.php NZ http://www.abc-consorcio.com.ar/Estadisticas/detalle/117/precios_comparativos_del_novillo.html
0 €
100 €
200 €
300 €
400 €
500 €
600 €Ja
n-13
Apr-
13
Jul-1
3
Oct
-13
Jan-
14
Apr-
14
Jul-1
4
Oct
-14
Jan-
15
Apr-
15
Jul-1
5
Oct
-15
Jan-
16
Apr-
16
Jul-1
6
Oct
-16
Jan-
17
Apr-
17
Jul-1
7
Oct
-17
Jan-
18
Apr-
18
€/10
0Kg
World Beef Prices
EU : 370.90
BRA : 191.46
URU : 359.80
ARG : 208.12
AUS : 306.07US : 342.58
NZ : 305.42

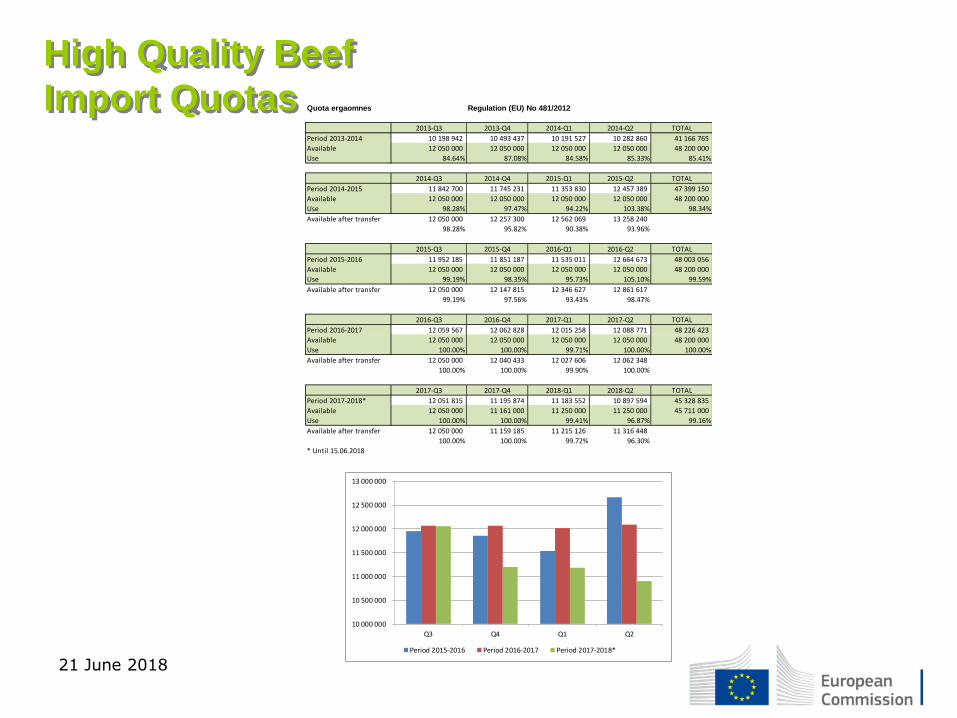
High Quality Beef
Import Quotas
21 June 2018
Quantity allocated 2014/2015 2015/2016 2016/2017 2017/2018*
(Tons) Use Use Use Use
09.4001 Australia 2 250 09.4004 Argentina 200 9.46 4.73% 12.21 6.11% 12.75 6.38% 10.99 5.50%09.4450 Argentina 29 500 22 867.03 77.52% 22 350.61 75.76% 23 111.89 78.35% 23 662.76 80.21%
09.4451 Australia 7 150 6 815.93 95.33% 6 749.85 94.40% 4 051.04 56.66% 4 723.77 66.07%09.4452 Uruguay 6 376 6 280.98 98.51% 6 249.09 98.01% 6 365.55 99.84% 5 788.07 90.78%09.4453 Brazil 10 000 7 989.89 79.90% 9 289.17 92.89% 8 572.40 85.72% 4 804.92 48.05%09.4454 New Zealand 1 300 1 299.45 99.96% 1 299.95 100.00% 1 161.63 89.36% 989.06 76.08%09.4002 Canada/US 11 500 353.46 3.07% 292.16 2.54% 421.40 3.66% 2 333.67 20.29%
09.4455 Paraguay 1 000 12.13 1.21% 915.63 91.56% 982.60 98.26% 920.13 92.01%
Total Beef 66 826 45 618.87 68.27% 47 146.46 70.55% 44 666.51 66.84% 43 222.38 64.68%Total Buffalo 2 450 9.46 0.39% 12.21 0.50% 12.75 0.52% 10.99 0.45%
Total 69 276 45 628.33 65.86% 47 158.67 68.07% 44 679.26 64.49% 43 233.36 62.41%
* up to 30/04/2018
High Quality Beef
Import Quotas
21 June 2018
Quota ergaomnes Regulation (EU) No 481/2012
2013-Q3 2013-Q4 2014-Q1 2014-Q2 TOTAL
Period 2013-2014 10 198 942 10 493 437 10 191 527 10 282 860 41 166 765
Available 12 050 000 12 050 000 12 050 000 12 050 000 48 200 000
Use 84.64% 87.08% 84.58% 85.33% 85.41%
2014-Q3 2014-Q4 2015-Q1 2015-Q2 TOTAL
Period 2014-2015 11 842 700 11 745 231 11 353 830 12 457 389 47 399 150
Available 12 050 000 12 050 000 12 050 000 12 050 000 48 200 000
Use 98.28% 97.47% 94.22% 103.38% 98.34%
Available after transfer 12 050 000 12 257 300 12 562 069 13 258 240
98.28% 95.82% 90.38% 93.96%
2015-Q3 2015-Q4 2016-Q1 2016-Q2 TOTAL
Period 2015-2016 11 952 185 11 851 187 11 535 011 12 664 673 48 003 056
Available 12 050 000 12 050 000 12 050 000 12 050 000 48 200 000
Use 99.19% 98.35% 95.73% 105.10% 99.59%
Available after transfer 12 050 000 12 147 815 12 346 627 12 861 617
99.19% 97.56% 93.43% 98.47%
2016-Q3 2016-Q4 2017-Q1 2017-Q2 TOTAL
Period 2016-2017 12 059 567 12 062 828 12 015 258 12 088 771 48 226 423
Available 12 050 000 12 050 000 12 050 000 12 050 000 48 200 000
Use 100.00% 100.00% 99.71% 100.00% 100.00%
Available after transfer 12 050 000 12 040 433 12 027 606 12 062 348
100.00% 100.00% 99.90% 100.00%
2017-Q3 2017-Q4 2018-Q1 2018-Q2 TOTAL
Period 2017-2018* 12 051 815 11 195 874 11 183 552 10 897 594 45 328 835
Available 12 050 000 11 161 000 11 250 000 11 250 000 45 711 000
Use 100.00% 100.00% 99.41% 96.87% 99.16%
Available after transfer 12 050 000 11 159 185 11 215 126 11 316 448
100.00% 100.00% 99.72% 96.30%
* Until 15.06.2018
10 000 000
10 500 000
11 000 000
11 500 000
12 000 000
12 500 000
13 000 000
Q3 Q4 Q1 Q2
Period 2015-2016 Period 2016-2017 Period 2017-2018*
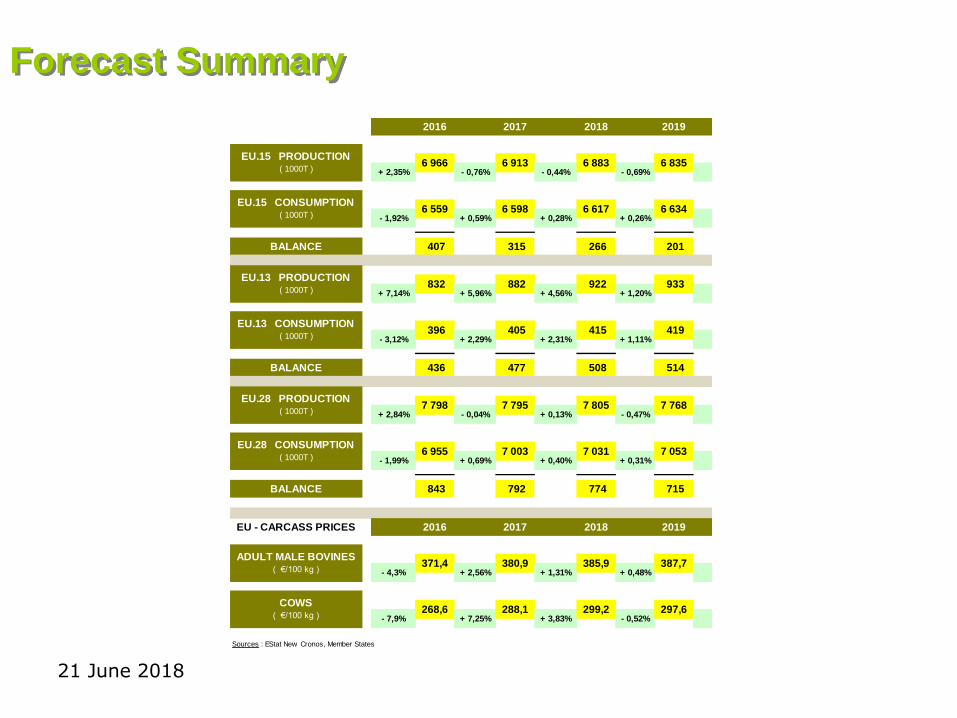
Forecast Summary
21 June 2018
2016 2017 2018 2019
BALANCE 407 315 266 201
BALANCE 436 477 508 514
BALANCE 843 792 774 715
EU - CARCASS PRICES 2016 2017 2018 2019
Sources : EStat New Cronos, Member States
( 1000T )
EU.15 PRODUCTION
( 1000T )
EU.15 CONSUMPTION
( €/100 kg )
EU.13 PRODUCTION
6 559
+ 2,56%371,4
+ 0,48%
- 0,52%
387,7
297,6
6 835- 0,69%
+ 0,26%
6 913
922 933
288,1
380,9
6 598+ 0,59%- 1,92%
6 883- 0,44%- 0,76%
6 966
6 634
832 882
268,6+ 7,25%( €/100 kg )
ADULT MALE BOVINES
COWS
6 617
385,9
299,2
+ 0,28%
+ 1,31%
+ 3,83%- 7,9%
- 4,3%
+ 2,35%
( 1000T ) + 7,14% + 5,96% + 4,56% + 1,20%
EU.13 CONSUMPTION 396 405 415 419
( 1000T ) - 3,12% + 2,29% + 2,31% + 1,11%
EU.28 PRODUCTION7 798 7 795 7 805 7 768
( 1000T ) + 2,84% - 0,04% + 0,13% - 0,47%
EU.28 CONSUMPTION6 955 7 003 7 031 7 053
( 1000T ) - 1,99% + 0,69% + 0,40% + 0,31%