Becoming bigger, better, smarter: A summary of the ...
114
Becoming bigger, better, smarter: A summary of the evaluability of Green Climate Fund proposals Nathan Fiala, Jyotsna Puri, Peter Mwandri IEU Working Paper No. 1, 2019
Transcript of Becoming bigger, better, smarter: A summary of the ...

Becoming bigger, better, smarter: A summary of the evaluability of Green
Climate Fund proposals
Nathan Fiala, Jyotsna Puri, Peter Mwandri
IEU Working Paper No. 1, 2019


i
Becoming bigger, better, smarter: A summary of the evaluability of Green Climate
Fund proposals
Nathan Fiala, Jyotsna Puri, Peter Mwandri
March 2019

ii
© 2019 Green Climate Fund Independent Evaluation Unit 175, Art center-daero Yeonsu-gu, Incheon 22004 Republic of Korea Tel. (+82) 032-458-6428 Email : [email protected] https://ieu.greenclimate.fund All rights reserved. This paper is a product of the Independent Evaluation Unit at the Green Climate Fund (IEU/GCF). It is part of a larger effort to provide open access to its research and work and to make a contribution to climate change discussions around the world. While the IEU has undertaken every effort to ensure the data in this report is accurate, it is the reader’s responsibility to determine if any and all information provided by the IEU is correct and verified. Neither the author(s) of this document nor anyone connected with the IEU or the GCF can be held responsible for how the information herein is used. Rights and Permissions The material in this work is copyrighted. Copying or transmitting portions all or part of this report without permission may be a violation of applicable law. The IEU encourages dissemination of its work and will normally grant permission promptly. Please send requests to [email protected]. Citation The suggested citation for this paper is: Fiala, N., Puri, J., Mwandri, P. (2019). Becoming bigger, better, smarter: A summary of the evaluability of Green Climate Fund proposals. IEU Working Paper No. 1, Green Climate Fund. Songdo, South Korea A FREE PUBLICATION

iii
About the IEU The IEU was established by the GCF Board as an independent unit, to provide objective assessments of the results of the Fund, including its funded activities, its effectiveness, and its efficiency. The IEU fulfils this mandate through four main activities: Evaluation: Undertakes independent evaluations at different levels to inform GCF’s strategic result areas and ensure its accountability. Learning and communication: Ensures high-quality evidence and recommendations from independent evaluations are synthesised and incorporated into GCF’s functioning and processes. Advisory and capacity support: Advises the GCF Board and its stakeholders of lessons learned from evaluations and high-quality evaluative evidence, and provides guidance and capacity support to implementing entities of the GCF and their evaluation offices. Engagement: Engages with independent evaluation offices of accredited entities and other GCF stakeholders. About IEU Working Papers The IEU’s Working Paper series is part of a larger effort to provide open access to the IEU’s work and to contribute to global discussion on climate change. The series disseminates the findings of work in progress and encourages an exchange of ideas about climate change. Their intention is to promote discussion. The findings, interpretations and conclusions are entirely those of the authors. They do not necessarily reflect the views of the IEU, the GCF or its affiliated organizations or of the governments associated with it. About this Working Paper This paper presents the results of an assessment of the GCF portfolio, focusing on the ability of projects to deliver a cost-effective impact on climate adaptation and mitigation. About the authors Nathan Fiala is an Assistant Professor at the University of Connecticut, honorary senior lecturer at Makerere University in Uganda, and a research fellow at RWI-Leibniz Institute for Economic Research in Essen, Germany. His research focuses on the enviornment and economic growth and he has conducted impact evaluations in several sub-Saharan Africa and Asian countries. His work has been published in several top academic journals.
Jyotsna Puri is the Head of the Independent Evaluation Unit (IEU) at the Green Climate Fund. She is also Associate Visiting Professor at Columbia University.
Peter Mwandri is an Evaluation Associate at the IEU.

iv

v
CONTENTS Acknowledgements ............................................................................................................................ vii Abstract ............................................................................................................................................. viii Abbreviations ...................................................................................................................................... ix
I. Introduction ................................................................................................................................... 1
II. Summary of the 93 funding proposals submitted to the GCF ....................................................... 2
III. Methods overview ......................................................................................................................... 5
A. Theory of change and discussion of causal pathways ........................................................... 7
B. Potential for measurement of causal change and evaluability ............................................... 8
C. Implementation fidelity and performance against investment criteria ................................ 10
D. Data collection and reporting credibility ............................................................................. 11
IV. Key findings ................................................................................................................................ 12
A. Theory of change and articulation of causal pathways ........................................................ 12
B. Potential for measurement of causal change and evaluability ............................................. 13
C. Implementation and performance against investment criteria ............................................. 17
D. Data collection and reporting requirements......................................................................... 18
V. Discussion .................................................................................................................................... 20
A. Theory of change ................................................................................................................. 21
B. Causality and attributable measurable impact ..................................................................... 21
C. Targeting ............................................................................................................................. 22
D. Investment criteria: effectiveness, relevance, efficiency, sustainability and impact ........... 22
E. Other concerns about reporting on investment criteria ....................................................... 24
F. Monitoring and evaluation systems ..................................................................................... 25
VI. Standards for best-practice monitoring ........................................................................................ 26
VII. Next steps ................................................................................................................................... 27
References .......................................................................................................................................... 28
ANNEX .............................................................................................................................................. 29
TABLES Table 1: Distribution of funded projects by size and category, January 2019 ................................. 2
Table 2: Reported number of beneficiaries of GCF investments as listed in GCF-funded projects, by region, January 2019 ..................................................................................................... 4
Table 3: Reported tons of carbon dioxide equivalents expected to be mitigated in 93 GCF-funded projects, January 2019 ....................................................................................................... 5
Table 4: Summary statistics of the budget for M&E, January 2019 .............................................. 25
Table 5: M&E budget by type of project, January 2019 ................................................................ 25
Table 6: Comparison between GCF investment with total amount of the projects, January 2019 32
Table 7: Affected land in hectares by region, January 2019 .......................................................... 34
Table 8: Description of approved funding proposals by priority countries, January 2019 ............ 36
Table 9: Description of implementation length category, January 2019 ....................................... 37

vi
Table 10: Description of beneficiaries and expected tCO2e to be reduced by country classification, January 2019 .................................................................................................................... 38
Table 11: Description of adaptation and cross-cutting projects, January 2019 ................................ 38
Table 12: Total investment and GCF committed amount for adaptation and cross-cutting projects, January 2019 .................................................................................................................... 38
Table 13: Comparing stoplight results across focus areas, January 2019 ........................................ 39
Table 14: Comparing stoplight results across accredited entity types, January 2019 ...................... 42
Table 15: Stoplight summary, January 2019 .................................................................................... 46
Table 16: Detailed table showing proposal-by-proposal assessment and reasons for assessment, January 2019 .................................................................................................................... 48
Table 17: Individual stoplight results, January 2019 ....................................................................... 86
FIGURES Figure 1: GCF-approved funding proposals by region, January 2019 .............................................. 3
Figure 2: GCF project and programme cycle .................................................................................... 5
Figure 3: Stoplight assessment of theory of change, January 2019 ................................................. 13
Figure 4: Stoplight assessment of evaluation potential, January 2019 ............................................ 15
Figure 5: Stoplight assessment of implementation and investment criteria, January 2019 ............. 18
Figure 6: Stoplight assessment of data and reporting, January 2019 .............................................. 20
Figure 7: Funding proposals from accredited entities, January 2019 .............................................. 29
Figure 8: Result areas for GCF-funded projects, January 2019 ...................................................... 30
Figure 9: Result areas for adaptation projects by region, January 2019 .......................................... 30
Figure 10: Result areas for mitigation projects by region, January 2019 .......................................... 31
Figure 11: Focus of the 93 GCF-funded projects, January 2019 ....................................................... 31
Figure 12: Comparison between GCF investment with Co-financing, January 2019 ....................... 32
Figure 13: Distribution of total investment by GCF focus areas, January 2019 ............................... 33
Figure 14: Beneficiaries of funded projects across GCF regions, January 2019............................... 34
Figure 15: Cumulative number of approved funding proposals, January 2019 ................................ 35
Figure 16: Approved funding proposals by size category, January 2019.......................................... 35
Figure 17: Number of funded projects size and focus, January 2019 ............................................... 36
Figure 18: Distribution of GCF investment by priority countries, January 2019 .............................. 37
Figure 19: Implementation length for adaptation and cross-cutting projects, January 2019 ............. 39
Figure 20: Stoplight summary, January 2019 .................................................................................... 92
Figure 21: Components of a results chain and examples .................................................................. 97

vii
ACKNOWLEDGEMENTS We would like to thank Sam Manning and Charlotte Taylor for their excellent research assistance. This paper also benefited from comments from many seminar participants at the European Evaluation Association meetings held in Thessaloniki, Greece as well as comments from staff and consultants at the Green Climate Fund, Songdo, South Korea. The authors are responsible for all errors.
viii
ABSTRACT The goal of the GCF is to support a paradigm shift towards low-carbon, high-resilience pathways. It is thus important to understand if such a paradigm shift is occurring, and, if so, to measure the extent to which the GCF has contributed to this overall result. We review 93 proposals funded by the GCF and assess their ability to credibly report their impacts, efficiency and effectiveness, in an evidence-based and robust way. There are two main aims of the study: The first is to assess the quality of the proposals for the funded projects that the GCF has approved and is supporting currently so that subsequent project managers are able to produce stronger proposals that have a higher likelihood of success and in measuring results. The second is to inform the GCF investment criteria and to introduce evidence-based learning opportunities into GCF projects and processes, to inform the implementation and overall impact of GCF resources. Using a stoplight indicator across multiple categories, we are able to quantify the ability of the GCF portfolios to meet these goals. We find that 80% of proposals do not have well defined theories of change, with half of all proposals not identifying possible unintended consequences of their programs. We also find that almost half of all proposals have the potential to identify and measure causal change, but only one-fourth of the proposals include a discussion about economic analyses that they will carry out. Although there is potential for these measurements to occur, 68% of the proposals either do not discuss methods for measuring causal change or are unclear. Additionally, we find that while 80% of funding proposals include monitoring and evaluation “reports”, they would not be able to cover the cost of high-quality evaluations with half having no plans for baseline data collection on key variables. Almost 94% of all funding proposals do not show any awareness that (significant) bias may (will) creep in when they are measuring or claiming impacts. One-fifth of the proposals had limitations in how investment criteria were informed and/or the information level was insufficient to inform them credibly. We find that only 15% of the proposals would allow for credible measurement of progress on investment criteria. Finally, just 13% of proposals provided impact indicators deemed capable of measuring the magnitude of causal change, with only 10% of proposals including a plan for collecting data of sufficient quality for a causal evaluation. We conclude with some recommendations for project planners.

ix
ABBREVIATIONS BAU Business as usual
EbA Ecosystem-based adaptation
EBRD European Bank for Reconstruction and Development
EE Energy efficiency
FP Funding proposal
GCF Green Climate Fund
GHG Greenhouse gas
IDB Inter-American Development Bank
IEU Independent Evaluation Unit
LDCs Least Developed Countries
M&E Monitoring and evaluation
RCT Randomized Control Trial
RDD Regression Discontinuity Design
REDD Reduced emissions from deforestation and forest degradation
SIDS Small Island Developing States
tCO2e Tons of carbon dioxide equivalent
TOC Theory of Change
UNDP United Nations Development Programme

x

1
I. INTRODUCTION The Green Climate Fund (GCF) is a multilateral fund created to make significant and ambitious contributions to global efforts to combat climate change. The GCF contributes to achieving the objectives of the United Nations Framework Convention on Climate Change (UNFCCC) and the Paris Agreement. In the context of sustainable development, the GCF aims to promote a paradigm shift towards low-emission and climate-resilient development pathways. First, by providing support to developing countries to limit or reduce their greenhouse gas emissions. Second, by helping developing countries adapt to climate change, while accounting for their needs, and supporting particularly those that are most vulnerable to the adverse effects of climate change. For developing countries, the GCF provides support through a variety of financial support modalities including grants and loans, and through market instruments such as bonds and equity. This document assesses the quality of GCF-funded projects based on their proposals and asks the following question: To what extent are programmes and projects that the GCF is supporting, capable of credibly reporting their (own) impacts, efficiency and effectiveness, in an evidence-based and robust way? The reason we ask this question is two-fold. First, the overall goal of the GCF is to support a paradigm shift towards low-carbon, high-resilience pathways. In so committing itself, it becomes important to understand if such a paradigm shift is occurring, and, if so, to measure the extent to which the GCF has contributed to this overall result through their investments. This requires that GCF investments are credibly committing to and measuring the results they aim for and state. Second, impact measurement in the climate change space is difficult. As Jimenez and Puri (2017) point out, climate change action requires that large numbers of people act simultaneously to individually effect change that together must represent a large enough and critical change to make a difference. Results from individual actions on overall global climate change will only be apparent after hundreds of years, if not more. However, it is possible for us to assess the extent to which current investments in this space are likely to yield results. Therefore, examining projects for the likelihood of these results both to understand the probability of success and the credibility of results reporting (should it occur), is important if the GCF wants to measure and report its overall contribution to the climate action effort. The credibility of these results is even more important to assess, test and establish. The GCF invests its resources with several criteria in mind. Among these are the investment criteria, which require that projects show proof of impact potential, sustainability, paradigm shift potential, country ownership, climate relevance, effectiveness and efficiency. These are also (amongst) the criteria that the Independent Evaluation Unit (IEU) uses to assess the quality of the GCF portfolio and the overall performance of the GCF and its activities and results1. This study presents the results of a desk assessment of the GCF portfolio, undertaken by the IEU of the GCF. There are two main aims of the study: The first is to assess the quality of the funding proposals that the GCF has approved and is supporting currently so that subsequent proposals and project managers are able to learn and to produce stronger proposals that have a higher likelihood of
1 The overall criteria that have been approved by the GCF Board for all IEU evaluations are (1) relevance, effectiveness, efficiency, impact and sustainability of projects and programmes; (2) coherence in climate finance delivery with other multilateral entities; (3) gender equity; (4) country ownership of projects and programmes; (5) innovativeness in result areas, meaning the extent to which interventions may lead to paradigm shift towards low-emission and climate-resilient development pathways); (6) replication and scalability, meaning the extent to which the activities can be scaled up in other locations within the country or replicated in other countries (this criterion, which is considered in document GCF/B.05/03 in the context of measuring performance, could also be incorporated in independent evaluation); and (7) unexpected results, both positive and negative.

2
reporting measured results and also a higher likelihood of success2. The second is to inform the GCF investment criteria and to introduce evidence-based learning opportunities into GCF projects and processes, to inform the implementation and overall impact of GCF resources. These two aims help us meet four purposes: first, to develop the IEU baseline for understanding the current quality of proposals so that subsequently the IEU can develop policies and guidelines to help improve GCF projects; second, to help inform, where possible, risks that may arise in currently supported projects and alert project managers to them; third, to improve the quality of proposals overall; and fourth, to help projects measure better and discuss methods that FPs may use for this purpose. The hope is that with this discussion and with suggested robust methods, the GCF will be able to report its impact overall measurably and credibly. This paper is organized as follows: In Section II, we discuss the overall profile of GCF projects. In Section III, we present the methods used in this paper and discuss the development of a “stoplight”. In Section IV, we present our main findings, and in Section V, we discuss some common issues. In Section VI, we outline standards for high-quality measurement and possible learning tools. Section VII concludes with next steps.
II. SUMMARY OF THE 93 FUNDING PROPOSALS SUBMITTED TO THE GCF
The main route through which the GCF invests in low-emission, high-resilience development pathways is projects. All projects supported by the GCF are expected to be ‘climate relevant’. GCF investments are distributed among projects that help developing countries reduce or mitigate their greenhouse gas emissions (mitigation projects); projects that help countries adapt to the increased likelihood of climate and weather shocks and increase the resilience of populations (adaptation projects); and projects that support both aims (cross-cutting projects). See Table 1 for a distribution of the current portfolio (as of January 2019). The distribution of projects by project size category and total investment value is also shown in Table 1. Table 1: Distribution of funded projects by size and category, January 2019
THEMANTIC AREA
MICRO (LESS THAN
USD 10 MILLION)
SMALL (BETWEEN USD 10 MILLION
AND 50 MILLION)
MEDIUM (BETWEEN USD 50 MILLION
AND 250 MILLION)
LARGE (LARGER THAN
USD 250 MILLION)
GCF INVESTMENT (USD
MILLION)
TOTAL INVESTMENT (USD
MILLION)
AVERAGE LIFE OF PROJECTS
IN YEARS
Adaptation (number)
10 16 15 1 1,174.5 2,927.9 5.7
Cross-cutting (number)
2 6 12 4 1,705.8 5,452.4 9.8
Mitigation (number)
0 6 12 9 1905.0 7,842.5 10.9
Total Investment
255.19 1,099.75 5,019.89 9,848.05 4,785.3 16,222.9 —
2 Our maintained hypothesis is that measuring impact (or the lack of it) will provide a good basis for improving the quality of subsequent investments since it will help the GCF learn faster.

3
THEMANTIC AREA
MICRO (LESS THAN USD 10
MILLION)
SMALL (BETWEEN USD 10 MILLION
AND 50 MILLION)
MEDIUM (BETWEEN USD 50 MILLION
AND 250 MILLION)
LARGE (LARGER THAN USD 250
MILLION)
GCF INVESTMENT (USD MILLION)
TOTAL INVESTMENT (USD MILLION)
AVERAGE LIFE OF PROJECTS IN YEARS
(USD Million)
Average life span (years)
5.8 6.5 7.8 15.07 — — 8.25
Notes: All USD figures are rounded up to one point after decimal and do not reflect exchange rate variations. Source: IEU Database The GCF Board had approved 93 proposals by January 2019. A summary of the 93 funded projects 3in the portfolio is presented in Table 6. Of the regions, Africa had the largest number of proposals approved (31) and Eastern Europe had the least (3). Five proposals were global and spread across multiple geographic regions. Total GCF investments in funded projects by region are presented in Figure 1. Although Africa has the largest number of funded projects, it tends to receive less overall financing per project on average compared with projects in the Asia–Pacific and the Latin America & Caribbean regions. In Table 2, we present the number of people funded projects aim to “benefit”. Adaptation or cross-cutting funded projects aim to benefit 370 million people with an overall investment of USD 2.03 billion from the GCF, and mitigation and cross-cutting funded projects aim to reduce 1.5 billion tons of GHGs with an overall investment of USD 2.8 billion from the GCF.4
Source: IEU Database Figure 1: GCF-approved funding proposals by region, January 2019
3 Until the cut-off date of the study in January 2019, none of the 93 funding proposals had become lapsed, withdrawn, or cancelled. For this reason, funding proposals and funded projects are the same and are used interchangeably for the purpose of this study. 4 Because it is unclear how funding for cross-cutting projects is apportioned between adaptation and mitigation, we assume that GCF investments in cross-cutting FPs are divided equally between adaption and mitigation actions.

4
According to FPs, and as reported by the GCF Secretariat, as of January 2019, a combined investment of USD 16.2 billion will benefit 416 million people directly or indirectly by reducing vulnerability, increasing resilience or reducing poverty5. Mitigation proposals do not report beneficiaries but instead report reductions in GHGs6. “Beneficiaries” are reported only in adaptation or cross-cutting proposals. The regional distribution of beneficiaries of GCF investments reported by FPs is listed in Table 2. We also compare beneficiary numbers with the reported populations of these regions in Table 2. The amount of carbon dioxide expected to be mitigated in each region is shown in Table 37. Of the GCF FPs with mitigation targets reported, on average, projects are expected to achieve a reduction of 1.5 million tons of carbon dioxide equivalents (tCO2e) per year. In Figure 2, the GCF project and programme cycle is illustrated8. In this analysis, we examine funding proposals that have been approved for GCF investments that is, proposals that are beyond Stage 6. Table 2: Reported number of beneficiaries of GCF investments as listed in GCF-funded projects,
by region, January 2019
REGION BENEFICIARIES (MILLIONS)
TOTAL POPULATION (MILLIONS)
REPORTED GCF BENEFICIARIES AS % OF TOTAL POPULATION
Africa 90.02 1,320.04 6.8
Asia-Pacific 274.50 4626.64 5.9
Eastern Europe 4.07 743.10 1.4
Global 42.096 — —
Latin America & Caribbean 6.28 658.31 0.95
Notes: Population numbers are for the year 2019 Source: IEU Database and http://www.worldometers.info/world-population
5 For ease of reading, many figures used in the text are rounded up to the nearest decimal. Precise numbers are available in the tables and charts. 6 This is because the GCF has four “core” indicators as listed in its Results Management Framework. Depending on which “Result area” FPs are targeting (i.e. mitigation, adaptation or cross-cutting), all GCF funding proposals must contain core indicators. Most do, but some don’t. (See ex. GCF/B.22/07). Importantly, this means that FPs will report on either mitigation core indicators (tons of GHG equivalents mitigated) or adaptation core indicators (number of people benefited) or both core indicators (for cross-cutting projects). 7 These figures are all reported as is from approved funding proposals. GCF proposal templates request mitigation numbers to be reported in carbon dioxide equivalents. 8 GCF/B.17/21

5
Figure 2: GCF project and programme cycle Table 3: Reported tons of carbon dioxide equivalents expected to be mitigated in 93 GCF-funded
projects , January 2019
REGION ANNUAL TCO2 EQ MITIGATED (MILL)
PROJECT LIFETIME TCO2 EQ MITIGATED (MILL)
Africa 18.89 187.63
Asia-Pacific 23.53 393.67
Eastern Europe 0.17 3.41
Global 43.90 899.74
Latin America & Caribbean 8.02 83.28
Source: IEU Database
III. METHODS OVERVIEW In this section, we discuss the methods used to assess proposals submitted to and approved for funding by the GCF. We ask “To what extent are approved projects likely to be able to inform results that they claim, in a credible and measured manner?” Board-approved FPs were assessed along several dimensions. These dimensions are grouped into several common topics9. An important caveat here is that the comments in this study are not indicative of the capacity or ability of proposal submitters, mainly because – to the extent that we know – the attributes that we analyse are not requirements by the GCF or conditions for funding, at the time that these proposals were prepared. Inferences made in this paper are made from data and information in the proposals and indicate whether proposals and the information included within them are fit for purpose, for the objectives of the GCF. While noting that this is a desk review, the guiding principle 9 The individual assessment documents present our detailed comments on each of the proposals and are available on request.
Stage 1: Strategic planning, country,
region and/or accredited entity programmes
Stage 4: Funding proposals
Stage 5: Secretariat analysis and independent technical
assessment and recommendations to the Board
Stage 6: Board decision
Stage 7: Legal arrangement for
approved proposals
Stage 3: Concept note (voluntary)
Stage 2: Generation of programme or project
funding proposals
6
we employ is that we examine only what has been submitted in proposals; we also provide constructive comments on how these proposals may be improved, and we comment mainly on the potential “internal validity” of these projects – that is, the feasibility and ability of the projects to inform the results/changes that they aspire to, as stated in their proposals. Lens to assess whether proposals are fit for purpose We use four lenses to assess the potential for internal validity of funding proposals. The first is the theory of change (TOC). We assess whether proposals include an explicit discussion of the project’s overall TOC. A clear TOC is critical for understanding if the proposed activities will lead to outcomes that the investment aims for and the size of those outcomes. In many funding proposals TOCs are not laid out in a coherent way . In all cases, we analyse the full proposal and piece together an “implicit” TOC if an explicit one is not included. Second, to understand whether the programme activities will be able to, potentially, achieve the impacts claimed in the proposal, we examine proposals for their potential to measure and report causal change and report results using impact measurement. Many proposals make large claims about what can be accomplished by their investments. This causality and impact lens enables us to objectively estimate whether the project investment will cause the claimed impact(s),or whether some proportion of the anticipated effect could have occurred anyway, in the absence of programme activities/GCF investment. Observing this counterfactual scenario is impossible (we cannot observe both what happens to a beneficiary when they receive a project intervention and what happens to that same beneficiary if they do not receive the intervention). But there is now a large discipline showing how this may be done using either experimental construction or observation of valid comparison groups, to generating accurate estimates of causal impacts (see ex. Gertler et al. 2016; Jimenez and Puri 2015). Third, we assess the project’s ability to credibly inform the GCF investment criteria. We assess the extent to which the proposal credibly responded to fulfilling the investment criteria that the GCF lays out – that is, to what extent does the proposal credibly inform its impact potential, paradigm shift potential, sustainable development potential, needs of the recipient, country ownership, effectiveness and efficiency? Specifically, we recognize that for many projects, targeting is a primary concern. We assess each project based on the targeting criteria it presents. For instance, if a programme plans to reach 50% women or vulnerable groups, we examine if the proposal has articulated targeting criteria clearly and to what extent the programme is likely to achieve this goal, based on the programme model and TOC. Fourth, we examine FPs for how well they have set up systems to help report on their progress and fidelity to implementation plans, and we assess their stated M&E systems to see whether these are sufficient in their current state and to assess projects’ capabilities in this area. Building a stoplight To illustrate results, we build a stoplight for each FP that summarizes risks and other issues related to results measurement and the information presented in each funding proposal. Four criteria inform the stoplight. For each criterion, we use a likelihood or risk framework to assess the quality with which the proposal meets each criterion (see Box 1). The following decision rule is used: • If the FP has done well on a criterion, and it is highly likely that the criterion will be achieved, the
proposal is marked as “low risk” for that criterion. • If, based on the information provided in the FP, there appears to be a moderate probability that the
proposed programme or project will perform well relative to the stoplight criterion, then the proposal is marked as “medium risk” for that criterion.

7
• A proposal is marked as “high risk” for a given criterion if there appears to be a high probability that the proposed programme or project will not perform well relative to the criterion.
If we are unable to conclude that a proposal can be ascribed to any of these categories for a given criterion, we give it an “unclear” rating. This occurred in very few proposals (2). The questions that inform the stoplight are discussed in detailed below. Results are in Figure 3 to Figure 6.
A. Theory of change and discussion of causal pathways We use the following questions and rating rules, to assess the quality of the theories of change (TOCs) and causal pathways discussed in the FPs. • What is the quality of the (implicit or explicit) TOCs and programme logic?
a) Low risk. TOC is well articulated.
b) Medium risk. Logic framework or TOC is present but needs some clarifications. (Missing information is specified.)
c) High risk. Logic framework or TOC either does not exist, or it exists but relies on unverified assumptions or is missing key details about implementation and/or causal pathways. (Missing information is specified.)
d) Unclear. There is insufficient or ambiguous information presented in the proposal to adequately evaluate the TOC.
• Are unintended consequences referred to and identified robustly in the programme TOC and/or in the surrounding literature reviews?
a) Low risk. Unintended consequences are well articulated. (These are drawn from the discussion of the TOC.)
b) Medium risk. Unintended consequences are discussed but need some clarifications. (Missing information is specified.)
c) High risk. Unintended consequences are not discussed and they are potentially very large given the programme design. (Missing information is specified.)
Box 1: Why use a risk framework?
The stoplight assessments associated with each GCF-funded project are constructed based on the information provided within the proposals themselves. The proposals submitted to the GCF do not include every minute detail about the proposed project or programme, and the GCF recognizes that the information provided in the proposals may be further adjusted based on feedback from the GCF, due to the evolution of the needs of target recipients, or as a result of ongoing monitoring and evaluation efforts during implementation. Because the proposals are used as an input for the evaluation of the proposed projects or programmes, the quality with which a project will meet the various stoplight criteria cannot be evaluated with absolute certainty prior to implementation. However, projects and programmes can be evaluated in terms of the likelihood with which they will meet each stoplight criterion, based on the information in the proposal. Because the assessments gauge probabilities of success rather than observed performance against the stoplight criteria, a risk framework provides a useful assessment tool. As described in the text of this report (above), a project is rated as “high risk” for a given stoplight criterion when there is a high probability that the project described in the proposal will not adequately perform relative to that stoplight criterion. Alternatively, a “low risk” rating corresponds to a low probability of poor performance against a given criterion. This framework recognizes the fact that our assessments are not based on observed progress, but rather on the projected success of the proposed projects and programmes.

8
d) Unclear. There is insufficient or ambiguous information presented in the proposal to adequately evaluate how it addresses unintended consequences.
• Are causal pathways clearly identified and discussed? (This is discussed in the context of the TOC and the credibility and feasibility of the pathways.)
a) Low risk. Causal pathways are well articulated and supported with credible evidence.
b) Medium risk. Causal pathways are described or implied, but the proposed links need some clarifications about the assumptions that they rely on. (Missing information is specified.)
c) High risk. The causal pathways that are implied in the proposal do not have a clear description and/or are based on unfounded assumptions.
d) Unclear. There is insufficient or ambiguous information presented in the proposal to adequately evaluate the proposed causal pathways.
• How robust are the causal linkages (implicit or explicit) and are they well informed by high-quality evidence?
a) Low risk. Causal linkages are well articulated and are well informed by high-quality evidence.
b) Medium risk. Causal linkages are discussed but need some clarifications and/or need to be supported by additional high-quality evidence. (Missing information is specified.)
c) High risk. Causal linkages are either not discussed at all or are implied but lack any foundation in credible evidence. (Missing information is specified.)
d) Unclear. There is insufficient or ambiguous information presented in the proposal to adequately evaluate the proposed causal pathways.
• Is good-quality evidence cited to discuss the efficacy of causal linkages?
a) Low risk. Evidence is of good quality and well articulated.
b) Medium risk. Evidence is used but needs some clarifications. (Missing information is specified.)
c) High risk. Evidence is either not discussed or the quality of the evidence cited is very poor. (Missing information is specified.)
d) Unclear. The quality of the evidence cited to discuss the efficacy of causal linkages is unclear.
B. Potential for measurement of causal change and evaluability We ask the following questions to determine whether causal change can be attributed to the GCF programme / GCF investment through impact evaluation. • Does the proposal design allow for credible reporting of causal change?
a) Low risk. The proposal design allows for credible evaluation methods to be used to report casual change.
b) Medium risk. More details are needed to determine what could be a relevant comparison group or if there are feasible options to create comparison groups.
c) High risk. There does not appear to be a way to create a comparison group.
d) Unclear. There is not enough information to determine whether a credible measurement of causal change is possible.

9
• To what extent are requirements included for monitoring and evaluation adequate and able to cover costs of undertaking high-quality impact evaluations?
a) Low risk. Requirements for monitoring and evaluation are likely adequate to cover the costs of a high-quality evaluation.
b) Medium risk. Requirements for monitoring and evaluation are specified, but likely to be insufficient to support a high-quality impact evaluation.
c) High risk. Requirements for monitoring and evaluation are not specified or cannot be determined from the information provided.
d) Unclear. Information about the requirements for monitoring and evaluation is ambiguous, making an assessment of this information impossible.
• Are activities included in the proposal that focus on “economic analyses” and “overall monitoring and evaluation” and are these sufficient for high-quality credible evaluations?
a) Low risk. Both are specified and are of high quality.
b) Medium risk. Both are specified but are of low quality. (Missing information is specified.)
c) High risk. Only one is specified or neither is specified. (Missing information is specified.)
d) Unclear. There is insufficient or ambiguous information presented in the proposal to adequately evaluate the quality of proposed economic analyses and monitoring and evaluation activities.
• Are methods for measuring attributable causal changes (outcomes or impact or other) discussed?
a) Low risk. Measurement of attribution is well articulated.
b) Medium risk. Measurement of attribution is discussed and/or the need for causal impact measurement is acknowledged, but strategies for doing so are not well articulated. (Missing information is specified.)
c) High risk. Measurement of causal impact attribution is not discussed and/or the need for causal impact measurement is not acknowledged.
d) Unclear. There is insufficient or ambiguous information presented in the proposal to adequately evaluate any proposed methods for measuring attributable causal changes.
• Are there potential areas of bias that are likely to creep in?
a) Low risk. There is a low risk of bias considering the proposed method of evaluating causal impact.
b) Medium risk. There is a medium risk of bias considering the proposed method of evaluating causal impact. We specify what could lead to biases.
c) High risk. There is a high risk of bias. The proposal either does not discuss a strategy for causal impact evaluation or the strategy that is discussed has a high risk of producing unbiased impact estimates.
d) Unclear. Cannot judge likelihood of bias due to insufficient information.
• What are possible impact evaluation methods that may be used to undertake possible impact evaluations of approved programmes? (This criterion is not assessed within the same risk framework as the other stoplight criteria. A summary of proposed evaluation methods is presented in Table 16.)

10
C. Implementation fidelity and performance against investment criteria We ask the following questions to determine if implementation and performance are likely to fit with the investment criteria.
• Are eligibility and targeting criteria well articulated in submitted documents?
a) Low risk. Eligibility and targeting criteria are well articulated.
b) Medium risk. Eligibility and targeting criteria are discussed but need some clarifications. We specify the missing information.
c) High risk. Eligibility and targeting criteria are either not discussed, or they are discussed but do not appear to be feasible given the programme design. (Missing information is specified.)
d) Unclear. There is insufficient or ambiguous information presented in the proposal to adequately evaluate eligibility and targeting criteria.
• Is there adequate and reliable information included in the proposal regarding implementation fidelity?
a) Low risk. Implementation fidelity appears to be strong.
b) Medium risk. There is a medium level of risk related to implementation fidelity. Some risks to implementation fidelity need to be addressed. (Missing information is specified.)
c) High risk. There is a high level of risk related to implementation fidelity. Substantial risks need to be addressed. We specify the missing information.
d) Unclear. There is insufficient or ambiguous information presented in the proposal to adequately evaluate the information regarding implementation fidelity.
• To what extent is impact potential identifiable and measurable in the proposal?
a) Low risk. Impact potential is well articulated in the proposal and appears to be measurable using high-quality methods.
b) Medium risk. Impact potential is specified but needs some clarifications. We specify the missing information. Impact potential is measurable, but high-quality methods may not be feasible given the programme design.
c) High risk. Impact potential is specified, but it relies on significant assumptions that are not verified and/or impact indicators are vaguely described. Measurement and evaluation potential appears to be low.
d) Unclear. There is insufficient or ambiguous information presented in the proposal to adequately evaluate the impact potential description and the feasibility of high-quality impact measurement.
• To what extent is paradigm shift potential identifiable and measurable in the proposal?
a) Low risk. Paradigm shift potential is well articulated in the proposal and appears to be measurable using high-quality methods.
b) Medium risk. Paradigm shift potential is specified but needs some clarifications. (Missing information is specified.) Paradigm shift potential is measurable, but high-quality methods may not be feasible given the programme design.
c) High risk. Paradigm shift potential is specified, but it relies on significant assumptions that are not verified and/or paradigm shift indicators are vaguely described. Measurement and evaluation potential appears to be low.

11
d) Unclear. There is insufficient or ambiguous information presented in the proposal to adequately evaluate the paradigm shift potential description and the feasibility of high-quality paradigm shift measurement.
• How well are other GCF investment criteria informed and are these measurable and verifiable with high credibility and quality?
a) Low risk. Other investment criteria are likely to be credible.
b) Medium risk. Other investment criteria have some limitations. (Missing information is specified.)
c) High risk. Other investment criteria are not likely sufficient. We specify the missing information.
d) Unclear. The credibility of other investment criteria cannot be determined from the information provided.
D. Data collection and reporting credibility We ask the following questions to determine if data collection and reporting are likely to be of good quality. • Are current reporting requirements sufficient for regular M&E?
a) Low risk. Reporting for M&E is well articulated.
b) Medium risk. Reporting for M&E is discussed but needs some clarifications. We specify the missing information.
c) High risk. Reporting for M&E is discussed, but it is not sufficient for credible and useful M&E. We specify the missing information.
d) Unclear. The quality of reporting plans for M&E cannot be determined from the information provided.
• How likely is it that progress on investment criteria can be measured and reported on credibly, given M&E plans, budget and indicators for investment criteria?
a) Low risk. M&E and reporting plans have high potential to measure progress on investment criteria.
b) Medium risk. M&E and reporting plans are discussed but are likely not of high enough quality or backed by sufficient resources to adequately measure progress against investment criteria.
c) High risk. M&E and reporting plans related to progress on investment criteria are not well articulated and/or clearly lack the resources needed to measure progress.
d) Unclear. There is insufficient or ambiguous information presented in the proposal to adequately evaluate the potential for the project to credibly monitor and report on progress associated with investment criteria.
• To what extent did the proposal provide additional impact indicators beyond those proposed by the GCF? Can the proposal’s indicators be used to measure the magnitude of causal change?
a) Low risk. Indicators and measurements are well defined and can be used to measure impact.
b) Medium risk. Indicators and measurements lack specificity, and measuring impact using the indicators specified may be a challenge.

12
c) High risk. Indicators and measurements are vague and/or unclear. More detailed indicators are needed to credibly measure impacts.
d) Unclear. Insufficient information in the proposal to deduce the quality of indicators and measurements.
• Have baseline data been collected and/or is there a requirement for this?
a) Low risk. Project will use baseline data and the methods for collecting are well articulated.
b) Medium risk. Baseline data are discussed but need some clarifications. Missing information to be specified.
c) High risk. Plans for collecting baseline data are not discussed despite a need to collect baseline data to inform an impact evaluation.
d) Unclear. There is insufficient or ambiguous information presented in the proposal to adequately evaluate plans for baseline data collection.
• What is the potential quality of data and are they suitable for impact evaluations?
a) Low risk. Data to be collected will be of high quality.
b) Medium risk. Data to be collected will likely be of good quality.
c) High risk. Data to be collected likely to be of low quality or data collection plans are not specified/unclear.
d) Unclear. There is insufficient or ambiguous information presented in the proposal to adequately evaluate the potential quality of data.
We use these questions to assign each FP to high risk, medium risk, low risk or unclear categories for each of the questions. Assigning FPs to different risk categories, is meant to be used in conjunction with the individual project assessments (that are available on request) to help the reader better understand the impact and feasibility of the proposals to the GCF. Each approved project is assessed using these four lenses. We present a FP-wise summary of our results in Table 16. The table summarizes the basic information of the proposal (implementer, period of funding, countries and funding amount) and provides a short summary of results of the assessments, with focus on the quality of the TOC, causal linkages, targeting strategy, and whether the proposal is likely able to inform the GCF investment criteria in a rigorous manner. We then aggregate these rankings. We discuss our overall results in the next section.
IV. KEY FINDINGS In this section, we discuss our key results. Individual ranks from Table 17 are aggregated by category to give us an overall view of the portfolio as of January 2019.
A. Theory of change and articulation of causal pathways In this category, we assess the extent to which there are good implicit or explicitly stated TOCs articulated in the proposals. In this assessment we also examine if FPs are cognizant of unintended consequences of GCF investments and if these are referred to at all. As presented in Figure 3, 49% of approved FPs identify and mention unintended consequences. However, 62% do not have well defined TOCs. Close to two-thirds (66%) don’t inform their TOCs with good quality evidence (from either other sources or their own formative work). Overall most proposals have some discussion of an overarching TOC, but these frequently rely on unverified assumptions about potential causal mechanisms.

13
One example is a funded project, which supports investments in a port rehabilitation project in Nauru, that forecasts reduction in cargo ship emissions due to increased operational efficiency at the port, while also suggesting that the port improvements will drive more traffic at the port (which would increase the absolute amount of emissions from cargo ships at the port). These two opposing forces will drive mitigation outcomes in different directions, but the proposal does not acknowledge this in its TOC. Similarly, several other proposals imply critical assumptions about causality in their TOC but do not provide evidence to verify these assumptions prior to implementation. In the proposal “Priming Financial and Land-Use Planning Instruments to Reduce Emissions from Deforestation”, the assumption that activities that are part of Ecuador’s REDD+ Action Plan will lead to additional changes compared to those that would have been realized in the absence of the project is not well supported with an evidence-based TOC. Indeed, one of the challenges of REDD+ programmes is bringing new and additional landowners into the fray. As systematic reviews in this space have indicated, this frequently does not occur (Lawry et al., 2016). The success of the proposal “GCF – EBRD Egypt Renewable Energy Financing Framework” relies heavily on sufficient demand for financing from private-sector renewable energy developers in Egypt, but the proposal does not provide adequate evidence to demonstrate demand for new financing mechanisms in the country.
Source: IEU Database Figure 3: Stoplight assessment of theory of change, January 2019
B. Potential for measurement of causal change and evaluability Next, we assess the evaluability and measurability of proposed project activities – that is, the feasibility of credibly measuring the magnitude of causal impacts attributable to project activities. We find that a majority of proposals have high measurement and evaluation potential but lack a discussion
0 20 40 60 80 100
Is good quality evidence cited todiscuss the efficacy of causal linkages?
How robust are the causal linkages(implicit or explicit) and are they wellinformed by high quality evidence?
Are causal pathways clearly identifiedand discussed?
Are unintended consequences referredto and identified robustly in the
programme theory of change and/or inthe surrounding literature reviews?
What is the quality of the (implicit orexplicit) theories of change and
program logic?
Stoplight Assessments: Theory of Change
% High risk
% Medium risk
% Low risk

14
about how such a measurement of causal change and evaluation may be carried out. Many proposals refer to planned M&E activities that will track implementation progress and results over time, but they do not address how they plan to report the changes caused by the projects that they claim. In discussing impact, we are referring to the changes to adaptation and mitigation outcomes that are additional to the changes that beneficiaries would have experienced in the absence of the intervention/investment described in the proposal. This additionality cannot be measured by simple progress tracking, which in many proposals is the ultimate results monitoring activity that is described. One illustration of this confusion that frequently occurs between measuring progress and impact caused by the investment can be seen in the FP “Senegal Integrated Urban Flood Management Project”, which aims to boost flood resilience in vulnerable urban areas of Senegal. The proposal describes several complementary initiatives and activities (separate from those funded by the GCF) that could contribute to increased resilience. Because these activities may influence the results realized by beneficiaries, it is important to distinguish between overall progress towards resilience and the causal impact achieved by the GCF investment itself. Without estimating a valid counterfactual, measuring the overall change in resilience-related outcomes, the investment is likely to provide a biased estimate of impact. Specific indicators that can be used to estimate changes in flood resilience include measures of economic well-being, childhood health metrics including rates of water and vector-borne diseases, and the value of household assets. In order to understand how flood resilience changes over time due to the project, these and other similar indicators need to be measured in both a treatment and valid comparison group. By doing so, the project implementers will be able to measure the magnitude of causal impacts achieved by the project, rather than overall progress towards resilience, which could be due to several factors aside from the project itself. We look at several questions to assess if GCF funding proposals indicate that the projects can measure causal change and can credibly report on the claims that they make regarding their overall effects. To recap, these questions include the following: • Do the proposal designs allow for credible reporting of measured causal change?
• To what extent is causal change identifiable and measurable in the proposal implicitly or explicitly?
• Do proposals discuss any methods for measuring attributable change?
• In reporting and measuring the effects that they are having, is there potential for bias to creep in?
• To what extent are the claimed M&E elements adequately supported by the financial budget lines? • What activities are included in proposals that focus on “economic analyses” and to what extent are
these activities able to include high-quality evaluations and impact evaluations? Results of the spotlight analysis are included in Figure 4. It is interesting to note that 48% of the proposals submitted to and approved by the GCF allow for and have the possibility of credibly measuring (and reporting) causal change. That is, almost half of all proposals have the potential to identify and measure causal change. Additionally, 26% of the proposals include a discussion about economic analyses that they will carry out. However, this is only half the story. We also find that, although there is potential for these measurements to occur, 68% of the proposals either do not discuss methods for measuring causal change or these are unclear. This is an important consideration mainly because all proposals for GCF funding are supposed to have indicators and are required to show how they will bring about change in the overall indicators they are aspiring to. Additionally, we find that 78% of proposals, although they include M&E “reports”, would not be able to cover the cost of high-quality evaluations or do not specify a clear budget for doing so. Almost all proposals (94%) do not show any awareness that (significant) bias may (will) creep in when they are measuring or claiming impacts.

15
Source: IEU Database Figure 4: Stoplight assessment of evaluation potential, January 2019 Next we ask, do these claims change depending on whether these are mitigation, adaptation or cross-cutting proposals? And are these private-sector proposals supported mainly by equities, loans and other market instruments, or are these supported mainly by grants? The results are presented in the Table 13 and Table 14, respectively. We find that the possibility of credibly measuring causal change, given the proposal design, does vary across mitigation, adaptation and cross-cutting proposals. The proportion of proposals allowing for the possibility of credibly measuring (and reporting) causal change is greatest for adaptation-focused proposals, at 61%, while this proportion drops to 33% and 44% for mitigation and cross-cutting proposals, respectively. Insufficient discussion of possible methods to measure attributable causal change also varies according to the proposal’s focus. Of the adaptation-focused proposals, 63% either do not discuss methods for measuring causal change or these are unclear. This is the case for a larger proportion of the mitigation proposals (67%) and of greatest concern for the cross-cutting proposals, where methods for measuring causal change are inadequately discussed for 76% of the proposals. In line with this finding, a smaller proportion of cross-cutting proposals include adequate discussion
0 20 40 60 80 100
Are there potential areas of bias that arelikely to creep in?
Are methods for measuring attributablecausal changes (outcomes or impact or
other) discussed?
What activities are included in the proposal that focus on ‘economic
analyses’ and ‘overall monitoring and evaluation' incorporated and are these
sufficient for high quality credible evaluations?
To what extent are includedrequirements for monitoring and
evaluation adequate and able to covercosts of undertaking high quality impact
evaluations?
Does the proposal design allow forcredible reporting of causal change?
Stoplight Assessments: Evaluation Potential
% High risk
% Medium risk
% Low risk
% Unclear

16
about the economic analyses that they will carry out than adaptation or mitigation-focused proposals do– 20% versus 27% and 30%, respectively. It is possible that the diversity of activities encompassed within cross-cutting projects requires a more complex evaluation strategy and this is a contributing factor to the relatively poorer performance of these proposals against highlighted evaluability criteria. Therefore, efforts to address concerns relating to the consideration and feasibility of credible impact evaluation will perhaps need to be tailored to target the unique requirements of cross-cutting projects. In contrast, we see that the proportion of proposals that would be able to cover the cost of high-quality evaluations, is greatest among cross-cutting proposals, at 16%, with corresponding figures of 10% and 0% for adaptation and mitigation-focused proposals. However, this result should be considered within the context highlighted above. In this pool of proposals, evaluation strategies appear to be least well developed among cross-cutting proposals, which could be contributing to the reduced difficulties relating to their financial viability, aside from those attributable to the proposal’s focus. When disaggregating proposals according to whether they are supported by private-sector funds or grant funding, we see that half of the proposals funded by the private sector allow for the possibility of credibly measuring causal change. On the other hand, 21% of proposals funded by multilateral banks, 8% of proposals funded by UN programmes, and 55% of proposals funded by other sources do not allow for the possibility of credibly measuring causal change. Similarly, the proportion of private-sector-funding proposals that do not provide adequate discussion on economic analyses is relatively small, at 8%. Whereas, this discussion is lacking in 39% of the funding proposals submitted by multilateral banks and for 20% of proposals submitted by UN programmes. Overall there is insufficient discussion of possible methods to measure attributable causal change affecting proposals across all funding types (58% of private-sector-funding proposals, and 68%, 64% and 91% of proposals funded by multilateral banks, UN programmes, and other sources, respectively). Despite this, there are several reasons to be optimistic. Many adaptation proposals are well described and have sufficient information in them to inform attributable causal change. If these projects want to measure the change that they want to create, or are claiming to do, then we would propose multifaceted randomized evaluations to understand the differential impact of individual aspects of each project. A proposal, for example, gives a variety of different community-level interventions related to agriculture, clean water and sanitation for water- and food-insecure populations in Tanzania. A randomized evaluation with multiple treatment arms could potentially yield valuable information about a range of resilience-related outcomes. We find that very large-scale mitigation-focused proposals have generally lower possibilities for reporting their overall impacts credibly with attribution. For example, a proposal aims to enhance the supply of hydropower for a large portion of the population in the Solomon Islands. For large infrastructure projects, it is difficult to understand the counterfactual had GCF investments not taken place. For these, we propose good process tracing methods be employed to understand the overall direct effects (and indirect effects, such as employment and trade effects) to understand and measure the effects of these sorts of large infrastructure investments. In other cases which will expand the scale of photovoltaic solar energy development in the Atacama Desert of Chile, it may be possible to set up different sorts of designs, such as a “pipeline design”, that take advantage of the fact that all installations of solar photovoltaic equipment cannot feasibly take place on a single day or perhaps even within a few months. Most implementing entities have to develop their field presence and administration to implement their plans, and the implementation of such large-scale projects usually takes about a year. In this case, we propose a pipeline design where randomized roll-out across villages or communities lets the project leverage its own implementation capabilities while ensuring that the implementing entities are able to inform their effects credibly. We also propose that projects plan to measure their contributions for emissions reduction against “business as usual” scenarios

17
(which then necessitates that projects have good baselines and estimates of trends in emissions growth, with and without GCF investments).
C. Implementation and performance against investment criteria This third sub-category of assessment criteria focuses on the feasibility of implementation, targeting of project activities, and performance against GCF investment criteria. Proposals were evaluated based on the clarity with which they addressed risks to implementation success, the presence of a well-articulated targeting strategy, their overall performance against investment criteria, and the feasibility of measuring and informing progress related to each of the GCF investment criteria. While targeting and implementation fidelity are independent from the other sub-categories, performance against investment criteria was often not tied to a clear TOC that described logical causal pathways through which sustainable impacts and paradigm shifts could be realized. A funded project titled “Climate Resilient Agriculture in Three of the Vulnerable Extreme Northern Crop-Growing Regions (CRAVE)”, in Namibia, is one example of a proposal that clearly articulated a targeting strategy for its project activities that centred on impacting small-scale farmers in three highly vulnerable administrative zones in north-eastern Namibia. However, the proposal did not include a clear TOC and implied that target beneficiaries would be receptive to a range of project interventions, without providing credible evidence to support this assumption. The omission of a clear TOC in this and other proposals limits our ability to confidently ascribe high-impact, sustainable development, cost-effectiveness, or paradigm shift potential to the proposal. In other cases, such as in a funded project titled “Accelerating the Transformational Shift to a Low-Carbon Economy in the Republic of Mauritius”, clear causal mechanisms were described that would drive impact, and the proposal provided evidence to support each of the GCF investment criteria. In Figure 5, we see that 20% of the proposals had limitations in how investment criteria were informed and/or the information level was insufficient to inform them credibly. In more than 60% of the proposals we found that the impact potential of the project was discussed but that significant clarification was needed or the information was not sufficient. In contrast, we found that there was sufficient information to provide monitoring data – or in other words, to track implementation fidelity – across 82% of proposals, given the level of detail with which most proposals described their activities and plans for implementation. High-risk scores were given for this criterion when large risks were left unaddressed, such as in FPxx10, which failed to acknowledge several risks related to the size and scope of its wide-reaching mitigation activities. Eligibility and targeting information was well articulated in over half (55%) of submitted proposals.
10 This proposal focuses on a large-scale, international investment facility for renewable energy and energy efficiency development projects in GCF eligible countries.

18
Source: IEU Database Figure 5: Stoplight assessment of implementation and investment criteria, January 2019
D. Data collection and reporting requirements The criteria in this sub-category are used to gauge how well data collection and reporting systems are equipped to rigorously inform the causal impacts of GCF investment. Overall, as presented in Figure 6, we found that approximately 18% of the proposals indicated they were going to be collecting adequate baseline data, 31% discussed the possibility of baseline data but the proposals require some clarifications about what information will be collected and whether or not it will be sufficient to inform an impact evaluation, and in the remaining 49%, there were no plans for baseline data collection on key variables. One proposal discussed pre-intervention trends for important outcome variables, but it was unclear if baseline data were collected. Only 15% of the proposals would allow for credible measurement of progress on investment criteria. While in 90% of the proposals, although M&E plans, budget and indicators for investment criteria may have been identified, they need to be articulated in a clearer fashion. Many of these proposals speak in vague terms about the actual outcomes that they intend to impact. For example, the proposal “Enhancing Climate Change Adaptation in the North Coast and Nile Delta Regions in Egypt” speaks broadly about reducing flood risks and long-term climate risks but does not include clear indicators that can be monitored over time to measure progress against these goals. The proposal lists the “Number of males and females benefiting from soft coastal protection measures” as
0 20 40 60 80 100
How well are other GCF investmentcriteria informed and are these
measurable and verifiable with highcredibility and quality?
To what extent is paradigm shiftpotential identifiable and measurable
in the proposal?
To what extent is impact potentialidentifiable and measurable in the
proposal?
Is there adequate and reliableinformation included in the proposalregarding implementation fidelity?
Are eligibility and targeting criteriawell-articulated in submitted
documents?
Stoplight Assessments: Implementation and Investment Criteria
% High risk
% Medium risk
% Low risk
% Unclear

19
an outcome indicator, but it is not clear what metric will be used to measure the type and magnitude of the benefit that is realized due to these coastal protection measures and other project activities. In 68% of the proposals, the reporting plan for M&E is either well-articulated or is discussed but would benefit from some clarification. Many of the proposals that would benefit from further clarification about reporting plans for M&E include a skeleton description of basic reporting practices (such as a pledge to produce annual progress reports), but they lack detail about what indicators will be tracked and reported on, and how monitoring efforts will feed into (and improve) future project activities. Just 13% of proposals provided impact indicators deemed capable of measuring the magnitude of causal change. To gauge if data quality is sufficient for informing attributable and causal change, we find that only 10% of proposals include a plan for collecting data of sufficient quality for a causal evaluation. Data collection and reporting requirements outlined in most proposals are insufficient and receive a score of medium or high risk. A common theme across proposals is an ambiguous description of impact indicators. Several proposals highlight the total number of people that will be reached by a project as the main impact of interest but do not explicitly define the key outcomes that the project intends to change for those who are reached. The proposal “Improving the Resilience of Vulnerable Coastal Communities to Climate Change Related Impacts in Vietnam,” for example, does not clearly define impact indicators beyond the broad concept of resilience. Without a clear definition of indicators that will be used to measure impact, it is impossible to design an evaluation that will generate new and useful knowledge. This lack of detail regarding impact indicators is a problem across adaptation-focused, mitigation-focused and cross-cutting proposals. For both mitigation and adaptation projects, data collection methods are infrequently described in detail. For example, many mitigation projects, such as the one described in a funded project that focuses on developing Argan orchards in degraded environments (DARED), fail to discuss how emissions outcomes will be tracked during and after implementation, and therefore are assigned a high-risk score for the corresponding criteria in this sub-category.

20
Source: IEU Database Figure 6: Stoplight assessment of data and reporting, January 2019
V. DISCUSSION In this section, we discuss some of these results and lay out steps that entities can take to resolve some of the concerns we raise. Through a close reading of the proposals, the IEU has identified several common areas of concern. We discuss each area in general and provide some examples of the specific issues from the proposals. While we identify several important concerns with the proposals, we believe there are likely many ways that these concerns can be addressed. We especially believe that there is a strong possibility for good-quality M&E systems and impact evaluations.
0 20 40 60 80 100
What is the potential quality of dataand are these suitable for impact
evaluations?
Has baseline data been collectedand/or is there a requirement for this?
To what extent did the proposalprovide additional impact indicatorsbeyond those proposed by the GCF?Can the proposal's indicators be usedto measure the magnitude of causal
change?
How likely is it that progress oninvestment criteria can be measured
credibly, given M&E plans, budget, andindicators for investmet criteria?
Are current reporting requirementssufficient for regular M&E?
Stoplight Assessments: Data and Reporting
% High risk
% Medium risk
% Low risk
% Unclear

21
There are several areas where the proposals appear to have low risk. These include monitoring implementation fidelity and the potential to measure causal pathways, especially through impact evaluation. Where funded projects are at highest risk is the (in)adequacy of credible measurement and evaluation systems, a lack of sufficient information to inform investment criteria, targeting, bias in estimates of impacts by the programmes, the quality of data systems and presence of baseline data, a lack of discussion around attribution of proposed impacts, use of evidence for causal linkages and a discussion of causal pathways. We discuss many of these issues below, especially regarding the lack of a TOC and the quality of M&E systems.
A. Theory of change Many proposals either have no TOC, or the TOC is very limited and scattered across the proposal. A common concern has thus been that proposals lack a well-articulated TOC that connects broad activities and products to results and impacts. We believe that a well-articulated TOC is critical for connecting programme activities to the impacts on individuals and the expected paradigm shift and adaptation outcomes. TOCs also act as good ‘vision’ documents that may be used to inform current and future plans for the projects, allay concerns about implementation timelines and create good communication and consistent timelines within project teams. Evidence from development programmes has shown that there is a widespread mis-conception that supply of infrastructure, information and services is sufficient for behaviour change (systematic review on farmer field schools; insurance program; immunization). This is the last mile problem: Most development and now climate change programs assume incorrectly that efforts that will alter knowledge, attitudes and beliefs will change practices. In practice, this is almost never true. Behaviour change requires many changes in thinking as the recent work on behavioural economics and insights has shown. Unfortunately, none of the GCF Board- approved FPs illustrate knowledge of this potential ‘last mile’ pitfall and hinge their estimates of impact on behaviour change occurring as a result of supply-side interventions. Many proposals include the implicit assumption that people and communities will accept support for greater adaptation methods and use it. However, there is very little evidence that people make good use of simple trainings or just the provision of information in general. This is especially the case for climate adaptation trainings, because they can have cost implications for people and so are often less interesting to them. A good TOC is a ‘low-hanging fruit’ that could be very important to target. It might be helpful to pursue this one issue the most and make a general request for improved TOCs.
B. Causality and attributable measurable impact Many funding proposals lack a discussion about measuring impact caused by the investment or ‘causal attribution’. There is very little discussion about how a GCF investment will lead to an increase in some outcome above what would have taken place in the absence of the programme. It is also very uncommon for proposals to discuss how the program model, as opposed to other potential program models, could matter for impacts, and no proposal has made it clear how they will measure the size of the increase in outcomes. None of the mitigation related proposals discuss risks around their standard assumptions of perfect (100%) usage and none of them discuss rebound effects or spill-overs11.
11 “Perfect usage”, or “take-up”, refers to how many of the people offered a programme utilize the services offered. The “rebound effect” refers to cases where the actions of some participants change how others behave. The classic example is clean cookstoves, which seek to reduce wood usage. In some cases, this could reduce the price of wood, leading people to buy more wood, thus cancelling out any total wood reductions.

22
This issue is also connected to the TOC and how M&E is to be implemented. Without a strong TOC, it is difficult to connect actual activities to expected outputs. With a strong TOC and a well-designed M&E plan, it is possible to make causal connections between the programme and the actual impacts produced. This makes it possible to clearly identify the appropriateness of the investment for the investment criteria, which we discuss below.
C. Targeting None of the proposals we reviewed discussed well how the programme will reach (and benefit) people who are vulnerable. Indeed, targeting is harder than simply calling for a certain percentage of participants to be women or poor. A high-quality M&E system will enable tracking whether programmes reach these targets. But programme logic needs to indicate how these beneficiaries will be identified and motivated to participate. The people who are the most desired targets can have the least interest in participating in a programme12. As before this is the ‘last mile problem’: Most programmes are able to ensure that they have provided services or infrastructure for training, but few focus on closing that last mile that ensures people actually use these services and technologies (Rogers, 2003; Barooah, Kaushish, Puri and Leach, 2017). Getting these programming details right has been of growing concern to policymakers. Implementing complex programmes relies on the behavioural choices of individuals. Not focusing on these sufficiently can also frequently lead to unintended consequences. For instance, programming that targets women must consider problems that women face in developing countries around decision-making within the household and society. Programming on clean cookstoves that ignore household power dynamics are likely to be unsuccessful: Good-quality stoves have huge health benefits for women who cook, but little impact on the men who oversee buying the devices. To be successful at targeting women’s health, cookstove programmes must indeed address the question of financial empowerment and power dynamics within a household. Similarly, it has been shown elsewhere that weather insurance is unlikely to be adopted by farmers in low-income settings, despite the fact that these are actuarially fair. In still other cases, it has been shown that despite farmers and households receiving information about weather and climate variability, climate-sensitive action is not very frequent.
D. Investment criteria: effectiveness, relevance, efficiency, sustainability and impact
An analysis of the approved FP portfolio shows that it is likely to be difficult to estimate the impacts of GCF investments. We illustrate this by discussing five proposals: two that overstate potential CO2 reductions and three that are adaptation projects but that have a weak link to climate adaptation overall. Concerns that CO2 reduction estimates may be overstated: During the review process, we identified several proposals that make a questionable link to the amount of CO2 emissions that will be reduced by the programme. The following two are included here as examples. A funded project focusing on energy efficiency green bonds in Latin America and the Caribbean: The programme described in this proposal is an alternative financing mechanism for energy efficiency (EE) projects in Mexico, Colombia, the Dominican Republic and Jamaica. It will issue green asset
12 For instance, clean cookstoves are often most helpful for women, who do most of the cooking and are subject to smoke inhalation from traditional cooking methods. However, it is men who often make the purchasing decisions for such things. Miller and Mobarak (2013) show that the differences in preferences between men and women may explain low valuation and take-up of clean cookstoves.

23
backed securities that EE project developers can leverage for improved financing terms and conditions. The proposal estimates that this programme will result in total GHG emissions of over 13 million tCO2e. However, it does not account for potential non-financial factors that could constrain the impact potential of EE investments. For example, there is no detailed discussion in the proposal about how the programme will address low levels of awareness, technical capacity, or potential responsiveness to new energy technologies at the beneficiary level. It is easy to imagine several scenarios in which indigenous or similarly tradition-based cultures may be unwilling to adopt new EE technologies, unaware of how to use them effectively, or unfamiliar with how to maintain them. In these situations, behavioural dynamics will limit the impact achieved by EE technology interventions. Without accounting for these confounding factors, impact projections are likely to be highly biased and unrealistic. A funded project focusing on universal green energy access in sub-Saharan Africa: With population growth in sub-Saharan Africa expected to spike over the next three decades, the energy needs of the poor will become a larger and more pressing challenge. The programme described in this proposal aims to tackle this challenge by establishing an investment fund that provides financial support to three categories of renewable energy production and delivery projects: • Off-grid renewable electrical energy
• Mini-grid renewable electrical energy • Industrial renewable electrical energy and selected on-grid installations The smaller-scale off-grid projects in this investment portfolio will target beneficiary households and require them to be receptive to new technologies, which in many rural settings will displace biomass and wood fuel as the major source of energy. However, there is no guarantee that beneficiaries will optimally adopt new off-grid tools, which limits the programme’s mitigation potential. The proposal estimates that the programme will lead to emissions reductions of over 50.5 million tCO2e over a 15-year period, but this assumes successful implementation of off-grid technologies. Incorporating the behavioural factors that will influence the mitigation effect of these technologies – such as beneficiary receptiveness, awareness, technical capacity and take-up – is critical to accurately estimate the potential impact of renewable energy technology. Further, it is essential that the implementing entity collects data on observed technology use and emissions outcomes to measure causal impacts, rather than simply relying on projections of the mitigation benefits due solely to the technological improvement in energy production. Link to climate impacts: During the review process, we also identified several proposals that are tenuously linked with climate impacts. The following are included here as examples. A funded project focusing on sustainable and climate resilient connectivity for Nauru: GCF support for this project will be used for activities related to the rehabilitation of the country’s only port – namely, the construction of: • a new wharf that is resilient to common climate-related hazards and is amenable to a greater variety
of cargo ships; • a breakwater that will enable ships to come directly to shore (at present small boats and barges are
needed to ferry cargo from sea to shore); and • a channel through the coastal reef to the shore, which, in conjunction with a breakwater, will enable
cargo ships to travel safely to land. The proposal discusses how the construction of an upgraded port will boost resilience to climate-related hazards including sea-level rise, westerly wind-driven waves and cyclone-driven swell waves,

24
which currently put cargo ships at risk and cause damage to the decaying port facilities. Due to the outdated design and dilapidated state of the port at present, ships are frequently required to sit idly at sea while small barges transport goods to land. This inefficiency leaves ships more vulnerable to extreme weather and increases the amount of emissions from ships. This set-up has forced all but one shipping company to cease operations to Nauru. While it is clear that the island nation’s main port could be rehabilitated in a way that ensured resilience to future climate risks, it appears that the project is not addressing a challenge driven by climate change, but instead is a response to the problems resulting from an aging port and outdated processes for facilitating efficient delivery of goods. Challenges resulting from this infrastructural problem could certainly be exacerbated by the impacts of climate change on sea-level rise and storm events, but the magnitude of that additional risk is likely marginal. A funded project focusing on urban water supply and wastewater management in Fiji: This project aims to improve access to safe water and sewerage services in Fiji. Urbanization rates are increasing rapidly in Fiji, but the government has been unable to keep pace with the growing demand for water services in major metropolitan areas. Project activities include improving water production and treatment systems, increasing sewer coverage capacity, and enhancing water sector management practices and regulations. It is clear that climate change has the potential to compound issues of water security due to increasingly severe precipitation and drought events. However, the project as it is described in the proposal appears to address the broad development challenge of ensuring access to clean water and does not specifically target the risks to water security that are directly attributable to projected climate impacts. A funded project focusing on large-scale ecosystem-based adaptation in the Gambia: The project is a response to widespread environmental degradation in the Gambia caused by a combination of natural climatic factors, anthropogenic climate change, and unsustainable land-use practices. The project will develop an ecosystem-based adaptation (EbA) programme, which will aim to sustainably use environmental resources to boost rural livelihoods. EbA projects at the community level will include interventions to restore priority degraded areas, reduce soil erosion, increase recharge of groundwater, and increase the supply of ecosystem goods such as timber, firewood, fruits, honey and handicrafts. The programme therefore appears to be both a conservation effort and a sustainable economic development programme, but it is not clear how it is specifically addressing the negative livelihood impacts attributable to climate change.
E. Other concerns about reporting on investment criteria The main criterion used in the initial decision of which projects to fund was their return on investment, including impact potential, paradigm shift, fit with sustainable development and country ownership. While most proposals fulfil the needs of these categories, there are some common concerns with impact potential (discussed above) and return on investment, which we discuss here. We have already discussed examples of when the assumptions made around reduction in CO2 emissions are likely to be overstated. In general, many proposals do not clearly state the assumptions surrounding take-up, adoption and use, that are necessary for calculations. In addition, the rigour of computations in the denominator is not made clear by most proposals. As discussed earlier, a common mistake is to believe that people will use the product or service exactly as it was designed. This issue is common with programmes that rely heavily on a designed product that targets a narrow concern, such as a clean cookstove. Relatedly, there is frequently no

25
discussion about economy-wide interventions13. For programmes that may change the price of items in a market, such as the cost of credit or the price of specific inputs such as wood for households, this could lead to an increased take-up in other services that are not climate friendly. This is commonly referred to as the ‘rebound effect’14. A classic example is that when clean cookstoves are introduced into communities the demand for wood can decrease, thus decreasing the price of wood. Other households that are not using the clean cookstoves may then increase their own purchases of wood. Rather than reducing the general use of wood, clean cookstoves may have no impact or even a positive (and hence deleterious) effect on total wood usage, and thus no impact on CO2 emissions.
F. Monitoring and evaluation systems Our final general item of concern is the lack of detail in the proposals about how the proposed M&E systems will work. We believe that the details of these systems are critical for understanding how well they will be able to identify and report the impacts that these programmes expect to deliver. Of the proposals reviewed, only 36.5% include a budget for M&E. Of those that do include a budget, the amounts are quite small compared to the overall programme budget. The total budget for M&E across all projects is USD 113.69 million. This is 0.7% of the total project/programme budget (USD 16.2 billion) (see Table 4 and Table 5). In general, these funds are not sufficient to understand implementation fidelity. Table 4: Summary statistics of the budget for M&E, January 2019
DESCRIPTION AMOUNT IN USD THOUSANDS
Minimum 100.0
Median 1,095.0
Average 3,344.0
Maximum 3,600.0
Sum 113,697.23
Source: IEU Database Table 5: M&E budget by type of project, January 2019
FOCUS INCLUDE M&E BUDGET(COUNT) PERCENT M&E BUDGET (USD MILLION)
Adaptation 20 472 40.93
Cross-cutting 8 33 69.64
Mitigation 6 20 3.13
Source: IEU Database We have three recommendations for addressing these issues. The first recommendation is for projects to have a more detailed description of how each programme will conduct best-practice M&E is needed. We discuss the standards for good-quality M&E systems in the next section. Each programme should think carefully about how they can ensure a robust M&E process. This will enable projects to
13 Also called general equilibrium effects 14 For instance, for a discussion of the rebound effect in practice, see https://www.theguardian.com/environment/blog/2011/feb/22/rebound-effect-climate-change.

26
understand effects and impacts as well as manage for risks and unanticipated changes in the context. Second, more resources should be placed into conducting good-quality M&E. This will enable the GCF to track implementation quality across each project and the total portfolio. Good rules of thumb are as follows: For small sized projects (< 10 million) is to consider a 3-5% budget; for mid-sized projects (10-50 million) consider 3-4% and for large projects, consider 1-2% of overall project budgets. Our third recommendation is to strengthen the line of secondary accountability, due diligence and monitoring that is conducted by the GCF. Monitoring of programmes is critical to ensure that each is meeting the investment criteria and proceeding as expected. Without proper oversight, there is a strong possibility that programmes could lose focus and not complete programming as expected. Indeed this analysis suggests that although large international agencies are proposing projects to the GCF, project theories of change, impact measurement, climate rationale and implementation fidelity are not being given their due importance. If this is occurring within the agencies themselves, given the GCF’s business model, it will be important for GCF to examine these in closer detail.
VI. STANDARDS FOR BEST-PRACTICE MONITORING Monitoring provides internal and external data, on a continuous basis, to inform programme teams about planned and actual developments, to detect irregularities or inefficiencies, and to make corrections in real time. Monitoring thus involves collecting data and analysing them to verify whether resources were used as intended, whether activities were implemented according to plan, whether intended beneficiaries were reached, and whether the expected products and services were delivered. Thus, effective monitoring needs to be part of any project, whether it will be evaluated or not. Monitoring also provides the foundation for evaluating the performance of an intervention. If no reliable information is available about the progress and quality of implementation, then any evaluation will be unable to make serious claims about what may have worked or not and, especially, why. The challenges in monitoring progress of an intervention are as follows:
• Defining the logic of the intervention, which includes setting goals beyond the project development objective on all levels of implementation and results.
• Identifying key indicators, data collection mechanisms, and assumptions that can be used to monitor progress against these goals.
• Establishing a monitoring and reporting system to track progress towards achieving established targets and to inform project managers and other stakeholders.
A TOC is usually encapsulated in any programme design. There is an expectation that the introduction of a project will help ameliorate the living conditions of the target group by addressing a specific set of barriers and constraints the group is facing. That is, we have a set of assumptions about how and why particular resources and project activities will bring about changes for the better. See Annex A.5 for some additional advice on TOCs. In the Annex we also discuss additional steps for good monitoring that are a pre-requisite for any high-quality organization. These include steps related to data collection and articulating risks and assumptions. That said, monitoring does not give the basis for attribution and causality for change. The monitoring data does not provide evidence of how changes are coming about, only that they are or are not occurring. Likewise, monitoring data, in and of themselves, cannot address the strengths and weaknesses in the design of the project. Consequently, to address these and other important questions regarding the generation of appropriate results and information on evaluation is necessary – the “E” in M&E (Kusek & Rist, 2004).

27
VII. NEXT STEPS We propose four main next steps for the funding proposals that have been approved for investments by GCF. Our first proposed next step is to ensure a more comparable picture across projects so that a proper assessment of the entire portfolio can be made. To do this, we propose a common reporting framework be used. This is necessary as many of the proposals are inconsistent in the information they provide, and so comparisons of projects are often difficult. Our second proposal is that organizations should seriously consider the individual (from the assessments) and broader (from Section V) critiques of what is lacking in the proposals. For instance, most proposals could benefit from increased focus on their TOC. A TOC workshop, either within an organization or across multiple organizations, could greatly improve understanding of whether a programme can have the intended impacts. Third, we propose that the GCF ask for impact evaluations to be included in at least 30% of its portfolio. This will accomplish multiple goals. It will provide important learning for these programmes. It will also enable the GCF to better understand how well the portfolio of programmes can reach the investment criteria. It will also provide a demonstration for other programmes and organizations of the value of impact evaluation. This could then lead to increased excitement about programme learning and lead to an even better understanding of how well the GCF portfolio can meet the investment criteria. Only a very small number of proposals mention or note the need for impact evaluation to understand the impacts of the programme and whether these impacts can be attributed to programming. Learning about the impact of a programme is important for understanding if the investment criteria are being met, and for ensuring that the programme is learning about the best way to implement their activities. Finally, we propose that the GCF strengthen the line of secondary accountability, due diligence and monitoring of these programmes. Monitoring of programmes is critical to ensure that each is meeting the investment criteria and proceeding as expected. Without proper oversight, there is a strong possibility that programmes could lose focus and not complete programming as expected.

28
REFERENCES Barooah, B., Kaushish, B., Puri, J. & Leach, B. (2017). Understanding financial agricultural risk for
smallholder farmers in developing countries: what do we know and not know?, 3ie Evidence Gap Map Report 9, New Delhi: International Initiative for Impact Evaluation (3ie)
Gertler, Paul, Sebastian Martinez, Patrick Premand, Laura B. Rawlings, Christel M. J. Vermeersch (2016). Impact Evaluation in Practice, Second Edition, Washington, DC: World Bank.
Jimenez, E. & Puri, J. (2017). The Wicked Cases of Education and Climate Change: The Promise and Challenge of Theory-Based Impact Evaluations. In Evaluation for Agenda 2030: Providing Evidence on Progress and Sustainability, edited by Rob D. van den Berg, Indran Naidoo and Susan D. Tamondong
Kusek, J. Z & Rist, R. C. (2004). Ten Steps to a Results-Based Monitoring and Evaluation System: A Handbook for Development Practitioners, Washington, DC: World Bank
Lawry, S., Cyrus, S., Hall, R., Leopold, A., Hornby, D. & Mtero, F. (2016). The Impact of Property Rights Interventions on Investment and Agricultural Productivity in Developing Countries: A Systematic Review, Journal of Development Effectiveness, 9(1):61-8
Miller, G., Mobarak, A.M. (2013). Gender Differences in Preferences, Intra-Household Externalities, and Low Demand for Improved Cookstoves. NBER Working Paper No. 18964
Rogers, E. (2003). The Diffusion of Innovations, Fifth Edition, The Free Press: New York Shapiro, N.S., Levine, J.J. (1999). Creating learning communities: a practical guide to winning
support, organizing for change, and implementing programs, San Francisco: Jossey-Bass TIPS #11: The Role of Evaluation in USAID (1997). Centre for Development Information and
Evaluation. Available at https://www.betterevaluation.org/pt/node/1064
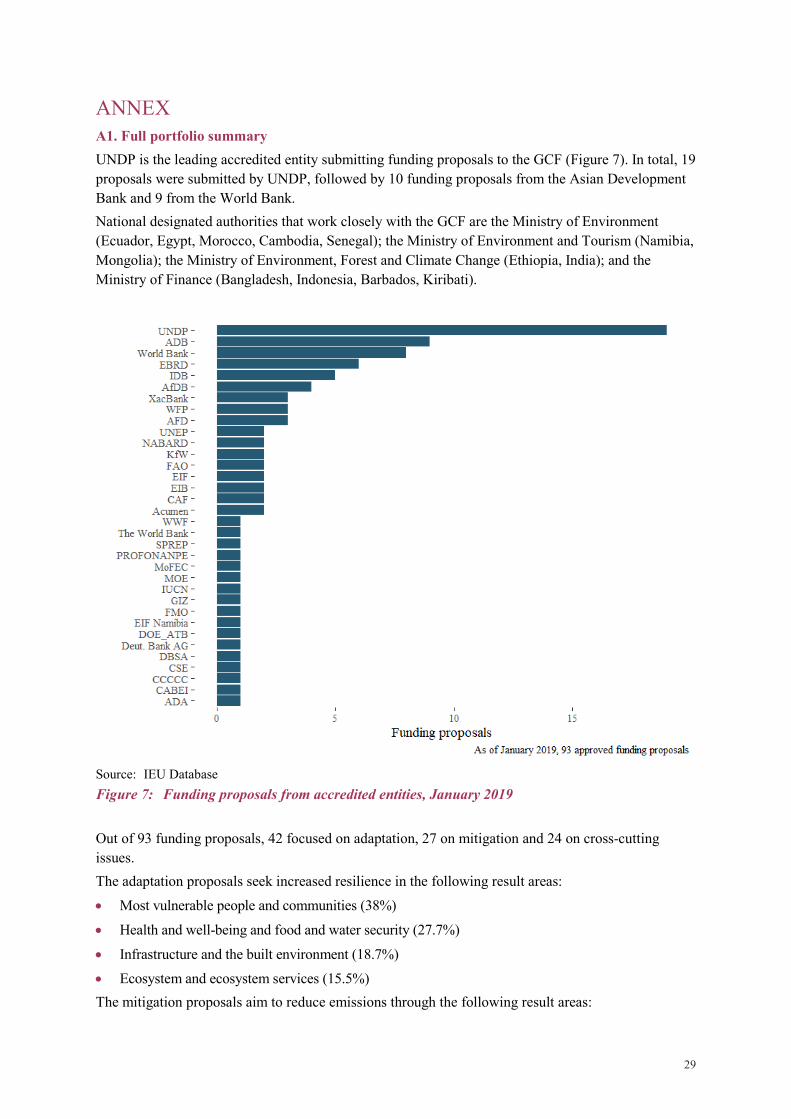
29
ANNEX A1. Full portfolio summary UNDP is the leading accredited entity submitting funding proposals to the GCF (Figure 7). In total, 19 proposals were submitted by UNDP, followed by 10 funding proposals from the Asian Development Bank and 9 from the World Bank. National designated authorities that work closely with the GCF are the Ministry of Environment (Ecuador, Egypt, Morocco, Cambodia, Senegal); the Ministry of Environment and Tourism (Namibia, Mongolia); the Ministry of Environment, Forest and Climate Change (Ethiopia, India); and the Ministry of Finance (Bangladesh, Indonesia, Barbados, Kiribati).
Source: IEU Database Figure 7: Funding proposals from accredited entities, January 2019 Out of 93 funding proposals, 42 focused on adaptation, 27 on mitigation and 24 on cross-cutting issues. The adaptation proposals seek increased resilience in the following result areas: • Most vulnerable people and communities (38%)
• Health and well-being and food and water security (27.7%)
• Infrastructure and the built environment (18.7%) • Ecosystem and ecosystem services (15.5%) The mitigation proposals aim to reduce emissions through the following result areas:

30
• Energy access and power generation (44.9%)
• Low-emission transport (7.2%)
• Buildings, cities and industries and appliances (26%) • Forest and land use (21.7%) Further breakdowns are provided in Figure 8, Figure 9 and Figure 10.
Source: IEU Database Figure 8: Result areas for GCF-funded projects, January 2019
Source: IEU Database Figure 9: Result areas for adaptation projects by region, January 2019

31
Source: IEU Database Figure 10: Result areas for mitigation projects by region, January 2019
Source: IEU Database Figure 11: Focus of the 93 GCF-funded projects, January 2019

32
The total investment from all sources for all proposals is USD 16.2 billion (Table 6 and Figure 12). Asia–Pacific and Africa are the regions receiving the largest amounts, with USD 4.8 billion and USD 3.7 billion respectively. The total amount committed by the GCF is USD 4.7 billion. GCF funding will cover 29% of the total finance required.
Source: IEU Database Figure 12: Comparison between GCF investment with Co-financing, January 2019 Table 6: Comparison between GCF investment with total amount of the projects, January 2019
REGION GCF INVESTMENT (IN MILLION $) TOTAL AMOUNT (IN MILLION $)
Africa 1,172.4 3,655.3
Asia-Pacific 1,526.8 4,791.9
Eastern Europe 64.4 222.68
Global 1,196.04 4,458.6
Latin America & Caribbean 825.7 3,094.4
Total 4,785.3 16,222.9
Source: IEU Database The distribution of total investment for mitigation, adaptation and cross-cutting FPs is shown in Figure 13. Investment is right-skewed for projects across all three focus areas, but the investment range is greater for mitigation-focused than adaptation-focused projects, and even more so, for cross-cutting projects. Large total investment values are disproportionately common amongst projects spanning multiple geographic regions.

33
Source: IEU Database Figure 13: Distribution of total investment by GCF focus areas, January 2019 Figure 14 displays the number of expected beneficiaries of funded projects across GCF regions. From the boxplot we visualise outliers (the points above upper whisker or 1.5 times the interquartile range) and the distribution of expected beneficiaries of projects. The region with the largest proportion of its population expected to benefit from FPs is Africa (6.8%), followed by Asia-Pacific (5.9%).

34
Source: IEU Database Figure 14: Beneficiaries of funded projects across GCF regions, January 2019 Table 7: Affected land in hectares by region, January 2019
REGION AFFECTED LAND (HA)
Africa 1,219,002.0
Asia-Pacific 112,705.0
Eastern Europe 3,000.0
Latin America & Caribbean 799,685.8
Total 2,134,392.8
Source: IEU Database A.2. Additional findings The number of funding proposals approved by the Board have increased significantly (Figure 15), from 7 funding proposals in year 2015 (B.11) to 93 funding proposals by January 2019 (B.21).

35
Source: IEU Database Figure 15: Cumulative number of approved funding proposals, January 2019 Of the GCF funding proposals, 77.4% have international access modality and 22.5% have direct access modality. Figure 16 shows that the largest proportion of FPs are Medium in size (38%), with 28% Small, 16% Large and the remaining 11% Micro. These size categories are defined by the FPs total investment in USD millions. When each size category is disaggregated by the focus of the funded project (Figure 17), we see that adaptation projects make up the largest proportion of micro, small and medium projects, but mitigation projects dominate amongst large projects.
Source: IEU Database Figure 16: Approved funding proposals by size category, January 2019

36
Source: IEU Database Figure 17: Number of FPs size and focus, January 2019 Priority countries are countries classified as least developed countries (LDCs) by the United Nations, small island developing states (SIDS) and African states, due to their limited capacity to respond to climate change and adapt to its adverse effects. Of the 93 submitted funding proposals, 20 are from small island developing states (SIDS), 34 from least developing countries (LDCs) and 35 from African States. The total finance for funding proposals in each of these categories, as well as the total amount of finance requested from the GCF, respectively, is outlined in Table 8. Table 8: Description of approved funding proposals by priority countries, January 2019
PRIORITY NO. OF PROJECTS TOTAL INVESTMENT (MILL USD) GCF INVESTMENT (MILL USD)
LDCs 34 5,065.5 1,789.05
SIDS 20 3,140.8 1,179.6
African States 35 7,369.9 2,188.5
Note: Please note that some countries can exist in more than one category Source: IEU Database

37
Source: IEU Database Figure 18: Distribution of GCF investment by priority countries, January 2019 Table 9 presents the implementation lifespan/length of the funded projects, along with their respective total investment and mitigation impacts. The FPs of greatest length, i.e. those with an implementation period of more than 14 years, both receive the greatest average total investment and are expected to reduce the amount of carbon dioxide equivalent emitted by the most, per project. However, the FPs with the smallest average total investment amount per project are not those with the shortest implementation period, rather FPs of length 11 – 14 years. Table 9: Description of implementation length category, January 2019
LENGTH CATEGORY NO. OF PROPOSALS TOTAL INVESTMENT (MILL USD) EXPECTED MILLION TCO2 EQ TO BE REDUCED
Less than 5 10 502.2 3.23
5~8 53 5,523.9 182.05
8~11 11 1,758.1 218.31
11~14 3 284.3 36.6
Greater than 14 16 8,154.4 1,127.5
Source: IEU Database

38
Table 10: Description of beneficiaries and expected tCO2e to be reduced by country classification, January 2019
PRIORITY INVESTMENT IN USD MILLION
BENEFICIARIES IN THOUSANDS
EXPECTED MILLION TCO2 E REDUCED
COST PER BENEFICIARY IN USD
COST PER TCO2 EQ IN USD
LDCs 5065.52 149833.66 1006.55 33.81 5.03
SIDS 3140.81 52965.37 825.33 59.30 3.81
African States
7369.91 132112.98 1075.45 55.78 6.85
Source: IEU Database A.3. Adaptation and cross-cutting projects/programmes The main objectives of adaptation projects/programmes are to increase climate-resilience and sustainable development by enhancing the livelihoods of the most vulnerable people, communities and regions; increasing health and well-being; and providing food and water security. The total investment for adaptation projects is USD 2,927.92 million, of which USD 1,174.46 million is requested from the GCF (Table 11). 63% of all the FPs provide the total number of direct and indirect beneficiaries disaggregated by gender, while 26% of the funding proposals did not provide information pertaining to the disaggregation of beneficiaries by gender. Table 11: Description of adaptation and cross-cutting projects, January 2019
FOCUS TOTAL INVESTMENT (USD MILLION)
GCF COMMITTED AMOUNT (USD MILLION)
Adaptation 2,927.92 1,174.46
Cross-cutting 5,452.45 1,705.84
Source: IEU Database Of the amount committed by the GCF for adaptation and cross-cutting projects/programmes, USD 1,242.91 million was approved for LDC funding proposals and USD 749.62 million was approved for SIDS funding proposals (Table 12). The adaptation and cross-cutting projects are expected to benefit 108.05, 11.33 and 90.28 million people in LDCs, SIDS and African States, respectively. Table 12: Total investment and GCF committed amount for adaptation and cross-cutting projects,
January 2019
PRIORITY TOTAL INVESTMENT (USD MILLION)
GCF COMMITTED AMOUNT (USD MILLION)
BENEFICIARIES (THOUSANDS)
LDCs 2,873.77 1242.91 108.05
SIDS 1875.56 749.62 11.33
African states 3979.77 1459.41 90.28
Note: Please note that some countries can exist in more than one category Source: IEU Database

39
The minimum implementation period for adaptation and cross-cutting projects is 3.5 years, with a mean implementation period of 6.4 years and a maximum length of 15 years (Figure 19) .
Source: IEU Database Figure 19: Implementation length for adaptation and cross-cutting projects, January 2019 A.4. Stoplight results and proposal assessments Table 13: Comparing stoplight results across focus areas, January 2019
ADAPTATION MITIGATION CROSS-CUTTING
Theory of change and discussion of causal pathways
What is the quality of the (implicit or explicit) theories of change and programme logic?
% low risk 32 41 48
% medium risk 44 33 36
% high risk 24 26 16
Are unintended consequences referred to and identified robustly in the programme theory of change and/or in the surrounding literature reviews?
% low risk 44 33 76
% medium risk 39 48 12
% high risk 17 19 12
Are causal pathways clearly identified and discussed?
% low risk 24 41 44
% medium risk 39 44 44
% high risk 37 15 12
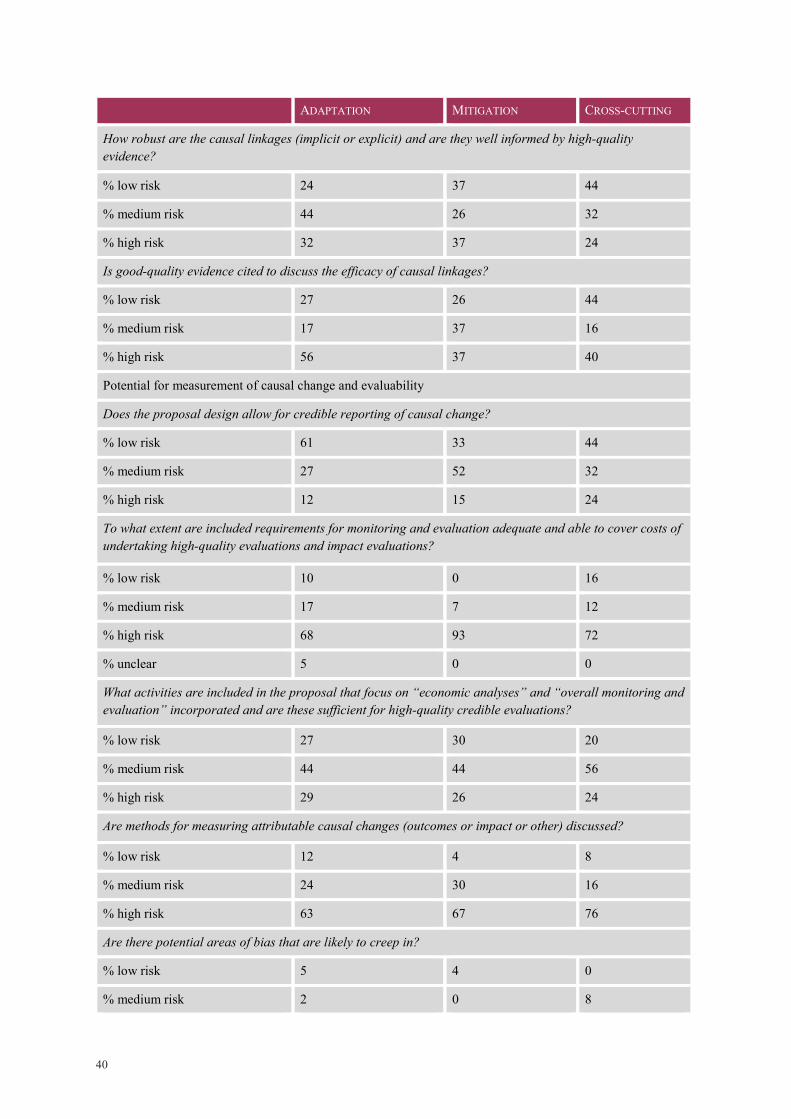
40
ADAPTATION MITIGATION CROSS-CUTTING
How robust are the causal linkages (implicit or explicit) and are they well informed by high-quality evidence?
% low risk 24 37 44
% medium risk 44 26 32
% high risk 32 37 24
Is good-quality evidence cited to discuss the efficacy of causal linkages?
% low risk 27 26 44
% medium risk 17 37 16
% high risk 56 37 40
Potential for measurement of causal change and evaluability
Does the proposal design allow for credible reporting of causal change?
% low risk 61 33 44
% medium risk 27 52 32
% high risk 12 15 24
To what extent are included requirements for monitoring and evaluation adequate and able to cover costs of undertaking high-quality evaluations and impact evaluations?
% low risk 10 0 16
% medium risk 17 7 12
% high risk 68 93 72
% unclear 5 0 0
What activities are included in the proposal that focus on “economic analyses” and “overall monitoring and evaluation” incorporated and are these sufficient for high-quality credible evaluations?
% low risk 27 30 20
% medium risk 44 44 56
% high risk 29 26 24
Are methods for measuring attributable causal changes (outcomes or impact or other) discussed?
% low risk 12 4 8
% medium risk 24 30 16
% high risk 63 67 76
Are there potential areas of bias that are likely to creep in?
% low risk 5 4 0
% medium risk 2 0 8

41
ADAPTATION MITIGATION CROSS-CUTTING
% high risk 93 96 92
Implementation fidelity and performance against investment criteria
Are eligibility and targeting criteria well articulated in submitted documents?
% low risk 68 37 52
% medium risk 22 30 36
% high risk 10 33 12
Is there adequate and reliable information included in the proposal regarding implementation fidelity?
% low risk 80 74 92
% medium risk 15 15 8
% high risk 5 11 0
To what extent is impact potential identifiable and measurable in the proposal?
% low risk 34 37 44
% medium risk 32 44 44
% high risk 27 11 8
% unclear 7 7 4
To what extent is paradigm shift potential identifiable and measurable in the proposal?
% low risk 24 44 64
% medium risk 37 33 20
% high risk 39 22 16
How well are other GCF investment criteria informed and are these measurable and verifiable with high credibility and quality?
% low risk 29 41 36
% medium risk 41 44 52
% high risk 29 15 12
Data collection and reporting credibility
Are current reporting requirements sufficient for regular M&E?
% low risk 22 11 24
% medium risk 51 37 60
% high risk 27 52 16
How likely is it that progress on investment criteria can be measured credibly, given M&E plans, budget, and indicators for investment criteria?
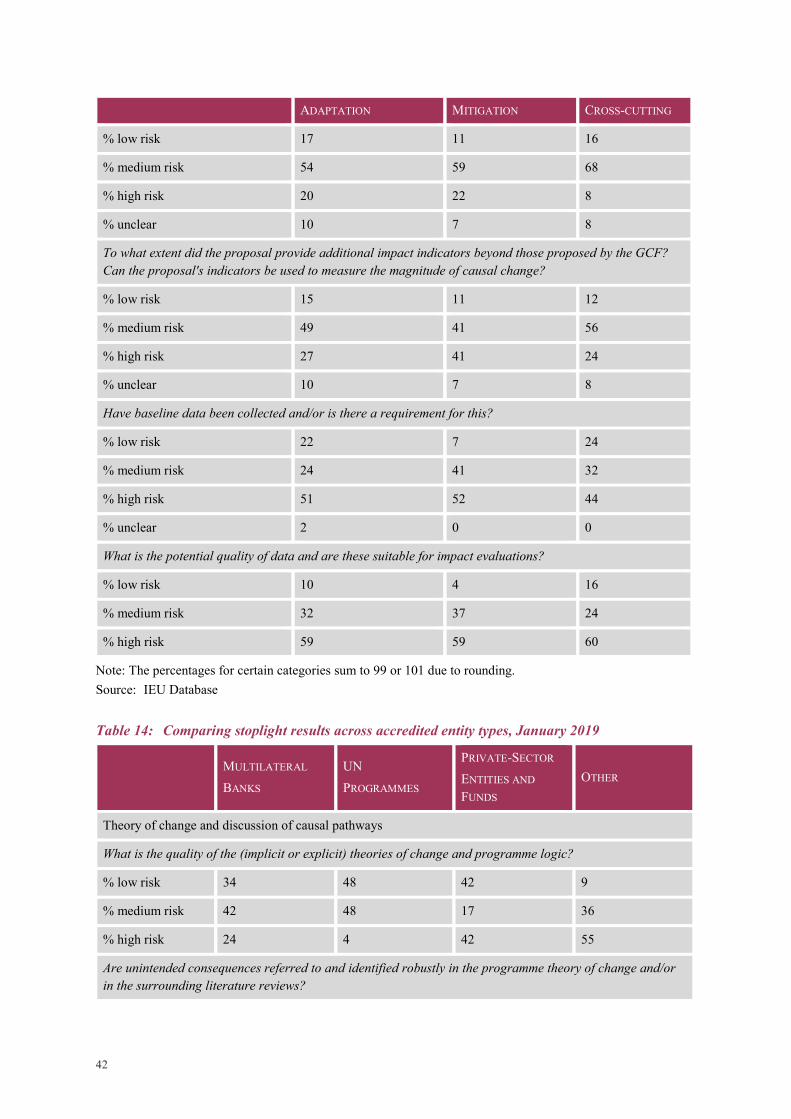
42
ADAPTATION MITIGATION CROSS-CUTTING
% low risk 17 11 16
% medium risk 54 59 68
% high risk 20 22 8
% unclear 10 7 8
To what extent did the proposal provide additional impact indicators beyond those proposed by the GCF? Can the proposal's indicators be used to measure the magnitude of causal change?
% low risk 15 11 12
% medium risk 49 41 56
% high risk 27 41 24
% unclear 10 7 8
Have baseline data been collected and/or is there a requirement for this?
% low risk 22 7 24
% medium risk 24 41 32
% high risk 51 52 44
% unclear 2 0 0
What is the potential quality of data and are these suitable for impact evaluations?
% low risk 10 4 16
% medium risk 32 37 24
% high risk 59 59 60
Note: The percentages for certain categories sum to 99 or 101 due to rounding. Source: IEU Database Table 14: Comparing stoplight results across accredited entity types, January 2019
MULTILATERAL BANKS
UN PROGRAMMES
PRIVATE-SECTOR ENTITIES AND
FUNDS OTHER
Theory of change and discussion of causal pathways
What is the quality of the (implicit or explicit) theories of change and programme logic?
% low risk 34 48 42 9
% medium risk 42 48 17 36
% high risk 24 4 42 55
Are unintended consequences referred to and identified robustly in the programme theory of change and/or in the surrounding literature reviews?
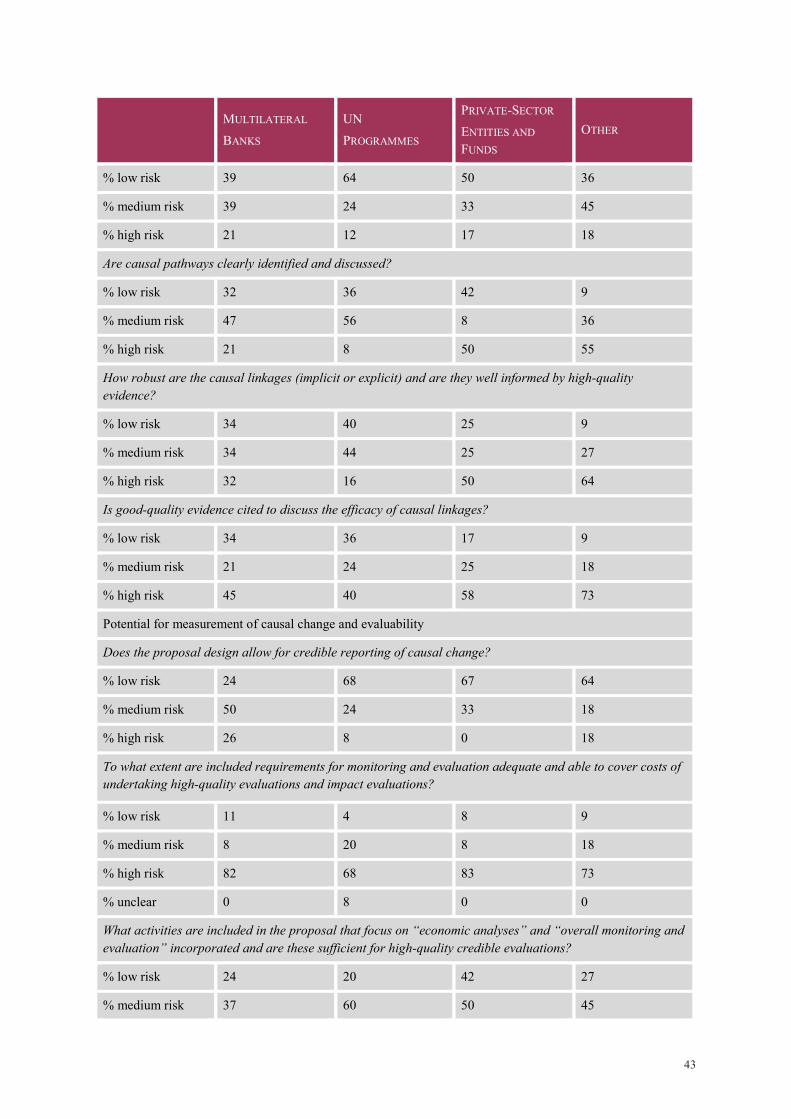
43
MULTILATERAL BANKS
UN PROGRAMMES
PRIVATE-SECTOR ENTITIES AND FUNDS
OTHER
% low risk 39 64 50 36
% medium risk 39 24 33 45
% high risk 21 12 17 18
Are causal pathways clearly identified and discussed?
% low risk 32 36 42 9
% medium risk 47 56 8 36
% high risk 21 8 50 55
How robust are the causal linkages (implicit or explicit) and are they well informed by high-quality evidence?
% low risk 34 40 25 9
% medium risk 34 44 25 27
% high risk 32 16 50 64
Is good-quality evidence cited to discuss the efficacy of causal linkages?
% low risk 34 36 17 9
% medium risk 21 24 25 18
% high risk 45 40 58 73
Potential for measurement of causal change and evaluability
Does the proposal design allow for credible reporting of causal change?
% low risk 24 68 67 64
% medium risk 50 24 33 18
% high risk 26 8 0 18
To what extent are included requirements for monitoring and evaluation adequate and able to cover costs of undertaking high-quality evaluations and impact evaluations?
% low risk 11 4 8 9
% medium risk 8 20 8 18
% high risk 82 68 83 73
% unclear 0 8 0 0
What activities are included in the proposal that focus on “economic analyses” and “overall monitoring and evaluation” incorporated and are these sufficient for high-quality credible evaluations?
% low risk 24 20 42 27
% medium risk 37 60 50 45

44
MULTILATERAL BANKS
UN PROGRAMMES
PRIVATE-SECTOR ENTITIES AND FUNDS
OTHER
% high risk 39 20 8 27
Are methods for measuring attributable causal changes (outcomes or impact or other) discussed?
% low risk 8 4 17 9
% medium risk 21 32 17 27
% high risk 71 64 67 64
Are there potential areas of bias that are likely to creep in?
% low risk 3 8 0 0
% medium risk 3 4 0 0
% high risk 95 88 100 100
Implementation fidelity and performance against investment criteria
Are eligibility and targeting criteria well articulated in submitted documents?
% low risk 39 92 58 36
% medium risk 32 8 33 36
% high risk 29 0 8 27
Is there adequate and reliable information included in the proposal regarding implementation fidelity?
% low risk 71 84 92 91
% medium risk 18 16 8 0
% high risk 11 0 0 9
To what extent is impact potential identifiable and measurable in the proposal?
% low risk 39 40 17 18
% medium risk 39 36 50 45
% high risk 13 12 33 36
%unclear 8 12 0 0
To what extent is paradigm shift potential identifiable and measurable in the proposal?
% low risk 47 36 25 18
% medium risk 37 32 25 36
% high risk 16 32 50 45
How well are other GCF investment criteria informed and are these measurable and verifiable with high credibility and quality?
% low risk 24 36 50 36

45
MULTILATERAL BANKS
UN PROGRAMMES
PRIVATE-SECTOR ENTITIES AND FUNDS
OTHER
% medium risk 53 48 25 36
% high risk 24 16 25 27
Data collection and reporting credibility
Are current reporting requirements sufficient for regular M&E?
% low risk 16 12 33 18
% medium risk 55 56 42 55
% high risk 29 32 25 27
How likely is it that progress on investment criteria can be measured credibly, given M&E plans, budget, and indicators for investment criteria?
% low risk 16 12 8 9
% medium risk 55 60 75 73
% high risk 21 16 17 18
% unclear 8 12 0 0
To what extent did the proposal provide additional impact indicators beyond those proposed by the GCF? Can the proposal's indicators be used to measure the magnitude of causal change?
% low risk 11 20 0 0
% medium risk 39 52 83 64
% high risk 42 16 17 36
% unclear 8 12 0 0
Have baseline data been collected and/or is there a requirement for this?
% low risk 16 24 0 18
% medium risk 26 40 42 27
% high risk 58 32 58 55
% unclear 0 4 0 0
What is the potential quality of data and are these suitable for impact evaluations?
% low risk 13 4 0 9
% medium risk 26 36 58 27
% high risk 61 60 42 64
Note: The percentages for certain categories sum to 99 or 101 due to rounding Source: IEU Database

46
Table 15: Stoplight summary, January 2019
SHARE OF PROPOSALS IN EACH RISK CATEGORY, BY ASSESSMENT CRITERIA
% Low risk
% Medium risk
% High risk
% Unclear
Theory of change and discussion of causal pathways
What is the quality of the (implicit or explicit) theories of change and programme logic?
39 39 23 0
Are unintended consequences referred to and identified robustly in the programme theory of change and/or in the surrounding literature reviews?
49 34 16 0
Are causal pathways clearly identified and discussed? 34 42 24 0
How robust are the causal linkages (implicit or explicit) and are they well informed by high quality evidence?
33 35 31 0
Is good quality evidence cited to discuss the efficacy of causal linkages?
31 23 46 0
Potential for measurement of causal change and evaluability
Does the proposal design allow for credible reporting of causal change?
48 35 16 0
To what extent are included requirements for monitoring and evaluation adequate and able to cover costs of undertaking high quality evaluations and impact evaluations?
9 13 76 2
What activities are included in the proposal that focuses on “economic analyses” and “overall monitoring and evaluation” incorporated and are these sufficient for high quality credible evaluations?
26 47 27 0
Are methods for measuring attributable causal changes (outcomes or impact or other) discussed?
9 24 68 0
Are there potential areas of bias that are likely to creep in? 3 3 94 0
Implementation fidelity and performance against investment criteria
Is there adequate and reliable information included in the proposal regarding implementation fidelity?
55 28 17 0
Are eligibility and targeting criteria well-articulated in submitted documents?
82 13 5 0
To what extent is impact potential identifiable and measurable in the proposal?
38 39 17 6
To what extent is paradigm shift potential identifiable and measurable in the proposal?
41 31 28 0
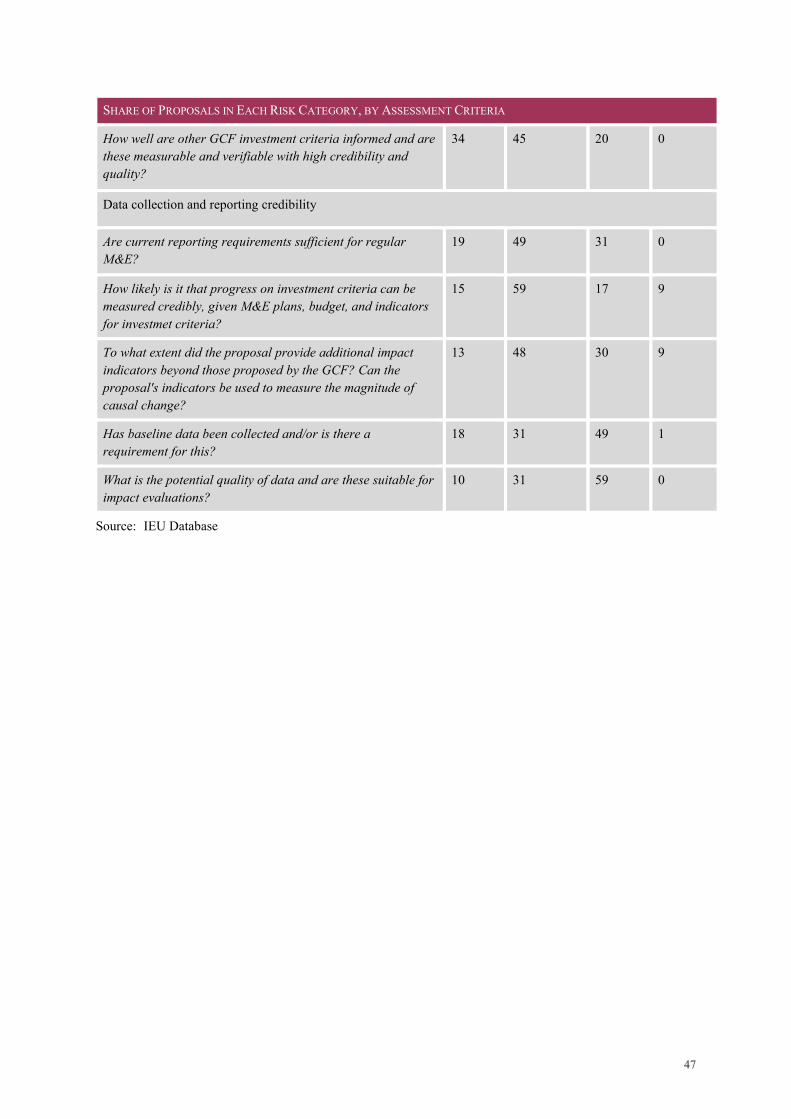
47
SHARE OF PROPOSALS IN EACH RISK CATEGORY, BY ASSESSMENT CRITERIA
How well are other GCF investment criteria informed and are these measurable and verifiable with high credibility and quality?
34 45 20 0
Data collection and reporting credibility
Are current reporting requirements sufficient for regular M&E?
19 49 31 0
How likely is it that progress on investment criteria can be measured credibly, given M&E plans, budget, and indicators for investmet criteria?
15 59 17 9
To what extent did the proposal provide additional impact indicators beyond those proposed by the GCF? Can the proposal's indicators be used to measure the magnitude of causal change?
13 48 30 9
Has baseline data been collected and/or is there a requirement for this?
18 31 49 1
What is the potential quality of data and are these suitable for impact evaluations?
10 31 59 0
Source: IEU Database

48
Table 16: Detailed table showing proposal-by-proposal assessment and reasons for assessment, January 2019
PROPOSAL
NUMBER IMPLEMENTOR
PERIOD OF
FUNDING
COUNTRY (IES)
FUNDING AMOUNT
(USD MILLION)
TOC CAUSAL LINKAGES
TARGETING INVESTMENT CRITERIA
IMPACT EVALUATION
DESIGN
FP001 Profonanpe 03/2016 to 02/2021
Peru 6.24 TOC has significant gaps/weaknesses that need to be addressed. Key assumptions need to be verified.
No discussion of how to connect causal changes.
Assumptions about how activities will reach particular beneficiaries are not verified through a clear targeting strategy.
Gaps in the TOC limit the apparent impact and sustainable development potential of the project. Paradigm shift potential will be low simply due to the scale of the project.
Randomly assign 120 of the 284 centres to receive the project interventions and monitor outcomes over time.
FP002 UNDP 04/2016 to 03/2022
Malawi 12.295 TOC is strong overall, but several details are missing. See proposal assessment for a full discussion.
No discussion of how to connect causal changes.
Targeting criteria are clear. Clear how programme will achieve its targeting goals.
Overall performance against investment criteria is strong. Would be further strengthened if key details were clarified. See proposal assessment for a full discussion.
RCT of information-related interventions. There is potential for multiple RCTs of different project activities. For example, evaluating the impact of the project on fisherman, evaluating impact of flood-warnings on different outcomes, or similar evaluations for farmers and key agricultural indicators.

49
PROPOSAL NUMBER
IMPLEMENTOR PERIOD OF FUNDING
COUNTRY (IES)
FUNDING AMOUNT (USD MILLION)
TOC CAUSAL LINKAGES
TARGETING INVESTMENT CRITERIA
IMPACT EVALUATION DESIGN
Mobile technology will likely allow for individual level randomization.
FP003 Centre de Suivi Ecologique
02/2016 to 02/2020
Senegal 7.6 TOC is missing. No discussion of how to connect causal changes.
Targeting criteria are clear, but there is no evidence that demonstrates that targeted areas actually meet the criteria.
Omission of a TOC limits our ability to adequately assess impact, sustainable development, paradigm shift potential, and cost-effectiveness. Needs of beneficiaries are not clearly demonstrated with credible evidence.
RCT of various project activities is possible. Proposal mentions that the number of potential beneficiaries exceeds the number of beneficiaries that the project will be able to support. Perhaps a lottery could be used to assign treatment.
FP004 KfW 04/2016 to 03/2022
Bangladesh 40 TOC is missing. No discussion of how to connect causal changes.
Targeting criteria and targeting plan are clear for some project activities but not all.
Omission of a TOC limits our ability to adequately assess impact, sustainable development, paradigm shift potential, and cost-effectiveness. Country ownership is strong.
Need to explore the possibility of creating or identifying valid comparison groups. Experimental assignment of treatment may be difficult given the unit of assignment of many project activities, but

50
PROPOSAL NUMBER
IMPLEMENTOR PERIOD OF FUNDING
COUNTRY (IES)
FUNDING AMOUNT (USD MILLION)
TOC CAUSAL LINKAGES
TARGETING INVESTMENT CRITERIA
IMPACT EVALUATION DESIGN
there could be potential for an IE that uses matching techniques.
FP005 Acumen Unclear Kenya, Rwanda, and Uganda
25 No comprehensive diagram or single explanation, but implicit TOC/logic framework are plausible.
No discussion of how to connect causal changes.
Targeting criteria are generally clear but more detail is needed to understand how investment decisions will be made.
Overall performance against investment criteria is strong.
Evaluation strategies will need to be adapted to the context of each individual investment. Each project that is invested in should pre-specify an experimental or quasi-experimental evaluation plan.
FP006 Inter-American Development Bank
Unclear Mexico, Colombia, Jamaica, Dominican Republic
217 TOC is missing. No discussion of how to connect causal changes.
Targeting criteria for countries is unclear. Targeting criteria for individual project investments is clear.
Overall performance against investment criteria is strong. High paradigm shift potential. Low country ownership.
Evaluate mitigation outcomes against BAU emissions scenario.
FP007 UNDP 02/2016 to 02/2021
Maldives 23.636 TOC is clear and thorough.
Some discussion of causal linkages,
Targeting criteria are clear. Clear how programme
Overall performance against investment criteria is strong.
RCT or difference-in-differences approaches are feasible, assigning treatment to different

51
PROPOSAL NUMBER
IMPLEMENTOR PERIOD OF FUNDING
COUNTRY (IES)
FUNDING AMOUNT (USD MILLION)
TOC CAUSAL LINKAGES
TARGETING INVESTMENT CRITERIA
IMPACT EVALUATION DESIGN
but no evaluation approach is discussed.
will achieve its targeting goals.
island communities in the Maldives.
FP008 Asian Development Bank
07/2016 to 06/2023
Fiji 31.04 TOC is missing. No discussion of how to connect causal changes.
Targeting criteria are clear. Clear how programme will achieve its targeting goals.
Country ownership and paradigm shift potential are high. Cost-effectiveness and impact potential are difficult to assess due to a lack of clearly defined impact indicators and the omission of a comprehensive TOC.
Unclear if a credible IE is possible given that the project is a systems-level intervention to improve water access and sewage management. Implementing entities should explore the possibility of varying the rollout of project activities/access to project inputs over space and/or time in a way that creates a valid counterfactual.
FP009 Inter-American Development Bank
09/2016 to 08/2021
El Salvador 21.7 TOC is missing. No discussion of how to connect causal changes.
Targeting criteria are unclear.
Overall performance against investment criteria is poor.
Evaluation strategies will need to be adapted to the context of each individual investment. Each project that is invested

52
PROPOSAL NUMBER
IMPLEMENTOR PERIOD OF FUNDING
COUNTRY (IES)
FUNDING AMOUNT (USD MILLION)
TOC CAUSAL LINKAGES
TARGETING INVESTMENT CRITERIA
IMPACT EVALUATION DESIGN
in should pre-specify an experimental or quasi-experimental evaluation plan.
FP010 UNDP 09/2016 to 08/2022
Armenia 20 No comprehensive diagram or single explanation, but implicit TOC/logic framework are plausible.
No discussion of how to connect causal changes.
Targeting criteria are clear. Clear how programme will achieve its targeting goals.
Overall performance against investment criteria is strong.
Comparison of mitigation outcomes against a BAU scenario. RCT of conditional grant for EE retrofitting intervention.
FP011 UN Environment Programme
01/2017 to 12/2022
The Gambia 20.5 TOC is missing. Implicit TOC has gaps discussed in full assessment.
No discussion of how to connect causal changes.
Targeting criteria are clear. Clear how programme will achieve its targeting goals.
Country ownership is high. Needs of recipients are clearly described. Other investment criteria are at risk due to gaps in TOC.
Multi-pronged RCT at the community level testing the impact of Component 1, Component 2, and a combination of both.
FP012 World Bank 01/2017 to 12/2020
Mali 22.75 TOC is missing. Implicit TOC has gaps discussed in full assessment.
No discussion of how to connect causal changes.
Targeting strategy is unclear. National implementation does not match needs of the
Country ownership is high. Other investment criteria are at risk due to gaps in TOC and targeting strategy.
A nationwide RCT of information-related treatments.
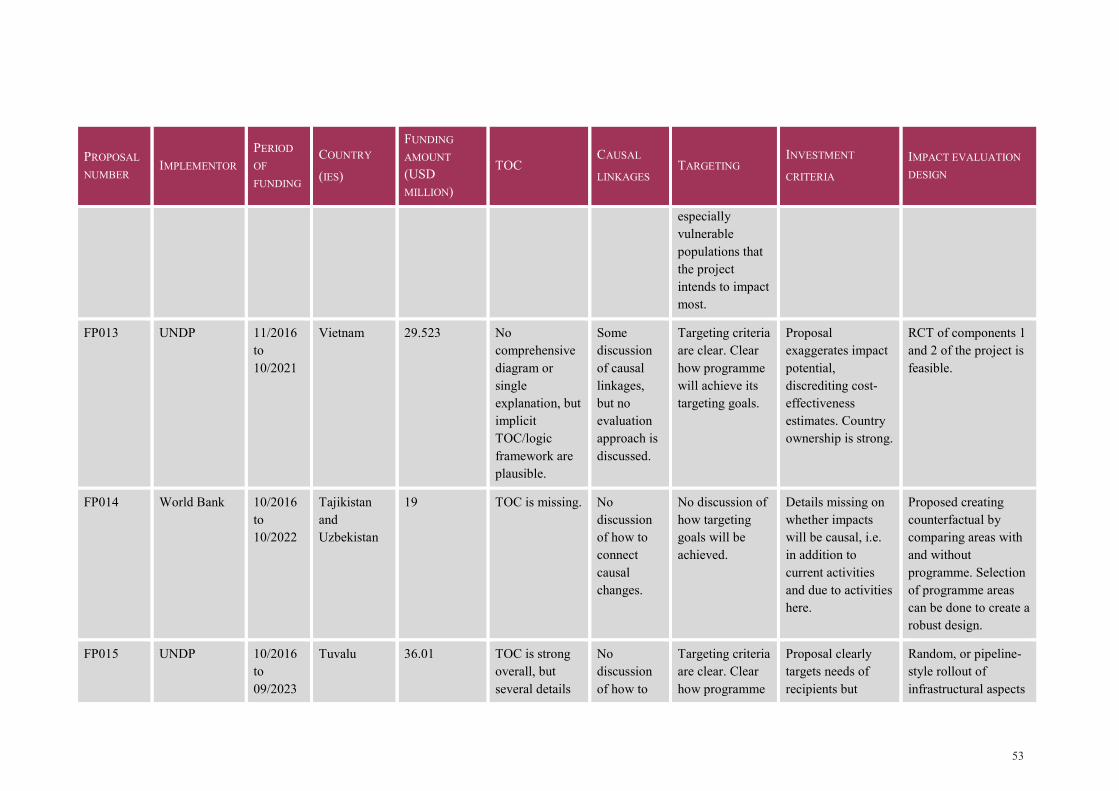
53
PROPOSAL NUMBER
IMPLEMENTOR PERIOD OF FUNDING
COUNTRY (IES)
FUNDING AMOUNT (USD MILLION)
TOC CAUSAL LINKAGES
TARGETING INVESTMENT CRITERIA
IMPACT EVALUATION DESIGN
especially vulnerable populations that the project intends to impact most.
FP013 UNDP 11/2016 to 10/2021
Vietnam 29.523 No comprehensive diagram or single explanation, but implicit TOC/logic framework are plausible.
Some discussion of causal linkages, but no evaluation approach is discussed.
Targeting criteria are clear. Clear how programme will achieve its targeting goals.
Proposal exaggerates impact potential, discrediting cost-effectiveness estimates. Country ownership is strong.
RCT of components 1 and 2 of the project is feasible.
FP014 World Bank 10/2016 to 10/2022
Tajikistan and Uzbekistan
19 TOC is missing. No discussion of how to connect causal changes.
No discussion of how targeting goals will be achieved.
Details missing on whether impacts will be causal, i.e. in addition to current activities and due to activities here.
Proposed creating counterfactual by comparing areas with and without programme. Selection of programme areas can be done to create a robust design.
FP015 UNDP 10/2016 to 09/2023
Tuvalu 36.01 TOC is strong overall, but several details
No discussion of how to
Targeting criteria are clear. Clear how programme
Proposal clearly targets needs of recipients but
Random, or pipeline-style rollout of infrastructural aspects

54
PROPOSAL NUMBER
IMPLEMENTOR PERIOD OF FUNDING
COUNTRY (IES)
FUNDING AMOUNT (USD MILLION)
TOC CAUSAL LINKAGES
TARGETING INVESTMENT CRITERIA
IMPACT EVALUATION DESIGN
are missing. See proposal assessment for a full discussion.
connect causal changes.
will achieve its targeting goals.
performs poorly against the investment criteria otherwise.
of the project along comparable areas of the coast.
FP016 UNDP 12/2016 to 11/23
Sri Lanka 38.084 TOC is strong overall, but several details are missing. See proposal assessment for a full discussion.
No discussion of how to connect causal changes.
Targeting criteria are clear. Unclear how targeting goals will be achieved.
Paradigm shift potential, country ownership, and needs of beneficiaries are all well informed in the proposal. Impact and sustainable development potential fall short due to gaps in the TOC.
Multi-pronged RCT at the village or farmer household level. RDD design is also feasible, using farm size as the forcing variable.
FP017 Banco Desarrollo de America Latina (CAF)
2017 to 2042
Chile 49 TOC is clear and thorough. Minimal concerns are articulated in the full assessment.
No discussion of how to connect causal changes.
There is no specific targeting strategy associated with the proposed project. Criteria for project location is clear and logical.
Overall performance against investment criteria is strong. Low level of country ownership.
Evaluate mitigation impacts against BAU emissions scenarios. Use experimental methods to measure mitigation co-benefits on select beneficiaries, such as those chosen to work on construction projects.

55
PROPOSAL NUMBER
IMPLEMENTOR PERIOD OF FUNDING
COUNTRY (IES)
FUNDING AMOUNT (USD MILLION)
TOC CAUSAL LINKAGES
TARGETING INVESTMENT CRITERIA
IMPACT EVALUATION DESIGN
Full discussion is included in the proposal assessment.
FP018 UNDP 03/2017 to 02/2022
Pakistan 36.96 No comprehensive diagram or single explanation, but TOC related to different aspects of programme are detailed throughout.
No discussion of how to connect causal changes.
Targeting criteria are clear. Mechanism for achieving targeting goals is clear.
Overall performance against investment criteria is very strong. A more thorough TOC and supporting evidence for causal links would have enhanced it further.
Challenging because large unit of assignment (district) and small n (12). Potential for staggered pipeline-style rollout. Potential to assess impacts on households for smaller level interventions within the project scope (i.e. protective flood walls) if comparison communities can be identified.
FP019 UNDP 01/2017 to 12/2021
Ecuador 41.17 Key assumptions need to be verified in TOC.
No discussion of how to connect causal changes.
Targeting criteria are clear in general.
Gaps in the TOC limit our ability to assess impact and sustainable development potential.
Multi-pronged RCT at the farmer or community level is feasible.

56
PROPOSAL NUMBER
IMPLEMENTOR PERIOD OF FUNDING
COUNTRY (IES)
FUNDING AMOUNT (USD MILLION)
TOC CAUSAL LINKAGES
TARGETING INVESTMENT CRITERIA
IMPACT EVALUATION DESIGN
FP020 Inter-American Development Bank
05/2017 to 05/2025
Eastern Caribbean
80 TOC is missing. No discussion of how to connect causal changes.
Targeting strategy is unclear.
Gaps in the TOC limit our ability to assess impact and sustainable development potential. Country ownership is strong.
Evaluate mitigation impacts against BAU emissions scenarios.
FP021 Agence Française de Développement
01/2017 to 12/2021
Senegal 15 (EUR) TOC is missing. No discussion of how to connect causal changes.
Targeting criteria are unclear.
Overall performance against investment criteria is poor.
Multi-pronged RCT with different treatment arms assigned to comparable urban clusters.
FP022 Agency for Agricultural Development
01/2017 to 12/2022
Morocco 39.3 TOC is missing. No discussion of how to connect causal changes.
Mechanism for targeting beneficiaries is clear. Questions remain about whether the intervention is most effective way to achieve its mitigation goals.
Key assumptions need to be verified in order to assess impact, sustainable development, and paradigm shift potential.
Evaluate mitigation outcomes against BAU emissions scenario. Randomize sub-components of programme to assess adaptation and resilience building impacts of activities that complement argan tree planting (the main project intervention).

57
PROPOSAL NUMBER
IMPLEMENTOR PERIOD OF FUNDING
COUNTRY (IES)
FUNDING AMOUNT (USD MILLION)
TOC CAUSAL LINKAGES
TARGETING INVESTMENT CRITERIA
IMPACT EVALUATION DESIGN
FP023 Environment Investment Fund of Namibia
03/2017 to 04/2022
Namibia 9.5 TOC is missing in main text. It is illustrated in Annex 4 but has not been evaluated by the IEU.
No discussion of how to connect causal changes.
Targeting criteria are clear. Clear how programme will achieve its targeting goals.
Omission of a TOC limits our ability to assess impact, sustainable development, paradigm shift potential. Cost-effectiveness is a concern given overlap of project activities.
Randomize sub-components of programme to assess adaptation and resilience building impacts of different project activities.
FP024 Environment Investment Fund of Namibia
03/2017 to 03/2022
Namibia 10 TOC is missing. No discussion of how to connect causal changes.
Targeting criteria are clear. Clear how programme will achieve its targeting goals.
Concerns about impact, sustainable development, paradigm shift, and cost-effectiveness potential due to holes in TOC and small scale of programme. Country ownership is a strength.
Randomize sub-components of programme to assess adaptation and resilience building impacts of different project activities. Experimentally vary Component 1 of the programme to assess its additional attributable impact.
FP025 European Bank for Reconstructio
01/2017 to 01/2032
MENA, West and Central Asia, Southern and
420 TOC is clear but relies on unverified assumptions
Some discussion of how to connect
The project’s broad geographic targeting approach is clear,
Gaps in the TOC’s proposed causal chain raise concern that the project will
Score potential investments on an objective credit-worthiness/impact

58
PROPOSAL NUMBER
IMPLEMENTOR PERIOD OF FUNDING
COUNTRY (IES)
FUNDING AMOUNT (USD MILLION)
TOC CAUSAL LINKAGES
TARGETING INVESTMENT CRITERIA
IMPACT EVALUATION DESIGN
n and Development
Eastern Europe
about what will drive behaviour change, demand and delivery of finance, and an overall paradigm shift.
causal changes (Section H), but a detailed strategy for evaluation is missing.
but a more detailed description of targeting criteria to drive impact would enhance the proposal.
not achieve a paradigm shift and that its sustainable development potential may be limited.
potential scale, and then assign treatment above a pre-defined threshold in the continuous score range.
FP026 Conservation International and the European Investment Bank
01/2017 to 12/2026
Madagascar 53.5 TOC is strong overall, but key assumptions need to be verified.
No discussion of how to connect causal changes.
Targeting criteria are clear. Clear how programme will achieve its targeting goals.
Poor country ownership. Potentially high-impact, sustainable development, cost-effectiveness, and paradigm shift potential, but key assumptions need to be verified.
Randomize sub-components of programme to assess adaptation and deforestation/mitigation impacts of different project activities. Require all proposals to investment fund to pre-specify evaluation plans.
FP027 Deutsche Bank AG
06/2017 to 09/2032
sub-Saharan Africa
132 No comprehensive diagram or single explanation, but implicit TOC/logic framework are
No discussion of how to connect causal changes.
Targeting criteria are clear. Clear how programme will achieve its targeting goals.
Overall performance against investment criteria is strong.
Evaluation strategies will need to be adapted to the context of each individual investment. Each project that is invested in should pre-specify an experimental or

59
PROPOSAL NUMBER
IMPLEMENTOR PERIOD OF FUNDING
COUNTRY (IES)
FUNDING AMOUNT (USD MILLION)
TOC CAUSAL LINKAGES
TARGETING INVESTMENT CRITERIA
IMPACT EVALUATION DESIGN
plausible and well articulated.
quasi-experimental evaluation plan.
FP028 XacBank LLC 2017 to 2025
Mongolia 20 TOC is missing. No discussion of how to connect causal changes.
Targeting criteria are clear. Lack of evidence that shows why it is the optimal targeting approach.
Poor country ownership. Paradigm shift, impact and sustainable development potential may be high, but they rely on unverified assumptions.
RDD over credit-score cutoff. Randomly allocate or promote loans to a sample of similar firms.
FP029 Development Bank of South Africa
04/2017 to 03/2027
South Africa 12.222 TOC is missing. No discussion of how to connect causal changes.
Targeting criteria are clear. Mechanism for achieving targeting goals is clear.
Poor country ownership. Paradigm shift, impact and sustainable development potential may be high, but they rely on unverified assumptions.
RDD over credit-score cutoff. Randomly allocate or promote loans to a sample of similar firms.
FP030 Inter-American Development Bank
01/2017 to 12/2020
Argentina 133 TOC is missing. No discussion of how to connect
Targeting criteria are unclear.
Overall performance against investment criteria is poor.
Evaluation potential of the project is low given the large unit of assignment and small

60
PROPOSAL NUMBER
IMPLEMENTOR PERIOD OF FUNDING
COUNTRY (IES)
FUNDING AMOUNT (USD MILLION)
TOC CAUSAL LINKAGES
TARGETING INVESTMENT CRITERIA
IMPACT EVALUATION DESIGN
causal changes.
number of projects that will be funded as part of the programme. It could be possible to identify valid comparison groups, but the sample size will be small and experimental methods will most likely not be feasible. One alternative could be an evaluation of one or more projects using a difference-in-difference methodology across treated beneficiaries and untreated potential beneficiaries of selected projects.
FP033 UNDP 03/2017 to 12/2024
Mauritius 28.21 No comprehensive diagram or single explanation, but TOC is clear in
No discussion of how to connect causal changes.
Targeting criteria are clear. Mechanism for achieving targeting goals is clear.
Overall performance against investment criteria is very strong.
Randomize photovoltaic energy technologies at the household level and track social and economic outcomes.
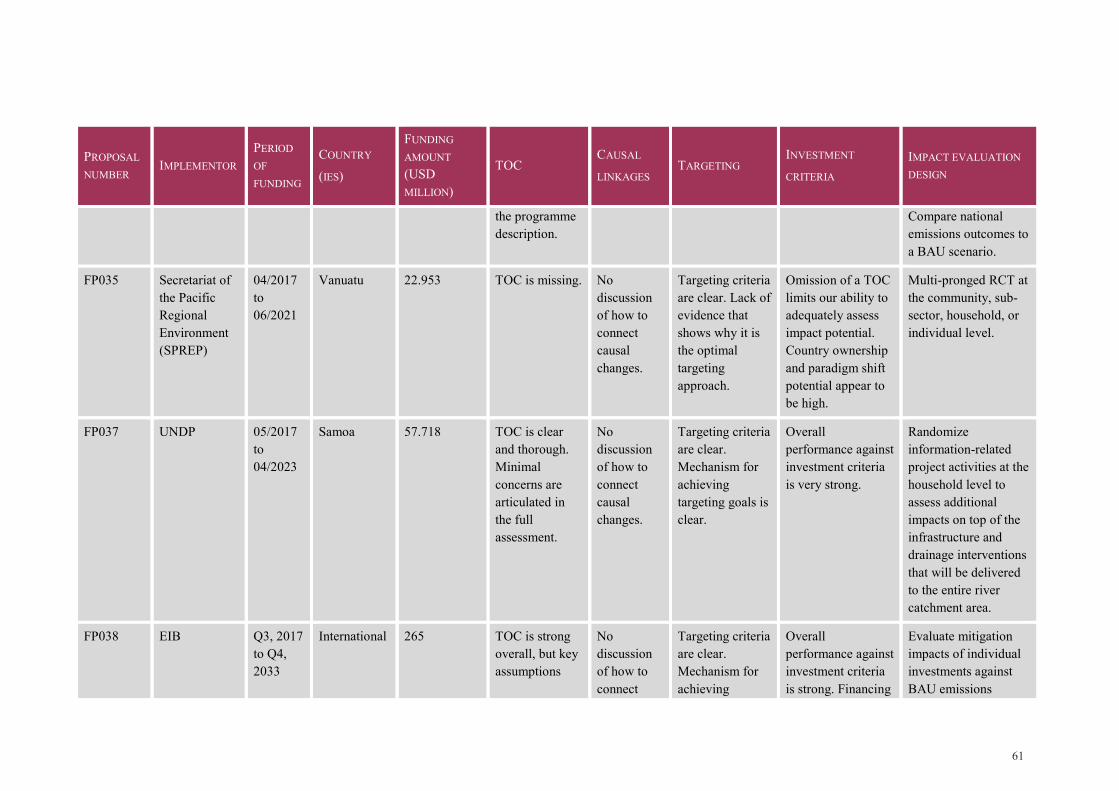
61
PROPOSAL NUMBER
IMPLEMENTOR PERIOD OF FUNDING
COUNTRY (IES)
FUNDING AMOUNT (USD MILLION)
TOC CAUSAL LINKAGES
TARGETING INVESTMENT CRITERIA
IMPACT EVALUATION DESIGN
the programme description.
Compare national emissions outcomes to a BAU scenario.
FP035 Secretariat of the Pacific Regional Environment (SPREP)
04/2017 to 06/2021
Vanuatu 22.953 TOC is missing. No discussion of how to connect causal changes.
Targeting criteria are clear. Lack of evidence that shows why it is the optimal targeting approach.
Omission of a TOC limits our ability to adequately assess impact potential. Country ownership and paradigm shift potential appear to be high.
Multi-pronged RCT at the community, sub-sector, household, or individual level.
FP037 UNDP 05/2017 to 04/2023
Samoa 57.718 TOC is clear and thorough. Minimal concerns are articulated in the full assessment.
No discussion of how to connect causal changes.
Targeting criteria are clear. Mechanism for achieving targeting goals is clear.
Overall performance against investment criteria is very strong.
Randomize information-related project activities at the household level to assess additional impacts on top of the infrastructure and drainage interventions that will be delivered to the entire river catchment area.
FP038 EIB Q3, 2017 to Q4, 2033
International 265 TOC is strong overall, but key assumptions
No discussion of how to connect
Targeting criteria are clear. Mechanism for achieving
Overall performance against investment criteria is strong. Financing
Evaluate mitigation impacts of individual investments against BAU emissions
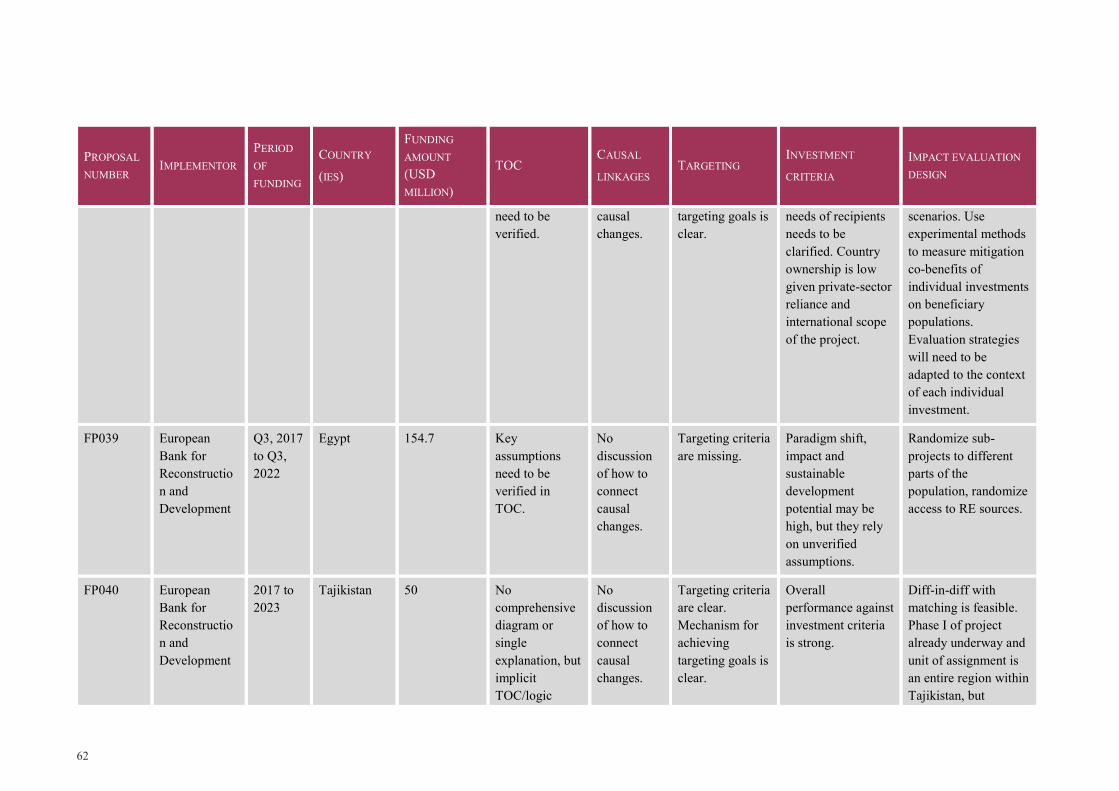
62
PROPOSAL NUMBER
IMPLEMENTOR PERIOD OF FUNDING
COUNTRY (IES)
FUNDING AMOUNT (USD MILLION)
TOC CAUSAL LINKAGES
TARGETING INVESTMENT CRITERIA
IMPACT EVALUATION DESIGN
need to be verified.
causal changes.
targeting goals is clear.
needs of recipients needs to be clarified. Country ownership is low given private-sector reliance and international scope of the project.
scenarios. Use experimental methods to measure mitigation co-benefits of individual investments on beneficiary populations. Evaluation strategies will need to be adapted to the context of each individual investment.
FP039 European Bank for Reconstruction and Development
Q3, 2017 to Q3, 2022
Egypt 154.7 Key assumptions need to be verified in TOC.
No discussion of how to connect causal changes.
Targeting criteria are missing.
Paradigm shift, impact and sustainable development potential may be high, but they rely on unverified assumptions.
Randomize sub-projects to different parts of the population, randomize access to RE sources.
FP040 European Bank for Reconstruction and Development
2017 to 2023
Tajikistan 50 No comprehensive diagram or single explanation, but implicit TOC/logic
No discussion of how to connect causal changes.
Targeting criteria are clear. Mechanism for achieving targeting goals is clear.
Overall performance against investment criteria is strong.
Diff-in-diff with matching is feasible. Phase I of project already underway and unit of assignment is an entire region within Tajikistan, but

63
PROPOSAL NUMBER
IMPLEMENTOR PERIOD OF FUNDING
COUNTRY (IES)
FUNDING AMOUNT (USD MILLION)
TOC CAUSAL LINKAGES
TARGETING INVESTMENT CRITERIA
IMPACT EVALUATION DESIGN
framework are plausible.
potential comparison regions exist and the unit of observation for many outcomes could be the household.
FP041 KfW 03/2017 to 02/2022
Tanzania 102.7 (EUR) No comprehensive diagram or single explanation, but implicit TOC/logic framework are plausible.
No discussion of how to connect causal changes.
Targeting criteria are clear. Mechanism for achieving targeting goals is clear.
Overall performance against investment criteria is strong.
Multi-pronged RCT at the community or household level. Can test the impact of agricultural, sanitation, and water interventions separately and in conjunction with each other. Could rollout clean water access through a pipeline approach.
FP042 Agence Française de Développement
06/2017 to 06/2022
Morocco 20 (EUR) TOC is missing. No discussion of how to connect causal changes.
Targeting criteria are clear. Mechanism for achieving targeting goals is clear.
Overall performance against investment criteria is poor.
Multi-pronged RCT at the community or household level. Could rollout irrigation access through a pipeline approach.

64
PROPOSAL NUMBER
IMPLEMENTOR PERIOD OF FUNDING
COUNTRY (IES)
FUNDING AMOUNT (USD MILLION)
TOC CAUSAL LINKAGES
TARGETING INVESTMENT CRITERIA
IMPACT EVALUATION DESIGN
FP044 World Bank 07/2017 to 06/2022
Solomon Islands
86 No comprehensive diagram or single explanation, but implicit TOC/logic framework are plausible.
No discussion of how to connect causal changes.
Targeting criteria are clear. Mechanism for achieving targeting goals is clear.
Cost-effectiveness is a concern given the cost of the project in the Solomon Islands relative to similar projects elsewhere. Unclear that needs of the population are being met by the project. Many rural communities are left behind.
Evaluate mitigation outcomes against BAU emissions scenario. Simple pre-post comparison for adaptation-related outcomes. Experimental variation of treatment is difficult due to large unit of assignment.
FP045 National Bank for Agriculture and Rural Development (India)
2017 to 2021
India 34.357 TOC is missing. No discussion of how to connect causal changes.
Targeting criteria are clear. Clear how programme will achieve its targeting goals.
Overall performance against investment criteria is strong. Would be further strengthened if a comprehensive TOC was outlined.
Multi-pronged RCT at the community level to test different packages of project interventions.
FP046 XacBank LLC 11/2017 to 11/2027
Mongolia 9.53 TOC is missing. Proposal acknowledges that observed emissions need to be compared to
Targeting criteria for location of intervention are not clear. Choice of implementing organization to
Paradigm shift potential is low. Impact potential is modest. Country ownership is poor. Overall performance against
Evaluate mitigation outcomes against BAU emissions scenario. Do a diff-in-diff with groups who benefit from increased access to RE and

65
PROPOSAL NUMBER
IMPLEMENTOR PERIOD OF FUNDING
COUNTRY (IES)
FUNDING AMOUNT (USD MILLION)
TOC CAUSAL LINKAGES
TARGETING INVESTMENT CRITERIA
IMPACT EVALUATION DESIGN
a BAU scenario.
receive the loan is not clear.
investment criteria is poor.
comparison groups who do not.
FP047 European Bank for Reconstruction and Development
Q4 2017 to Q3 2022
Kazakhstan 110 TOC is strong overall, but key assumptions need to be verified.
No discussion of how to connect causal changes.
Targeting criteria are unclear.
Overall performance against investment criteria is strong. Would be further strengthened if key assumptions were verified.
Evaluate mitigation impacts against BAU emissions scenarios.
FP048 Inter-American Development Bank
06/2018 to 06/2033
Mexico, Guatemala
20 TOC is clear and thorough.
Thorough discussion of how to connect causal changes. Causal linkages are clear.
Targeting criteria are clear. Clear how programme will achieve its targeting goals.
Overall performance against investment criteria is strong. Low level of country ownership.
RCT, randomly assigning the financial instrument to applicants that score similarly on a "credit-score" based on objective criteria.
FP049 United Nations World Food Programme
09/2017 to 09/2021
Senegal 9.984 TOC is clear and thorough.
Proposal includes a brief discussion of how to link causal changes using quasi-
Targeting strategy is clearly articulated.
Overall performance against investment criteria is strong.
A difference-in-difference could be implemented in the same way that it was for the pilot project. An RCT seems feasible as well.

66
PROPOSAL NUMBER
IMPLEMENTOR PERIOD OF FUNDING
COUNTRY (IES)
FUNDING AMOUNT (USD MILLION)
TOC CAUSAL LINKAGES
TARGETING INVESTMENT CRITERIA
IMPACT EVALUATION DESIGN
experimental methods to create a plausible counterfact-ual, and suggests the possibility of implementing a randomized evaluation.
FP050 World Wildlife Fund
Q1, 2018 to Q4, 2031
Bhutan 26.5 TOC is missing. No discussion of how to connect causal changes.
Targeting criteria are clear. Unclear if targeting criteria is optimal due to lack of regard for heterogeneous needs among targeted beneficiaries.
Omission of a TOC limits our ability to adequately assess impact, sustainable development, paradigm shift potential, cost-effectiveness. Country ownership is strong.
Multi-pronged RCT at the community or PA level to test different packages of project interventions.
FP051 UNDP 11/2017 to 10/2025
Bosnia and Herzegovina
17.346 Explicit TOC is missing. Implied causal links rely on
No discussion of how to connect
Targeting criteria are unclear.
Overall performance against investment criteria is strong. Verifying
Random assignment of project interventions to a set of potential

67
PROPOSAL NUMBER
IMPLEMENTOR PERIOD OF FUNDING
COUNTRY (IES)
FUNDING AMOUNT (USD MILLION)
TOC CAUSAL LINKAGES
TARGETING INVESTMENT CRITERIA
IMPACT EVALUATION DESIGN
unverified assumptions.
causal changes.
key assumptions about causal links between activities and impacts would strengthen the proposal’s impact potential.
beneficiaries. A first step to implementing this evaluation would be to identify the potential beneficiary buildings/municipalities that would be included in the evaluation.
FP052 Asian Development Bank
11/2017 to 21/2022
Nauru 26.91 TOC has significant gaps/weaknesses that need to be addressed. Key assumptions need to be verified.
No discussion of how to connect causal changes.
Proposal assumes that the project will benefit the entire population of the country. This assumption needs to be verified.
Unverified assumptions limit impact potential of the project. Major questions need to be answered in order to suggest any causal impact potential. Country ownership potential is strong.
Unclear if a credible IE is possible given that the project is a single construction intervention that will target impacts on the entire island-nations population. Best option may be to treat this intervention as a plausibly exogenous port upgrade.
FP053 UNDP 01/2018 to 12/2024
Egypt 31.385 TOC is clear and thorough. Minimal concerns are articulated in
No discussion of how to connect causal changes.
Targeting criteria are clear. Clear how programme will achieve its targeting goals.
Overall performance against investment criteria is strong.
Cluster RCT of activities related to project Output 2 in communities along the Egyptian North Coast. An IE of activities
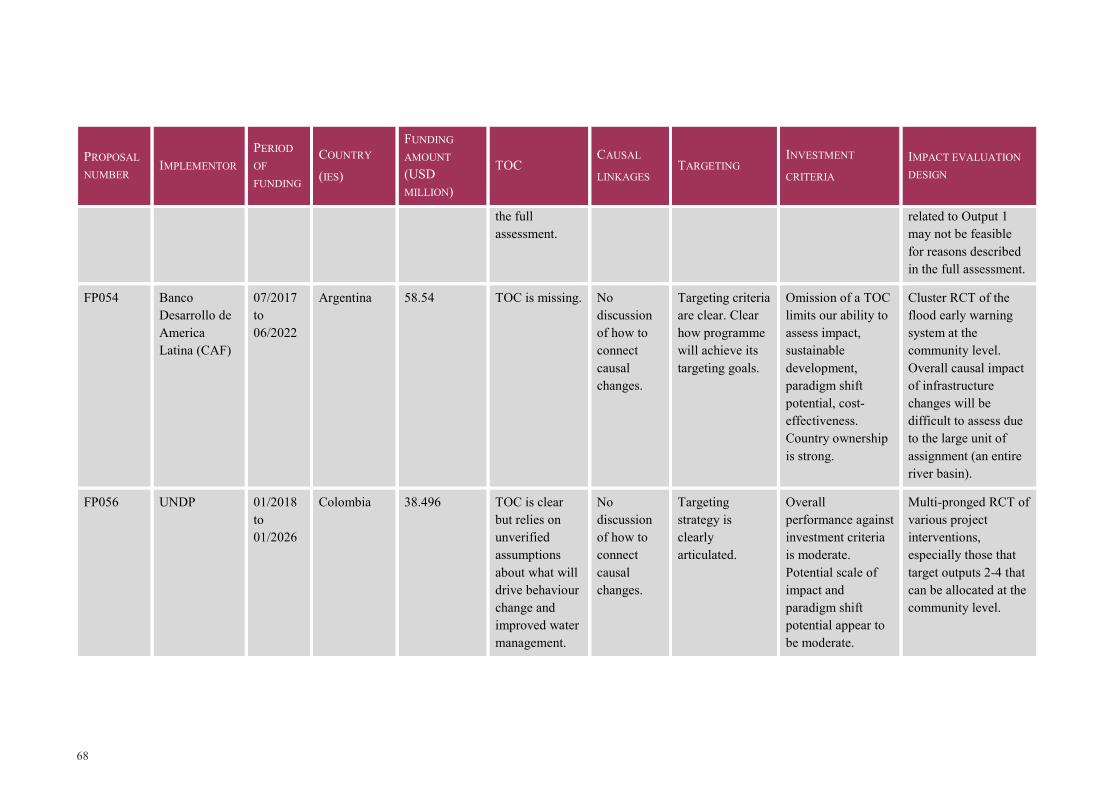
68
PROPOSAL NUMBER
IMPLEMENTOR PERIOD OF FUNDING
COUNTRY (IES)
FUNDING AMOUNT (USD MILLION)
TOC CAUSAL LINKAGES
TARGETING INVESTMENT CRITERIA
IMPACT EVALUATION DESIGN
the full assessment.
related to Output 1 may not be feasible for reasons described in the full assessment.
FP054 Banco Desarrollo de America Latina (CAF)
07/2017 to 06/2022
Argentina 58.54 TOC is missing. No discussion of how to connect causal changes.
Targeting criteria are clear. Clear how programme will achieve its targeting goals.
Omission of a TOC limits our ability to assess impact, sustainable development, paradigm shift potential, cost-effectiveness. Country ownership is strong.
Cluster RCT of the flood early warning system at the community level. Overall causal impact of infrastructure changes will be difficult to assess due to the large unit of assignment (an entire river basin).
FP056 UNDP 01/2018 to 01/2026
Colombia 38.496 TOC is clear but relies on unverified assumptions about what will drive behaviour change and improved water management.
No discussion of how to connect causal changes.
Targeting strategy is clearly articulated.
Overall performance against investment criteria is moderate. Potential scale of impact and paradigm shift potential appear to be moderate.
Multi-pronged RCT of various project interventions, especially those that target outputs 2-4 that can be allocated at the community level.

69
PROPOSAL NUMBER
IMPLEMENTOR PERIOD OF FUNDING
COUNTRY (IES)
FUNDING AMOUNT (USD MILLION)
TOC CAUSAL LINKAGES
TARGETING INVESTMENT CRITERIA
IMPACT EVALUATION DESIGN
FP058 Ethiopian Ministry of Finance and Economic Cooperation
08/2017 to 09/2022
Ethiopia 45.003 TOC is clear and thorough, although it would be enhanced if credible evidence was cited to support proposed causal links.
No discussion of how to connect causal changes.
Targeting criteria are clear. Clear how programme will achieve its targeting goals.
Overall performance against investment criteria is strong. Paradigm shift seems unlikely without future replication as the project targets only 0.4% of the country’s population.
Cluster RCT at the Kabele (village) level to test the impact of village-level project activities on intended outcomes related to food and water security.
FP059 GIZ 10/2018 to 09/2024
Grenada 35.29 (EUR) TOC has significant gaps/weaknesses that need to be addressed. Key assumptions need to be verified.
No discussion of how to connect causal changes.
Targeting criteria for certain project activities are clear but overall targeting approach for the project is not well articulated.
Weaknesses in the TOC limit our ability to adequately assess impact, sustainable development, paradigm shift potential and cost-effectiveness. However, even if the project is successfully implemented and the implicit assumptions in the TOC are upheld,
RCT of awareness-building activities and of the impact of access to the Challenge Fund. RD design is potentially feasible to measure impacts of the climate-responsive water tariff. See full assessment for more detail.

70
PROPOSAL NUMBER
IMPLEMENTOR PERIOD OF FUNDING
COUNTRY (IES)
FUNDING AMOUNT (USD MILLION)
TOC CAUSAL LINKAGES
TARGETING INVESTMENT CRITERIA
IMPACT EVALUATION DESIGN
cost-effectiveness appears to be low. A paradigm shift in Granada is within reach. Country ownership is strong.
FP060 Caribbean Community Climate Change Centre
09/2018 to 12/2023
Barbados 27.6 TOC is clear and thorough. Minimal concerns are articulated in the full assessment.
No discussion of how to connect causal changes.
Targeting criteria for certain project activities are clear but overall targeting approach for the project is not well articulated.
Overall performance against investment criteria is strong.
Evaluate individual project activities and investments using random assignment when possible. A credible evaluation will not be feasible for all project activities.
FP061 Department of Environment, Antigua and Barbuda
10/2018 to 11/2022
Eastern Caribbean
20 TOC has significant gaps/weaknesses that need to be addressed. Key assumptions need to be verified. Details about project activities need to be clarified.
The proposal acknowledges the need to evaluate causal changes but does not outline any clear evaluation strategies.
Overall targeting strategy is not clearly articulated. Proposal would benefit immensely from introducing a clear targeting approach that could guide all sub-projects and activities.
Overall performance against investment criteria is poor. More detail about sub-projects is needed, along with a clear and evidence-based theory of change for the project as a whole.
Evaluate individual project activities and investments using random assignment when possible. A credible evaluation will likely not be feasible for all project activities.

71
PROPOSAL NUMBER
IMPLEMENTOR PERIOD OF FUNDING
COUNTRY (IES)
FUNDING AMOUNT (USD MILLION)
TOC CAUSAL LINKAGES
TARGETING INVESTMENT CRITERIA
IMPACT EVALUATION DESIGN
FP062 Food and Agriculture Organisation (FAO)
Q1, 2018 to Q1, 2023
Paraguay 25.1 TOC is missing. Implicit TOC has gaps discussed in full assessment.
No discussion of how to connect causal changes.
Targeting criteria are clear in general.
Overall performance against investment criteria is poor.
RCT of the E-CCT programme and of the concessional credit programme for medium-sized land owners. Project has high evaluability potential.
FP063 Inter-American Development Bank
04/2018 to 04/2023
Paraguay 23 TOC is detailed but key assumptions need to be verified.
Proposal includes a brief discussion of how to link causal changes using quasi-experimental methods to create a plausible counterfactual.
Targeting criteria are clear in general.
Key assumptions need to be verified in order to assess impact, sustainable development, and paradigm shift potential. Impact estimates are likely unrealistic given gaps in the TOC.
Difference-in-difference combined with matching treated and untreated SMEs on observable characteristics. Key outcomes include emissions and energy savings.
FP064 Inter-American Development Bank
08/2018 to 08/2023
Argentina 103 TOC is detailed but key assumptions
No discussion of how to connect
High level targeting criteria are clear, but the criteria that will inform
Long-term paradigm shift potential appears to be low. Impact and sustainable
Evaluation strategies will need to be adapted to the context of each individual investment. Each

72
PROPOSAL NUMBER
IMPLEMENTOR PERIOD OF FUNDING
COUNTRY (IES)
FUNDING AMOUNT (USD MILLION)
TOC CAUSAL LINKAGES
TARGETING INVESTMENT CRITERIA
IMPACT EVALUATION DESIGN
need to be verified.
causal changes.
investment decisions is not clear.
development potential is likely overstated.
project that is invested in should pre-specify an experimental or quasi-experimental evaluation plan.
FP065 World Bank 07/2018 to 06/2025
Brazil 195 TOC detailed with respect to SL component, but not with respect to IEE component.
No discussion of how to connect causal changes.
Targeting strategy needs further clarification.
Impact potential of certain components is uncertain. Paradigm shift potential is high. High level of country ownership.
Possible randomized evaluation of EE interventions at the city level. Evaluate mitigation impacts against BAU emissions scenarios.
FP066 World Bank 10/2017 to 11/2022
Republic of the Marshall Islands
25 TOC is missing. Implicit TOC has gaps discussed in full assessment.
No discussion of how to connect causal changes.
Targeting criteria are clear in general.
Low level of country ownership puts the long-term sustainability of the project at risk. Impact potential is low in absolute terms but there is some potential for the project to catalyse a nationwide paradigm shift in RMI.
Randomized evaluation of certain project activities, such as the proposed improvements to early warning mechanisms on outer islands.

73
PROPOSAL NUMBER
IMPLEMENTOR PERIOD OF FUNDING
COUNTRY (IES)
FUNDING AMOUNT (USD MILLION)
TOC CAUSAL LINKAGES
TARGETING INVESTMENT CRITERIA
IMPACT EVALUATION DESIGN
FP067 United Nations World Food Programme
07/2018 to 06/2022
Tajikistan 9.273
FP068 UNDP 08/2018 to 07/2025
Georgia 27.054 TOC is detailed but key assumptions need to be verified.
No discussion of how to connect causal changes.
Targeting criteria for certain project activities are clear but overall targeting approach for the project is not well articulated.
High impact potential and level of country ownership. Some concerns about the long-term financial sustainability of the project.
Multi-pronged RCT at the community level to test different packages of project interventions.
FP069 UNDP 07/2018 to 06/2024
Bangladesh 24.98 TOC is clear and thorough. Minimal concerns are articulated in the full assessment.
The proposal acknowledges the need to evaluate causal changes but does not outline any clear evaluation strategies.
Targeting strategy is clearly articulated.
Impact potential is unclear; can be assessed once impact indicators are clarified. Paradigm shift potential and level of country ownership are high.
Phased RCT at the ward level.

74
PROPOSAL NUMBER
IMPLEMENTOR PERIOD OF FUNDING
COUNTRY (IES)
FUNDING AMOUNT (USD MILLION)
TOC CAUSAL LINKAGES
TARGETING INVESTMENT CRITERIA
IMPACT EVALUATION DESIGN
FP071 World Bank 09/2018 to 08/2023
Vietnam 86.3 TOC is clear and logical. Some steps require clarification.
No discussion of how to connect causal changes.
Targeting criteria are unclear.
High impact potential but needs verification. Large paradigm shift potential and highly cost-effective.
Unclear if a credible IE is possible for the project as a whole. Evaluate mitigation impacts against BAU emissions scenarios.
FP073 MOE 5/2018 to 4/2024
Rwanda 32.794 TOC is very clearly outlined and explained with a high level of attention to detail.
The proposal acknowledges the need to evaluate causal changes but does not outline any clear evaluation strategies.
Targeting criteria are clear.
Performs well against the GCF investment criteria. Paradigm shift potential, level of country ownership and cost-effectiveness are especially high.
Difference-in-differences across sectors in Gicumbi district.
FP074 World Bank 01/2019 to 12/2023
Burkina Faso
22.5 TOC is clear and supported by evidence. Causal chain of key elements from output level, to intermediate outcome level,
No discussion of how to connect causal changes.
Targeting criteria are unclear.
Impact potential and paradigm shift potential likely high, but key assumptions require clarification. Sustainability remains uncertain at
Unclear if a credible IE is possible given the wide range of project activities and that the project will be implemented at the country level, targeting impacts on
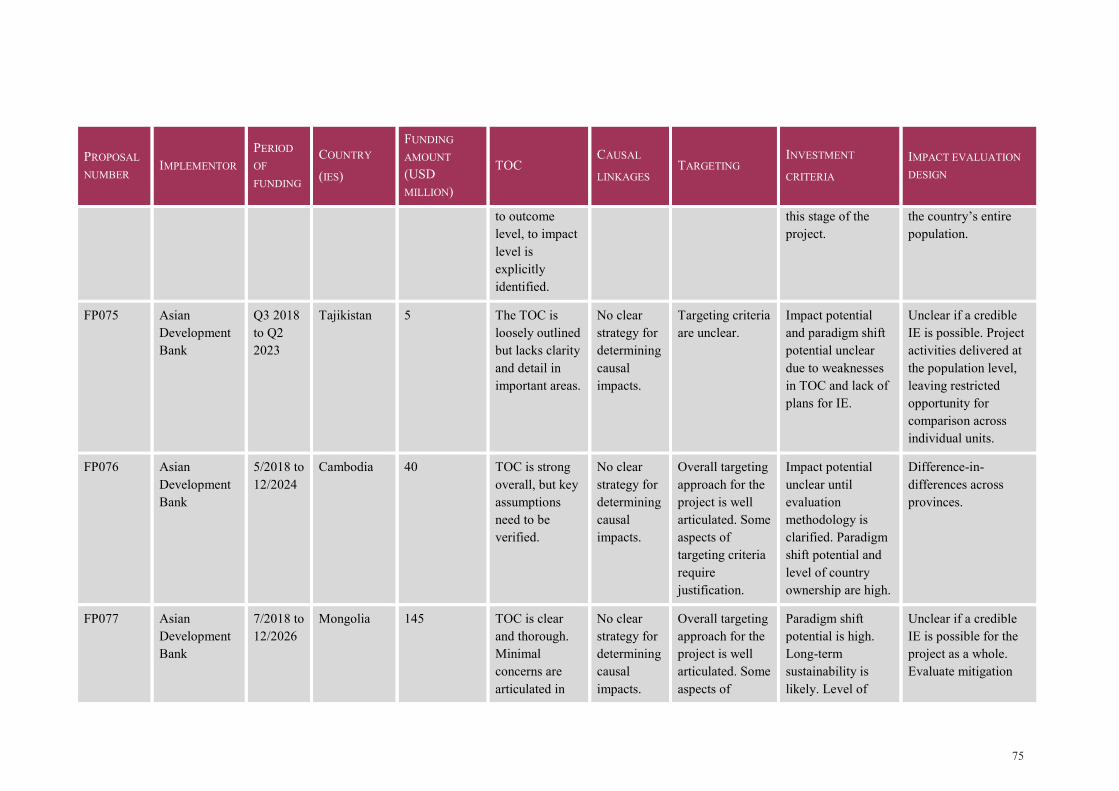
75
PROPOSAL NUMBER
IMPLEMENTOR PERIOD OF FUNDING
COUNTRY (IES)
FUNDING AMOUNT (USD MILLION)
TOC CAUSAL LINKAGES
TARGETING INVESTMENT CRITERIA
IMPACT EVALUATION DESIGN
to outcome level, to impact level is explicitly identified.
this stage of the project.
the country’s entire population.
FP075 Asian Development Bank
Q3 2018 to Q2 2023
Tajikistan 5 The TOC is loosely outlined but lacks clarity and detail in important areas.
No clear strategy for determining causal impacts.
Targeting criteria are unclear.
Impact potential and paradigm shift potential unclear due to weaknesses in TOC and lack of plans for IE.
Unclear if a credible IE is possible. Project activities delivered at the population level, leaving restricted opportunity for comparison across individual units.
FP076 Asian Development Bank
5/2018 to 12/2024
Cambodia 40 TOC is strong overall, but key assumptions need to be verified.
No clear strategy for determining causal impacts.
Overall targeting approach for the project is well articulated. Some aspects of targeting criteria require justification.
Impact potential unclear until evaluation methodology is clarified. Paradigm shift potential and level of country ownership are high.
Difference-in-differences across provinces.
FP077 Asian Development Bank
7/2018 to 12/2026
Mongolia 145 TOC is clear and thorough. Minimal concerns are articulated in
No clear strategy for determining causal impacts.
Overall targeting approach for the project is well articulated. Some aspects of
Paradigm shift potential is high. Long-term sustainability is likely. Level of
Unclear if a credible IE is possible for the project as a whole. Evaluate mitigation

76
PROPOSAL NUMBER
IMPLEMENTOR PERIOD OF FUNDING
COUNTRY (IES)
FUNDING AMOUNT (USD MILLION)
TOC CAUSAL LINKAGES
TARGETING INVESTMENT CRITERIA
IMPACT EVALUATION DESIGN
the full assessment.
targeting criteria require more detailed discussion.
country ownership depends on ability to engage key stakeholders.
impacts against BAU emissions scenarios.
FP078 Acumen Resilient Agriculture Fund LP
10/2018 to 9/2030
Uganda, Ghana & Nigeria
26 TOC is clear and thorough. Minimal concerns are articulated in the full assessment.
Thorough discussion of how to connect causal changes and evaluation plan in place.
Targeting strategy is clearly articulated.
Performs well against investment criteria. Paradigm shift potential is especially high. Sustainability is established by investment in for-profit companies.
Rigorous IE planned, using Lean Data.
FP080 African Development Bank
Q3 2018 to Q2 2023
Zambia 52.5 TOC is strong overall, but key assumptions need to be verified.
No clear strategy for determining causal impacts.
Targeting criteria for certain project activities are clear but for others need clarifying.
Impact potential, paradigm shift potential and level of country ownership is high.
Possible randomized evaluation of RE interventions at the city/ district level. Evaluate mitigation impacts against BAU emissions scenarios.
FP081 National Bank for Agriculture and Rural Development (NABARD)
4/2018 to 3/2023
India 100 Rudimentary TOC outlined, but steps along key causal pathways not
No discussion of how to connect causal changes.
Targeting criteria are unclear.
Impact potential unclear until evaluation methodology is clarified. Paradigm shift potential
Unclear if a credible IE is possible for the project as a whole. Evaluate mitigation impacts against BAU emissions scenarios.

77
PROPOSAL NUMBER
IMPLEMENTOR PERIOD OF FUNDING
COUNTRY (IES)
FUNDING AMOUNT (USD MILLION)
TOC CAUSAL LINKAGES
TARGETING INVESTMENT CRITERIA
IMPACT EVALUATION DESIGN
discussed in adequate detail.
ambiguous. High level of country ownership.
FP082 Asian Development Bank
Q3 2019 to Q2 2039
People's Republic China
1500 TOC is clear and logical. Some steps need further development.
The proposal acknowledges the need to evaluate causal changes but does not outline any clear evaluation strategies.
Targeting criteria are clear.
Performs well against investment criteria. Paradigm shift potential and impact potential are especially high.
Difference-in-differences across provinces.
FP083 World Bank 28/2/19 to 28/2/29
Indonesia 510 TOC is strong and clear overall, but some key assumptions need to be verified.
No clear strategy for determining causal impacts.
Unclear how targeting goals will be achieved.
Overall performance against investment criteria is strong. High paradigm shift potential and impact potential. Convincing exit strategy for GCF funding and sustainability.
Evaluate mitigation outcomes against BAU emissions scenario.
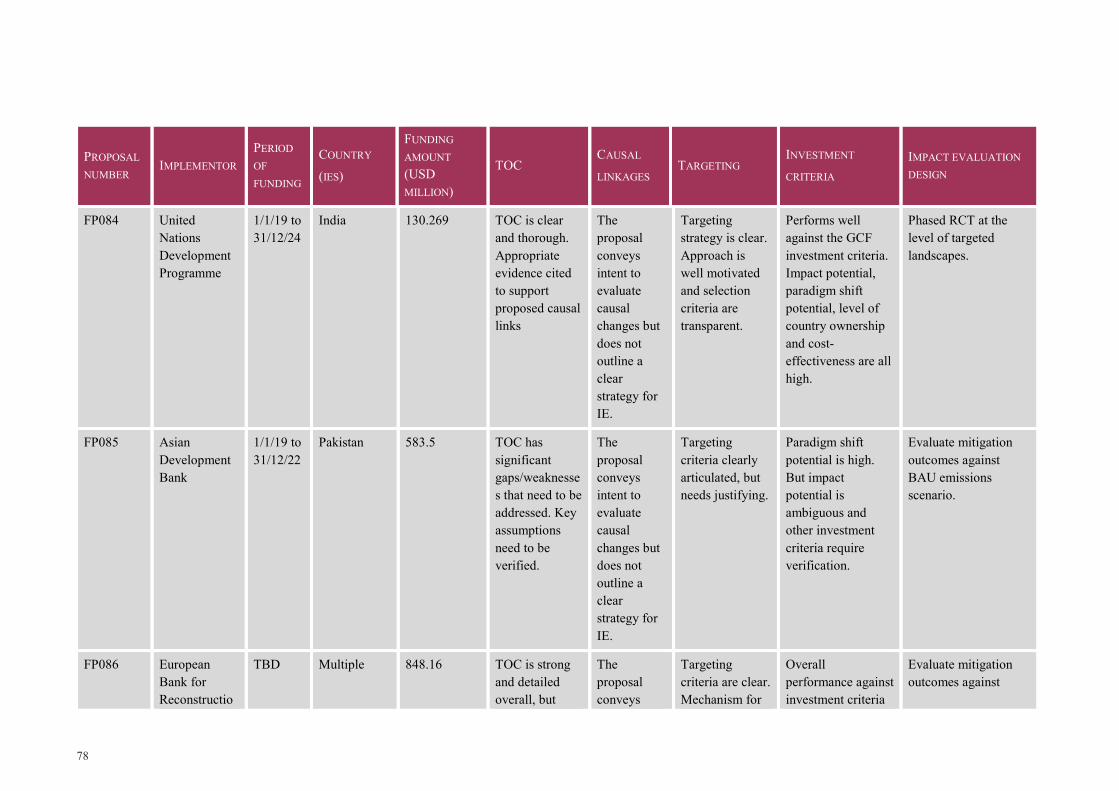
78
PROPOSAL NUMBER
IMPLEMENTOR PERIOD OF FUNDING
COUNTRY (IES)
FUNDING AMOUNT (USD MILLION)
TOC CAUSAL LINKAGES
TARGETING INVESTMENT CRITERIA
IMPACT EVALUATION DESIGN
FP084 United Nations Development Programme
1/1/19 to 31/12/24
India 130.269 TOC is clear and thorough. Appropriate evidence cited to support proposed causal links
The proposal conveys intent to evaluate causal changes but does not outline a clear strategy for IE.
Targeting strategy is clear. Approach is well motivated and selection criteria are transparent.
Performs well against the GCF investment criteria. Impact potential, paradigm shift potential, level of country ownership and cost-effectiveness are all high.
Phased RCT at the level of targeted landscapes.
FP085 Asian Development Bank
1/1/19 to 31/12/22
Pakistan 583.5 TOC has significant gaps/weaknesses that need to be addressed. Key assumptions need to be verified.
The proposal conveys intent to evaluate causal changes but does not outline a clear strategy for IE.
Targeting criteria clearly articulated, but needs justifying.
Paradigm shift potential is high. But impact potential is ambiguous and other investment criteria require verification.
Evaluate mitigation outcomes against BAU emissions scenario.
FP086 European Bank for Reconstructio
TBD Multiple 848.16 TOC is strong and detailed overall, but
The proposal conveys
Targeting criteria are clear. Mechanism for
Overall performance against investment criteria
Evaluate mitigation outcomes against

79
PROPOSAL NUMBER
IMPLEMENTOR PERIOD OF FUNDING
COUNTRY (IES)
FUNDING AMOUNT (USD MILLION)
TOC CAUSAL LINKAGES
TARGETING INVESTMENT CRITERIA
IMPACT EVALUATION DESIGN
n and Development
causal linkages relating to expected impacts need to be verified.
intent to evaluate causal changes but does not outline a clear strategy for IE.
achieving targeting goals is clear.
is strong and alignment of interventions with these criteria is emphasized throughout the proposal.
BAU emissions scenario.
FP087 International Union for Conservation of Nature
1/1/19 to 1/1/26
Guatemala 37.6 TOC is clear and detailed.
The proposal conveys intent to evaluate causal changes but does not outline a clear strategy for IE.
Targeting criteria clearly articulated, but some aspects require justification.
Paradigm shift potential and country ownership are high. Efforts to achieve long-term sustainability require justification.
RDD design feasible, using the geographical boundary of targeted watersheds as the discontinuity in treatment assignment.
FP089 Food and Agriculture Organization of the United Nations
1/19 to 12/23
El Salvador 127.7 TOC is clearly conveyed.
Approach to IE vaguely outlined, but strategy requires clarification.
Targeting criteria are clear. Mechanisms for achieving targeting goals are unclear.
Impact potential high and long-term sustainability well considered. Paradigm shift potential hinges on
Difference-in-differences across households, for activities under component 1. Construction of

80
PROPOSAL NUMBER
IMPLEMENTOR PERIOD OF FUNDING
COUNTRY (IES)
FUNDING AMOUNT (USD MILLION)
TOC CAUSAL LINKAGES
TARGETING INVESTMENT CRITERIA
IMPACT EVALUATION DESIGN
unverified assumptions.
control and treatment groups of households needs clarifying.
FP090 Asian Development Bank
1/2/19 to 30/6/22
Tonga 53.2 TOC has significant gaps/weaknesses that need to be addressed. Key assumptions need to be verified.
No clear strategy for determining causal impacts.
Targeting criteria are unclear.
Performance against investment criteria unclear due to weaknesses in TOC and lack of plans for IE.
Evaluate mitigation outcomes against BAU emissions scenario.
FP091 Asian Development Bank
1/1/19 to 31/12/24
Kiribati 58.08 TOC is logical but requires more detailed discussion.
The proposal conveys intent to evaluate causal changes but does not outline a clear strategy for IE.
Targeting criteria are clear, but underlying assumptions require verification.
Impact potential and paradigm shift potential likely high, but key assumptions require clarification.
Evaluate mitigation outcomes against BAU emissions scenario.
FP092 African Development Bank
1/19 to 12/24
Niger basin 209.903 TOC is clear and thorough.
Proposal broadly outlines
Targeting criteria are clear. Mechanisms for
Performs well against the GCF investment criteria.
Difference-in-differences. Level of implementation will

81
PROPOSAL NUMBER
IMPLEMENTOR PERIOD OF FUNDING
COUNTRY (IES)
FUNDING AMOUNT (USD MILLION)
TOC CAUSAL LINKAGES
TARGETING INVESTMENT CRITERIA
IMPACT EVALUATION DESIGN
approach to impact evaluation, but the strategy needs to be refined before implementation.
achieving targeting goals need clarifying.
Impact potential, paradigm shift potential and sustainability are all high.
depend on specificities of activities under different project components.
FP093 African Development Bank
Q1 2019 to Q3 2025
Burkina Faso 60.534 TOC has significant gaps/weaknesses that need to be addressed.
The proposal conveys intent to evaluate causal changes but does not outline a clear strategy for IE.
Targeting criteria are clear. Mechanisms for achieving targeting goals need clarifying.
Performance against investment criteria unclear due to weaknesses in TOC and lack of plans for IE.
Evaluate mitigation outcomes against BAU emissions scenario.
FP094 United Nations Development Programme
1/12/18 to 30/11/26
Comoros 60.7515 TOC is clear and thorough.
The proposal conveys intent to evaluate
Targeting criteria are clear. Mechanism for achieving
Performs well against the GCF investment criteria. Paradigm shift potential and level
Randomized roll-out of activities at the zonal level.

82
PROPOSAL NUMBER
IMPLEMENTOR PERIOD OF FUNDING
COUNTRY (IES)
FUNDING AMOUNT (USD MILLION)
TOC CAUSAL LINKAGES
TARGETING INVESTMENT CRITERIA
IMPACT EVALUATION DESIGN
causal changes but does not outline a clear strategy for IE.
targeting goals is clear.
of country ownership are especially high.
FP095 Agence Française de Développement
Q2 2019 to Q2 2026
Multiple 744.42 TOC is strong and clear overall, but some key assumptions need to be verified.
Detailed explanation of planned monitoring activities provided, but no strategy for IE to measure causal change is conveyed.
Targeting criteria are unclear.
Overall performance against the GCF investment criteria is good, but key aspects require verification.
Evaluate mitigation outcomes against BAU emissions scenario.
FP096 African Development Bank
Q1 2019 to Q4 2023
Democratic Republic of Congo
89 TOC is strong and clear overall. Some causal linkages missing.
The proposal conveys intent to evaluate causal changes but
Targeting strategy is clear. Selection criteria need clarifying.
Performance against investment criteria unclear due to missing aspects of TOC and lack of plans for IE.
Evaluate mitigation outcomes against BAU emissions scenario.

83
PROPOSAL NUMBER
IMPLEMENTOR PERIOD OF FUNDING
COUNTRY (IES)
FUNDING AMOUNT (USD MILLION)
TOC CAUSAL LINKAGES
TARGETING INVESTMENT CRITERIA
IMPACT EVALUATION DESIGN
does not outline a clear strategy for IE.
FP097 Central American Bank for Economic Integration
1/6/19 to 1/6/24
Multiple 28 TOC is logical and detailed, and supported by appropriate evidence.
Detailed explanation of planned monitoring and evaluation activities provided, but current strategy is not sufficient for rigorous IE.
Targeting criteria are clear. Mechanism for achieving targeting goals is clear.
Performs well against the GCF investment criteria. Paradigm shift potential, impact potential and level of country ownership are especially high.
Evaluation strategies will need to be adapted to the context of each individual investment. Each activity that is invested in should pre-specify an experimental or quasi-experimental evaluation plan.
FP098 Development Bank of Southern Africa
1/11/18 to 1/11/23
South Africa and ZAR zone
170.55 TOC is strong and detailed overall, but causal linkages relating to expected project co-benefits need to be verified.
The proposal conveys intent to evaluate causal changes but does not outline a
Targeting criteria clearly articulated, but some aspects require justification and mechanisms for achieving targeting goals
Overall performance against the GCF investment criteria is good, but key aspects require verification. Cost-effectiveness is especially high.
Evaluate mitigation outcomes against BAU emissions scenario. Difference-in-differences for adaptation-focused activities.

84
PROPOSAL NUMBER
IMPLEMENTOR PERIOD OF FUNDING
COUNTRY (IES)
FUNDING AMOUNT (USD MILLION)
TOC CAUSAL LINKAGES
TARGETING INVESTMENT CRITERIA
IMPACT EVALUATION DESIGN
clear strategy for IE.
require clarification.
FP099 Nederlandse Financierings-Maatschappij voor Ontwikkelingslanden N.V.
19/4/19 to 23/6/37
Multiple 821.7 TOC is clear and logical, but country-specific information requires clarification.
The proposal conveys intent to evaluate causal changes but does not outline a clear strategy for IE.
Targeting criteria are clear. Mechanisms for achieving targeting goals are unclear.
Overall performance against the GCF investment criteria is good, but key aspects rely on unverified assumptions.
Evaluate mitigation outcomes against BAU emissions scenario.
SAP002 United Nations World Food Programme
9/2018 to 8/22
Kyrgyz Republic
9.6 TOC is clear and thorough. Appropriate evidence cited to support proposed causal links.
Detailed explanation of planned monitoring and evaluation activities provided, but current strategy is not
Targeting criteria are outlined, but a detailed explanation is lacking. Mechanisms for achieving targeting goals are unclear.
Paradigm shift potential and country ownership are high. Long-term sustainability considered.
Difference-in-differences.
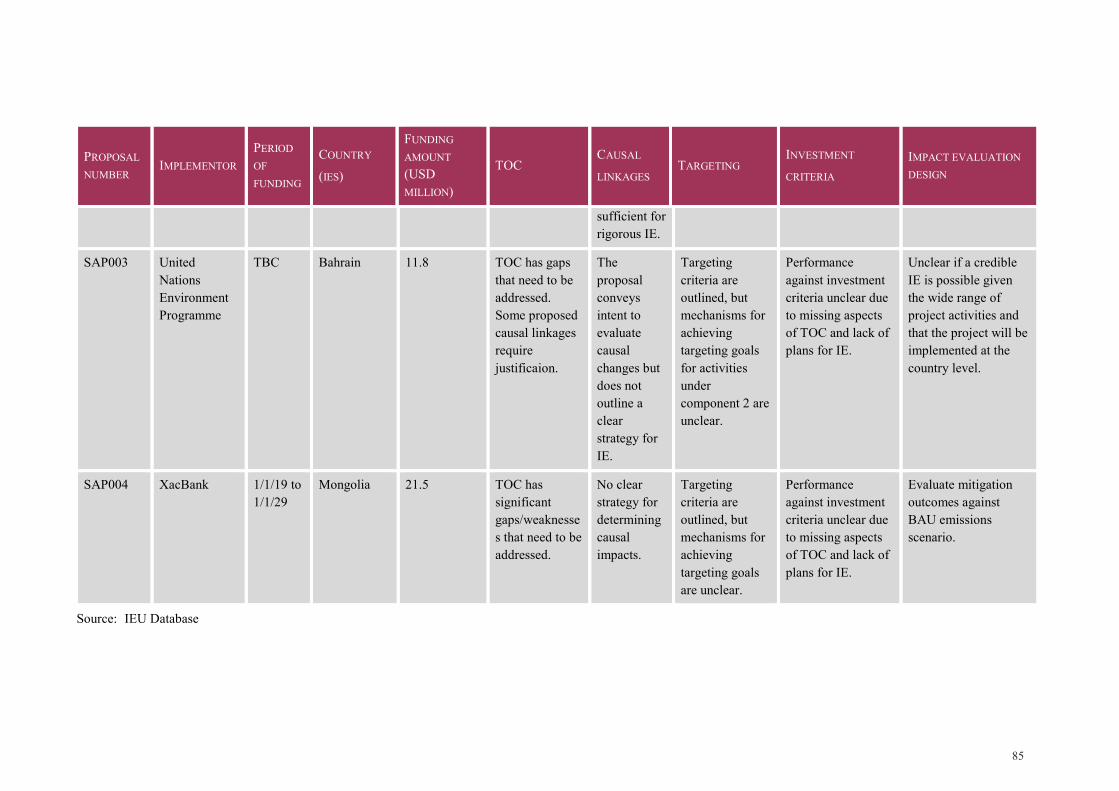
85
PROPOSAL NUMBER
IMPLEMENTOR PERIOD OF FUNDING
COUNTRY (IES)
FUNDING AMOUNT (USD MILLION)
TOC CAUSAL LINKAGES
TARGETING INVESTMENT CRITERIA
IMPACT EVALUATION DESIGN
sufficient for rigorous IE.
SAP003 United Nations Environment Programme
TBC Bahrain 11.8 TOC has gaps that need to be addressed. Some proposed causal linkages require justificaion.
The proposal conveys intent to evaluate causal changes but does not outline a clear strategy for IE.
Targeting criteria are outlined, but mechanisms for achieving targeting goals for activities under component 2 are unclear.
Performance against investment criteria unclear due to missing aspects of TOC and lack of plans for IE.
Unclear if a credible IE is possible given the wide range of project activities and that the project will be implemented at the country level.
SAP004 XacBank 1/1/19 to 1/1/29
Mongolia 21.5 TOC has significant gaps/weaknesses that need to be addressed.
No clear strategy for determining causal impacts.
Targeting criteria are outlined, but mechanisms for achieving targeting goals are unclear.
Performance against investment criteria unclear due to missing aspects of TOC and lack of plans for IE.
Evaluate mitigation outcomes against BAU emissions scenario.
Source: IEU Database

86
Table 17: Individual stoplight results, January 2019
NO. ALLOW_FOR_EVAL
INVEST_MA
NDE
INDICAT
ORS
TO
C
PATHW
AYS
RIS
KS
EVIDENCE_C
ITED
CAUSAL_L
INKS
CAUSAL_MET
HODS
TARGET
ING
EVALUABI
LITY
BASEL
INE
DATA_QUA
LITY
BI
AS
IMP_FIDE
LITY
REPORTING_REQS
ME_CO
STS
ECON_ANA
LYSIS
IMPACT
_POT
INVEST_CRI
TERIA
PARADIGM_S
HIFT
1 L M M H H H H H H H M H M H L M H L M M H
2 L H M M L M M L H L L H H H L H H M M M H
3 L M M H H M M H H M L H H H L H H M M L M
4 M H M H H M M H H M U H H H L H H M H H H
5 M M M L L L M M H M M M M H L M H L M L M
6 L H H L L M L M M M L M M H M H H H M L M
7 L M M L M L M M H L L M M H L M M M L L M
8 H H H M M H H M H L H H H H L M H H H H H
9 M M M H M M M H H H M M M H L M H L M H H
10 L M M L L L M L H L L M M H L M M M M L M
11 L M M M H M M M H L M M M H M M M M M M H
12 L M M M H M M M H M M M M H M M M M M M H
13 L M M M M L M M H L L M M H L M M M M M H
14 M M H H H H H H H M U M H H L M H H M M M
15 L M M M M L H M M L L H H H L M H L M M M
16 L H M M M L H M M L L H H H L H H L H H H

87
NO. ALLOW_FOR_EVAL
INVEST_MANDE
INDICATORS
TOC
PATHWAYS
RISKS
EVIDENCE_CITED
CAUSAL_LINKS
CAUSAL_METHODS
TARGETING
EVALUABILITY
BASELINE
DATA_QUALITY
BIAS
IMP_FIDELITY
REPORTING_REQS
ME_COSTS
ECON_ANALYSIS
IMPACT_POT
INVEST_CRITERIA
PARADIGM_SHIFT
17 L M M L L L L L M L L H H H L H H L L L L
18 M M L L M L L L H L M U M H L M M M L L L
19 L M M M M L H M M L L H H H L H H L L L L
21 L M H H H H H H M H L H H H L H H L H M H
22 L M M H M M H H H M M H H H L M H H M H M
23 L M M M H M H H H L M H M H L L H M M L H
24 L M M M H M H H H L M H H H L L H M H M H
25 M L L M M H H M H H L H L H M L L L M M H
26 L M L M H L H H H L M L H H L L M M M M M
27 M M M L L L M L M L M M M H L L H L M L M
28 L M H H H M H H H L L H H H L H M M M M M
33 L M M L L L L L H L L M H H L M H M M M M
34 M M M L H H L H H L U L H H L M H H L H L
35 L M M H H M H H M M L L M H L M H L L M M
36 H H H H H H H H H M U L H H L M H H H H M
37 M M L L L L L L M L M L M H L L H L H H H
38 M M M M M M M L M L M M M H H M H L M L M

88
NO. ALLOW_FOR_EVAL
INVEST_MANDE
INDICATORS
TOC
PATHWAYS
RISKS
EVIDENCE_CITED
CAUSAL_LINKS
CAUSAL_METHODS
TARGETING
EVALUABILITY
BASELINE
DATA_QUALITY
BIAS
IMP_FIDELITY
REPORTING_REQS
ME_COSTS
ECON_ANALYSIS
IMPACT_POT
INVEST_CRITERIA
PARADIGM_SHIFT
39 M M M M L M H M M H M M M H L M H L L M M
40 L M M L L L L L L L L H L H L M H L L L L
41 L M M L L L H M L L L H M H L M H L L L L
42 L M M M M M H M L L L H M H L M H L H H H
43 M M H H H L H H H M
H H H L M H H L H M
44 H M M L L L H L M L H H H H L M H H M M M
45 L L M M M L M M H L L L L H L L L M M M M
46 L M M L L L L L M L M M M H M M H M H H H
47 L M L L L M M L H H L H H H L H H M L L L
48 L L M L L L L L L L L L L H L L L L L L L
49 L M L L L L L L L L L L L L L L U L L L L
50 L H M H M L H M H M L M H H L M H M H H H
51 M M L H M M M H H M M M H H M M H M M M H
52 H H M H M M H H M M H H H H L M H L H H H
53 M H H L M L H M H L H H H H L M U H M M H
54 M M M H H L H H H L M H H H L M H H M M M
56 L M M M M M H M H L L M H H L M H M M M M

89
NO. ALLOW_FOR_EVAL
INVEST_MANDE
INDICATORS
TOC
PATHWAYS
RISKS
EVIDENCE_CITED
CAUSAL_LINKS
CAUSAL_METHODS
TARGETING
EVALUABILITY
BASELINE
DATA_QUALITY
BIAS
IMP_FIDELITY
REPORTING_REQS
ME_COSTS
ECON_ANALYSIS
IMPACT_POT
INVEST_CRITERIA
PARADIGM_SHIFT
58 L M M M H M H M H L M M M H L M M M M L H
59 L U U M M M H M H M L H H H L H H M L M L
60 L U U L M L M M H M L H H H L H H M L L L
61 M H H H H H H H M H U M H H H M M H H H H
62 L U U M M L H H H L L M H H L H H M U M L
63 L U U M M M H H L L L H L L L L H L U M L
64 M U U M M H M H H H M M H H L M H M U H M
65 M H H M M M H M H M U H H H L H H H M M L
66 M U U H M M H M H L M H H H M H H M U H M
67 L U U M M H H M M L L M M H L M H M U H M
68 H H H M M M L L H L U H H H L H H H H M M
69 H M H L M M L L H L U H H H L H H H L M L
70 M M H M M M L M H H U H H H L M H H M M L
71 H M H L M M L L H H U L H H H M H H M M L
72 L U U L L L H M M M L L M H M M H M U L L
73 M M M L L L L L H L U M H H L M H M M L L
74 H M H M M L L M H H U H H H M M H H H H M

90
NO. ALLOW_FOR_EVAL
INVEST_MANDE
INDICATORS
TOC
PATHWAYS
RISKS
EVIDENCE_CITED
CAUSAL_LINKS
CAUSAL_METHODS
TARGETING
EVALUABILITY
BASELINE
DATA_QUALITY
BIAS
IMP_FIDELITY
REPORTING_REQS
ME_COSTS
ECON_ANALYSIS
IMPACT_POT
INVEST_CRITERIA
PARADIGM_SHIFT
75 H H H H H M H H H H U H H H H M H H H H M
76 M M M M M L L M H M U M H H L M H H M M L
77 H M H L L L L L H L U H H H L M M H M M L
78 L L M L L L L L L L U M M H L L L L M L L
80 M H H M M H M M H M U H H H L H H H M M L
81 H H H H H L H H H H U H H H L H H H H M H
82 L M M M L L H L H L U H M H L H H M L L L
83 M M H M L M M M H H U M H H L H H H L L L
84 L M H L L L L L H L U H H H L H H M L L L
85 M H H M M M M M H H U H H H M H H M L M H
86 M M L L M L L L M L U M M H L L L M L M L
87 M L H L L L L L H L U H H H L H H M L L L
89 M L M L L L L L M L U L M M L M H M L L L
90 M L H H H L H H H H U H M H L H H M L L L
91 H M H M M L M M H L U M H H M M H M L M L
92 M L M L L M L L M M U L L M L M L M L M L
93 M L M L M H H H H L U H M H H H H M L M M

91
NO. ALLOW_FOR_EVAL
INVEST_MANDE
INDICATORS
TOC
PATHWAYS
RISKS
EVIDENCE_CITED
CAUSAL_LINKS
CAUSAL_METHODS
TARGETING
EVALUABILITY
BASELINE
DATA_QUALITY
BIAS
IMP_FIDELITY
REPORTING_REQS
ME_COSTS
ECON_ANALYSIS
IMPACT_POT
INVEST_CRITERIA
PARADIGM_SHIFT
94 L L M M L L H M H L U M H H L H H H L L M
95 H M H M M L H H H M U H H H L L H M L L L
96 M L H L L H L L H M U H M H L H H M L L L
97 L L L L L L L L M L U L L H L L M L L L L
98 H M M L L L L L H M U L H H L L H M L M L
99 H M L L L L L L H M U L H H L L H M M M L
100 L L L L L L L L L M U L L M L L L L L M H
101 L L L M M H H H M L U L H L M L L M L M H
102 M M H H H H H H H M U H H H L H H H L L L
Note: L for Low risk; M for Medium risk; H for High risk Source: IEU Database

92
Source: IEU Database Figure 20: Stoplight summary, January 2019 A. 5 Monitoring for good implementation Step 1: Identifying indicators Indicators answer the question "How will I know?". Indicators are • key aspects (or proxies) of the element that we want to measure, even though they may not
necessarily be fully representative; and • tangible signs that something has been done or that something has been achieved – that is, they are
the means we select as markers of our success (civicus). Developing indicators is a crucial element of building a monitoring system, since it drives all subsequent data collection, analysis and reporting. Without a clear set of indicators, monitoring or evaluation activities lose their capacity to assess what is realized against what was agreed and foreseen. Our results matrix above postulates a hierarchy of objectives for which indicators are required – that is, higher-level outcomes, outcomes, outputs, activities and inputs. Even when our focus is on the results of the intervention, it is still important to track implementation indicators, so we can determine whether the project has reached its intended beneficiaries and whether it has been carried out as intended. Without these indicators all along the results chain, an evaluation will produce only a “black box” that identifies whether or not the predicted results materialized; it will not be able to explain why that was the case. When specifying the indicators, it is best to keep the following in mind. • Bring in other stakeholders: Setting goals in isolation can lead to a lack of ownership on the part of
the main internal and external stakeholders (Kusek & Rist, 2004, p. 58). Defining outcomes and
0 10 20 30 40 50 60 70 80 90 100
What is the quality of the (implicit or explicit)…Are unintended consequences referred to and…
Are causal pathways clearly identified and discussed?How robust are the causal linkages (implicit or…
Is good quality evidence cited to discuss the efficacy…Does the proposal design allow for credible…
To what extent are included requirements for…What activities are included in the proposal that …
Are methods for measuring attributable causal…Are there potential areas of bias that are likely to…
Are eligibility and targeting criteria well-articulated…Is there adequate and reliable information included…To what extent is impact potential identifiable and…
To what extent is paradigm shift potential…How well are other GCF investment criteria…
Are current reporting requirements sufficient for…How likely is it that progress on investment criteria…To what extent did the proposal provide additional…Has baseline data been collected and/or is there a…What is the potential quality of data and are these…
% Unclear % High risk % Medium risk % Low risk

93
performance indicators therefore requires collaboration with local partners and stakeholders in the community to arrive at a mutually agreed set of goals and objectives for the programme.
• Choose the right number of indicators. Since indicators are only proxies, it is common to define several indicators for each objective, especially on the outcome or higher-level outcome levels which are by definition more complex in nature. However, choosing too many indicators will unnecessarily complicate our monitoring system and increase the burden for data collection, analysis, and reporting. It is therefore important to identify the 1-3 key indicators that best reflect each objective in the results chain.
• Respect quality standards. Even though there are no absolute principles about what makes a good indicator, the commonly cited SMART characteristics can be useful:
• Specific: to measure the information required as closely as possible
• Measurable: to ensure that the information can be readily obtained
• Attributable: to ensure that each measure is linked to the project’s effort
• Realistic: to ensure that the data can be obtained in a timely fashion, with reasonable frequency, and at reasonable cost
• Targeted: to the objective population
• Establish a baseline. The baseline sets the current condition against which future progress can be tracked (Kusek & Rist, 2004). It tells us the value of an indicator at the beginning of, or just prior to, the monitoring period. For example, if we want to monitor participants’ incomes over time, the registration form for our programme might tell us that the average monthly income of participants at the time of entering the programme is around USD 100. This would be our baseline value. Knowing the baseline value of our indicators then also enables us to define more realistic targets.
• Define targets. Indicators must be targeted in terms of quantity, quality and time. If any of these three are missing, we cannot be entirely objective about whether we have been successful or not. In setting targets, we must ask: “How much is enough to achieve higher- level objectives, what quality must it be, and by when do we need it?”. For example, if the desired outcome is stated as “increased household income”, our indicator may be “monthly earnings in USD”, and the target may be set at a “30% increase by 2013 (from legal income-generating activities)”. If setting firm numerical targets is too arbitrary, then targets can also be expressed as a range. Each indicator is expected to have only one target over a specified time frame.
• Ensure consistency. While it is not always possible, an effort should be made to keep the indicators that are agreed upon before the start of the project in order to ensure consistency of our monitoring over time. That said, it is not uncommon to add new indicators and drop old ones over time as we modify the programme design or streamline the monitoring system.
Step 2: Data collection The selection of indicators to be used for our monitoring system depends not only on the project structure and objectives, but also on data availability and the time and skills requested for their collection.
a) Select a data collection method The data collection method represents our source of information. Identifying appropriate indicators therefore has to go hand in hand with selecting data collection methods. If an indicator cannot be measured or the information is not available, then it does not serve its purpose to reflect progress of our objectives. Thus, if we are not able to collect data for an indicator we chose, we have to replace that indicator.

94
The specific data collection method selected will depend on the type of indicator to be used and on the M&E activities to be carried out. We usually differentiate between two broad categories of data collection methods:
• Quantitative methods aim to provide an objectively measurable picture of a situation in some strictly predetermined ways. They provide information about the population of interest in closed-form and usually quantitative dimensions, including, for example, demographic, socio-economic or other characteristics. They are usually based on standardized structured instruments that facilitate aggregation and comparative analysis. Common examples include tests, surveys and censuses. They rely less on the subjective interpretation of information by evaluators or interviewers.
• Qualitative methods aim to provide a deeper understanding of how and why people think and behave the way they do. They seek to understand events from their perspective, to analyse the meaning of events for people in particular situations, and to understand how they interpret their experiences and construct reality. Qualitative methods can therefore provide in-depth information on beneficiaries, programmes, and the institutional and socio-cultural context. Common examples of qualitative methods include unstructured or semi-structured interviews, focus group discussions, case studies and participant observation. These methods require greater interpretation on the part of interviewers and evaluators.
While quantitative (i.e. survey-based) methods usually achieve higher standards of reliability and validity, they are typically more expensive, time-consuming and require particular skills in statistics. Qualitative methods, on the other hand, are potentially quicker to implement, and are therefore often used as rapid appraisal tools – that is, tools “to provide timely, relevant information to decision makers on pressing issues they face in the project and program setting” (Kusek & Rist, 2004, p.123). Qualitative methods require extensive training in anthropology or sociology, as well as specific training in the implementation of these tools, which are arguably more difficult to do well. The rules governing statistics are transparent and comparatively easy to follow, requiring little independent judgment from the analyst; the rules governing the interpretation of interviews are not so well formalized and leave the analyst considerably more room for manoeuvre when interpreting the data. As a result, qualitative methods are more difficult to generalize, and are usually less credible with decision makers (TIPS #11: The Role of Evaluation in USAID”, 1997). Given the advantages and limitations of both categories, a mixture of qualitative and quantitative methods a (mixed-methods approach) is often recommended to gain a comprehensive view of the programme’s quality of implementation and effectiveness. Different collection mechanisms are more or less well suited for different levels of the results chain. Input and process indicators will rely primarily on management records that illustrate the use of resources and the implementation of activities. Direct observation and field visits can be used to record data for output indicators (for instance, number of small businesses created). Measuring outcomes often requires a combination of formal surveys that provide reliable quantitative information and additional qualitative methods such as key informant interviews or focus groups to understand the underlying mechanisms of how certain effects were achieved (or not). Finally, since higher-level outcomes usually relate to broader changes outside the full control of the project, official statistics are often useful.
b) Define the frequency of data collection The interval of monitoring activities will depend upon the monitoring purposes. As a rule of thumb, the higher the level of the results chain, the less frequently we will need to collect data, but the more difficult it usually becomes to obtain accurate information. Annex A.5 presents an example of how frequency of data collection may be determined.

95
c) Putting it all together: The measurement and reporting system Monitoring has little value if we do not learn and act on the information that comes out of the analysis of data collected. Learning is the main reason why a project or organization monitors its work on a regular basis, as it is a major ingredient for project management. By learning what we are doing right and what we are doing wrong, we, as a project or organization, have an opportunity to react in an informed and constructive way. Being in a constant mode of action-reflection-action also helps to make us less complacent. Sometimes, we may feel that we “have got it right”, we settle back and do things the same way over and over, without questioning whether we are still on the right path. We forget that situations change, that the needs of project beneficiaries may change, and that strategies and project activities need to be reconsidered and revised. Organizations and projects that don’t learn, stagnate; rigorous monitoring forces us to keep learning (adapted from Shapiro & Levine, 1999). In order to translate the learning into action, we need to make the necessary decisions that take us forward. In brief, this means that we need to do the following: • Look at the potential consequences on our original plans of what we have learned from the
analysis of our monitoring data • Draw up a list of options for action
• Discuss the options with internal and/or external stakeholders and get consensus on what we should do and a mandate to take action
• Share adjustments and plans with the rest of the organization and, if necessary, our donors and beneficiaries
• Implement
• Monitor Following the process of collecting and analysing information, we will report findings. We will report to different stakeholders in different ways, sometimes in written form, sometimes verbally. Typically, the higher up the chain of command, the less need there is for extensive detail and explanation; aggregated, succinct data relevant to the specific issue will be more appropriate (Kusek & Rist 2004, p. 131). This may require tailoring information into the preferred format for decision makers and end users. It is always important to report monitoring data in comparison to their baseline and target values, and to present the information in a simple, clear and easily understandable format. Visual tools, such as graphs, charts and maps can often be very useful in highlighting key data and messages. Building a monitoring system to continuously track implementation and performance is absolutely essential for programme managers, regardless of whether or not there will be an (impact) evaluation. The monitoring system gives ongoing information (via select indicators) on the direction, pace, and magnitude of change. It can also identify unanticipated changes. All are critical to knowing whether projects or programmes are moving in the intended direction (Kusek & Rist, 2004). Step 3: Articulating risks and assumptions What are the key factors that could diminish the potential effects of our project and what steps can be taken to mitigate them? In any project, there are factors that we cannot control that will affect the success of our intervention. These could include items such as weather, political stability, the local security situation, support from local stakeholders, and so forth. A good understanding of these factors is therefore essential for good project design and for M&E.
• Identify assumptions during the design phase: We can identify assumptions by thinking of the factors critical to reaching our objectives on each level of the results chain and what could affect

96
these factors. Sometimes, a first set of assumptions may already have been formulated in the risk section of our funding proposals. The assumptions that are not under our control should be inserted in the results matrix at the level of objective they influence. In general terms, inputs and activities are more likely to be under the project’s control than outcomes and impacts.
• Monitor assumptions during project implementation: In order to provide an early warning system on potential constraints as well as on possible solutions, assumptions should be closely followed. This will enable us to know how they may be affecting project implementation and results, and therefore help us to explain deviations from our objectives and take corrective measures.
A.6. Evaluation methodology notes A theory of change Articulating a theory of change (TOC) should form part of every intervention. The best time to develop it is at the beginning of the project design process, when stakeholders can be brought together to develop a common vision for the project, its goals, and the path to achieving those goals. Using a TOC thus assists both the project manager and the evaluator in the following ways: • Increasing understanding about the programme and providing a common language
• Helping differentiate between “what we do” and “what we want to achieve” • Improving planning and management
• Identifying important variables to measure
• Providing a foundation for more in-depth evaluations In practice, a TOC can be modelled in a variety of ways, for example by using logic models, logical frameworks, outcome models, or results chains. All of these can help us understand the linkage between a programme and its expected outcomes. Their purpose is to provide stakeholders with a logical, plausible outline of how a sequence of events, for which a project is directly responsible, can lead to the desired results. They establish the causal logic from the initiation of the project (i.e. available resources), over transmission mechanisms (i.e. project activities), to the end (higher-level goals) (see Figure 21).

97
Figure 21: Components of a results chain and examples Our planned implementation process describes what resources we think we need to carry out our project and what we intend to do:
a) Inputs: Resources at the disposal of the project, including staff and budget.
b) Activities: These are the actions, processes, techniques, tools, events and technologies of the programme. Their description should usually begin with an action verb (e.g. provide, facilitate, deliver, organize).
c) Outputs: The tangible goods and services directly under the control of the implementing agency that the project activities produce. They indicate if a programme was delivered as intended. Outputs are typically expressed as completed actions (e.g. trained, participated, used, funded)
Our intended results describe the programme’s desired effects in the short- to long term.
a) Outcomes: The short- to medium-term effects (usually within several months up to 2 years) on the beneficiary population resulting from the project outputs. These may include changes in attitudes, behaviours, knowledge, skills, status, and so forth (e.g. increased, decreased, enhanced, improved, maintained). Outcomes are typically expressed at an individual level.
b) Higher-level outcomes: The long-term project goals usually relating to overall living standards (They can be influenced by multiple factors and are typically not under the full control of the programme.)
There are several important factors to consider when constructing a results chain, as follows.

98
Define the level of observation: Both in terms of the implementation and results, we may want to look at more than just the individual. In fact, we may also be interested in outputs and/or outcomes at the level of the household (i.e. the young person’s family), on the group/facility level (e.g. schools, vocational training centres), or at the level of the village/community. Consider the diversity of possible outcomes: Interventions can affect a multitude of outcomes, including, but far beyond, outcomes that directly relate to environmental impacts. Depending on the intervention, it may therefore be useful to target (and measure) a wide range of outcomes. Take unintended outcomes into account: Our project objective reflects the major desired outcome of the intervention. Yet, development projects are complex and our intervention may have unintended effects. Some of these unintended effects may be expected ex-ante, while others are unexpected and surprising. Both expected and unexpected outcomes may be positive or negative. It is important to include these potential outcomes in the results chain to realistically capture the full logic of the intervention and provide the basis to track all mechanisms at work. For example, there may be spillover effects from our intervention because the participating people transfer knowledge to family or community members who, in turn, may also benefit indirectly. We certainly would like to capture this effect. On the other hand, there may be negative effects that are not expected: For example, in an entrepreneurship project, some people may find themselves trapped in debt because their business did not survive. In other cases, where people are generating higher incomes thanks to the intervention, family members may stop working or even use the additional income to increase unhealthy behaviours such as alcohol and tobacco consumption. Again, we want to know whether these effects are actually at play. Researching similar projects can often help identify the range of potential positive and negative outcomes that we may have to expect. Avoid “naked” activities or outputs: When designing our project, we are often over-ambitious and tend to include too many activities that have little to do with our main project objective. This leads to redundant activities and outputs that do not directly contribute to the achievement of our goals. In the interest of a well-defined and efficient project, such “naked” activities and outputs should be avoided. Once we have a results chain, how do we know whether or not what has been planned is actually happening? One of the biggest challenges in developing a monitoring system is choosing what kind of information best reflects that we are reaching our objectives. To operationalize our results chain, we can try to identify appropriate indicators, data collection tools, and assumptions for each level of objectives, from inputs to higher-level outcomes. A logical framework provides a useful matrix to capture all these elements. Understanding the frequency of data collection – what matters, when and who does it? To illustrate the required frequency of data collection, imagine a job training programme that lasts for three months: • To run the training effectively and efficiently, we need real-time information about how many
resources we are using (in terms of budget, staff time, materials, etc.) – that is, our inputs, as well as how our activities are being implemented (e.g. How many hours of training are being offered every week?). This information will thus need to be collected fairly frequently, about every two weeks.
• Assessing the number and the composition of beneficiaries that are actually being trained (i.e. our output) would probably be done periodically – for example, every month – although this will rely on attendance information that may have been collected on a daily level.
• Whether the training had any effect on a person’s knowledge and ability to find employment (i.e. outcomes) will only become clear after the training is over. Short-term effects, such as an increase

99
in knowledge, may thus be measured at the end of the training, while medium-term effects, like whether jobs were secured would be measured three to six months after the intervention.
• Finally, higher-level outcomes such as increases in household income and positive spillover effects are usually unlikely to materialize in less than a year (although this depends on the local labour market) and would therefore only be measured in large intervals.
Given the greater complexity (and cost) of measuring information about outcomes and higher-level outcomes the frequency of collecting corresponding data must be carefully defined. Define who is responsible for collecting the data It is also important to have clearly defined responsibilities for data collection. Failing to define responsibilities will likely result in failing to collect the data. In practice, different types of monitoring will fall under the responsibility of different actors, both in the field and at the headquarters: • Project management
• Local project team members or M&E officer
• Local implementing partners (e.g. teachers, training provider, bank)
• Other local stakeholders (e.g. local authorities) • External consultants
• Survey firm

100


Independent Evaluation Unit Green Climate Fund
175 Art center-daero, Yeonsu-gu, Incheon 22004, Republic of Korea
Tel. (+82) 032-458-6428 [email protected]
https://ieu.greenclimate.fund
© Independent Evaluation Unit – the Green Climate Fund


![Welcome [] › docs › CygnusMusic... · committed to becoming the number 1 digital distributor, and each year with your help we grow bigger and bigger. This year alone we’ve distributed](https://static.fdocuments.us/doc/165x107/5f17bde7f9589c0f791faff4/welcome-a-docs-a-cygnusmusic-committed-to-becoming-the-number-1-digital.jpg)