
Becca Nepple, Dr. Dermot Hayes - U.S. Pork Exports- Situation & Outlook
47
Pork Academy U.S. Pork Exports Situation and Outlook Becca Nepple, VP International Marketing, National Pork Board Dermot Hayes, Professor, Iowa State University
-
Upload
john-blue -
Category
Economy & Finance
-
view
49 -
download
0
Transcript of Becca Nepple, Dr. Dermot Hayes - U.S. Pork Exports- Situation & Outlook

Pork AcademyU.S. Pork Exports Situation and Outlook
Becca Nepple, VP International Marketing, National Pork BoardDermot Hayes, Professor, Iowa State University

Checkoff Focus on International Trade

Areas of Checkoff Investment
• Marketing and promotion• Market research• Market intelligence• New product development
• Marketing and promotion• Market research• Market intelligence• New product development

Growth of US Market Due to Access

Partnership with USMEF

Where Are We Now?

Looking Back: 2014
• Value record: $6.674 B, ↑10%
• Volume: 4.803 B lbs, ↑2%
• Value at $62.45/head

Current: 1st Quarter 2015
• Value: ↓14% • Volume: ↓10%
– But, March showed largest volume of exports in 11 months– March showed a 10% increase from February
• Value at $48.48/head• 25% of production

Addressing Compounding IssuesWhat’s Happened?•China access•Russia closure…EU/Canada nimble•Currency issues…many competitors have advantages•West coast port issues…still backlog, loss of chilled value
What’s Coming?•MCOOL retaliation?•Expect big increase in U.S. production

Top US Export Markets: Jan-Mar 2015
Mexico 396.0, ↑7%Japan 229.1, ↓13%China/HK 149.4, ↓40%Korea 126.5, ↑43%Canada 107.8, ↑2%C/S Am 65.9, ↓8%Oceania 28.1, ↓41%Carrib 22.4, 0%ASEAN 20.9, ↓57%
Japan $386.6, ↓19%Mexico $321.2, ↓6%Canada $192.4, 0%Korea $180.4, ↑55%China/HK $152.1, ↓42%C/S Am $80.1, ↓5%Oceania $45.2, ↓37%Carrib $25.4, 0%ASEAN $21.0, ↓61%
Volume (Million Pounds) Value (Million $)
Source: USDA statistics compiled by USMEF, compared to 2014

Source: USDA/FAS, PSD Data
Lost Share of Global Pork Exports

Where Do We Go From Here?

We Have a Goal!
By 2020, increase pork exports through access to new markets and expansion of existing
markets, and achieve an increase an average annual increase of 9% in value and quantity
(compared to 2014 year-end data)
By 2020, increase pork exports through access to new markets and expansion of existing
markets, and achieve an increase an average annual increase of 9% in value and quantity
(compared to 2014 year-end data)

How? Move Muscle Meats

How? Move By-Products

How?
• Promotion• Focus in industry• Access• Product

Economist’s Perspective

Overview
• Big picture: where is the available land and what is the best way to move agricultural products?
• Obstacles to agricultural trade• Importance of trade agreements• Impact of trade on pork market in 2014 and 2015

World Map in Proportion to Population

World Map in Proportion to Arable Land

World Map in Proportion to Cereal Sales

Growth in Wealth (1975-2002)

Ship Grains or Meat?

So Why Do We See Grain Trains?
• Governments in Asia have traditionally protected their livestock and allowed for the free movement of grain
• They do this to encourage economic activity and to maintain a semblance of food security
• This means that free trade agreements result in additional meat exports

Where Does the Pork Come From?

US Currently Has FTAs with 20 Countries

Plus, Potential with 12 TPP Countries

Plus, Potential with EU

Colombia: An Example• Continued phase
out of duties• Solution to the
Trichinae barrier has provided better access for chilled product
• Sales hit $132 million in the past 12 months
• Is Peru next?

Colombia: An Example

Mexico: An Example
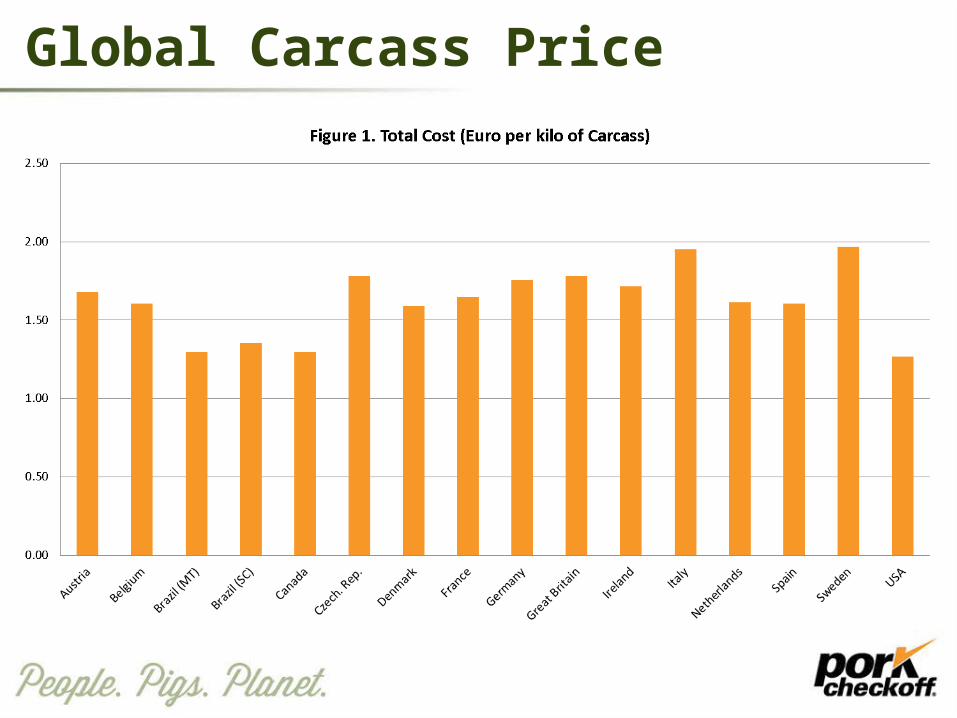
Global Carcass Price

Exports, Year Ending March
Partner CountryUnited States Dollars % Change
2015/20142013 2014 2015
World 6,356,995,286 6,444,731,449 6,731,950,793 4.46Japan 1,944,093,980 1,890,979,158 1,849,003,999 - 2.22 Mexico 1,159,058,123 1,416,170,806 1,675,061,418 18.28 Canada 866,787,832 835,798,099 911,654,074 9.08 Korea, South 374,053,384 303,748,135 518,770,970 70.79 China 736,872,753 769,366,505 378,068,857 - 50.86 Hong Kong 188,501,768 228,669,018 358,607,555 56.82 Australia 207,187,710 190,118,271 165,547,314 - 12.92 Russia 243,184,757 118,195 137,911,189 ∞ Colombia 58,574,462 112,876,080 132,428,229 17.32 Philippines 104,946,515 117,085,601 96,459,289 - 17.62 Singapore 26,408,708 65,239,398 59,592,371 - 8.66 Dominican Republic 37,271,308 45,903,784 49,469,672 7.77 Chile 45,810,074 64,398,717 48,028,675 - 25.42 Honduras 47,131,329 49,748,353 46,258,745 - 7.01 Guatemala 27,318,824 30,114,923 43,942,261 45.92 Taiwan 39,813,863 38,647,545 39,217,511 1.47 Panama 22,232,779 27,105,125 28,682,419 5.82 New Zealand 28,086,688 24,599,989 18,322,778 - 25.52 Peru 5,798,896 15,502,271 16,164,809 4.27
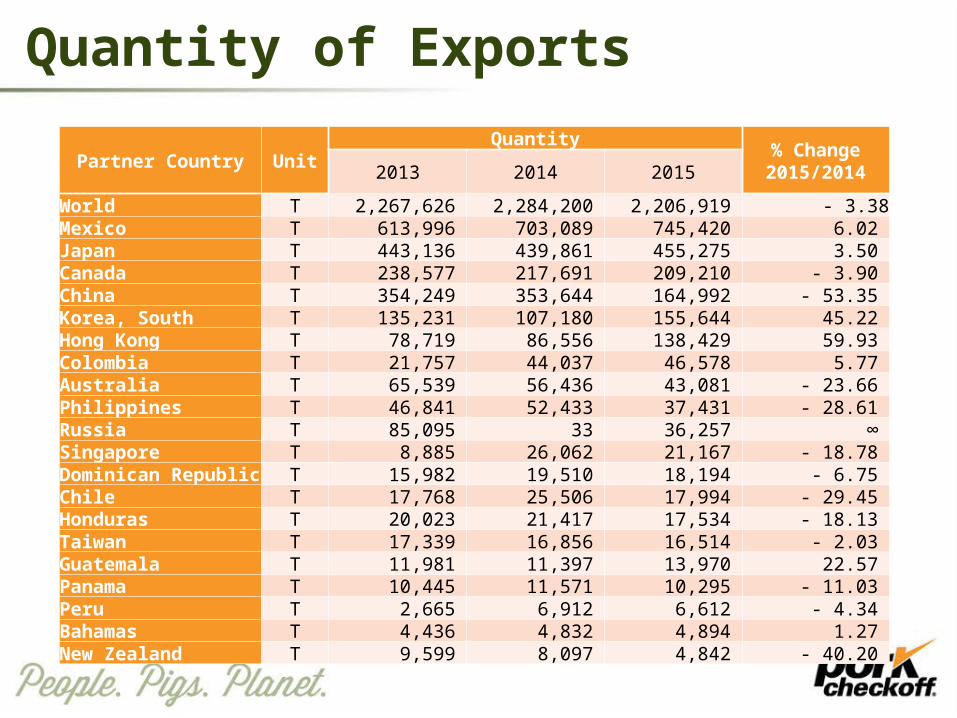
Quantity of Exports
Partner Country UnitQuantity % Change
2015/20142013 2014 2015
World T 2,267,626 2,284,200 2,206,919 - 3.38Mexico T 613,996 703,089 745,420 6.02 Japan T 443,136 439,861 455,275 3.50 Canada T 238,577 217,691 209,210 - 3.90 China T 354,249 353,644 164,992 - 53.35 Korea, South T 135,231 107,180 155,644 45.22 Hong Kong T 78,719 86,556 138,429 59.93 Colombia T 21,757 44,037 46,578 5.77 Australia T 65,539 56,436 43,081 - 23.66 Philippines T 46,841 52,433 37,431 - 28.61 Russia T 85,095 33 36,257 ∞ Singapore T 8,885 26,062 21,167 - 18.78 Dominican Republic T 15,982 19,510 18,194 - 6.75 Chile T 17,768 25,506 17,994 - 29.45 Honduras T 20,023 21,417 17,534 - 18.13 Taiwan T 17,339 16,856 16,514 - 2.03 Guatemala T 11,981 11,397 13,970 22.57 Panama T 10,445 11,571 10,295 - 11.03 Peru T 2,665 6,912 6,612 - 4.34 Bahamas T 4,436 4,832 4,894 1.27 New Zealand T 9,599 8,097 4,842 - 40.20

Impact of Exports on Live Hog Prices
• Last spring we had access to China and Russia, and Japan, South Korea and Mexico had PED
• As a result, export growth was strong and prices were high
• Since then the EU and Canada lost a half million ton market in Russia, we lost access to Russia and have had problems in China
• China is particularly important because it buys so many variety meats

China Opportunity
• A 10,000 ton change in direct monthly exports of pork and pork variety meats to China causes a $5.50/cwt change in live hog values for that month. This 10,000 tons represents the exports sales lost due to this restriction
• Exports to China have fallen by 15,000 per month• Paradoxically, China needs more imported pork
because it has killed millions of sows

February 2015 futures

June 2015 Futures

EU Exports to Asia

EU and US Exports to China


So, What Happens Next?
• 2014 pork production was only 2.5% lower than 2013 production, yet we had record prices; part of this was due to strong export demand
• USDA expects 8.9% more US pork production in the third quarter and 6.1% more pork in the fourth quarter, this is due to more sows, recovery from PED and lower cost of gain
• It would take a 10% growth in US pork consumption to clear this market unless exports grow…..very difficult unless we get an outbreak of bird flu in the south this fall

Three Possible Outcomes
• We solve the Ractopamine dilemma and get back into China, prices stay near those on the CME
• We enter into a price war with the EU and expand the volume, but not the value of exports
• US hog prices fall so much that weights fall and the surplus is eliminated

Questions and Comments


![Silence [becca fitzpatrick]](https://static.fdocuments.us/doc/165x107/5559bd13d8b42aaa6f8b4ca5/silence-becca-fitzpatrick-55849e329a513.jpg)