
Beardsell Limited - National Stock Exchange of India€¢ Beardsell’s Q2 revenues grew 35.5% y-o-y...
9
Beardsell Limited Enhancing investment decisions Q2FY11 Result Update
Transcript of Beardsell Limited - National Stock Exchange of India€¢ Beardsell’s Q2 revenues grew 35.5% y-o-y...

Beardsell Limited
Enhancing investment decisions
Q2FY11 Result Update
Explanation of CRISIL Fundamental and Valuation (CFV) matrix
The CFV Matrix (CRISIL Fundamental and Valuation Matrix) addresses the two important analysis of an investment
making process – Analysis of Fundamentals (addressed through Fundamental Grade) and Analysis of Returns (Valuation
Grade) The fundamental grade is assigned on a five-point scale from grade 5 (indicating Excellent fundamentals) to
grade 1 (Poor fundamentals) The valuation grade is assigned on a five-point scale from grade 5 (indicating strong
upside from the current market price (CMP)) to grade 1 (strong downside from the CMP).
CRISIL Fundamental Grade
Assessment CRISIL Valuation Grade
Assessment
5/5 Excellent fundamentals 5/5 Strong upside (>25% from CMP)
4/5 Superior fundamentals 4/5 Upside (10-25% from CMP)
3/5 Good fundamentals 3/5 Align (+-10% from CMP)
2/5 Moderate fundamentals 2/5 Downside (- 10-25% from CMP)
1/5 Poor fundamentals 1/5 Strong downside (<-25% from CMP)
Analyst Disclosure Each member of the team involved in the preparation of the grading report, hereby affirms that there exists no conflict
of interest that can bias the grading recommendation of the company. Additional Disclosure This report has been sponsored by NSE - Investor Protection Fund Trust (NSEIPFT). Disclaimer: This Exchange-commissioned Report (Report) is based on data publicly available or from sources considered
reliable. CRISIL Ltd. (CRISIL) does not represent that it is accurate or complete and hence, it should not be relied upon
as such. The data / Report are subject to change without any prior notice. Opinions expressed herein are our current
opinions as on the date of this Report. Nothing in this Report constitutes investment, legal, accounting or tax advice or
any solicitation, whatsoever. The subscriber / user assumes the entire risk of any use made of this data / Report.
CRISIL especially states that it has no financial liability, whatsoever, to the subscribers / users of this Report. This
Report is for the personal information only of the authorized recipient in India only. This Report should not be
reproduced or redistributed or communicated directly or indirectly in any form to any other person – especially outside
India or published or copied in whole or in part, for any purpose.
CRISIL EQUITIES | 1
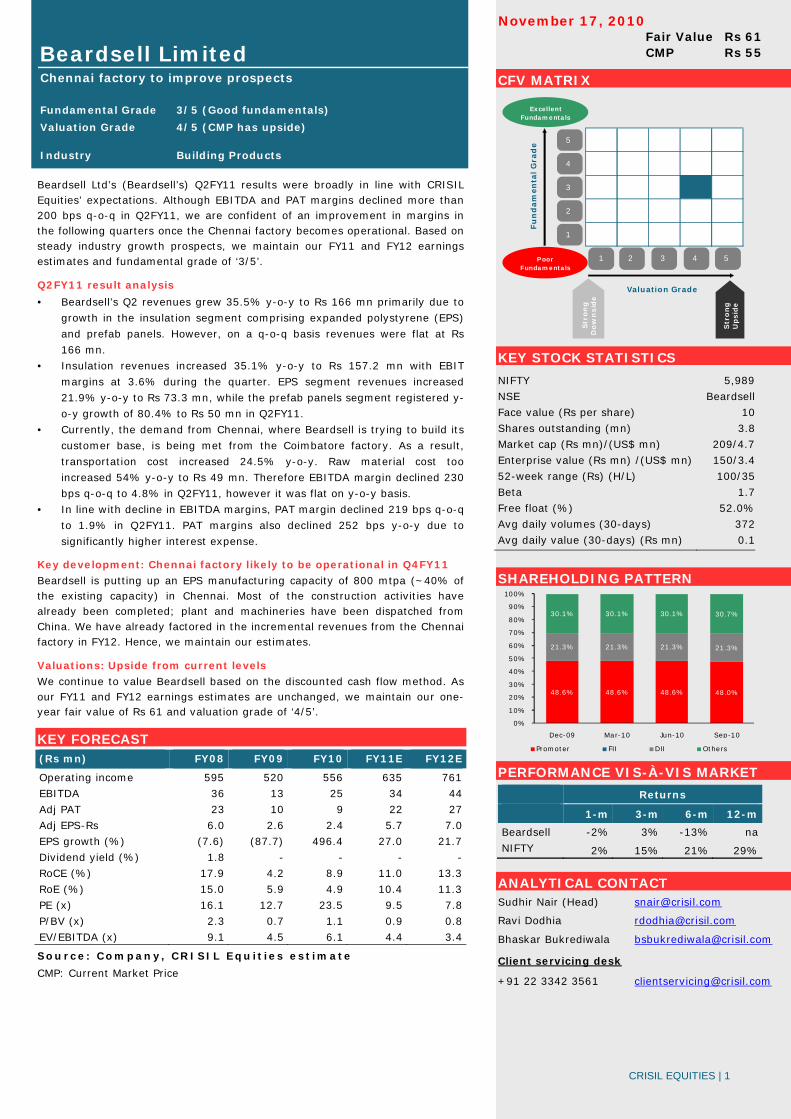
Beardsell Limited Chennai factory to improve prospects Fundamental Grade 3/5 (Good fundamentals)
Valuation Grade 4/5 (CMP has upside)
Industry Building Products
Fair Value Rs 61 CMP Rs 55
November 17, 2010
Beardsell Ltd’s (Beardsell’s) Q2FY11 results were broadly in line with CRISIL Equities’ expectations. Although EBITDA and PAT margins declined more than 200 bps q-o-q in Q2FY11, we are confident of an improvement in margins in the following quarters once the Chennai factory becomes operational. Based on steady industry growth prospects, we maintain our FY11 and FY12 earnings estimates and fundamental grade of ‘3/5’.
Q2FY11 result analysis
• Beardsell’s Q2 revenues grew 35.5% y-o-y to Rs 166 mn primarily due to
growth in the insulation segment comprising expanded polystyrene (EPS)
and prefab panels. However, on a q-o-q basis revenues were flat at Rs
166 mn.
• Insulation revenues increased 35.1% y-o-y to Rs 157.2 mn with EBIT
margins at 3.6% during the quarter. EPS segment revenues increased
21.9% y-o-y to Rs 73.3 mn, while the prefab panels segment registered y-
o-y growth of 80.4% to Rs 50 mn in Q2FY11.
• Currently, the demand from Chennai, where Beardsell is trying to build its
customer base, is being met from the Coimbatore factory. As a result,
transportation cost increased 24.5% y-o-y. Raw material cost too
increased 54% y-o-y to Rs 49 mn. Therefore EBITDA margin declined 230
bps q-o-q to 4.8% in Q2FY11, however it was flat on y-o-y basis.
• In line with decline in EBITDA margins, PAT margin declined 219 bps q-o-q
to 1.9% in Q2FY11. PAT margins also declined 252 bps y-o-y due to
significantly higher interest expense.
Key development: Chennai factory likely to be operational in Q4FY11
Beardsell is putting up an EPS manufacturing capacity of 800 mtpa (~40% of the existing capacity) in Chennai. Most of the construction activities have already been completed; plant and machineries have been dispatched from China. We have already factored in the incremental revenues from the Chennai factory in FY12. Hence, we maintain our estimates.
Valuations: Upside from current levels
We continue to value Beardsell based on the discounted cash flow method. As our FY11 and FY12 earnings estimates are unchanged, we maintain our one-year fair value of Rs 61 and valuation grade of ‘4/5’.
KEY FORECAST
(Rs mn) FY08 FY09 FY10 FY11E FY12E
Operating income 595 520 556 635 761
EBITDA 36 13 25 34 44
Adj PAT 23 10 9 22 27
Adj EPS-Rs 6.0 2.6 2.4 5.7 7.0
EPS growth (%) (7.6) (87.7) 496.4 27.0 21.7
Dividend yield (%) 1.8 - - - -
RoCE (%) 17.9 4.2 8.9 11.0 13.3
RoE (%) 15.0 5.9 4.9 10.4 11.3
PE (x) 16.1 12.7 23.5 9.5 7.8
P/BV (x) 2.3 0.7 1.1 0.9 0.8
EV/EBITDA (x) 9.1 4.5 6.1 4.4 3.4
Source: Company, CRISIL Equ it ies est imate
CMP: Current Market Price
CFV MATRIX
KEY STOCK STATISTICS
NIFTY 5,989
NSE Beardsell
Face value (Rs per share) 10
Shares outstanding (mn) 3.8
Market cap (Rs mn)/(US$ mn) 209/4.7
Enterprise value (Rs mn) /(US$ mn) 150/3.4
52-week range (Rs) (H/L) 100/35
Beta 1.7
Free float (%) 52.0%
Avg daily volumes (30-days) 372
Avg daily value (30-days) (Rs mn) 0.1
SHAREHOLDING PATTERN
PERFORMANCE VIS-À-VIS MARKET
Returns
1-m 3-m 6-m 12-m
Beardsell -2% 3% -13% na
NIFTY 2% 15% 21% 29%
ANALYTICAL CONTACT Sudhir Nair (Head) [email protected]
Ravi Dodhia [email protected]
Bhaskar Bukrediwala [email protected]
Client servicing desk
+91 22 3342 3561 [email protected]
1 2 3 4 5
1
2
3
4
5
Valuation Grade
Fu
nd
am
en
tal G
rad
e
Poor Fundamentals
ExcellentFundamentals
Str
on
gD
ow
nsid
e
Str
ong
Upsid
e
48.6% 48.6% 48.6% 48.0%
21.3% 21.3% 21.3% 21.3%
30.1% 30.1% 30.1% 30.7%
0%
10%
20%
30%
40%
50%
60%
70%
80%
90%
100%
Dec-09 Mar-10 Jun-10 Sep-10
Promoter FII DII Others

CRISIL EQUITIES | 2
Beardsell Limited
Q2FY11 Result Summary
Source: Company, CRISIL Equ it ies
Insulation segment’s EBIT declined significantly Trading segment’s revenues improved in Q2FY11
Source: Company, CRISIL Equ it ies Source: Company, CRISIL Equ it ies
10%11%
9%
14% 14%
12%
7%
8%
12%
4%
0%
2%
4%
6%
8%
10%
12%
14%
16%
100
110
120
130
140
150
160
Q1FY0
9
Q2FY0
9
Q3FY0
9
Q4FY0
9
Q1FY1
0
Q2FY1
0
Q3FY1
0
Q4FY1
0
Q1FY1
1
Q2FY1
1
Rs mn
Insulation revenues EBIT margins (RHS)
9 7 12
13
6 6 6
10 7 9
-40%
-62%
-12%-23%
-36%
-5%
-54%
-17%
27%
42%
-90%
-60%
-30%
0%
30%
60%
5
7
9
11
13
15
Q1FY0
9
Q2FY0
9
Q3FY0
9
Q4FY0
9
Q1FY1
0
Q2FY1
0
Q3FY1
0
Q4FY1
0
Q1FY1
1
Q2FY1
1
Rs mn
Trading revenues y-o-y growth (RHS)
(Rs mn) Q2FY11 Q1FY11 Q2FY10 q-o-q (%) y-o-y (%)
Net sales 166 166 123 0.4 35.5
Raw materials cost 49 51 32 (2.6) 54.3
Raw materials cost (% of net
sales) 29.7% 30.6% 26.1% -90bps 363bps
Employees cost 14 14 12 2.9 20.0
Other expenses 95 90 73 5.9 29.6
EBITDA 8 12 6 (32.2) 36.7
EBITDA margin 4.8% 7.1% 4.7% -230bps 4bps
Depreciation 2 2 1 (0.3) 173.0
EBIT 5.7 9.5 5.0 (39.8) 14.2
Interest and finance charges 2 1 0 95.0 862.9
Operating PBT 4 9 5 (55.1) (20.6)
Other Income 3 2 4 58.3 (35.8)
PBT 7 10 9 (35.9) (27.7)
Tax 3 3 4 (2.0) (7.2)
PAT 3 7 5 (53.3) (41.6)
Adj PAT 3 7 5 (53.3) (41.6)
Adj PAT margin 1.9% 4.1% 4.4% -219bps -252bps
No of equity shares (Mn) 3.8 3.8 3.8 - - Adj EPS (Rs) 0.8 1.8 1.4 (53.3) (41.6)
EBITDA margin declined 230 bps q-o-q due to higher transportation costs
PAT margin decline in line with EBITDA margin

CRISIL EQUITIES | 3
Beardsell Limited
EBITDA margins are highly volatile Q2 PAT margin declined 252 bps y-o-y to 1.9%
Source: Company, CRISIL Equ it ies Source: Company, CRISIL Equ it ies
Share price movement Fair value movement since initiation
-Indexed to 100
Source: NSE, CRISIL Equ ities Source: NSE, CRISIL Equ ities
119 131 116 123 150 165 166 166
4.0%
-11.9%
8.9%
4.7%2.6%
3.2% 7.1% 4.8%
-16%
-12%
-8%
-4%
0%
4%
8%
12%
100
110
120
130
140
150
160
170
Dec
-08
Mar-
09
Jun-0
9
Sep-0
9
Dec
-09
Mar-
10
Jun-1
0
Sep-1
0
(Rs mn)
Revenue EBITDA margin (RHS)
3 -10 5 5 2 20 7 3
2.3%
-8.0%
4.1% 4.4%1.3%
11.9%
4.1%
1.9%
-12%
-8%
-4%
0%
4%
8%
12%
16%
-20
-15
-10
-5
0
5
10
15
20
Dec
-08
Mar
-09
Jun-0
9
Sep-
09
Dec
-09
Mar
-10
Jun-1
0
Sep-
10
(Rs mn)
PAT PAT margin (RHS)
0
50
100
150
200
250
Jan-1
0
Feb-
10
Mar
-10
Apr-
10
May-1
0
Jun-
10
Jul-
10
Aug-1
0
Sep
-10
Oct
-10
Nov-1
0
Beardsell NIFTY
-
500
1,000
1,500
2,000
2,500
-
10
20
30
40
50
60
70
May
-10
Jun-1
0
Jul-
10
Aug
-10
Sep-
10
Oct
-10
Nov
-10
(Rs)
Total Traded Quantity(RHS) Beardsell CRISIL Fair Value

CRISIL EQUITIES | 4
Beardsell Limited
VALUATION We continue to value Beardsell based on the discounted cash flow method. We
maintain our fair value estimate for Beardsell at Rs 61. At this value, the implied
P/E multiples are 10.7x FY11 earnings estimate and 8.8x FY12 earnings estimate.
One-year forward P/E band One-year forward EV/EBITDA band
Source: NSE, CRISIL Equ ities Source: NSE, CRISIL Equ ities
P/E – premium/discount to NIFTY P/E movement
Source: NSE, CRISIL Equ ities Source: NSE, CRISIL Equ ities
CRISIL IER reports released on Beardsell Date Nature of report Fundamental
grade
Fair value Valuation
grade
CMP
(on the date of report)
4-May-10 Initiating coverage* 3/5 Rs 54 2/5 Rs 64
1-June-10 Q4FY10 result update 3/5 Rs 54 2/5 Rs 60
18-Aug-10 Q1FY11 result update 3/5 Rs 61 4/5 Rs 53
17-Nov-10 Q2FY11 result update 3/5 Rs 61 4/5 Rs 55
* For detailed initiating coverage report please visit: www.ier.co.in
CRISIL Independent Equity Research reports are also available on Bloomberg (CRI <go>) and Thomson Reuters.
0
20
40
60
80
100
Jan-
10
Feb
-10
Mar-
10
Apr
-10
May
-10
Jun-1
0
Jul-
10
Aug
-10
Sep-1
0
Oct
-10
Nov-
10
(Rs)
Beardsell 5x 6x 7x 8x 9x
0
50
100
150
200
250
300
350
Jan-1
0
Feb-
10
Mar-
10
Apr-
10
May-
10
Jun-
10
Jul-
10
Aug-1
0
Sep
-10
Oct
-10
Nov-1
0
(Rs mn)
EV 3x 4x 5x 6x
-80%
-60%
-40%
-20%
0%
20%
Jan-
10
Feb
-10
Mar-
10
Apr
-10
May-
10
Jun-1
0
Jul-
10
Aug-
10
Sep-1
0
Oct
-10
Nov-
10
Premium/Discount to NIFTY Median
0
2
4
6
8
10
12
14
16
18
20
Jan-
10
Feb
-10
Mar-
10
Apr
-10
May
-10
Jun-1
0
Jul-
10
Aug
-10
Sep-
10
Oct
-10
Nov-
10
1yr Fwd PE (x) Median PE
+1 std dev
-1 std dev
CRISIL EQUITIES | 5
Beardsell Limited
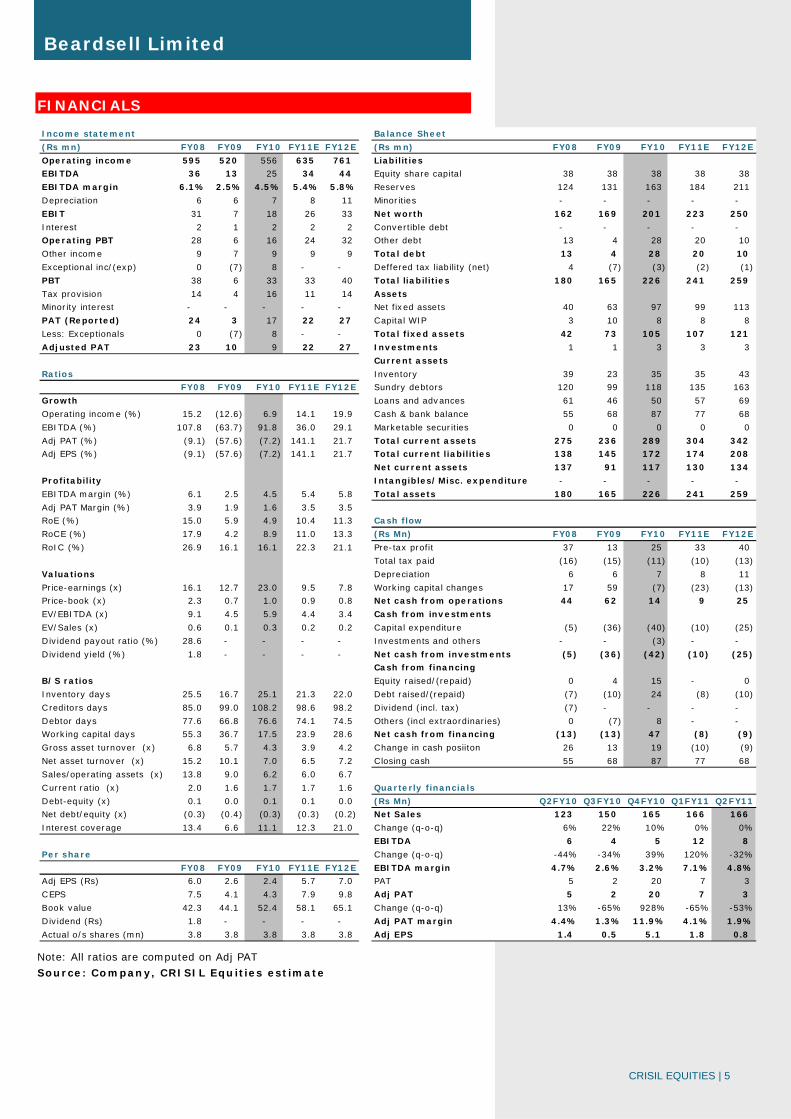
FINANCIALS
Note: All ratios are computed on Adj PAT
Source: Company, CRISIL Equities estimate
Income statement Balance Sheet
(Rs mn) FY08 FY09 FY10 FY11E FY12E (Rs mn) FY08 FY09 FY10 FY11E FY12E
Operating income 595 520 556 635 761 Liabilities
EBITDA 36 13 25 34 44 Equity share capital 38 38 38 38 38
EBITDA margin 6.1% 2.5% 4.5% 5.4% 5.8% Reserves 124 131 163 184 211
Depreciation 6 6 7 8 11 Minorities - - - - -
EBIT 31 7 18 26 33 Net worth 162 169 201 223 250
Interest 2 1 2 2 2 Convertible debt - - - - -
Operating PBT 28 6 16 24 32 Other debt 13 4 28 20 10
Other income 9 7 9 9 9 Total debt 13 4 28 20 10
Exceptional inc/(exp) 0 (7) 8 - - Deffered tax liability (net) 4 (7) (3) (2) (1)
PBT 38 6 33 33 40 Total liabilities 180 165 226 241 259
Tax provision 14 4 16 11 14 Assets
Minority interest - - - - - Net fixed assets 40 63 97 99 113
PAT (Reported) 24 3 17 22 27 Capital WIP 3 10 8 8 8
Less: Exceptionals 0 (7) 8 - - Total fixed assets 42 73 105 107 121
Adjusted PAT 23 10 9 22 27 Investments 1 1 3 3 3
Current assets
Ratios Inventory 39 23 35 35 43
FY08 FY09 FY10 FY11E FY12E Sundry debtors 120 99 118 135 163
Growth Loans and advances 61 46 50 57 69
Operating income (%) 15.2 (12.6) 6.9 14.1 19.9 Cash & bank balance 55 68 87 77 68
EBITDA (%) 107.8 (63.7) 91.8 36.0 29.1 Marketable securities 0 0 0 0 0
Adj PAT (%) (9.1) (57.6) (7.2) 141.1 21.7 Total current assets 275 236 289 304 342
Adj EPS (%) (9.1) (57.6) (7.2) 141.1 21.7 Total current liabilities 138 145 172 174 208
Net current assets 137 91 117 130 134
Profitability Intangibles/Misc. expenditure - - - - -
EBITDA margin (%) 6.1 2.5 4.5 5.4 5.8 Total assets 180 165 226 241 259
Adj PAT Margin (%) 3.9 1.9 1.6 3.5 3.5
RoE (%) 15.0 5.9 4.9 10.4 11.3 Cash flow
RoCE (%) 17.9 4.2 8.9 11.0 13.3 (Rs Mn) FY08 FY09 FY10 FY11E FY12E
RoIC (%) 26.9 16.1 16.1 22.3 21.1 Pre-tax profit 37 13 25 33 40
Total tax paid (16) (15) (11) (10) (13)
Valuations Depreciation 6 6 7 8 11
Price-earnings (x) 16.1 12.7 23.0 9.5 7.8 Working capital changes 17 59 (7) (23) (13)
Price-book (x) 2.3 0.7 1.0 0.9 0.8 Net cash from operations 44 62 14 9 25
EV/EBITDA (x) 9.1 4.5 5.9 4.4 3.4 Cash from investments
EV/Sales (x) 0.6 0.1 0.3 0.2 0.2 Capital expenditure (5) (36) (40) (10) (25)
Dividend payout ratio (%) 28.6 - - - - Investments and others - - (3) - -
Dividend yield (%) 1.8 - - - - Net cash from investments (5) (36) (42) (10) (25)
Cash from financing
B/S ratios Equity raised/(repaid) 0 4 15 - 0
Inventory days 25.5 16.7 25.1 21.3 22.0 Debt raised/(repaid) (7) (10) 24 (8) (10)
C reditors days 85.0 99.0 108.2 98.6 98.2 Dividend (incl. tax) (7) - - - -
Debtor days 77.6 66.8 76.6 74.1 74.5 Others (incl extraordinaries) 0 (7) 8 - -
Working capital days 55.3 36.7 17.5 23.9 28.6 Net cash from financing (13) (13) 47 (8) (9)
Gross asset turnover (x) 6.8 5.7 4.3 3.9 4.2 Change in cash posiiton 26 13 19 (10) (9)
Net asset turnover (x) 15.2 10.1 7.0 6.5 7.2 Closing cash 55 68 87 77 68
Sales/operating assets (x) 13.8 9.0 6.2 6.0 6.7
Current ratio (x) 2.0 1.6 1.7 1.7 1.6 Quarterly financials
Debt-equity (x) 0.1 0.0 0.1 0.1 0.0 (Rs Mn) Q2FY10 Q3FY10 Q4FY10 Q1FY11 Q2FY11
Net debt/equity (x) (0.3) (0.4) (0.3) (0.3) (0.2) Net Sales 123 150 165 166 166
Interest coverage 13.4 6.6 11.1 12.3 21.0 Change (q-o-q) 6% 22% 10% 0% 0%
EBITDA 6 4 5 12 8
Per share Change (q-o-q) -44% -34% 39% 120% -32%
FY08 FY09 FY10 FY11E FY12E EBITDA margin 4.7% 2.6% 3.2% 7.1% 4.8%
Adj EPS (Rs) 6.0 2.6 2.4 5.7 7.0 PAT 5 2 20 7 3
CEPS 7.5 4.1 4.3 7.9 9.8 Adj PAT 5 2 20 7 3
Book value 42.3 44.1 52.4 58.1 65.1 Change (q-o-q) 13% -65% 928% -65% -53%
Dividend (Rs) 1.8 - - - - Adj PAT margin 4.4% 1.3% 11.9% 4.1% 1.9%
Actual o/s shares (mn) 3.8 3.8 3.8 3.8 3.8 Adj EPS 1.4 0.5 5.1 1.8 0.8
CRISIL Independent Equity Research Team
Mukesh Agarwal Director +91 (22) 3342 3035 [email protected]
Tarun Bhatia Director, Capital Markets +91 (22) 3342 3226 [email protected]
Chetan Majithia Head, Equities +91 (22) 3342 4148 [email protected]
Sudhir Nair Head, Equities +91 (22) 3342 3526 [email protected]
Nagarajan Narasimhan Director, Research +91 (22) 3342 3536 [email protected]
Ajay D'Souza Head, Research +91 (22) 3342 3567 [email protected]
Manoj Mohta Head, Research +91 (22) 3342 3554 [email protected]
Sachin Mathur Head, Research +91 (22) 3342 3541 [email protected]
Sridhar C Head, Research +91 (22) 3342 3546 [email protected] CRISIL’s Equity Offerings The Equity Group at CRISIL Research provides a wide range of services including:
Independent Equity Research IPO Grading White Labelled Research Valuation on companies for use of Institutional Investors, Asset Managers, Corporate
Other Services by the Research group include
CRISINFAC Industry research on over 60 industries and Economic Analysis Customised Research on Market sizing, Demand modelling and Entry strategies Customised research content for Information Memorandum and Offer documents

About CRISIL
CRISIL is India's leading Ratings, Research, Risk and Policy Advisory Company.
About CRISIL Research CRISIL Research is India's largest independent, integrated research house. We leverage our unique, integrated
research platform and capabilities spanning the entire economy-industry-company spectrum to deliver superior
perspectives and insights to over 750 domestic and global clients, through a range of subscription products and
customised solutions.
Vinaya Dongre – Head, Business Development
Email : [email protected] I Phone : 9920225174
To know more about CRISIL IER, please contact our team members:
Sagar Sawarkar – Senior Manager, Business Development
Email : [email protected] I Phone : 9821638322
Kolkata Priyanka Agarwal - Manager, Business Development Email : [email protected] I Phone : 9903060685 Mumbai Supriya Tapase - Manager, Business Development Email : [email protected] I Phone : 9820745668 New Delhi Vipin Saboo - Manager, Business Development Email : [email protected] I Phone : 9820779873
Ahmedabad I Mumbai I Pune Salil Srivastava - Manager, Business Development Email : [email protected] I Phone : 9833996430 Bengaluru I Chennai Anand Krishnamoorthy - Manager, Business Development Email : [email protected] I Phone : 9884704111 Hyderabad Kaliprasad Ponnuru - Manager, Business Development Email : [email protected] I Phone : 9642004668
Regional Contacts:
Head Office: CRISIL House, Central Avenue, Hiranandani Business Park, Powai, Mumbai - 400 076 Phone : 91-22-3342 3000 Web: www.crisil.com Download reports from: www.ier.co.in


![Girl Friends - Cap.35.5 [Omake]](https://static.fdocuments.us/doc/165x107/577ca5b71a28abea748ba1ca/girl-friends-cap355-omake.jpg)


