![1 Zhangbu Xu (BNL) What are in eSTAR LoI? Electron Beam Energy @ [10, 20] What infrastructure/community.](https://static.fdocuments.us/doc/165x107/56649c9a5503460f94957257/1-zhangbu-xu-bnl-httpsdrupalstarbnlgovstarstarnotespublicsn0592.jpg)
Beam Infrastructure Report - lexingtonky.gov
39
REGIONAL INFRASTRUCTURE REPORT BLUEGRASS ECONOMIC ADVANCEMENT MOVEMENT BE AM
Transcript of Beam Infrastructure Report - lexingtonky.gov
REGIONAL INFRASTRUCTURE
REPORT BLUEGRASS ECONOMIC
ADVANCEMENT MOVEMENT
BEAM
“
R E G I O N A L
I N F R A S T R U C T U R E
R E P O R T
B L U E G R A S S
E C O N O M I C
A D V A N C E M E N T
M O V E M E N T
1
REGIONAL INFRASTRUCTURE REPORTBLUEGRASS ECONOMIC ADVANCEMENT MOVEMENT
INFRASTRUCTURE COMMITTEEBluegrass Economic Advancement Movement
Greg Heitzman, Louisville Metropolitan Sewer District* (Co-Chair) Chris Hermann, Retired Utility Senior Executive* (Co-Chair) Jerry Acy, River Ridge Commerce Center William Azevedo, Lexington-Fayette Urban County Government James Ballinger, Department of Highways District 7 J. Barry Barker, Transit Authority of River City* David Billings, Frankfort Plant Board Brian Bingham, Louisville Metropolitan Sewer District Charlie Boland, Kentucky American Water Company Jim Brammell, Louisville Water Company* James Bruce, Hardin County Water District 1 Charlie Bryant, City of Elizabethtown Paul Buddeke, River Road Terminal Matt Bullock, Department of Highways District 5* Rocky Burke, Lextran Greg Cantrell, Port of Louisville Larry Chaney, Kentuckiana Regional Planning & Development Agency Vicki Coombs, Louisville Metropolitan Sewer District Tom Doyle, Shelbyville Water & Sewer Steve Eden, West Shelby Water District Steve Feese, Lexington-Fayette Urban County Solid Waste District Eric Frankl, Lexington-Fayette Urban County Airport Board David Freibert, LG&E and KU Tom Garrett, P&L Railroad David Hall, CSX Corporation Margaret Handmaker, Louisville Metro Government* Tom Hardesty, Mayor of Shelbyville, Kentucky Bob Helton, R. J. Corman Railroad Group* James Jeffries, Hardin County Water District 2 Jason Knoy, LG&E and KU Gary MacDonald, Metals USA Clark Maritime Centre Daniel Makela, Louisville Metro Government* John P. Malloy, LG&E and KU* Brack Marquette, Columbia Gas of Kentucky Charles Martin, Lexington-Fayette Urban County Government Larry McFall, Louisville and Jefferson County Riverport Authority* Skip Miller, Louisville Regional Airport Authority* Pat More, Duke Energy Dan O’Dea, Louisville Metro Public Works and Assets David Ratterman, Stites & Harbison Tom Rockaway, University of Louisville William Scalf, City of Frankfort Norman Schippert, BluegrassNet Karen Scott, Tetra Tech Scott Shapiro, Lexington-Fayette Urban County Government Ricky Sizemore, Department of Highways District 7 Jim Smith, Louisville Water Company Ted Smith, Louisville Metro Government W. Patrick Stallard, Stites & Harbison* Roy Sturgill, Kentucky Transportation Center Randy Turner, Department of Highways District 7 Kevin Wente, Department of Environmental Quality & Public Works
*Steering Committee member
FOR MORE INFORMATION:
Scott ShapiroSenior Advisor to Mayor Jim GrayOffice of the Mayor, [email protected]
Chris PoynterDirector of CommunicationsOffice of the Mayor, [email protected]
The report can also be found at www.louisvilleky.gov/BEAM and www.lexingtonky.gov/BEAM
A MESSAGE FROM BEAM LEADERS:
In 2011, as newly elected mayors of Lexington and Louisville, we launched an innovative partnership called the Bluegrass Economic Advancement Movement (or BEAM, for short). The goal of the BEAM partnership was to develop an action plan to spur economic growth in the 22-county region that includes and surrounds our two vibrant cities.
Thanks to research and expertise from The Brookings Institution Metropolitan Policy Program and guidance from leaders in government, business, and education from across the region, we published “Seizing the Manufacturing Moment: An Economic Growth Plan for the Economic Advancement Movement” in 2013.
We know that manufacturing offers solid career opportunities and that it is experiencing a resurgence in America. We also know that Lexington and Louisville together have a strong manufacturing base upon which to build. In short, we have all the tools we need for success. The BEAM plan offers the region a strategy designed to take our strengths in manufacturing and build on them to compete in an increasingly competitive global economy.
However, the completion of the BEAM plan was just the beginning. To fully seize the manufacturing moment, we realized our region must be built on a strong infrastructure network. Infrastructure – everything from roads and bridges to electricity and internet connectivity – is key to serving the region’s existing manufacturers as well as attracting new ones in the future.
With this in mind, we formed a committee of industry experts and government leaders from different infrastructure sectors to better understand our current infrastructure conditions and needs in the region. This BEAM Regional Infrastructure Report is the result of the committee’s hard work.
The endeavor showed the value of holistic, regional thinking when it comes to infrastructure. This report reviews the infrastructure needed to support manufacturing in three general areas: our essential services, including energy, water, wastewater, solid waste disposal, and communications infrastructure; moving people, via our ground and air transportation systems; and moving products, using our roadways, railroads, waterways, and airports.
We are pleased to present this infrastructure report – an important step in our effort to distinguish the BEAM region as a global center for advanced manufacturing.
Greg FischerMayor, Louisville
Jim GrayMayor, Lexington

R E G I O N A L
I N F R A S T R U C T U R E
R E P O R T
B L U E G R A S S
E C O N O M I C
A D V A N C E M E N T
M O V E M E N T
3
R E G I O N A L
R E G I O N A L
I N F R A S T R U C T U R E
R E P O R T
B L U E G R A S S
E C O N O M I C
A D V A N C E M E N T
M O V E M E N T
2
EXECUTIVE SUMMARY...........................................3
AVIATION SECTOR..................................................8
COMMUNICATIONS SECTOR...............................13
ENERGY SECTOR.................................................19
FREIGHT RAIL SECTOR........................................26
PUBLIC TRANSPORTATION SECTOR..................32
ROADS AND BRIDGES SECTOR..........................40
SOLID WASTE SECTOR.......................................47
WATER AND WASTEWATER SECTOR.................52
WATERWAYS SECTOR.........................................63
MAJOR DEVELOPMENT SITES............................69
The Bluegrass Economic Advancement Movement (BEAM) was launched by Mayor Greg Fischer of Louisville and Mayor Jim Gray of Lexington in 2011. Bringing together the 22 counties that include and surround Lexington and Louisville, this innovative and strategic partnership implements a regional economic development approach for the state’s two largest metropolitan areas. The report, “Seizing the Manufacturing Moment: An Economic Growth Plan for the Economic Advancement Movement,” was published in 2013 and serves as a roadmap for the region’s leaders. The overall goal of the Plan is to strengthen and leverage the region’s robust advanced manufacturing sector to capitalize fully on its potential to protect and create solid jobs and higher wages. To accomplish this goal, six strategies were designed to “seize the manufacturing moment” in the BEAM region:
1. GOVERNANCE: Solidify the partnership between Kentucky’s two largest metropolitan areas to guide implementation of the Economic Growth Plan and expand collaboration on growth strategies.
CONTENTS EXECUTIVE SUMMARY
The Bluegrass Economic Advancement MovementBEAM:

R E G I O N A L
I N F R A S T R U C T U R E
R E P O R T
B L U E G R A S S
E C O N O M I C
A D V A N C E M E N T
M O V E M E N T
5
R E G I O N A L
I N F R A S T R U C T U R E
R E P O R T
B L U E G R A S S
E C O N O M I C
A D V A N C E M E N T
M O V E M E N T
4
2. HUMAN CAPITAL: Become a world-class center for advanced manufacturing by developing a skilled workforce equipped to meet the demands of the 21st century.3. INNOVATION: Develop an integrated ecosystem of support for advanced manufacturing centered on innovation and technology.4. EXPORTS: Increase global demand for made-in-Kentucky products by helping BEAM manufacturers tap new and expanding export markets.5. REGIONAL CONCENTRATIONS AND CLUSTERS: Beyond manufacturing, invest in targeted regional assets to diversify the economy into technology-based firms and knowledge industries.6. PLACE MAKING: Strengthen the region’s competitive position by enhancing its metropolitan areas as attractive places to live, work, and do business.
The BEAM Regional Infrastructure Report
The goal of the BEAM Regional Infrastructure Report is to identify the critical gaps and develop recommendations for infrastructure that will support the strategies of the BEAM Regional Economic Growth Plan, focusing primarily on manufacturing. A strong infrastructure network is key to serving the region’s existing manufacturers and attracting new ones in the future. The report reviews the infrastructure needed to support manufacturing in three general areas:
• Essential Services• Moving People• Moving Products
Essential ServicesEnergy, water, wastewater, solid waste disposal, and communications infrastructure are necessary services for manufacturing.
The BEAM region’s energy, water, wastewater, and solid waste infrastructure have sufficient capacity to meet current and future manufacturing needs. Additionally, these services are provided at a relatively low cost compared to other parts of the country. This is an asset that will be important to maintain in order for the BEAM region to attract more manufacturing. Maintaining this cost advantage, however, may be a challenge as infrastructure continues to age, requiring facility upgrades.
The BEAM region has historically enjoyed relatively low energy costs due to the use of regional coal reserves. However, there are obstacles on the horizon that may challenge the region’s low-cost status. Given the age of much of the energy infrastructure, significant capital investments will be required to comply with current and future federal regulations.
An abundant supply of high-quality water is available for manufacturing. The BEAM region is benefitted by the Ohio River, a virtually unlimited supply of surface water. Reserve water and
wastewater capacity is currently available in urbanized areas; however, development sites in rural parts of the region are likely to require additional investment in water and sewer delivery infrastructure. Looking forward, due to increasing water quality standards and the need to replace aging infrastructure, rate increases for water and wastewater in BEAM counties are expected to average between 3.5% and 10% annually over the next five years.
The BEAM region’s solid waste infrastructure – namely its municipal landfills – has sufficient capacity for the foreseeable future. There are 16 landfills that are serving the BEAM counties, with anywhere from 17 to 110 years of capacity remaining.
Communications infrastructure is not traditionally categorized as an essential service. However, high-speed internet connectivity is quickly becoming a necessity as companies, particularly advanced manufacturers, are starting to collect and analyze vast amounts of data to gain a competitive advantage. Fiber-optic technology is receiving a lot of attention at the local, state, and federal government levels, and it is the next frontier in communications infrastructure. A majority of the BEAM region does not currently have access to fiber technology – market forces make it difficult to roll out high-speed internet access on a large scale. But as this report was being written, Kentucky Governor Steve Beshear proposed in his budget a $100 million investment in building a fiber-optic network that spans the state, including the BEAM region. Monitoring the project for its impact on the bandwidth needs of current and future manufacturing facilities will be essential.
Moving PeopleIt is critical that the region’s surface and air transportation systems efficiently move people throughout the BEAM region and far beyond for their work.
Surface transportation infrastructure includes roadway networks, bridges, public transit systems, and railroads. People rely on this network for personal transportation, public transportation, and transportation to points outside of the BEAM region.
People predominantly use personal automobiles for travel in the BEAM region. For this reason, effectively maintaining and expanding our roadway network is critical as the region’s economy and population grows. Conditions of roads and bridges vary across the region. Generally, deteriorated conditions are most prevalent in urban areas of Louisville and Lexington where the surface transportation network receives the heaviest use. The primary challenge is finding the right balance between maintaining the existing road network and providing additional capacity. This challenge will only grow if funding levels can’t keep up with an expanding roadway network.
A strong public transportation network gives commuters an important alternative method of traveling to work and can take some of the pressure off overburdened roadways in the region. Kentucky ranks last amongst its seven neighboring states in total and per capita investment in public transportation, making it challenging for mass transit in the BEAM region to link employers and employees, especially with large job sites located in sparsely populated areas far from the urban cores of Louisville and Lexington. However, the vanpool regional program

R E G I O N A L
I N F R A S T R U C T U R E
R E P O R T
B L U E G R A S S
E C O N O M I C
A D V A N C E M E N T
M O V E M E N T
6
is a successful transportation mode that appears to be meeting current demand. It provides a cost-effective and user-friendly option for commuters in the BEAM region. In the short-term, more reliance on vanpools could help better serve low-density areas throughout the region, while passenger rail should be considered as a longer term possibility for connecting the BEAM region.
In an increasingly global economy, it is important that people in the BEAM region have easy access to other parts of the world. The region is served by two commercial passenger airports – Blue Grass Airport in Lexington and Louisville International Airport – as well as seven general aviation airports that principally serve corporate aircraft. Together, the region’s two primary airports have service to eight of the nation’s top ten international gateways, which allows for quick connections to major global destinations. On the other hand, the two airports have several service gaps domestically, including the lack of nonstop service to the west coast, Toronto, and Boston.
Moving ProductsManufacturers rely on the BEAM region’s roadways, railroads, airports, and inland waterways to move products quickly.
To provide efficient and effective freight movement throughout any region, an integrated, multimodal transportation network is essential. Within the BEAM region, the transportation sectors available to manufacturing include water, rail, road, and air. Efforts should be made to strengthen connections between these modes of transportation in order to take advantage of the region’s existing assets.
Based on fuel efficiency and cargo capacity, movement by waterways is arguably the most efficient transportation mode. The Ohio River, a major waterway for freight movement, runs through the region, bordering eight BEAM counties. The major ports of the BEAM region currently have adequate, if not excess, capacity for freight transport. The port facilities are positioned to grow in size and capability as demand increases in the future. Although not in the BEAM region, the expansion of the Panama Canal has the potential to open up new markets for the region’s ports and manufacturers.
The freight rail system within the BEAM region is extensive and well established, with a variety of rail companies providing local, regional, and national service. However, in order to meet the growing needs of existing and new manufacturing facilities, extensive infrastructure improvement such as new passing tracks and rail replacement will be necessary. Additionally, the preservation of right-of-ways is very important to current and future rail success.
As noted previously, conditions of roadways vary throughout the BEAM region and are generally most deteriorated within the urban areas. To meet the needs of a growing manufacturing sector and continually improve the safety, conditions, and capacity of the region’s roadways, a sustainable source of funding is necessary. Greater reliance on rail, water, and air freight movement through better intermodal connectivity would reduce the burden on the region’s roadways.
And finally, air freight facilities are available at both the Louisville and Lexington airports. The UPS Worldport® facility is located at the Louisville International Airport, providing overnight and one-day air freight service worldwide.
ConclusionDeveloping strong infrastructure is critical if the BEAM region wants to “seize the manufacturing moment.” The BEAM region faces several infrastructure challenges – aging systems, growing funding needs, and more access to community-wide broadband internet and public transit – to name a few. However, the BEAM region also has distinct strengths – access to low-cost water and energy, the UPS Worldport® facility, potential large-scale public investment in fiber-optic networks, and all of the ingredients for a great intermodal freight network – that if built upon can serve a growing manufacturing sector.
This effort showed the value of holistic, regional thinking when it comes to infrastructure. As the report illustrates, these systems do not exist within jurisdictional vacuums. Movement of goods and people goes beyond individual cities and counties. Furthermore, freight typically moves by various modes of travel along its journey. More coordination is needed between state, regional, and local jurisdictions; between different sectors of infrastructure; and between public and private entities. Efforts like this need to continue, and it is recommended that this review of the BEAM region’s infrastructure should be repeated in five years.
In addition to primary research conducted by a number of the state’s infrastructure leaders, information from the Kentucky Infrastructure Report Card, published in 2011 by the American Society of Civil Engineers (ASCE), was utilized for the BEAM Regional Infrastructure Report. The Report Card evaluated various infrastructure sectors for the Commonwealth of Kentucky. This report follows a similar model, but focuses in on the BEAM region and an assessment of infrastructure as it relates to manufacturing. To tackle such a broad subject matter, the report evaluates the conditions and provides recommendations for the following infrastructure sectors: aviation, communications, energy, freight rail, public transportation, roads and bridges, solid waste, water and wastewater, and waterways. It then concludes with an inventory of the infrastructure conditions at the major economic development sites in the BEAM region.

R E G I O N A L
I N F R A S T R U C T U R E
R E P O R T
B L U E G R A S S
E C O N O M I C
A D V A N C E M E N T
M O V E M E N T
8
R E G I O N A L
I N F R A S T R U C T U R E
R E P O R T
B L U E G R A S S
E C O N O M I C
A D V A N C E M E N T
M O V E M E N T
9
Transportation Equipment
Machinery
Chemicals
Electrical Equipment
Travel & Tourism
Primary Metal
Food Products
Royalties
Computer & Electronics
Petroleum & Coal Products
Mexico
United Kingdom
Brazil
China
Canada
Japan
CHAPTER 1: AVIATION SECTOR
IntroductionAn important consideration for any commercial site selector is the quality, capability, and proximity of the local airport to a prospective industrial site. Site selectors will find access to the National Air Transportation System is robust throughout the BEAM region. The region is served by two commercial airports offering scheduled airline passenger and cargo services, as well as seven general aviation airports that principally serve corporate aircraft.
As a key point, Louisville International Airport is home to UPS’s all-points connecting hub, Worldport®, which provides overnight and one-day air freight service to most major cities around the world. The facility has 70 aircraft docks and 155 miles of conveyors. In a single day, it processes goods from over 130 aircraft and sorts an average of 1.6 million packages. The Worldport® facility, located within the BEAM region, is the largest fully automated package handling facility in the world.
This chapter includes capacity information on the BEAM region’s commercial service airports and general aviation airports. Additionally, a detailed schedule for passenger and cargo services at Louisville International Airport and Blue Grass Airport is provided, including passenger service gaps for scheduled commercial flights. And lastly, legislative recommendations (on both a state and federal level) are identified to address challenges facing airports in the BEAM region.
Current ConditionsWithin the 22 BEAM counties, nine airports currently serve the area. Table 1.1 identifies each airport, including key infrastructure parameters, while Figure 1.1 shows the location of the airports. The region’s nine airports offer a diverse complement of infrastructure to support manufacturing in this area. In 2011, the American Society of Civil Engineers (ASCE) prepared a report card evaluating the condition of infrastructure systems in the state of Kentucky. The grade given to the aviation sector was C+. This grade was primarily the result of two major issues related to long-term financial support of the facilities. First, in 2011, airports were suffering from the inability of Congress to authorize new legislation to support the aviation industry. The result was more than 22 extensions to the bill that provided funding to airports across the country. Second, the jet fuel tax in place to support airport facilities in Kentucky was capped. This fuel tax cap prevented the Commonwealth from providing additional funds to the airports without tax increase legislation.
–––––––––––––––––––––––––––––––––––––––––––––––––––––––––––––––––––––––––––––––––––––––––––––––––––––––––––––––––––––––––––––––––––––––––––––––––––––––––––––––––––––––––––––––––––––––––––––––
1Commercial Service Airports are publicly owned airports that have at least 2,500 passenger boardings each calendar year and receive scheduled passenger service. Primary Airports are Commercial Service Airports that have more than 10,000 passenger boardings each year. Reliever Airports, which may be publicly or privately-owned, are airports designated by the Federal Aviation Administration (FAA) to relieve congestion at Commercial Service Airports and to provide improved general aviation access to the overall community. General Aviation Airports are the common name for the remaining airports not specifically defined by the FAA. (Definitions from FAA website.)
Table 1.1: BEAM Region Airports

R E G I O N A L
I N F R A S T R U C T U R E
R E P O R T
B L U E G R A S S
E C O N O M I C
A D V A N C E M E N T
M O V E M E N T
11
R E G I O N A L
I N F R A S T R U C T U R E
R E P O R T
B L U E G R A S S
E C O N O M I C
A D V A N C E M E N T
M O V E M E N T
10
Air Service Offerings – Commercial Service AirportsThe region is served by two commercial passenger airports – Blue Grass Airport (LEX) and Louisville International Airport (SDF) – which together offer over 120 daily departures to 28 nonstop destinations by seven major airline brands. Together, the airports serve eight of the nation’s top ten international gateways allowing for quick connections to major destinations in Europe, Canada, South America, Asia, and the Middle East. Figure 1.2 shows nonstop and direct passenger service offered by the region’s two commercial airports.
As of October 2013, five airlines provided service at LEX to 12 nonstop destinations and two direct destinations. LEX has 13 boarding gates and an annual passenger capacity of 1.4 million passengers. In 2012, the airport handled over 1.1 million passengers. As of October 2013, five airlines provided service at SDF to 24 nonstop destinations and 24 direct destinations. SDF has 23 boarding gates and an annual passenger capacity of 4 million passengers. In 2012, the airport handled 3.4 million passengers.
The region’s service gaps include the lack of nonstop passenger service to the west coast (Los Angeles, Calif. and San Francisco, Calif.); Toronto, Canada; and Boston, Mass. However, each airport does offer numerous direct flights to major airport hubs (Atlanta and Chicago being the most significant), which subsequently provide connecting opportunities to major business destinations.
Significant freight and logistics operations at SDF moved over 2.4 million tons of cargo in 2012 – it is currently the third largest cargo airport in North America and seventh largest in the world (Airports Council International).
Both airports are capable of handling scheduled and/or charter passenger and cargo operations, and each offer full-service Fixed Base Operator facilities for both private aviation and corporate aircraft. Air Service Offerings – Regional Service AirportsContinued funding for maintenance and the improvement of navigational aids (NAVAIDS) continues to be a top priority for the General Aviation Airports across the country and in the BEAM region. Currently, the Clark Regional Airport in Sellersburg, Ind. is underway with a runway extension and upgrade of its NAVAIDS for Runway 18-36 to provide additional aviation support for the region.
Recommendations• State legislative challenges: In Kentucky, local aviation needs are meant to be funded through an aviation fuel tax. This tax generates approximately $10 million per year principally from commercial airline operations. These revenues are to be treated as a dedicated fund used strictly for funding the state’s aviation needs. However, the state’s legislature has at various times diverted these funds to the general fund and used them as a part of a broader budget balancing scheme. It is recommended that this practice should end – by not allowing these funds to be used for their intended purpose, a significant and ongoing disinvestment in our state’s aeronautical facilities and capabilities exists.
• Federal funding challenges: On the federal level, aviation budget allocation constraints, lack of fiscal control via a federal budget, and the approaching expiration of the Airport Improvement Program (AIP) all combine for a vulnerable capital funding landscape.
Figure 1.1: BEAM Region Airports Figure 1.2: Nonstop and Direct Passenger Service from the BEAM Region

R E G I O N A L
I N F R A S T R U C T U R E
R E P O R T
B L U E G R A S S
E C O N O M I C
A D V A N C E M E N T
M O V E M E N T
12
R E G I O N A L
I N F R A S T R U C T U R E
R E P O R T
B L U E G R A S S
E C O N O M I C
A D V A N C E M E N T
M O V E M E N T
13
Many general aviation airports, including those in the BEAM region, fund the vast majority of their capital programs through the federal AIP. Diminishing resources inhibits airport operators from funding and completing long-term capital planning, which has and will continue to erode the region’s aviation infrastructure. Furthermore, overregulation at the federal level has placed additional funding burdens on airport operators. These funding issues have and will continue to weaken the BEAM region’s ability to use its aeronautical facilities as an economic attractant for manufacturers.
• Local property tax issue in Kentucky: An issue specifically affecting aircraft based in the state of Kentucky involves the way aircraft are taxed as tangible property. Surrounding states such as Indiana, Ohio, and Tennessee have a lower (or no) property tax on general aviation aircraft, thus placing companies that base aircraft in Kentucky at a disadvantage. This is a larger issue in areas of Kentucky that border other states and compete for the same economic development projects. This issue will require a legislative change, and possibly a replacement tax initiative.
–––––––––––––––––––––––––––––––––––––––––––––––––––––––––––––––––––––––––––––––––Sources: Airports Council International, World Rankings 2012 Federal Aviation Administration, Southeast Facility Directory 2013 Official Airlines Guides, Flight Schedules, October 2013
CHAPTER 2: COMMUNICATIONS SECTOR
IntroductionHaving a robust communications infrastructure that can support modern telecommunication needs is essential to attract more manufacturing facilities to the BEAM region. This infrastructure must provide for large data transfers, reliability, and fail-over redundancy to assure continuity of operations. It also means having networks that can support the latest applications such as video conferencing and surveillance. Finally, a vibrant marketplace of choices in providers offering competitive pricing makes a region more attractive and resilient to advanced manufacturers.
High-speed and high-powered internet connectivity is quickly becoming a necessity as more and more companies are relying on “Big Data” analytics. Manufacturers, particularly advanced manufacturers, are starting to collect, store, aggregate, and rapidly analyze vast amounts of information – commonly referred to as “Big Data” – to make smarter operational decisions and gain a competitive advantage. Big Data has traditionally been used to evaluate what customers want, but there is a growing trend of using it to improve factory-floor operations. Manufacturers, such as General Electric, Raytheon, Harley-Davidson, and Sherwin-Williams – are relying on complex systems to gather and analyze factory-floor data (Wall Street Journal). The so-called “Industrial Internet,” which involves placing sensors in products as they are manufactured and remotely monitoring performance, is also a growing trend with companies like G.E. and Cisco leading the way (New York Times). The need for high-level communications infrastructure at manufacturing facilities will only increase as Big Data trends continue.
R E G I O N A L
I N F R A S T R U C T U R E
R E P O R T
B L U E G R A S S
E C O N O M I C
A D V A N C E M E N T
M O V E M E N T
14
R E G I O N A L
I N F R A S T R U C T U R E
R E P O R T
B L U E G R A S S
E C O N O M I C
A D V A N C E M E N T
M O V E M E N T
15
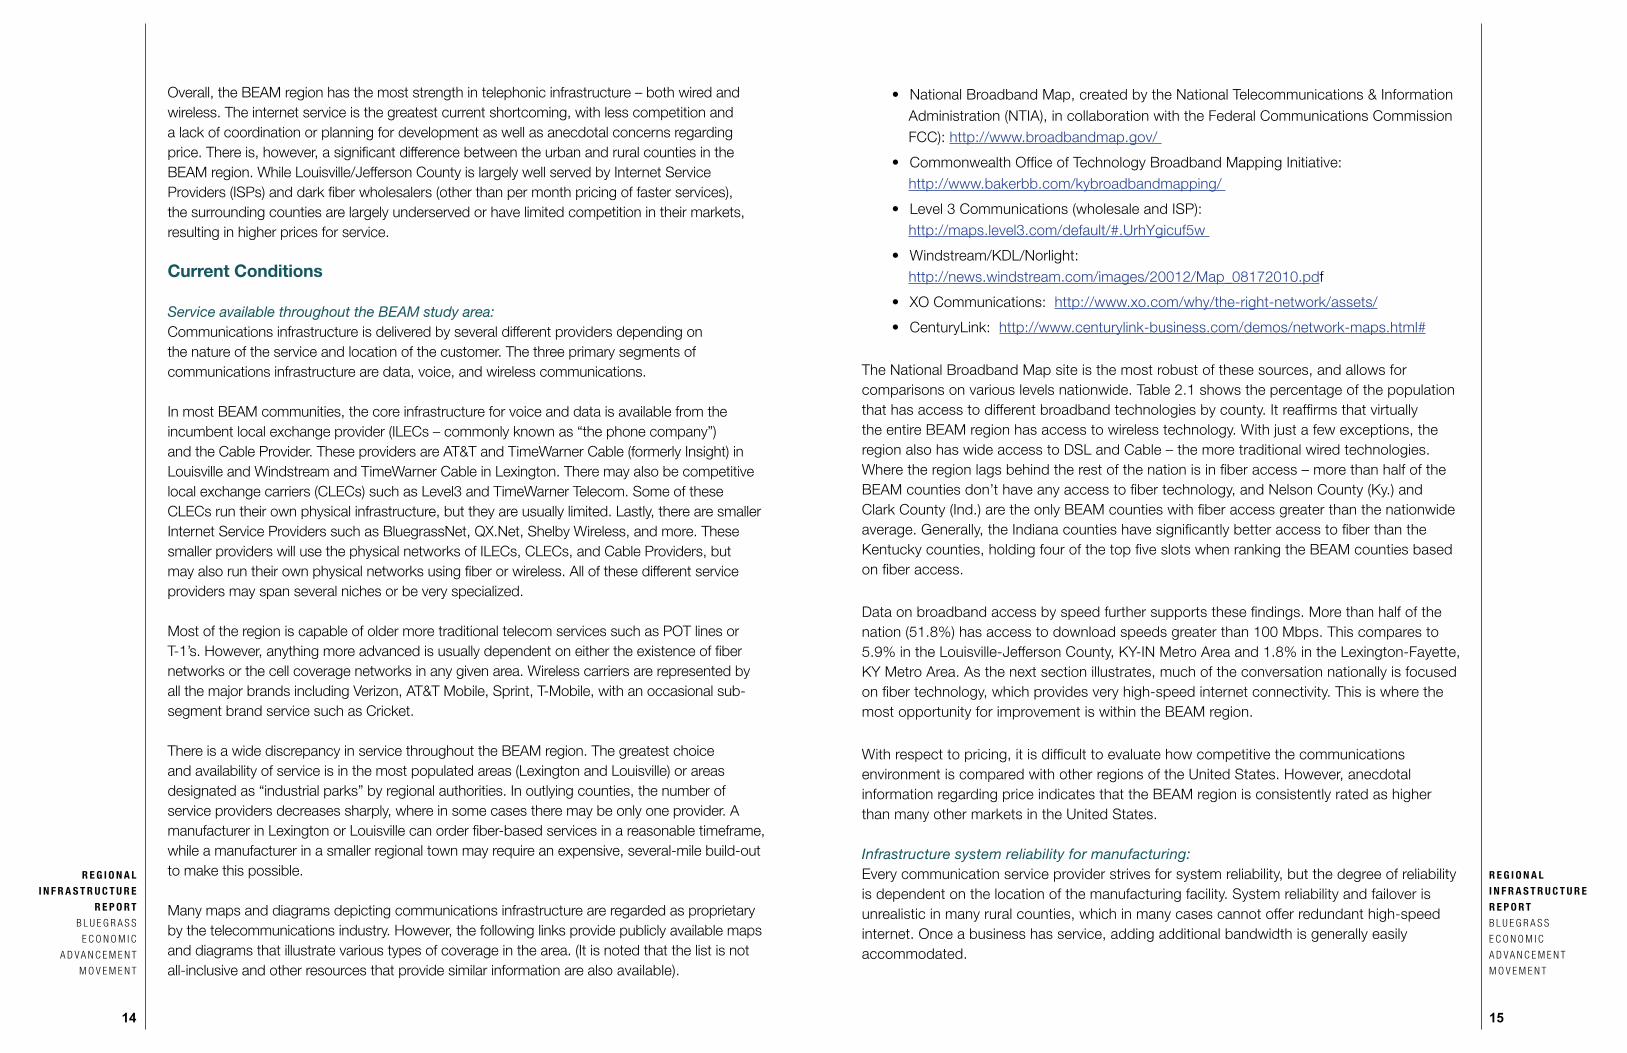
Overall, the BEAM region has the most strength in telephonic infrastructure – both wired and wireless. The internet service is the greatest current shortcoming, with less competition and a lack of coordination or planning for development as well as anecdotal concerns regarding price. There is, however, a significant difference between the urban and rural counties in the BEAM region. While Louisville/Jefferson County is largely well served by Internet Service Providers (ISPs) and dark fiber wholesalers (other than per month pricing of faster services), the surrounding counties are largely underserved or have limited competition in their markets, resulting in higher prices for service.
Current Conditions
Service available throughout the BEAM study area: Communications infrastructure is delivered by several different providers depending on the nature of the service and location of the customer. The three primary segments of communications infrastructure are data, voice, and wireless communications.
In most BEAM communities, the core infrastructure for voice and data is available from the incumbent local exchange provider (ILECs – commonly known as “the phone company”) and the Cable Provider. These providers are AT&T and TimeWarner Cable (formerly Insight) in Louisville and Windstream and TimeWarner Cable in Lexington. There may also be competitive local exchange carriers (CLECs) such as Level3 and TimeWarner Telecom. Some of these CLECs run their own physical infrastructure, but they are usually limited. Lastly, there are smaller Internet Service Providers such as BluegrassNet, QX.Net, Shelby Wireless, and more. These smaller providers will use the physical networks of ILECs, CLECs, and Cable Providers, but may also run their own physical networks using fiber or wireless. All of these different service providers may span several niches or be very specialized.
Most of the region is capable of older more traditional telecom services such as POT lines or T-1’s. However, anything more advanced is usually dependent on either the existence of fiber networks or the cell coverage networks in any given area. Wireless carriers are represented by all the major brands including Verizon, AT&T Mobile, Sprint, T-Mobile, with an occasional sub-segment brand service such as Cricket.
There is a wide discrepancy in service throughout the BEAM region. The greatest choice and availability of service is in the most populated areas (Lexington and Louisville) or areas designated as “industrial parks” by regional authorities. In outlying counties, the number of service providers decreases sharply, where in some cases there may be only one provider. A manufacturer in Lexington or Louisville can order fiber-based services in a reasonable timeframe, while a manufacturer in a smaller regional town may require an expensive, several-mile build-out to make this possible.
Many maps and diagrams depicting communications infrastructure are regarded as proprietary by the telecommunications industry. However, the following links provide publicly available maps and diagrams that illustrate various types of coverage in the area. (It is noted that the list is not all-inclusive and other resources that provide similar information are also available).
• National Broadband Map, created by the National Telecommunications & Information Administration (NTIA), in collaboration with the Federal Communications Commission FCC): http://www.broadbandmap.gov/
• Commonwealth Office of Technology Broadband Mapping Initiative: http://www.bakerbb.com/kybroadbandmapping/
• Level 3 Communications (wholesale and ISP): http://maps.level3.com/default/#.UrhYgicuf5w
• Windstream/KDL/Norlight: http://news.windstream.com/images/20012/Map_08172010.pdf
• XO Communications: http://www.xo.com/why/the-right-network/assets/
• CenturyLink: http://www.centurylink-business.com/demos/network-maps.html#
The National Broadband Map site is the most robust of these sources, and allows for comparisons on various levels nationwide. Table 2.1 shows the percentage of the population that has access to different broadband technologies by county. It reaffirms that virtually the entire BEAM region has access to wireless technology. With just a few exceptions, the region also has wide access to DSL and Cable – the more traditional wired technologies. Where the region lags behind the rest of the nation is in fiber access – more than half of the BEAM counties don’t have any access to fiber technology, and Nelson County (Ky.) and Clark County (Ind.) are the only BEAM counties with fiber access greater than the nationwide average. Generally, the Indiana counties have significantly better access to fiber than the Kentucky counties, holding four of the top five slots when ranking the BEAM counties based on fiber access.
Data on broadband access by speed further supports these findings. More than half of the nation (51.8%) has access to download speeds greater than 100 Mbps. This compares to 5.9% in the Louisville-Jefferson County, KY-IN Metro Area and 1.8% in the Lexington-Fayette, KY Metro Area. As the next section illustrates, much of the conversation nationally is focused on fiber technology, which provides very high-speed internet connectivity. This is where the most opportunity for improvement is within the BEAM region.
With respect to pricing, it is difficult to evaluate how competitive the communications environment is compared with other regions of the United States. However, anecdotal information regarding price indicates that the BEAM region is consistently rated as higher than many other markets in the United States.
Infrastructure system reliability for manufacturing:Every communication service provider strives for system reliability, but the degree of reliability is dependent on the location of the manufacturing facility. System reliability and failover is unrealistic in many rural counties, which in many cases cannot offer redundant high-speed internet. Once a business has service, adding additional bandwidth is generally easily accommodated.

R E G I O N A L
I N F R A S T R U C T U R E
R E P O R T
B L U E G R A S S
E C O N O M I C
A D V A N C E M E N T
M O V E M E N T
16
R E G I O N A L
R E G I O N A L
I N F R A S T R U C T U R E
R E P O R T
B L U E G R A S S
E C O N O M I C
A D V A N C E M E N T
M O V E M E N T
17
Planned GrowthAlmost all service providers are continually expanding their services through the construction of larger and better networks. The largest providers in the BEAM region are the local cable franchises and the ILECs (AT&T, Windstream, and rural telcos). CLECs (such as Level 3 and TWTelecom) are also running fiber in the more urban or industrial areas of the region. However, expansion of a network is generally in response to a specific demand at a specific location, and not a planned growth. Thus, service availability may be highly localized even within an urban environment.
Communications infrastructure, namely fiber technology, is receiving a lot of attention at the local, state, and federal government levels, as well as from the service providers themselves. There appears to be growing demand for lower cost, high-speed connectivity, but it is unclear where this will come from in the BEAM region. Market forces make it difficult to rollout high-speed internet access on a large scale; however, there are signs of progress in communities in the BEAM region and beyond.
Louisville Metro Government released a Request For Information in November 2013 and is modifying its franchise ordinance to become a more fiber-friendly community. Other counties in the BEAM region can also benefit from open Requests For Information and engagement with high bandwidth internet companies. Real progress is being made in this important area in both Louisville and Lexington.
Also, as this report was being written, Kentucky Governor Steve Beshear proposed in his budget a $100 million investment to expand high-speed broadband internet throughout the Commonwealth of Kentucky. Known as the Next Generation Kentucky Information Highway, the plan is to build approximately 3,000 miles of new fiber infrastructure. The first phase is focused on eastern Kentucky, which is the most underserved part of the state. This network will eventually expand to counties in the BEAM region.
Nationally, there are several approaches cities are taking in an attempt to provide high-speed internet connectivity. A small number of cities, starting with Kansas City, have been selected for Google Fiber deployment. As this report was being written, Google Fiber announced that it is targeting 34 more cities in nine metro areas, the closest to the BEAM region being Nashville. Lafayette, La. offers high-speed fiber connectivity as a public municipal service through the city-owned power company. In Chattanooga, Tenn., the publicly-owned electric utility became an ISP, building its own fiber network in order to support its new smart grid. Lastly, the federal government offers grants to rural areas to provide high-speed connectivity (indeed, a portion of Governor Beshear’s $100 million investment is coming from federal funds). This is a rapidly changing sector and these approaches are likely to evolve. An approach to affordable, high-speed internet connectivity in the BEAM region may differ from, or be a combination of, those noted above.
Recommendations• According to Connected Nation, underlying the potential impact of education and workforce development on expanding manufacturing, broadband connectivity is an “assumed and necessary prerequisite.” Connected Nation, a technology non-profit based in Bowling Green, gave three recommendations during a presentation at a Southern Governors’ Association meeting:
1. Support engagement at the local level where access can be addressed in a meaningful way2. Form broadband task forces and caucuses (Iowa did this recently) 3. Support targeted initiatives that focus on critically underserved regions
Additionally, technology planning needs to be factored into economic development site assessments. Their research shows “a significant, positive correlation between increased broadband availability and increased employment in the manufacturing sector in Southern states” (Lane Report).
• The BEAM region needs to closely monitor emerging technologies for applicability in the future, since it is clear that this is a rapidly evolving field with implications on the future of manufacturing. Currently, there are several models for creating low-cost, high- speed connectivity – Google Fiber, cities doing it themselves, locally-owned utilities that
Table 2.1: Access to Broadband Technologies (% of Population)

R E G I O N A L
I N F R A S T R U C T U R E
R E P O R T
B L U E G R A S S
E C O N O M I C
A D V A N C E M E N T
M O V E M E N T
18
R E G I O N A L
I N F R A S T R U C T U R E
R E P O R T
B L U E G R A S S
E C O N O M I C
A D V A N C E M E N T
M O V E M E N T
19
make it part of their smart grid, and rural areas that receive federal funding. Louisville and Lexington are developing approaches that are best suited for their cities and will continue to aggressively pursue the best options. Meanwhile, the best solution for rural areas might be different than the solutions that are identified for the metro areas.
• It will be essential to monitor the Next Generation Kentucky Information Highway project – Governor Beshear’s plan to spread high-speed internet access throughout the state – for its impact on the bandwidth needs of current and future manufacturing facilities. Also, support should be given to this effort of increasing broadband access throughout Kentucky.
–––––––––––––––––––––––––––––––––––––––––––––––––––––––––––––––––––––––––––––––––––––––––––––––––––“Connected Nation tells Southern Governors’ Assoc. broadband push would boost advanced manufacturing.” Lane Report, 2013: lanereport.com. Hagerty, James. “How Many Turns in a Screw? Big Data Knows.” Wall Street Journal, 2013: wsj.com.Hardy, Quentin. “G.E.’s ‘Industrial Internet’ Goes Big.” New York Times, 2013: bits.blogs.nytimes.com.
CHAPTER 3: ENERGY SECTOR
IntroductionThe BEAM region’s energy infrastructure, including the natural gas and electricity sectors, has sufficient capacity and growth plans to meet long-term economic development needs of the region.
Kentucky, specifically the BEAM region, has historically enjoyed relatively low energy costs when compared to the rest of the country. Based on the latest U.S. Energy Information Administration (EIA) data, only three states had lower retail electricity prices than Kentucky and only ten were lower than Indiana for all sectors. Low electricity prices in the BEAM area are largely due to the use of regional coal reserves in electric generation. In fact, more than 90% of electricity produced and consumed in Kentucky is sourced by coal generation. Coal is used to produce more than 80% of Indiana’s electricity needs. However, there are obstacles looming on the horizon that may change the BEAM region’s low electricity cost status. More than 90% of the coal generation capacity in Kentucky was built more than 30 years ago. Given the age of the electric generation fleet across the BEAM region, significant capital investment will be required to comply with current and future U.S Environmental Protection Agency (EPA) regulations. Potential greenhouse gas emission standards on existing coal fired generation could add operation complexities. Since EPA regulations are nationally based, any region with heavy reliance on fossil fuels will similarly be impacted.
The BEAM region relies on natural gas to serve peaking and intermediate electric generation requirements. Reliance on natural gas to produce electricity during non-peak periods is

R E G I O N A L
I N F R A S T R U C T U R E
R E P O R T
B L U E G R A S S
E C O N O M I C
A D V A N C E M E N T
M O V E M E N T
20
R E G I O N A L
I N F R A S T R U C T U R E
R E P O R T
B L U E G R A S S
E C O N O M I C
A D V A N C E M E N T
M O V E M E N T
21
expected to increase due to various factors such as construction costs, fuel prices, and EPA regulations. Increased use of natural gas, although naturally a cleaner fuel compared to coal in the production of electricity, may bring about other issues such as market forces driving up demand leading to higher fuel costs, transportation, and pipeline delivery capacity. This increased reliance on natural gas for electric generation also may place upward pressure on future energy prices. However, recent advancement of shale gas development and production should dampen overall movement in forward natural gas prices.
Energy efficiency is a key component to sustaining low electricity prices. Indiana has a statewide energy efficiency initiative, “Energizing Indiana”, which became available in February 2012 and is funded by participating utilities and available to nearly 90% of the state. Kentucky electric and natural gas utilities offer robust programs which, through effective marketing, gain customer participation and energy savings. The results of these efforts have been positive for the state and have offset the need for statewide adoption of energy efficiency standards. Energy efficiency efforts across the supply side and demand side continue to be pursued and expanded, keeping the area competitive in the evolving energy landscape.
Renewable energy sources have historically been uneconomic in the BEAM region, but some alternatives are looking more favorable in the next few years with tightening EPA regulations and the possibility of greenhouse gas emission compliance targets. Alternative energy technology costs have been decreasing to the point that economics can be favorable in some instances. As solar photovoltaic costs continue to decline, utilities will continue to evaluate them in the fleet of available generating resources.
According to a study prepared by the Kentucky Department for Energy Development and Independence in October 2012, energy prices are important in a business operation decision to expand operations at existing facilities or locate to a particular area. Relatively low energy prices will continue to be attractive to manufacturers looking to expand or locate in the BEAM region and will assist in retaining existing industry. Thus, low energy prices are key components to the success of the BEAM initiative.
Current Conditions
Natural Gas Transmission SystemMost of the natural gas produced in Kentucky is from the Big Sandy field in the eastern part of the state. However, the utilities in Kentucky primarily rely on natural gas from the gulf coast that is transported via pipeline to generation facilities or storage wells. Natural gas utilities in Kentucky have no prescribed territorial rights which translate into overlapping service territories as illustrated in Figure 3.1.
Due to shale gas drilling and increased production, there has been a migration to natural gas as an electric generation resource since natural gas prices have fallen considerably in the last four years. Historical natural gas prices are displayed in Figure 3.2. The historical volatility of natural gas prices has been tempered by the introduction of shale gas production and the completion of the Rockies Express pipeline.
The Rockies Express Pipeline is a nearly 1,700-mile natural gas pipeline system that spans from the Rocky Mountains in northwest Colorado to eastern Ohio. The pipeline system consists of three sections running through eight states. The pipeline runs north of the BEAM region through central Indiana. It is the largest natural gas pipeline built in the United States in more
15
10
5
02002 2004 2006 2008 2010 2012
Dol
lars
per
Tho
usan
d C
ubic
Fee
t
Source: U.S. Energy Information AdministrationU.S. Natural Gas Electric Power Price
U.S. Natural Gas Electric Power Price
Figure 3.1: Natural Gas Service Territories in the BEAM Region
Figure 3.2: Historic Natural Gas Prices

R E G I O N A L
I N F R A S T R U C T U R E
R E P O R T
B L U E G R A S S
E C O N O M I C
A D V A N C E M E N T
M O V E M E N T
22
R E G I O N A L
I N F R A S T R U C T U R E
R E P O R T
B L U E G R A S S
E C O N O M I C
A D V A N C E M E N T
M O V E M E N T
23
than 20 years, and one of the largest natural gas pipelines ever built in North America. A map of the Rockies Express Pipeline is provided in Figure 3.3.
Source: Tallgrass Energy
Given the increases in shale gas production and the increased ability to move natural gas between regions of the United States, a more predictable forward market price has been established. The EIA forward market price curve is displayed in Figure 3.4. Natural gas prices are expected to remain low relative to the future economy based on the latest EIA projections, and it is expected that natural gas will continue to be the primary fuel choice in future electric generation construction. Natural gas prices are projected to increase 4.9% on an average annual basis for 2014 through 2040. The natural gas transmission and distribution infrastructure in Kentucky is currently in good to excellent condition and has adequate capacity to serve current and future demand. The area benefits from major gas pipelines owned by Texas Gas Transmission and Columbia Pipeline Group currently serving the area. Increased capacity requirements for natural gas generation in the BEAM region should not encounter natural gas transportation and delivery issues. Engineering analyses are routinely performed on the integrity of the gas infrastructure. Threats to system integrity are identified and evaluated, risks are ranked, and actions are taken to ensure ongoing safe and reliable operation of the facilities. Since 1970, the Kentucky Public Service Commission (PSC) has enforced federal pipeline safety standards. All natural gas transmission and distribution infrastructure currently in operation are known to be compliant.
Electric Transmission SystemLoad forecasts across the BEAM region are relatively flat and the electric transmission infrastructure throughout the region has ample capacity to serve customers now and into the future. Additionally, the infrastructure required to deliver electricity to customers in the region is in good to excellent condition with ongoing strategic infrastructure investments to meet future import and export needs under the purview of regional transmission planning. Regional
transmission planning and operation guidelines were created by the Federal Energy Regulatory Commission (FERC) to add security to planning and operations by assuring adequate electric transmission capacity is available. Regional guidelines assure that transmission planning and operations are not confined to utility or state boundaries and coordinate with other regional transmission planners for seamless electric transmission system operation. Additionally, FERC requires transmission providers to report planning and operation details on a regular basis so they can fulfill their responsibilities of protecting the reliability of the interstate electric transmission system.
Electric GenerationElectricity is generated in the BEAM region primarily by five utilities: Duke Energy, East Kentucky Power Cooperative, Kentucky Power, Kentucky Utilities, and Louisville Gas & Electric. Kentucky electric utility service areas are illustrated in Figure 3.5.
Kentucky is the third largest coal producing state in the nation. As a result, coal is used to produce over 90% of Kentucky’s electricity needs making Kentucky one of the country’s most coal-dependent states. Other methods of producing electricity in Kentucky use natural gas and hydro as a fuel source.
The production of electricity with the addition of advanced emission control technologies has sustained low energy costs that support the economic health of the BEAM region. The consistency of the electric generation process helps maintain the economic vitality of the area. The EPA has regulations in place for sulfur dioxide, nitrous oxide, particulate matter, mercury, and acid mist. Emission standards are met with readily available control technologies. The BEAM region has seen significant infrastructure investment to comply with emission laws and regulations while maintaining its relatively low cost position. The EPA recently proposed
16
14
12
10
6
4
2
0
nom
$/t
hous
cu.
ft.
2010 2012 2014 2016 2018 2020 2022 2024 2026 2028 2030 2032 2034 2036 2038 2040
8
Natural Gas: Delivered Prices: Electric Power: Reference Case
Source: U.S. Energy Information Administration
Figure 3.4: Natural Gas Price Projections
Figure 3.3: Rockies Express Pipeline

greenhouse gas limits on new fossil fuel fired utility boilers, Integrated Gas Combined Cycle generating units, and natural gas combustion turbines. A greenhouse gas limit on existing electric generation is expected to be proposed by the EPA in 2014 and finalized in 2015. Since coal combustion produces more greenhouse gases per megawatt hour generated when compared to other large scale generation, such regulation would be most detrimental to states that utilize coal as a primary source to produce electricity.
Emergency PreparednessGas utilities in the BEAM region are part of several organizations with committees that focus on disaster mitigation and managing natural gas emergencies. Such organizations are the American Gas Association, Kentucky Gas Association, and Southern Gas Association. These organizations all have emergency management groups that provide mutual assistance efforts.BEAM region electric utilities are involved in peer group mutual assistance programs that provide access to valuable resources and hundreds of crews from nearly half of the continental United States when mobilizing for large-scale restoration efforts. All electric utilities in the BEAM region participate in emergency preparedness groups such as the Great Lakes Mutual Assistance Group, Midwest Mutual Assistance, and Southeast Electric Exchange. Regional transmission planners also coordinate restoration planning activities. There is additional coordination from utilities through participation in the Kentucky Emergency Management Private Sector Working Group initiative designed to act as a bridge between private and public sectors to mitigate impacts relating to critical incidents, natural disasters, and crisis response events.
Planned GrowthUtilities submit an Integrated Resource Plan (IRP) to provide forward looking assurance of meeting their least cost regulatory obligation to serve. The IRP is the primary method of communicating regional growth expectations to state utility regulatory authorities and how those expectations will be satisfied. The IRP provides an in-depth view of a utility’s operation and planning requirements to adequately meet customer demands including electricity generation, delivery of electricity, and energy efficiency.
Several generation supply options are evaluated during the IRP process including coal, natural gas, hydro, and renewables. Kentucky state law currently prohibits nuclear generator construction. The nuclear moratorium was enacted in 1984. The shale gas boom, coupled with EPA regulations, has shifted new base load generation plans from coal to favor high-efficiency natural gas generators. Renewable energy continues to be widely studied by regional utilities for inclusion as resource planning alternatives. Renewable technology continues to develop and overall costs are coming down in some instances. The combination of lower cost renewables with other technologies may assist in making costs more comparable with traditional generation supply resources. Some electric utilities are starting to invest in renewables on a small scale to validate economics and operations.
Recommendations• Continue to provide least cost supply options to customers including exploration and investment in a diverse generation supply including renewables where proven economic.
• Continue to prepare for the future through participation in research opportunities.
–––––––––––––––––––––––––––––––––––––––––––––––––––––––––––––––––––––––––––––––––
Sources:Area Development , “27th Annual Survey of Corporate Executives: Changing Site Selection Priorities”: areadevelopment.comEnergizing Indiana: energizingindiana.com Federal Energy Regulatory Commission: ferc.govKentucky Department for Energy Development and Independence, “Intelligent Energy Choices for Kentucky’s Future,” 2008: energy.ky.govKentucky Department for Energy Development and Independence, “The Vulnerability of Kentucky’s Manufacturing Economy to Increasing Electricity Prices,” 2012Kentucky Energy Management: kyem.ky.govKentucky Public Service Commission: psc.ky.gov Outage Central: outagecentral.comTallgrass Development: tallgrassenergylp.comU.S. Energy Information Administration, Annual Energy Outlook 2013U.S. Energy Information Administration, Historical Natural Gas Electric Power Price: eia.gov
R E G I O N A L
I N F R A S T R U C T U R E
R E P O R T
B L U E G R A S S
E C O N O M I C
A D V A N C E M E N T
M O V E M E N T
24
R E G I O N A L
I N F R A S T R U C T U R E
R E P O R T
B L U E G R A S S
E C O N O M I C
A D V A N C E M E N T
M O V E M E N T
25
Figure 3.5: Electric Distribution Service Areas

R E G I O N A L
I N F R A S T R U C T U R E
R E P O R T
B L U E G R A S S
E C O N O M I C
A D V A N C E M E N T
M O V E M E N T
26
R E G I O N A L
I N F R A S T R U C T U R E
R E P O R T
B L U E G R A S S
E C O N O M I C
A D V A N C E M E N T
M O V E M E N T
27
CHAPTER 4: FREIGHT RAIL SECTOR
IntroductionThe freight rail service system within the BEAM region is extensive and well established. However, in order to meet the growing freight needs of existing manufacturing facilities as well as attract new and expanding manufacturing facilities to the area, the rail systems must be well prepared for growing and shifting freight transportation requirements.
Increased demand for freight rail in the BEAM region will be compounded by the increasing demand of the growing automotive manufacturing industry along with their supply chain demands. Additionally, an increasing interest in the region by new industries looking to expand their manufacturing capacities will demand greater freight efficiency capacities to obtain more attractive costing.
Although the specific level at which demand for freight rail will increase is uncertain, it will be determined by several factors:
1. The highway system is nearing capacity limits while dealing with decreased funding to maintain and expand current infrastructure. As demand for freight movement increases, freight rail has the ability to reduce the burden on the region’s highway system.2. As manufacturing continues to return to the United States and the BEAM region, access to lower cost freight rail will increase the region’s competitiveness when competing for major economic development projects. Since freight rail infrastructure
is a system of privately-owned Class 1 and Regional Railroad Companies, maintaining low costs may require a combination of public and private funding for capacity- improving projects, which will allow the freight rail system to meet demands much quicker and at a lower cost per ton of freight moved.3. Currently, inland waterways are experiencing a resurgence as a mode of freight movement for companies importing or exporting raw materials or finished products. At this point, Class 1 Railroads are handling containerized goods to and from coastal ports. For a more efficient process, waterway-rail-truck intermodal systems will need to develop further. Additionally, throughout the United States, aviation-rail-truck intermodal systems are developing and may bear more consideration for the BEAM region. The development and expansion of these types of multimodal systems could assure the region takes full advantage of existing assets and raises its competitiveness in the global economy.4. Specific to the BEAM region, an area of consideration for possible intermodal interchange is between aviation and rail freight movement.
Current Conditions
Kentucky Statewide Rail PlanIn 2000, the Commonwealth of Kentucky legislature authorized funding to develop the 2002 Kentucky Statewide Rail Plan. The Plan, developed by the Kentucky Transportation Cabinet (KYTC), has two purposes. First, it presents the modal plan that (a) identifies system-wide strategies and policies, and (b) conforms to the goals established in the 2001 KYTC Strategic Plan and the 1999 version of the Kentucky Statewide Transportation Plan. Second, it identifies future rail issues in order to meet Federal Railroad Administration requirements for federal funding, as it becomes available. As of the publishing of this Report, the Kentucky Statewide Rail Plan is again being updated, and will provide additional insight into rail plans and needs throughout the BEAM region.
Rail Infrastructure in the BEAM RegionCurrently, the BEAM region is served by two Class 1 Railroads and four Regional Freight Railroads. See Figure 4.1 for a map of rail infrastructure in the BEAM region.
Class 1 RailroadsClass 1 freight railroads have the most expansive rail networks throughout the United States, concentrating largely on long-haul intercity freight movement. There are seven Class 1 railroad companies in the country, two of which operate in the BEAM region.
CSX Transportation (based in Jacksonville, Fla.)• Cincinnati to Knoxville Line: Passes through Bourbon, Clark, and Madison Counties.• Cincinnati to Nashville Line: Passes through Hardin, Bullitt, Jefferson, Oldham, and Henry Counties.• Operates Osborn Yard, a major rail yard in Louisville, which has an intermodal terminal and an automotive distribution center.

Norfolk Southern Railway (based in Norfork, Va.)• Chattanooga to Cincinnati Line: Passes through Jessamine, Fayette, and Scott Counties.• Danville to St. Louis Line: Passes through Shelby, Jefferson, Floyd (Ind.), and Harrison (Ind.) Counties.• Norfolk Southern serves the Toyota plant in Georgetown, and has a Major Classification Yard in Louisville and an auto yard in Shelbyville.
Regional RailroadsRegional railroads provide local and regional freight service for a variety of industrial and agricultural products, often sending to and receiving from Class 1 railroads for final delivery.
Louisville Indiana Railroad (based in Jeffersonville, Ind.)• Louisville to Indianapolis Line: Passes through Jefferson and Clark (Ind.) Counties. Interchanges with CSX, Norfolk Southern, Indiana Railroad, and Paducah & Louisville Railroad.
Paducah & Louisville Railroad (based in Paducah, Ky.)• Louisville to Paducah and Mayfield Line: Passes through Jefferson, Meade, and Hardin Counties. Interchanges with CSX, Norfolk Southern, and Louisville Indiana Railroad in Louisville. Interchanges with Canadian National Railway, BNSF Railway, and Union Pacific Railroads at its western terminal. Serves Jefferson Riverport in southwest Louisville. Connects with the Cumberland and Tennessee Rivers in Grand Rivers, Ky.
R. J. Corman Railroad Group (based in Nicholasville, Ky.)• Winchester to Louisville Line: Passes through Clark, Fayette, Scott, Woodford, Franklin, Shelby, and Jefferson Counties. Interchanges with CSX in Winchester and Louisville, and Norfolk Southern in Lexington. Limited Ohio River access in Louisville. Crosses the Kentucky River in Frankfort, but with no connection currently.• Lexington to Versailles Line: Passes through Fayette and Woodford Counties. Interchanges with R. J. Corman Winchester to Louisville Line and Norfolk Southern in Lexington.
TTI Railroad (based in Paris, Ky.)• Paris to Maysville Line: Passes through Bourbon County. Interchanges with CSX in Paris and terminates at the TTI Terminal in Maysville on the Ohio River. Historically, this line has delivered coal from Eastern Kentucky to the Ohio River. It also has some transloading services for truck deliveries to Eastern Kentucky counties that do not have rail service.
Planned GrowthIn order for the rail industry to meet the expected increase in capacity, extensive infrastructure improvements will be necessary. However, growth plans are currently limited due to lack of funding opportunities. There are two current options for funding rail infrastructure maintenance or expansion. One, the Crossing Improvement Program operated by the Kentucky Department of Transportation. This Program awards approximately $2 million per year for railway-highway at-grade crossing safety improvements. The other current source of funding for rail expansion is through economic development incentives designated for building spur lines to serve new or expanding industries.
The Federal Rail Administration (FRA) recently mandated new weight regulations for bridge structures. As a result, a number of Short Line and Regional Railroads throughout the United States have been forced to stop operations over the past two years due to the high cost of performing immediate bridge upgrades. Regulations on speed and weight are expected to increase, due to increasing rail traffic and freight volumes. As regulations tighten and rail traffic increases, various upgrades will be necessary to maintain efficient operations. Necessary improvements include rail replacement with heavier welded rail, railroad tie replacement, new passing tracks, and new double main lines. Considering that railroads are primarily privately-owned, these improvements can prove difficult to fund in the short-term. To address this, a few surrounding states have developed programs to assist with these maintenance and expansion issues, either by funding grant programs or utilizing tax abatement policies.
Recommendations• Multimodal focus: The effort to identify and implement freight system efficiencies within the region should be maintained. In particular, intermodal transfer sites should be identified and utilized to improve freight movement. Focus should be on waterway-rail interchanges, as well as aviation-rail interchanges.
• Preserve existing right-of-way: The preservation of existing right-of-ways is very important to
R E G I O N A L
I N F R A S T R U C T U R E
R E P O R T
B L U E G R A S S
E C O N O M I C
A D V A N C E M E N T
M O V E M E N T
28
R E G I O N A L
I N F R A S T R U C T U R E
R E P O R T
B L U E G R A S S
E C O N O M I C
A D V A N C E M E N T
M O V E M E N T
29
Figure 4.1: Rail Infrastructure in the BEAM Region

R E G I O N A L
I N F R A S T R U C T U R E
R E P O R T
B L U E G R A S S
E C O N O M I C
A D V A N C E M E N T
M O V E M E N T
30
R E G I O N A L
I N F R A S T R U C T U R E
R E P O R T
B L U E G R A S S
E C O N O M I C
A D V A N C E M E N T
M O V E M E N T
31
current and future freight rail and should therefore be a focus of the BEAM region. Additionally, preserving right-of-ways will benefit any future development of passenger rail (as noted in the following chapter on public transportation, passenger rail could be a long- term consideration for the BEAM region).
• Support the Statewide Rail Plan: As stated earlier, the Kentucky Department of Transportation’s Statewide Rail Plan, published in 2002, is currently being updated. The 2002 Plan established four core goals (preservation, economic development, customer relationships/transportation planning process, and safety and convenience) and objectives to protect the existing rail system and assist in assuring that the system develops and expands effectively. Leaders within the BEAM region should support the goals and objectives from the 2002 Plan, as shown below, as well as any additions included in the forthcoming updated version.
A. Preservation: Work to preserve the existing rail system to the extent the Kentucky Transportation Cabinet can influence the largely privately owned and operated Kentucky rail system.
• Maintain current knowledge of the Commonwealth’s rail system and its components including use, condition and viability updating the 2002 Kentucky Statewide Rail Plan on a periodic basis.• Work to preserve rail service, where it is in the public interest and rights-of-way where service preservation is not possible and/or justified.• Identify sources of public funding that can be used for rail projects.
B. Economic Development: Support economic development by providing Kentucky rail system connectivity to the national rail system and Kentucky’s transportation system.
• Work to develop adequate rail access to the Commonwealth’s intermodal facilities such as riverports and other freight transloading points. Similarly, work to develop adequate access for other modes to rail intermodal facilities.• Work with economic development groups throughout Kentucky to identify and promote rail-served industrial sites and assist with the location of rail-using industry.• Partner with neighboring states to develop initiatives that promote connectivity to the national rail system and the global market place.
C. Customer Relationships/Transportation Planning Process: Strengthen customer relationships with the rail industry through coordination and cooperation in the transportation planning process.
• Educate Metropolitan Planning Organizations (MPOs) and other planning organizations in rail issues, the role that rail plays in transportation in Kentucky, and the Cabinet’s position regarding the rail mode.• Work to involve the railroads in the public planning process, including the development of the 2002 Kentucky Statewide Rail Plan.• Support Operation Lifesaver and other rail safety programs.
D. Safety and Convenience: Enhance rail transportation safety and convenience to ensure mobility and access.
• Work with the railroads to identify grade crossings of particular concern for closure, enhanced warning devices or separation.
• Pursue a program of crossing evaluations on a corridor basis. A corridor can be a route through an urban area, a passenger train route, a route with heavy freight traffic, or other similar characteristics.• Support future programs and identify potential funding sources that address heightened rail security concerns.• Identify rail-related intermodal opportunities or opportunities for rail to provide an effective alternative transportation choice.• Identify and evaluate passenger rail transportation opportunities and identify opportunities to improve connection to other passenger modes of transportation.
–––––––––––––––––––––––––––––––––––––––––––––––––––––––––––––––––––––––––––––––––
Sources:
Kentucky Transportation Cabinet, 2002 Kentucky Statewide Rail Plan: transportation.ky.gov

R E G I O N A L
I N F R A S T R U C T U R E
R E P O R T
B L U E G R A S S
E C O N O M I C
A D V A N C E M E N T
M O V E M E N T
32
R E G I O N A L
I N F R A S T R U C T U R E
R E P O R T
B L U E G R A S S
E C O N O M I C
A D V A N C E M E N T
M O V E M E N T
33
CHAPTER 5: PUBLIC TRANSPORTATION SECTOR
IntroductionTo take full advantage of the manufacturing potential of the BEAM region, public transportation presents significant challenges as well as opportunities for helping achieve BEAM goals. Currently, public transportation is overwhelmingly provided only within local service areas in the 22-county region where single-occupancy cars and trucks are by far the primary mode of transportation. There are few connections between counties and no passenger rail service in the BEAM region.
The key challenge for mass transit is linking employers and employees, especially with large job sites located in sparsely populated areas far from the urban cores. Providing adequate public transportation to these sites is difficult, if not impossible, due to limited funding. Even if funding were available, the service is not practical because employees are sparsely scattered in all directions and at great distances from the worksites. More reliance on vanpools and carpools could help bridge the gaps throughout the BEAM region. Vanpools have grown in popularity in recent years for people traveling to work from Louisville to Ft. Knox, Louisville to Frankfort, and Lexington to Frankfort. In the foreseeable future, the use of vanpools could be augmented with commuter buses on key corridor locations.
Passenger rail is a longer term possibility, with a line linking Louisville, Ft. Knox and Elizabethtown along Dixie Highway being the most promising option. An existing freight rail line also links Louisville, Shelbyville and Lexington, shown in Figure 5.2. Co-existing freight and passenger rail could be explored further.
Figure 5.1: Population Density and Major Employment Centers in the BEAM Region
Figure 5.2: Louisville-Shelbyville-Lexington Rail Line

R E G I O N A L
I N F R A S T R U C T U R E
R E P O R T
B L U E G R A S S
E C O N O M I C
A D V A N C E M E N T
M O V E M E N T
34
R E G I O N A L
I N F R A S T R U C T U R E
R E P O R T
B L U E G R A S S
E C O N O M I C
A D V A N C E M E N T
M O V E M E N T
35
An advanced solution looking far into the future is a network focusing on major corridors with rail as the spine connected to a feeder system of smaller vehicles – buses, vans for carpooling or shuttling, taxis, and bicycles. Louisville is also mentioned in long-range plans by both the U.S. Department of Transportation and non-profit rail advocacy groups as part of a high-speed rail network linking large U.S. cities such as Chicago and Atlanta.
Current ConditionsPublic transportation in the BEAM region is predominately offered on a local basis, with a variety of levels of services and few connections between jurisdictions. Table 5.1 and Figure 5.3 detail the transit agencies throughout the region.
Both Louisville and Lexington are served by mass transit authorities. In Louisville, Transit Authority of River City (TARC) provides 15 million bus trips a year with a service area of Jefferson, Bullitt and Oldham counties in Kentucky and Clark and Floyd counties in Indiana. In Lexington, Lextran provides 5 million trips a year in Fayette County.
A number of smaller urban bus systems operate in the BEAM region including in Frankfort, LaGrange, Elizabethtown, and Winchester. Rural transportation is available in all Kentucky counties primarily through a variety of non-profit agencies. The rural transportation typically operates as door-to-door service for Medicare recipients and people with disabilities rather than as mass transit for connecting people and jobs.
Private operators provide bus service linking Lexington, Frankfort, and Louisville. Miller Trailways has three round trips daily between Louisville and Lexington. Miller also has one round trip a day linking Louisville and Corydon in Harrison County, Ind. Greyhound, on a route linking Louisville and Nashville, makes three northbound and three southbound stops a day in Elizabethtown. Megabus, another private carrier, provides service linking Louisville, Indianapolis, and Nashville with no stops in between. The schedules on these routes are not conducive to work-related commutes.
Travel by ModeThroughout Kentucky and in the BEAM region specifically, the majority of passenger and freight trips are by car or truck. Public transportation makes up a small share of trips. Public transportation usage in the region is significant only in Jefferson and Fayette Counties (based on number of commuters). The other public transportation operators in rural and suburban counties (such as Louisville Wheels in Bullitt County and “Opie” in Oldham County) operate on a much smaller scale. Table 5.2 provides the percentage of workers who commute via carpool (by car, truck, or van) and public transportation for each BEAM county. The lack of residential and commercial density in many BEAM counties makes it extremely difficult to provide effective county-wide or region-wide public transportation services. With a limited operating budget it is difficult to provide efficient and cost-effective access to jobs or even a couple trips per day between urban and rural areas.
Figure 5.3: Public Transit Agencies by CountyTable 5.1: Public Transit Agencies by County

R E G I O N A L
I N F R A S T R U C T U R E
R E P O R T
B L U E G R A S S
E C O N O M I C
A D V A N C E M E N T
M O V E M E N T
36
R E G I O N A L
I N F R A S T R U C T U R E
R E P O R T
B L U E G R A S S
E C O N O M I C
A D V A N C E M E N T
M O V E M E N T
37
The vanpool regional program is a successful transportation mode that provides a cost-effective and user-friendly option for commuters and appears to meet current demand. Throughout the BEAM region, vanpool programs provide approximately 80 trips serving 700 passengers per day. Regional vanpools carry an average of 8-9 passengers per trip. By a significant margin, the strongest vanpool service is established between Louisville and Fort Knox, under a program operated through a partnership between the Kentuckiana Regional Planning & Development Agency (KIPDA) and TARC. Other significant vanpool travel patterns have been established between Louisville and Frankfort, Elizabethtown and Downtown Louisville, Louisville and Georgetown, and Radcliff and Downtown Louisville. Table 5.3 shows vanpool statistics within the nine-county KIPDA region (Jefferson, Bullitt, Spencer, Shelby, Oldham, Henry, and Trimble Counties in Kentucky; Clark and Floyd Counties in Indiana). In addition to these, Lextran provides oversight for eight active vanpools for 98 participants. The program includes 64 passengers who travel from Lexington to Frankfort. Other vanpools in Lexington connect to Irvine and Berea.
TARC provides service to a number of major employment centers and universities and colleges in the region including UPS Worldport®, Jefferson Riverport, River Ridge Commerce Center and Amazon in Southern Indiana, Anchorage Business Center, University of Louisville, and
Indiana University Southeast. Effective January 27, 2014, service is also available to Ivy Tech in Sellersburg, Ind. Lextran service includes the University of Kentucky as well as major manufacturing and business locations such as Amazon, Webasto, Parker Seal, Trane, Link-Belt, Young Storage, Pepsi, and Coca-Cola. The Toyota plant in Scott County is a location that might be served if a connector between Lexington and that area were made available. Looking beyond the service they currently provide, successful vanpool programs can establish a basis for future commuter bus routes, express buses, and circulator feeder systems of smaller vehicles.
Planned GrowthTransportation infrastructure is critical to support regional growth, job creation, and economic development. Providing mobility of people and goods, and connecting the workforce with places of employment and education are key components for maintaining, growing, and sustaining an economically strong region. Strong public transit infrastructure can play a role in improving mobility, supporting the economy, enhancing quality of life, and increasing the overall competitiveness of the BEAM region.
Table 5.2: Share of Work Commuters by Mode of Transportation
Table 5.3: KIPDA Vanpool Summary

R E G I O N A L
I N F R A S T R U C T U R E
R E P O R T
B L U E G R A S S
E C O N O M I C
A D V A N C E M E N T
M O V E M E N T
38
R E G I O N A L
I N F R A S T R U C T U R E
R E P O R T
B L U E G R A S S
E C O N O M I C
A D V A N C E M E N T
M O V E M E N T
39
The current localized public transportation network, distances between residential locations and employment centers, and general land use and development patterns all present challenges. Low-density residential and commercial development patterns could be a major obstacle for providing fast, efficient, and sustainable public transportation. Developing major transit corridors that would connect higher density residential areas with places of employment and commercial centers is a potential long-term solution for influencing travel behavior, while recognizing existing land development patterns. Vanpool programs and carpooling are useful solutions for smaller groups of people. When these trips are widely dispersed, they can provide an adequate alternative to single-occupancy vehicle travel.
Planned regional growth could focus on improving public transportation services locally and regionally, and expanding vanpool and on-demand services in the rural counties. Defining major corridors as economic development generators, and creating a network of public transit around these, could help build a strong foundation for a sustainable economy. Commuter rail, or commuter and express bus routes, could define a spine of the system that would be supported by local bus service and feeder/circulator routes, providing connections from remote residential areas to the major system but on a more limited basis. As an example, the Dixie Highway corridor from central Louisville to Ft. Knox has potential for a commuter rail line, opening opportunities for employees and their families to have choices of living and mobility solutions.
TARC’s short-and long-term goals are to improve the level of service along major corridors in its system, shorten travel time, and extend hours of service in the early morning and late evening hours. That would allow passengers to have timed connections and transfers between the routes accessing jobs and places of education. In response to requests from larger employers, TARC makes every effort to extend the routes to major destinations for employment. Frequently due to the long distance between origin and destination of the trips and low residential density in virtually all areas except urban cores, ridership on the routes that travel to employment centers is not significant. Planned growth should focus on strengthening these connections through express or commuter service connected to park-and-ride locations or supported by local circulators or feeder routes.
Recommendations• More strategic development patterns: The BEAM region’s current pattern of land use and low-density development is the major challenge for developing a more efficient public transportation system. Higher density growth patterns should be incentivized and economic development directed towards designated nodes and major corridors. Larger employment centers concentrated at nodes or along major corridors could be efficiently served by mass transit or other alternative modes of transportation.
• Maintenance of existing infrastructure: Existing road and rail infrastructure should be maintained and preserved to serve as a foundation for building a sustainable, modern transportation system for the region. For more information on rail infrastructure, refer to the Freight Rail Sector chapter.
• Multimodal focus: Additional funding and prioritization of existing resources are
necessary to develop a multimodal transportation system for moving people and goods – a system that can support regional growth for years to come.
• State funding needs: A dedicated Kentucky state funding source is needed for public transportation. As noted in a 2011 report prepared by the Kentucky Transportation Center and Kentuckians for Better Transportation, Kentucky lags far behind nationally and as of FY 2009 was last among its seven neighboring states in per capita investment and total dollars for public transportation. In 2009, Kentucky allocated $1.6 million in funding toward public transportation, whereas the next lowest state (West Virginia) allocated $3 million, and the highest bordering state (Illinois) allocated $568.6 million. Companies today, especially those with a global perspective, expect to have access to robust public transit. Providing sufficient funding to improve this infrastructure will be important in order to attract new companies to the BEAM region.
• Federal legislative needs: At the federal level, the BEAM region should support adoption of a long-term transportation reauthorization bill by Congress, and the timely approval of any future reauthorization.
–––––––––––––––––––––––––––––––––––––––––––––––––––––––––––––––––––––––––––––––––
Sources:AASHTO, Census Transportation Planning Products: transportation.orgKentucky Transportation Cabinet, Transportation Providers: transportation.ky.govKIPDA Vanpool DataLextran Vanpool DataKentucky Transportation Center & Kentuckians for Better Transportation, “States’ Support of Non-Highway Modes of Transportation: Investigation and Synthesis”: www.ktc.uky.eduU.S. Census, 2012 Summary File 1 (Tract Level): census.govU.S. Census, 2011 American Community Survey (5-Year Estimates): census.gov
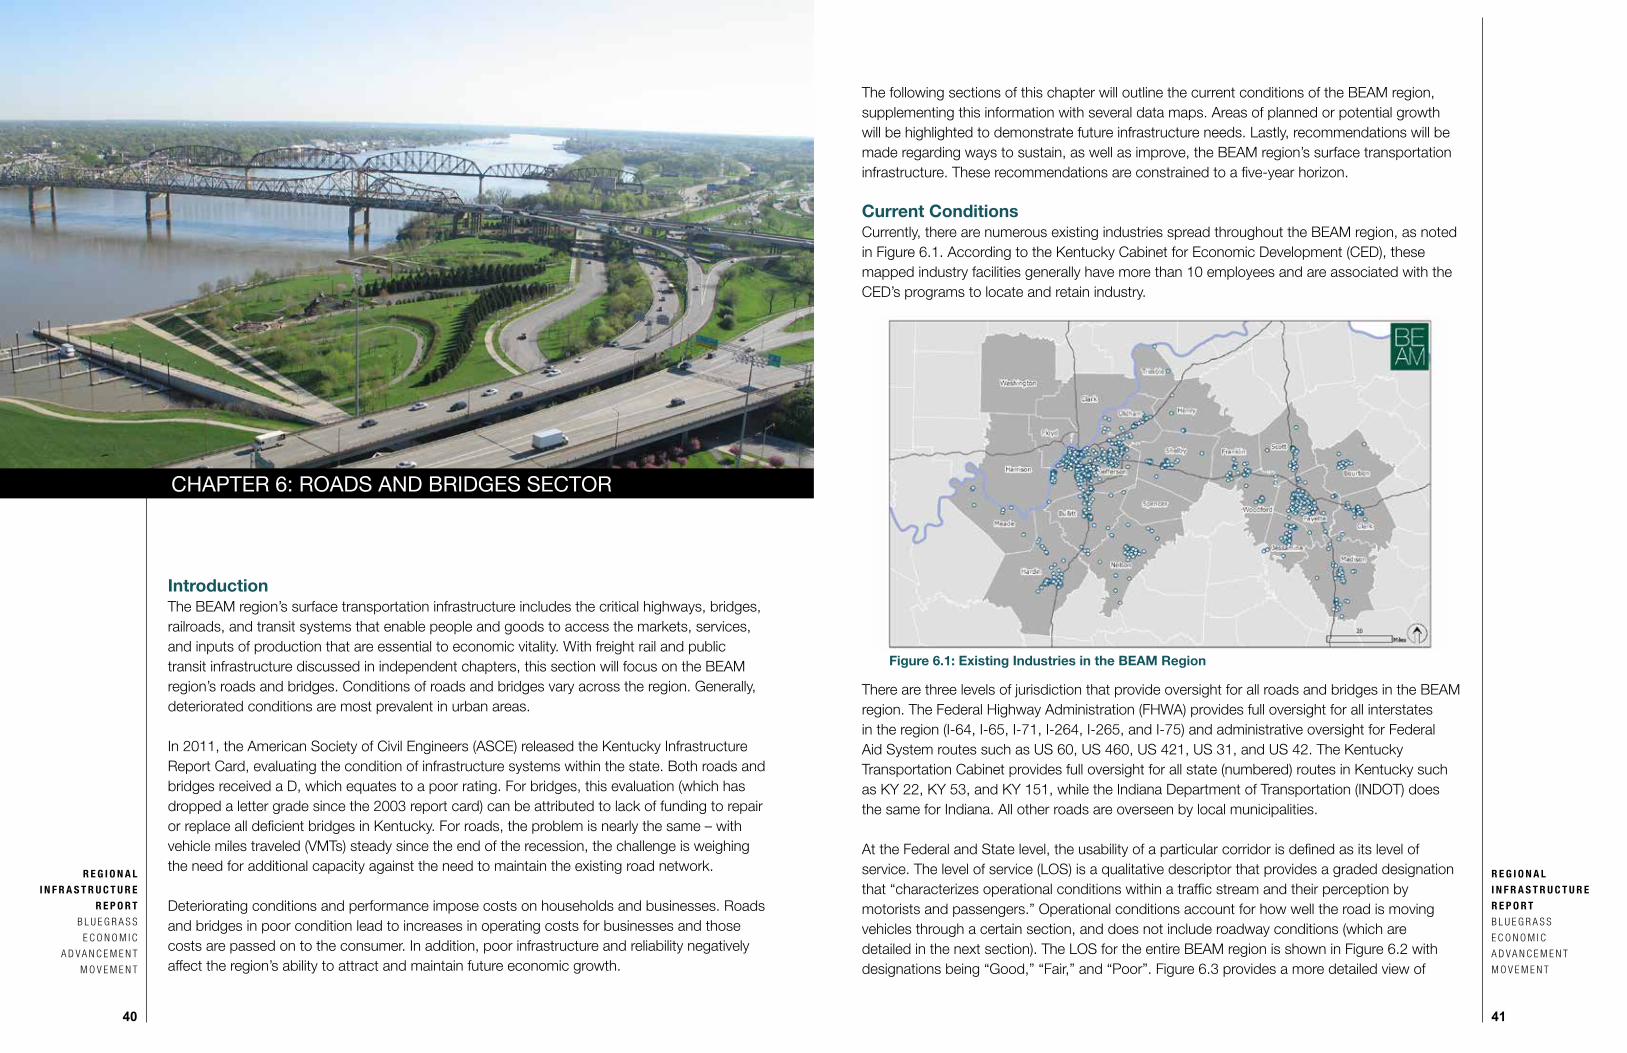
R E G I O N A L
I N F R A S T R U C T U R E
R E P O R T
B L U E G R A S S
E C O N O M I C
A D V A N C E M E N T
M O V E M E N T
40
R E G I O N A L
I N F R A S T R U C T U R E
R E P O R T
B L U E G R A S S
E C O N O M I C
A D V A N C E M E N T
M O V E M E N T
41
CHAPTER 6: ROADS AND BRIDGES SECTOR
IntroductionThe BEAM region’s surface transportation infrastructure includes the critical highways, bridges, railroads, and transit systems that enable people and goods to access the markets, services, and inputs of production that are essential to economic vitality. With freight rail and public transit infrastructure discussed in independent chapters, this section will focus on the BEAM region’s roads and bridges. Conditions of roads and bridges vary across the region. Generally, deteriorated conditions are most prevalent in urban areas.
In 2011, the American Society of Civil Engineers (ASCE) released the Kentucky Infrastructure Report Card, evaluating the condition of infrastructure systems within the state. Both roads and bridges received a D, which equates to a poor rating. For bridges, this evaluation (which has dropped a letter grade since the 2003 report card) can be attributed to lack of funding to repair or replace all deficient bridges in Kentucky. For roads, the problem is nearly the same – with vehicle miles traveled (VMTs) steady since the end of the recession, the challenge is weighing the need for additional capacity against the need to maintain the existing road network.
Deteriorating conditions and performance impose costs on households and businesses. Roads and bridges in poor condition lead to increases in operating costs for businesses and those costs are passed on to the consumer. In addition, poor infrastructure and reliability negatively affect the region’s ability to attract and maintain future economic growth.
The following sections of this chapter will outline the current conditions of the BEAM region, supplementing this information with several data maps. Areas of planned or potential growth will be highlighted to demonstrate future infrastructure needs. Lastly, recommendations will be made regarding ways to sustain, as well as improve, the BEAM region’s surface transportation infrastructure. These recommendations are constrained to a five-year horizon.
Current ConditionsCurrently, there are numerous existing industries spread throughout the BEAM region, as noted in Figure 6.1. According to the Kentucky Cabinet for Economic Development (CED), these mapped industry facilities generally have more than 10 employees and are associated with the CED’s programs to locate and retain industry.
Figure 6.1: Existing Industries in the BEAM Region
There are three levels of jurisdiction that provide oversight for all roads and bridges in the BEAM region. The Federal Highway Administration (FHWA) provides full oversight for all interstates in the region (I-64, I-65, I-71, I-264, I-265, and I-75) and administrative oversight for Federal Aid System routes such as US 60, US 460, US 421, US 31, and US 42. The Kentucky Transportation Cabinet provides full oversight for all state (numbered) routes in Kentucky such as KY 22, KY 53, and KY 151, while the Indiana Department of Transportation (INDOT) does the same for Indiana. All other roads are overseen by local municipalities.
At the Federal and State level, the usability of a particular corridor is defined as its level of service. The level of service (LOS) is a qualitative descriptor that provides a graded designation that “characterizes operational conditions within a traffic stream and their perception by motorists and passengers.” Operational conditions account for how well the road is moving vehicles through a certain section, and does not include roadway conditions (which are detailed in the next section). The LOS for the entire BEAM region is shown in Figure 6.2 with designations being “Good,” “Fair,” and “Poor”. Figure 6.3 provides a more detailed view of

R E G I O N A L
I N F R A S T R U C T U R E
R E P O R T
B L U E G R A S S
E C O N O M I C
A D V A N C E M E N T
M O V E M E N T
42
R E G I O N A L
I N F R A S T R U C T U R E
R E P O R T
B L U E G R A S S
E C O N O M I C
A D V A N C E M E N T
M O V E M E N T
43
LOS designations for Louisville and Lexington. Both maps validate what is typically assumed – interstate roadways within the urban boundaries of Louisville and Lexington experience sustained levels of traffic congestion. Areas that show a “Poor” LOS have a negative effect on the ability to attract and maintain viable commerce. Travel delays also affect the traveling public with additional fuel costs and regional exposure to increased carbon emissions.
Roadway ConditionsPoor pavement condition affects the safety and comfort of the motoring public, and increases vehicle operating and maintenance costs. Postponement of improving poor pavements accelerates deterioration and may result in more expensive improvements and repairs in the future.
A programmatic analysis determined the overall condition of pavement on both state highways and local roads in the Lexington and Louisville metropolitan areas. The analysis concluded that there are 1,067 miles of locally-maintained Lexington-Fayette Urban County Government (LFUCG) roads and 2,178 miles of Kentucky Transportation Cabinet (KYTC District 7) maintained roads in the Lexington region. Similarly, the analysis concluded that there are 2,118 miles of locally-maintained (Louisville Metro) and 1,772 miles of KYTC-maintained (D5) roads in the Louisville region, not including Indiana Counties. Of the 7,135 regional miles of roadways, 338 miles (5%) are classified as interstates or parkways and 6,797 miles (95%) are classified as arterials, collectors, or local streets. (Non-state maintained county roads outside of Jefferson and Fayette Counties were not included in this analysis.)
Each agency maintains a rating system which equates a numerical value of pavement condition to each segment of road under its jurisdiction. Based on the values, the pavement condition can be designated as “good,” “fair,” or “poor”. Table 6.1 shows the percentage of roadway miles deemed poor by each agency.
Statewide, the 2011 Kentucky Infrastructure Report Card concluded that 34% of Kentucky roads are in poor or mediocre condition. Similarly, the 2010 Indiana Infrastructure Report Card indicated that only 17% of the Indiana’s roads are in poor or mediocre condition.
Bridge ConditionsBased on the most recent data available from the FHWA National Bridge Inventory (NBI), public roadway in the BEAM region contains 3,148 highway bridges that total 2,231,293 square yards of combined bridge deck area. Utilizing the NBI rating system and methodology taken from the 2011 Kentucky Infrastructure Report Card, it was determined that 28% of the region’s bridges by count, and 27% by bridge deck area are either structurally deficient or functionally obsolete. This compares with a combined national average deficiency/obsolescence rate of 25%. It is noted that deficiency/obsolescence for the purpose of this analysis does not imply that a particular bridge is unsafe; rather that it is in need of repair or upgrade. Bridges determined to be unsafe are taken out of service. Table 6.2 summarizes the data from which the foregoing determination was derived.
Source: KIPDA Vanpool Data, Nov. 2013
Figure 6.2: Level of Service for Roadways in the BEAM Region
Figure 6.3: Level of Service for Roadways in Louisville and Lexington
Table 6.1: “Poor” Roadways in the BEAM Region
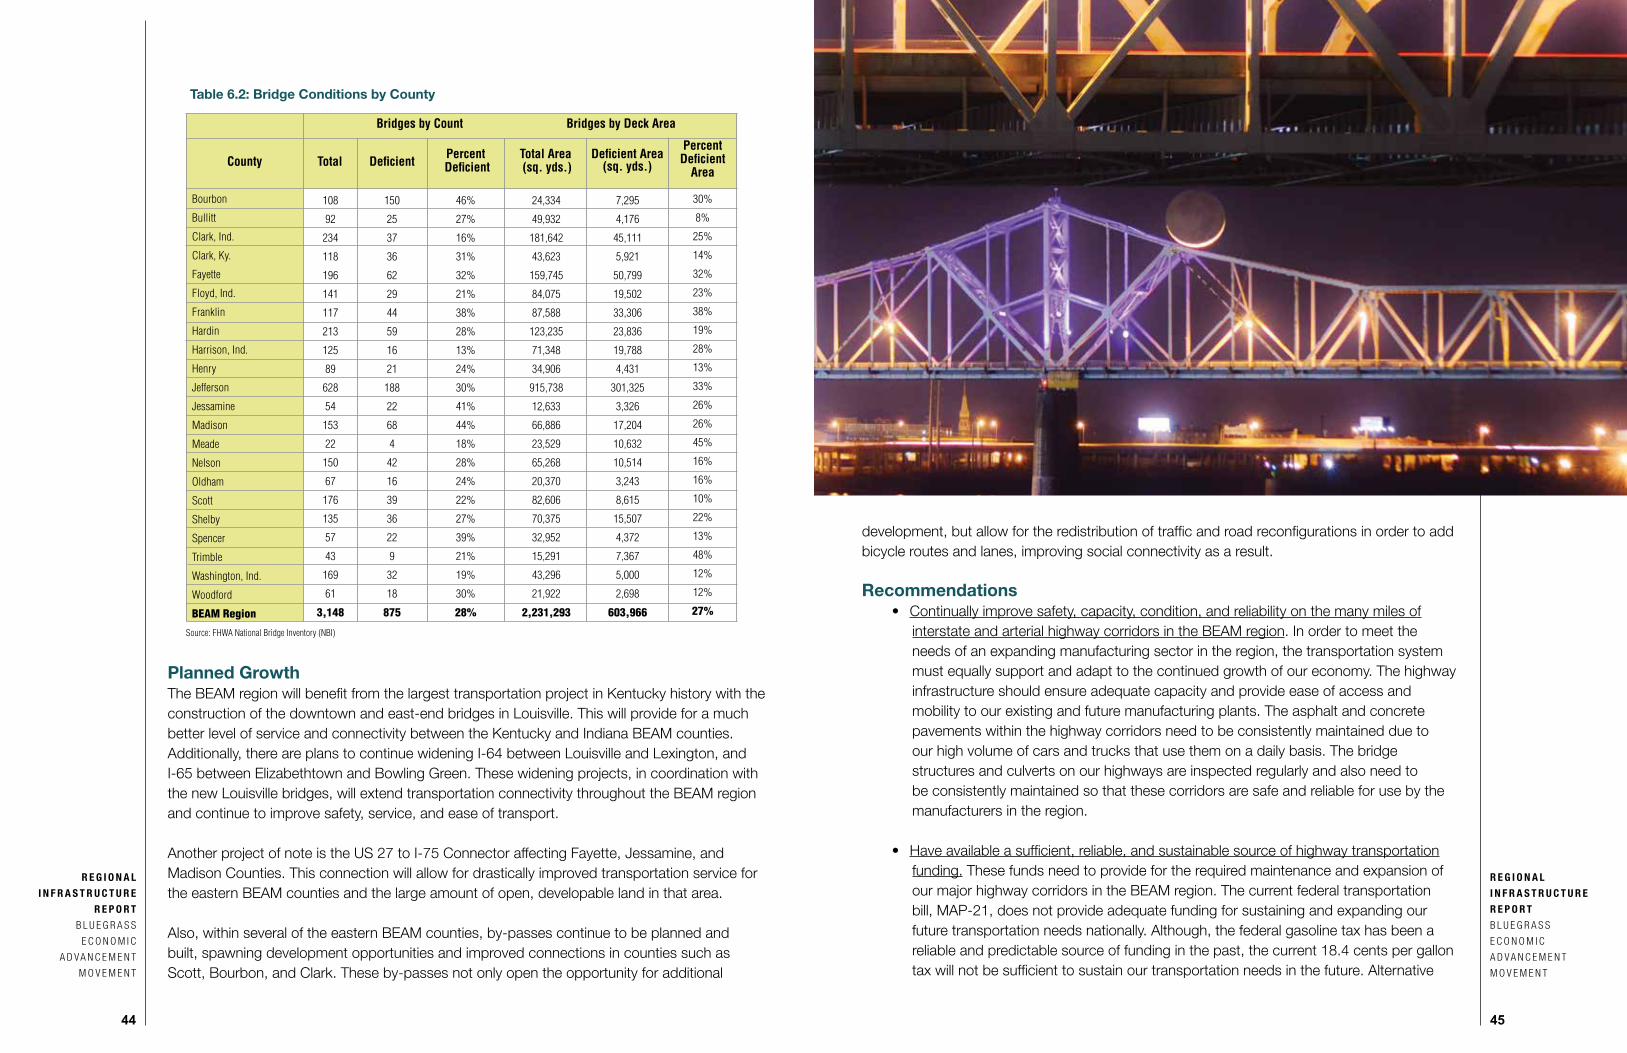
R E G I O N A L
I N F R A S T R U C T U R E
R E P O R T
B L U E G R A S S
E C O N O M I C
A D V A N C E M E N T
M O V E M E N T
44
R E G I O N A L
I N F R A S T R U C T U R E
R E P O R T
B L U E G R A S S
E C O N O M I C
A D V A N C E M E N T
M O V E M E N T
45
Planned GrowthThe BEAM region will benefit from the largest transportation project in Kentucky history with the construction of the downtown and east-end bridges in Louisville. This will provide for a much better level of service and connectivity between the Kentucky and Indiana BEAM counties. Additionally, there are plans to continue widening I-64 between Louisville and Lexington, and I-65 between Elizabethtown and Bowling Green. These widening projects, in coordination with the new Louisville bridges, will extend transportation connectivity throughout the BEAM region and continue to improve safety, service, and ease of transport.
Another project of note is the US 27 to I-75 Connector affecting Fayette, Jessamine, and Madison Counties. This connection will allow for drastically improved transportation service for the eastern BEAM counties and the large amount of open, developable land in that area.
Also, within several of the eastern BEAM counties, by-passes continue to be planned and built, spawning development opportunities and improved connections in counties such as Scott, Bourbon, and Clark. These by-passes not only open the opportunity for additional
development, but allow for the redistribution of traffic and road reconfigurations in order to add bicycle routes and lanes, improving social connectivity as a result.
Recommendations• Continually improve safety, capacity, condition, and reliability on the many miles of interstate and arterial highway corridors in the BEAM region. In order to meet the needs of an expanding manufacturing sector in the region, the transportation system must equally support and adapt to the continued growth of our economy. The highway infrastructure should ensure adequate capacity and provide ease of access and mobility to our existing and future manufacturing plants. The asphalt and concrete pavements within the highway corridors need to be consistently maintained due to our high volume of cars and trucks that use them on a daily basis. The bridge structures and culverts on our highways are inspected regularly and also need to be consistently maintained so that these corridors are safe and reliable for use by the manufacturers in the region.
• Have available a sufficient, reliable, and sustainable source of highway transportation funding. These funds need to provide for the required maintenance and expansion of our major highway corridors in the BEAM region. The current federal transportation bill, MAP-21, does not provide adequate funding for sustaining and expanding our future transportation needs nationally. Although, the federal gasoline tax has been a reliable and predictable source of funding in the past, the current 18.4 cents per gallon tax will not be sufficient to sustain our transportation needs in the future. Alternative
Table 6.2: Bridge Conditions by County

R E G I O N A L
I N F R A S T R U C T U R E
R E P O R T
B L U E G R A S S
E C O N O M I C
A D V A N C E M E N T
M O V E M E N T
46
R E G I O N A L
I N F R A S T R U C T U R E
R E P O R T
B L U E G R A S S
E C O N O M I C
A D V A N C E M E N T
M O V E M E N T
47
fueled vehicles will no longer pay this gasoline tax and the increasing fuel efficiency of new cars and trucks results in a declining funding stream, all while the needs continue to grow. Alternative financing options such as private/public partnerships, tax incentive financing (TIF), and tolls should be considered as options to fund infrastructure needs. Other options that need to be explored to determine viability are local option sales taxes and user fees that motorists would pay based on vehicle miles traveled.
• Support multi-modal transportation options in the BEAM region. These modes of transportation include the use of rail, water, and air. Sustaining and expanding these modal options may be a practical solution that is financially feasible due to their current existence in the BEAM region. There are many miles of existing railroad lines in place and they currently handle a tremendous volume of freight movement. Utilizing and optimizing our major sources of water transportation and ports could provide a huge benefit for the transportation of heavy cargo and other freight delivery considerations. International and other major airports also exist that can be utilized for the transportation of goods and services to sustain the manufacturing industry.
–––––––––––––––––––––––––––––––––––––––––––––––––––––––––––––––––––––––––––––––––
Sources:AASHTO: transportation.orgAmerican Society of Civil Engineers, 2013 Report Card for America’s Infrastructure: www.infrastructurereportcard.org Economic Development Coalition of Southwest Indiana: southwestindiana.org Federal Highway Administration, National Bridge Inventory: www.fhwa.dot.gov Kentucky Cabinet for Economic Development, Kentucky’s Logistics Quick Facts: thinkkentucky.comKentucky Transportation Cabinet, Condition of Pavements: transportation.ky.gov/maintenance Kentucky Transportation Cabinet, Planning Highway Information (HIS Database): transportation.ky.gov/planningTransportation Research Board, “Highway Capacity Manual 2010.”
CHAPTER 7: SOLID WASTE SECTOR
IntroductionThe BEAM region’s solid waste infrastructure, including municipal solid waste landfills receiving household waste, non-hazardous sludge, industrial solid waste, and construction and demolition debris, has sufficient capacity and infrastructure planning to meet long-term economic development needs. Recycling and composting are confined to drop-off centers or privately contracted services, except for Bullitt, Fayette, Franklin, and Jefferson Counties which have limited door-to-door service (residential only).
Current ConditionsThere are 15 landfills operating in Kentucky that service the 18 Kentucky counties in the BEAM region. The average cost for waste disposal at these landfills is $33.91 per ton. There are 3 landfills operating in Indiana that service the 4 Indiana counties in the BEAM Region. The average cost for waste disposal at these landfills is $25.37 per ton. Table 7.1 provides details on each BEAM county.
Legend:GA = General Aviation; NP = Non-Precision Instrument Landing System; P = Precision Instrument Landing System; PAPI = Precision Approach Path Indicator; VASI = Visual Approach Slope Indicator
Table 7.1: Garbage, Recycling, and Composting Facilities in the BEAM Region

R E G I O N A L
I N F R A S T R U C T U R E
R E P O R T
B L U E G R A S S
E C O N O M I C
A D V A N C E M E N T
M O V E M E N T
48
R E G I O N A L
I N F R A S T R U C T U R E
R E P O R T
B L U E G R A S S
E C O N O M I C
A D V A N C E M E N T
M O V E M E N T
49
Table 7.1: Garbage, Recycling, and Composting Facilities in the BEAM Region (continued) Table 7.1: Garbage, Recycling, and Composting Facilities in the BEAM Region (continued)

R E G I O N A L
I N F R A S T R U C T U R E
R E P O R T
B L U E G R A S S
E C O N O M I C
A D V A N C E M E N T
M O V E M E N T
50
R E G I O N A L
I N F R A S T R U C T U R E
R E P O R T
B L U E G R A S S
E C O N O M I C
A D V A N C E M E N T
M O V E M E N T
51
Hazardous WasteThere are currently no hazardous waste disposal facilities in the BEAM region or anywhere in Kentucky. The most recent facility operating in Kentucky was the LWD incinerator facility in Calvert City, which ceased operations in 2003. The nearest hazardous waste landfills are located in Emelle, Alabama, and Fort Wayne, Indiana. The nearest hazardous waste incinerators are located in East St. Louis, Illinois, and El Dorado, Arkansas.
The absence of hazardous waste disposal facilities in the BEAM region and the distance to either a hazardous waste landfill or a hazardous waste incinerator has not resulted in significant problems for the manufacturing sector. There are sufficient licensed hazardous waste transporters working in all of the BEAM region counties to serve current needs as well as long-term development of new manufacturing in the region. It is anticipated that current and future manufacturing needs for the handling of hazardous waste can be adequately served through existing licensed hazardous waste transporters.
Planned GrowthThere are currently no pending applications for new solid waste disposal facilities in the BEAM Region. Additionally, due to the significant public opposition in Kentucky to the location of hazardous waste disposal facilities, it is not anticipated that such a hazardous waste disposal facility will be located within the BEAM region or anywhere else in Kentucky in the foreseeable future.
Recommendations• Solid waste: There are adequate solid waste disposal facilities serving the BEAM region with many decades of landfill years remaining. Accordingly, there does not appear to be a need for additional landfill capacity for the foreseeable future in the region.
• Recycling: Because recovered material prices will continue to remain at lower levels until the worldwide economy shows more of a robust, sustaining recovery from the 2009 recession, it is unlikely that additional recycling facilities will be located in the BEAM region.
• Hazardous waste: While there are no facilities for the disposal of hazardous waste in the BEAM region, there are a sufficient number of licensed hazardous waste transporters serving the BEAM region. These transporters have the capacity to deliver hazardous waste currently being generated (as well as that generated by potential new manufacturing) to licensed disposal facilities outside the region for a reasonable cost. Accordingly, and in view of significant public opposition to the siting of such facilities in Kentucky, it is not recommended that additional hazardous waste disposal facilities be sited within the Commonwealth of Kentucky.
–––––––––––––––––––––––––––––––––––––––––––––––––––––––––––––––––––––––––––––––––Sources:Kentucky Division of Waste Management, Statewide Solid Waste Management Report, 2011 Kentucky Division of Waste Management, Annual Report, Fiscal Year 2013Marie Burnett, District Manager, Waste Management of Kentucky, LLCTim Hubbard, Assistant Director, Kentucky Division of Waste ManagementCara Kitchen, Solid Waste Permit Manager, Indiana Department of Environmental ManagementBryan Slade, EcoTech Waste LogisticsJanet Smith, Administrative Assistant, Assistant Commissioner’s Office, Indiana Department of Environmental Management
Table 7.1: Garbage, Recycling, and Composting Facilities in the BEAM Region (continued)
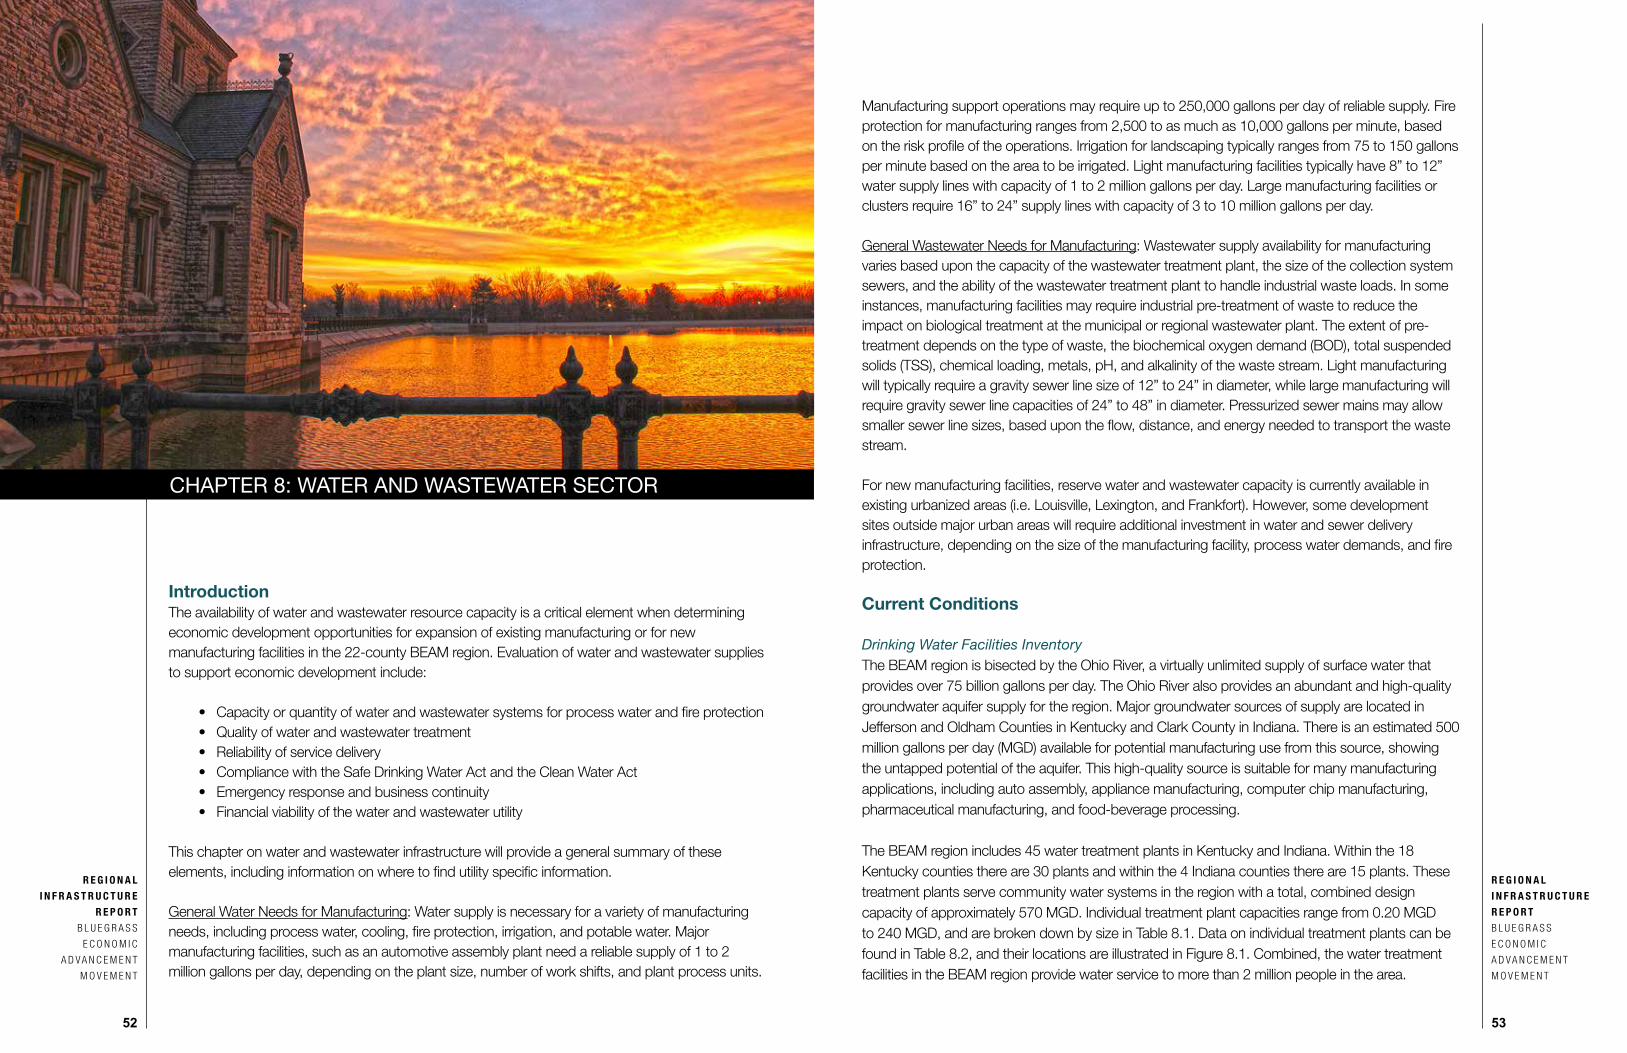
R E G I O N A L
I N F R A S T R U C T U R E
R E P O R T
B L U E G R A S S
E C O N O M I C
A D V A N C E M E N T
M O V E M E N T
52
R E G I O N A L
I N F R A S T R U C T U R E
R E P O R T
B L U E G R A S S
E C O N O M I C
A D V A N C E M E N T
M O V E M E N T
53
CHAPTER 8: WATER AND WASTEWATER SECTOR
IntroductionThe availability of water and wastewater resource capacity is a critical element when determining economic development opportunities for expansion of existing manufacturing or for new manufacturing facilities in the 22-county BEAM region. Evaluation of water and wastewater supplies to support economic development include:
• Capacity or quantity of water and wastewater systems for process water and fire protection• Quality of water and wastewater treatment• Reliability of service delivery • Compliance with the Safe Drinking Water Act and the Clean Water Act• Emergency response and business continuity• Financial viability of the water and wastewater utility
This chapter on water and wastewater infrastructure will provide a general summary of these elements, including information on where to find utility specific information.
General Water Needs for Manufacturing: Water supply is necessary for a variety of manufacturing needs, including process water, cooling, fire protection, irrigation, and potable water. Major manufacturing facilities, such as an automotive assembly plant need a reliable supply of 1 to 2 million gallons per day, depending on the plant size, number of work shifts, and plant process units.
Manufacturing support operations may require up to 250,000 gallons per day of reliable supply. Fire protection for manufacturing ranges from 2,500 to as much as 10,000 gallons per minute, based on the risk profile of the operations. Irrigation for landscaping typically ranges from 75 to 150 gallons per minute based on the area to be irrigated. Light manufacturing facilities typically have 8” to 12” water supply lines with capacity of 1 to 2 million gallons per day. Large manufacturing facilities or clusters require 16” to 24” supply lines with capacity of 3 to 10 million gallons per day.
General Wastewater Needs for Manufacturing: Wastewater supply availability for manufacturing varies based upon the capacity of the wastewater treatment plant, the size of the collection system sewers, and the ability of the wastewater treatment plant to handle industrial waste loads. In some instances, manufacturing facilities may require industrial pre-treatment of waste to reduce the impact on biological treatment at the municipal or regional wastewater plant. The extent of pre-treatment depends on the type of waste, the biochemical oxygen demand (BOD), total suspended solids (TSS), chemical loading, metals, pH, and alkalinity of the waste stream. Light manufacturing will typically require a gravity sewer line size of 12” to 24” in diameter, while large manufacturing will require gravity sewer line capacities of 24” to 48” in diameter. Pressurized sewer mains may allow smaller sewer line sizes, based upon the flow, distance, and energy needed to transport the waste stream.
For new manufacturing facilities, reserve water and wastewater capacity is currently available in existing urbanized areas (i.e. Louisville, Lexington, and Frankfort). However, some development sites outside major urban areas will require additional investment in water and sewer delivery infrastructure, depending on the size of the manufacturing facility, process water demands, and fire protection.
Current Conditions
Drinking Water Facilities InventoryThe BEAM region is bisected by the Ohio River, a virtually unlimited supply of surface water that provides over 75 billion gallons per day. The Ohio River also provides an abundant and high-quality groundwater aquifer supply for the region. Major groundwater sources of supply are located in Jefferson and Oldham Counties in Kentucky and Clark County in Indiana. There is an estimated 500 million gallons per day (MGD) available for potential manufacturing use from this source, showing the untapped potential of the aquifer. This high-quality source is suitable for many manufacturing applications, including auto assembly, appliance manufacturing, computer chip manufacturing, pharmaceutical manufacturing, and food-beverage processing.
The BEAM region includes 45 water treatment plants in Kentucky and Indiana. Within the 18 Kentucky counties there are 30 plants and within the 4 Indiana counties there are 15 plants. These treatment plants serve community water systems in the region with a total, combined design capacity of approximately 570 MGD. Individual treatment plant capacities range from 0.20 MGD to 240 MGD, and are broken down by size in Table 8.1. Data on individual treatment plants can be found in Table 8.2, and their locations are illustrated in Figure 8.1. Combined, the water treatment facilities in the BEAM region provide water service to more than 2 million people in the area.

R E G I O N A L
I N F R A S T R U C T U R E
R E P O R T
B L U E G R A S S
E C O N O M I C
A D V A N C E M E N T
M O V E M E N T
54
R E G I O N A L
I N F R A S T R U C T U R E
R E P O R T
B L U E G R A S S
E C O N O M I C
A D V A N C E M E N T
M O V E M E N T
55
Source: KIPDA Vanpool Data, Nov. 2013
Although it appears that 5 of the water systems in Kentucky have exceeded 85 percent of the treatment capacity on peak demand days, this does not limit future development. A utility can expand existing treatment capacity or purchase capacity from adjacent water systems to meet peak demand. None of the major development sites in the BEAM region are located in areas of restricted capacity. (Data on the percent of capacity utilized in Kentucky facilities is based on September 2013 data provided by the Kentucky Division of Water.)
In addition to source and treatment capacity, the ability to deliver adequate water supply to a major development site is critical. The water supply needed for manufacturing facilities varies with the type of manufacturing, the amount of process water needed, fire protection requirements, and the reliability needed for the operation. In some cases, peak water demands are necessary to support various operational schedules and fire protection. Peak water demand can often be satisfied with construction of onsite water storage. In each case, an assessment needs to be conducted on the type of manufacturing facility, including the quality of water needed, the average daily water demand, the peak hourly demand (for process water and fire protection) and the reliability needs
Figure 8.1: Water Treatment Facilities in the BEAM Region
Table 8.1: Water Treatment Plant Sizes in the BEAM Region Table 8.2: Water Treatment Facilities in the BEAM Region

R E G I O N A L
I N F R A S T R U C T U R E
R E P O R T
B L U E G R A S S
E C O N O M I C
A D V A N C E M E N T
M O V E M E N T
56
R E G I O N A L
I N F R A S T R U C T U R E
R E P O R T
B L U E G R A S S
E C O N O M I C
A D V A N C E M E N T
M O V E M E N T
57
of the facility. Large-scale development projects may require construction of treatment, pumping, storage, transmission and distribution facilities that can take up to two years to provide. Therefore, preliminary water supply plans addressing capacity needs should be developed early in the site development process.
Drinking Water RegulationsDrinking Water systems are regulated by the U.S. Environmental Protection Agency (EPA) through the Kentucky Cabinet for Environmental Protection or the Indiana Department for Natural Resources. The EPA administers the provisions of the 1974 Safe Drinking Water Act (SDWA) through a primacy relationship with each state. The SDWA (and amendments to the Act) regulates contaminants in the drinking water supply, through a series of “rules,” including the Total Coliform Rule, the Lead and Copper Rule, the Enhanced Surface Water Treatment Rule, the Groundwater Rule, and the Unregulated Contaminant Monitoring Rule. The permitted Community Water Systems and treatment plants within the Kentucky BEAM counties are currently in compliance with the health-based regulatory requirements of the SDWA regulations. There have been instances of non-compliance, but these violations do not affect the ability to serve any of the major industrial development sites identified. EPA maintains an online database that provides information on drinking water compliance violations for each system (http://water.epa.gov/drink/local/).
Wastewater Facilities InventoryWithin the BEAM region there are 73 wastewater treatment plants with a total design capacity of 354 MGD. Individual treatment plant capacities range from 0.01 MGD to 120 MGD. Table 8.3 shows the distribution of wastewater treatment plants by size. The wastewater treatment plants (with greater than 0.25 MGD capacity) are shown in Figure 8.2, while Table 8.4 provides specific information on all government, municipal or publically owned wastewater treatment plants with an active National Pollutant Discharge Elimination System (NPDES) Permit.
Source: KIPDA Vanpool Data, Nov. 2013
Figure 8.2: Wastewater Treatment Facilities in the BEAM Region
Table 8.3: Wastewater Treatment Plant Sizes in the BEAM Region
Table 8.4: Wastewater Treatment Facilities in the BEAM Region
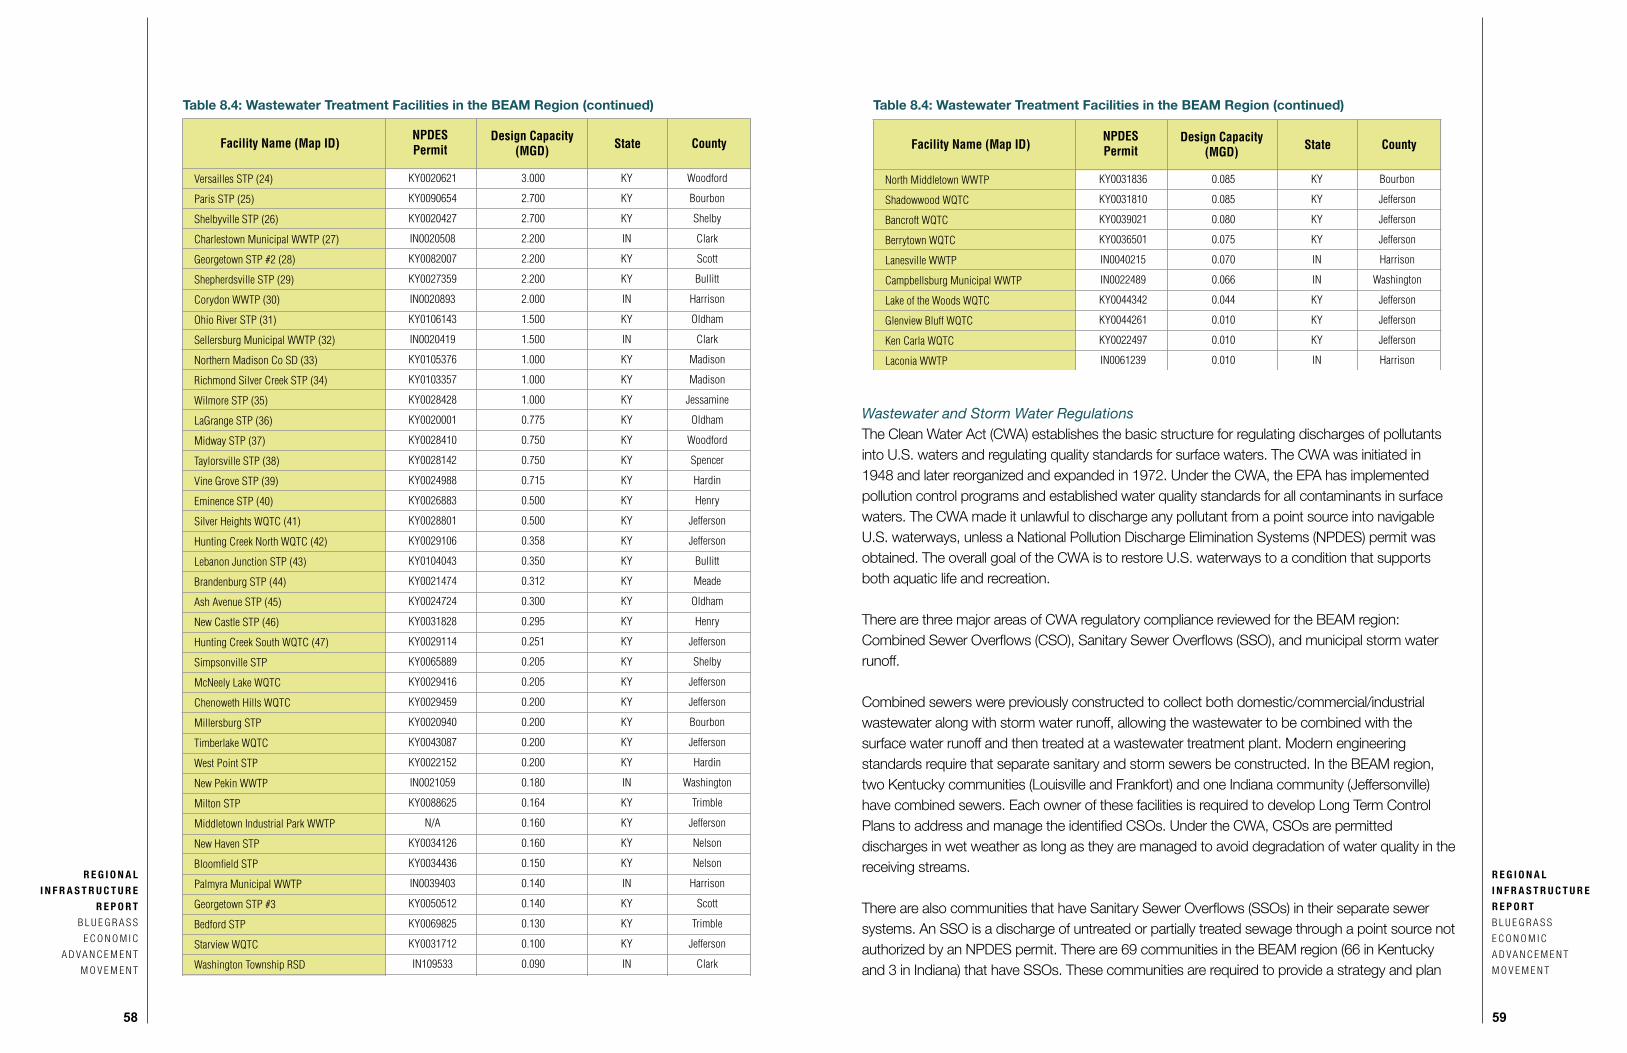
R E G I O N A L
I N F R A S T R U C T U R E
R E P O R T
B L U E G R A S S
E C O N O M I C
A D V A N C E M E N T
M O V E M E N T
58
R E G I O N A L
I N F R A S T R U C T U R E
R E P O R T
B L U E G R A S S
E C O N O M I C
A D V A N C E M E N T
M O V E M E N T
59
Table 8.4: Wastewater Treatment Facilities in the BEAM Region (continued)
Wastewater and Storm Water RegulationsThe Clean Water Act (CWA) establishes the basic structure for regulating discharges of pollutants into U.S. waters and regulating quality standards for surface waters. The CWA was initiated in 1948 and later reorganized and expanded in 1972. Under the CWA, the EPA has implemented pollution control programs and established water quality standards for all contaminants in surface waters. The CWA made it unlawful to discharge any pollutant from a point source into navigable U.S. waterways, unless a National Pollution Discharge Elimination Systems (NPDES) permit was obtained. The overall goal of the CWA is to restore U.S. waterways to a condition that supports both aquatic life and recreation.
There are three major areas of CWA regulatory compliance reviewed for the BEAM region: Combined Sewer Overflows (CSO), Sanitary Sewer Overflows (SSO), and municipal storm water runoff.
Combined sewers were previously constructed to collect both domestic/commercial/industrial wastewater along with storm water runoff, allowing the wastewater to be combined with the surface water runoff and then treated at a wastewater treatment plant. Modern engineering standards require that separate sanitary and storm sewers be constructed. In the BEAM region, two Kentucky communities (Louisville and Frankfort) and one Indiana community (Jeffersonville) have combined sewers. Each owner of these facilities is required to develop Long Term Control Plans to address and manage the identified CSOs. Under the CWA, CSOs are permitted discharges in wet weather as long as they are managed to avoid degradation of water quality in the receiving streams.
There are also communities that have Sanitary Sewer Overflows (SSOs) in their separate sewer systems. An SSO is a discharge of untreated or partially treated sewage through a point source not authorized by an NPDES permit. There are 69 communities in the BEAM region (66 in Kentucky and 3 in Indiana) that have SSOs. These communities are required to provide a strategy and plan
Table 8.4: Wastewater Treatment Facilities in the BEAM Region (continued) Table 8.4: Wastewater Treatment Facilities in the BEAM Region (continued)

R E G I O N A L
I N F R A S T R U C T U R E
R E P O R T
B L U E G R A S S
E C O N O M I C
A D V A N C E M E N T
M O V E M E N T
60
R E G I O N A L
I N F R A S T R U C T U R E
R E P O R T
B L U E G R A S S
E C O N O M I C
A D V A N C E M E N T
M O V E M E N T
61
that will eliminate SSOs over a period of time. Under the CWA, SSOs are considered unauthorized discharges and must be eliminated over an agreed upon period of time.
The EPA also regulates Municipal Separate Storm Sewer Systems (MS4s), from which polluted storm water runoff is often discharged untreated into local water bodies. To prevent harmful pollutants from being washed or dumped into a storm sewer system, utilities (or the owner of the facility) must obtain a NPDES permit and develop a storm water management program. There are two different classifications for MS4 systems – Phase I, which are utility/owners who have an individual permit from their state agency, and Phase II, which are owners subject to the conditions of a general storm water management permit. Each regulated MS4 utility/owner is required to develop and implement a Storm Water Management Program (SWMP) to reduce the contamination of storm water runoff and prohibit unauthorized discharges. In the BEAM region, there are 27 Kentucky communities and 9 Indiana communities that are in the MS4 Program.
There are also enforcement actions instituted by the state regulatory agency and agreed upon by the utility and the state agency. These agreements are referred to as Consent Decrees or Agreed Orders, which set aside specific actions that the utility will take to mitigate actions that are in violation of the CWA. In the Kentucky BEAM counties there are 7 utilities/communities that have entered into an Agreed Order (Louisville, Lexington, Frankfort, Bardstown, LaGrange, Versailles, and Winchester). In the Indiana BEAM counties there are 2 utilities/communities that are subject to the terms of an Agreed Order (Clarksville and Jeffersonville).
The Kentucky Division of Water (KDOW) and the Indiana Department of Natural Resources (IDNR) maintain a list of treatment facilities that have reached their treatment capacity and therefore are prohibited from adding new customers. The Kentucky BEAM counties include 25 treatment facilities with restrictions on adding new customers, and the Indiana BEAM counties include one facility with restrictions.
Regional Sewer LegislationIn 2011, the Kentucky General assembly passed House Bill 26, effective date June 8, 2011, that allows a Regional Sewer Commission (RSC) to be established serving the Salt River Watershed. This is permissive legislation, and provides an opportunity for public wastewater operators in Bullitt, Hardin, Jefferson, Meade, and Oldham Counties to form a RSC to provide sewage transport and treatment on a regional service level. In 2013, a series of meetings were held with wastewater operators, elected officials, environmental regulators, KIPDA, and various constituent groups to communicate the provisions of the new legislation. Later in 2014, a workgroup will be formed of interested wastewater operators, and a regional assessment and feasibility study will be conducted to establish a baseline of wastewater capacity, projections of growth, and sewer infrastructure needs in the Salt River watershed. Upon completion of the study and presentation to eligible parties, each wastewater operator will be provided an opportunity to participate in the RSC.
Emergency Response and Business ContinuityWater and wastewater utilities in Kentucky participate in the Kentucky Water and Wastewater
Agency Response Network (WARN). WARN is a network of utilities that are prepared to respond to emergency incidents, including natural disasters and failure of major infrastructure systems. Mutual aid response includes assistance in the form of personnel, equipment, materials, and other services needed to respond to an emergency. The objective is to provide rapid, short-term deployment of emergency services to restore the critical operations of the affected water/wastewater utility. The backbone of the WARN concept is the Mutual Aid and Assistance Agreement. The program is sponsored by the Kentucky-Tennessee chapters of the American Water Works Association and the Water Environment Association. In addition, water/wastewater utilities in Kentucky participate in the Kentucky Emergency Management Agency network that follows the National Incident Management System and requirements of the Department of Homeland Security. In recent years this emergency response framework has worked effectively for response to statewide and local emergencies, including the Ohio River flood of 2011, the ice storm of 2009, and the Hurricane Ike windstorm in 2008. Larger utilities have established business continuity plans to assure operations during emergency events affecting business operations, including information systems, customer service, and administrative services.
Funding Water and Wastewater InfrastructureFunding for water and wastewater infrastructure can come from a variety of sources, including utility revenue from rates and charges, bonds, impact fees, and grants. Historically both water and wastewater infrastructure has had supplemental funding available in some areas provided by federal and state grants. Low-interest loans have also been provided through the State Revolving Fund (SRF) program. Over the past 10 years, specific grants for water and wastewater have significantly declined and the SRF program pool has been reduced, due to tighter federal budgets. The current grant and loan programs available include:
• State Revolving Fund (SRF) grants/loans • Rural Water Association (RWA) grants/loans• U.S. Department of Agriculture (USDA) Rural Development (RD) grants/loans• Housing and Urban Development (HUD) Community Development Block Grant (CDBG)• Incentive packages that may be offered by economic development agencies in Kentucky and Indiana
Prior to the 2008 economic recession, the BEAM region was experiencing moderate growth of 1% to 5% annually and water and wastewater infrastructure improvements were financed through developer fees and contributed capital. Today, only a small amount of infrastructure investment is being developer financed.
This leaves the utility to finance the majority of infrastructure investment through utility rates and the issuance of debt. Annually, rate increases for water and sewer have outpaced the rate of inflation due to the need to invest for regulatory compliance, replacing aging infrastructure, and providing for growth. Rate increase for water and wastewater in the BEAM counties are expected to average between 3.5% and 10% annually over the next 5 years. The rate increase will vary by system, depending on the regulatory compliance schedule, the need to replace infrastructure and the need to accommodate growth in the service area.
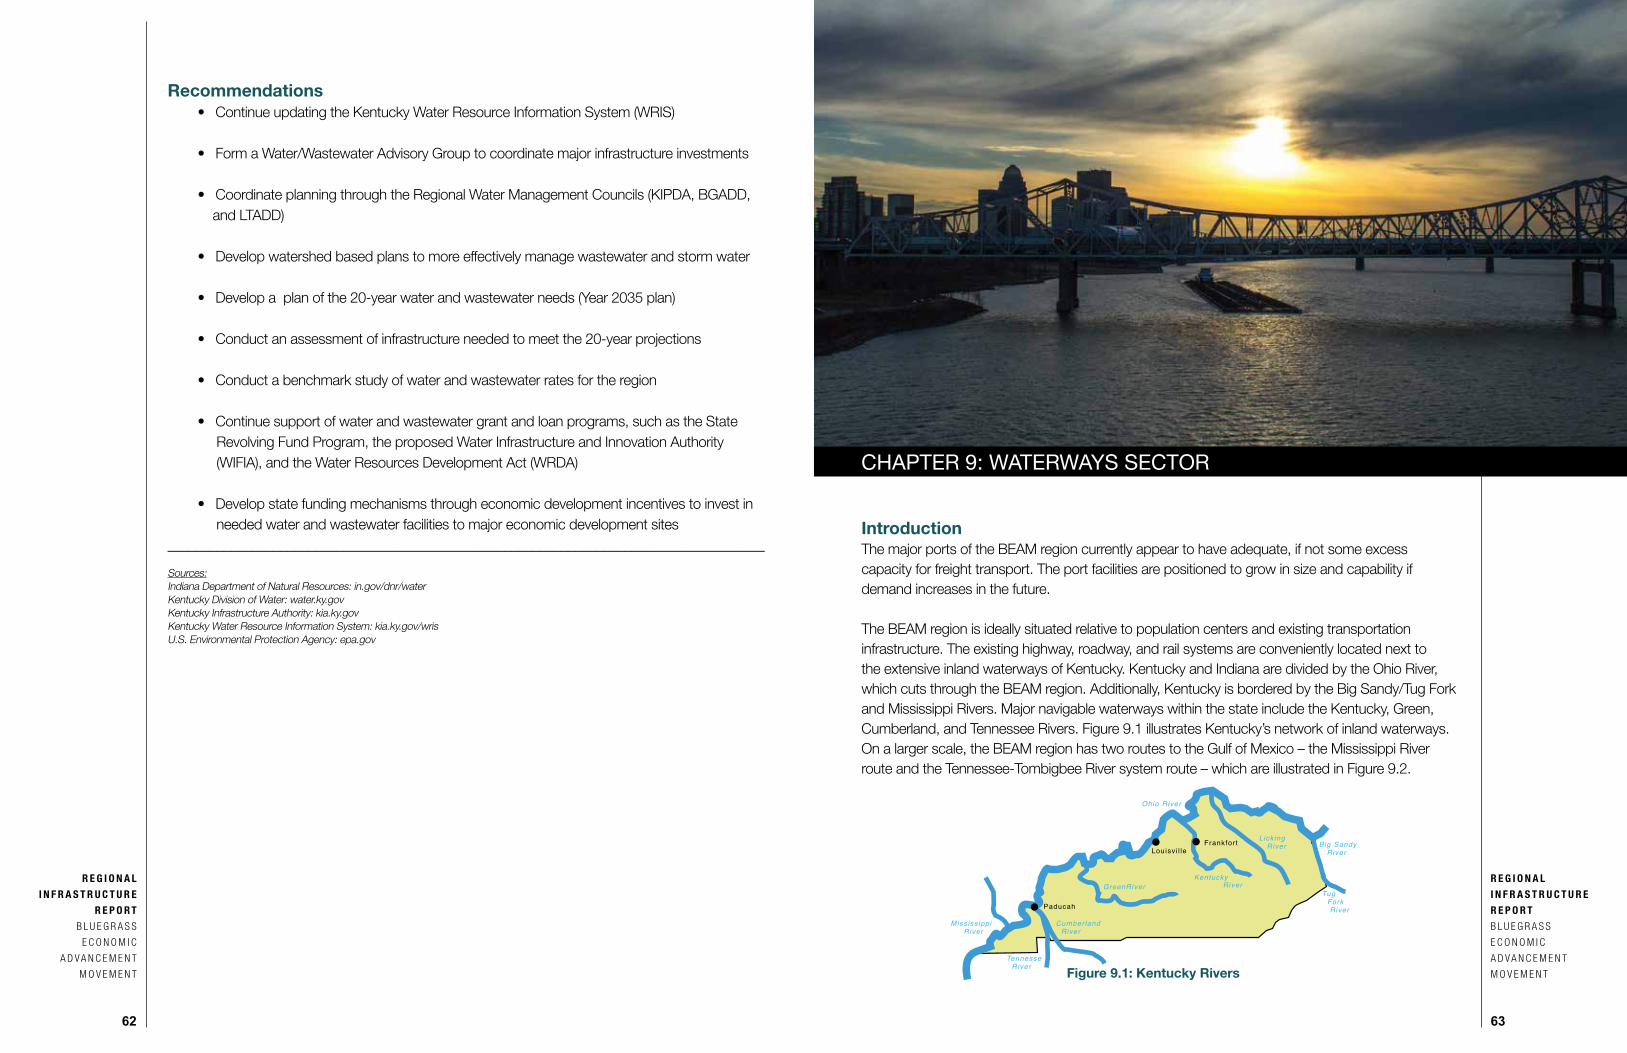
R E G I O N A L
I N F R A S T R U C T U R E
R E P O R T
B L U E G R A S S
E C O N O M I C
A D V A N C E M E N T
M O V E M E N T
62
R E G I O N A L
I N F R A S T R U C T U R E
R E P O R T
B L U E G R A S S
E C O N O M I C
A D V A N C E M E N T
M O V E M E N T
63
Recommendations• Continue updating the Kentucky Water Resource Information System (WRIS)
• Form a Water/Wastewater Advisory Group to coordinate major infrastructure investments
• Coordinate planning through the Regional Water Management Councils (KIPDA, BGADD, and LTADD)
• Develop watershed based plans to more effectively manage wastewater and storm water
• Develop a plan of the 20-year water and wastewater needs (Year 2035 plan)
• Conduct an assessment of infrastructure needed to meet the 20-year projections
• Conduct a benchmark study of water and wastewater rates for the region
• Continue support of water and wastewater grant and loan programs, such as the State Revolving Fund Program, the proposed Water Infrastructure and Innovation Authority (WIFIA), and the Water Resources Development Act (WRDA)
• Develop state funding mechanisms through economic development incentives to invest in needed water and wastewater facilities to major economic development sites
–––––––––––––––––––––––––––––––––––––––––––––––––––––––––––––––––––––––––––––––––––––Sources:Indiana Department of Natural Resources: in.gov/dnr/waterKentucky Division of Water: water.ky.gov Kentucky Infrastructure Authority: kia.ky.gov Kentucky Water Resource Information System: kia.ky.gov/wris U.S. Environmental Protection Agency: epa.gov
CHAPTER 9: WATERWAYS SECTOR
IntroductionThe major ports of the BEAM region currently appear to have adequate, if not some excess capacity for freight transport. The port facilities are positioned to grow in size and capability if demand increases in the future.
The BEAM region is ideally situated relative to population centers and existing transportation infrastructure. The existing highway, roadway, and rail systems are conveniently located next to the extensive inland waterways of Kentucky. Kentucky and Indiana are divided by the Ohio River, which cuts through the BEAM region. Additionally, Kentucky is bordered by the Big Sandy/Tug Fork and Mississippi Rivers. Major navigable waterways within the state include the Kentucky, Green, Cumberland, and Tennessee Rivers. Figure 9.1 illustrates Kentucky’s network of inland waterways. On a larger scale, the BEAM region has two routes to the Gulf of Mexico – the Mississippi River route and the Tennessee-Tombigbee River system route – which are illustrated in Figure 9.2.
Figure 9.1: Kentucky Rivers

R E G I O N A L
I N F R A S T R U C T U R E
R E P O R T
B L U E G R A S S
E C O N O M I C
A D V A N C E M E N T
M O V E M E N T
64
R E G I O N A L
I N F R A S T R U C T U R E
R E P O R T
B L U E G R A S S
E C O N O M I C
A D V A N C E M E N T
M O V E M E N T
65
There are seven operating public riverports in Kentucky, with five additional riverports in various stages of development. Of these, one active port (Jefferson Riverport International in southwest Louisville) and one developing port (Meade County Riverport Authority) are located in the BEAM region. These ports are shown in Figure 9.3. Movement of cargo by waterways is an efficient mode of transportation. There are widely cited statistics available that compare the fuel efficiency and load carrying capacity of the various modes.
Utilizing a gallon of fuel, a ton of cargo will travel approximately 59 miles by truck, 202 miles by rail, or 514 miles by barge. Similarly, one barge load carries the equivalent of 13.4 rail car loads or 58 semi-tractor trailer loads.
These efficiencies are significant to the public and private end-users in terms of transportation savings. The impact to other infrastructure sectors such as highways, roads, and rail systems is reduced. Whether serving the needs of agriculture, construction, and energy production by moving bulk materials, or by moving materials and goods for manufacturing (such as coil steel for the automotive industry), waterway transportation is a key element of the existing regional economy.
The various modes of transportation are often linked in unexpected ways. UPS Worldport® imports jet fuel by barge to a Louisville river terminal on the Ohio River. The fuel is then transported by pipeline to the Worldport® facility at Louisville International Airport. In 2012, UPS imported over $300 million of fuel by barge to support its domestic and international air operations.
As another example, NASA frequently uses the Delta Mariner cargo ship to transport large sections of rockets to Cape Canaveral via the Gulf of Mexico. In January 2012, the Delta Mariner accidently struck and removed a span of the Eggner’s Ferry Bridge on State Route 68/80 in Western Kentucky. The vital span connects Land Between The Lakes National Recreation Area, a major outdoor destination and economic driver for the region, to the greater Western Kentucky area. The replacement span was constructed at the Eddyville, Kentucky public riverport facility and transported by barge to the bridge for placement. The Eddyville Riverport facility provided the necessary laydown space for the complete construction of the span, and a needed loading facility to place the finished span on a barge for transport to the bridge.
Current ConditionsMajor ports of the BEAM region, illustrated in Figure 9.4, include the public ports at the Louisville & Jefferson County Riverport (“Riverport”) in southwest Louisville (River Mile 618 on the Ohio River); the Indiana Port Commission’s Clark Maritime Centre Port Facility in Jeffersonville, Indiana (River Mile 592 on the Ohio River); and River Road Terminal Inc., located northeast of downtown Louisville (River Mile 601 on the Ohio River). Riverport and Clark Maritime are public ports, while River Road Terminal is a private port.
The Riverport facilities include an open general cargo dock equipped with a 30-ton bridge crane. The crane is capable of transferring bulk materials by barge to truck and truck to barge at the rate of 500 tons per hour. Typical bulk materials handled are coal, petroleum coke, and mineral aggregates. The general cargo dock also handles inbound steel coils and outbound stainless steel scrap materials. The crane dock is designed to accommodate sea containers. There is a bulk commodity Figure 9.3: Public Riverports in Kentucky
Figure 9.2: Routes to Gulf of Mexico from the BEAM Region
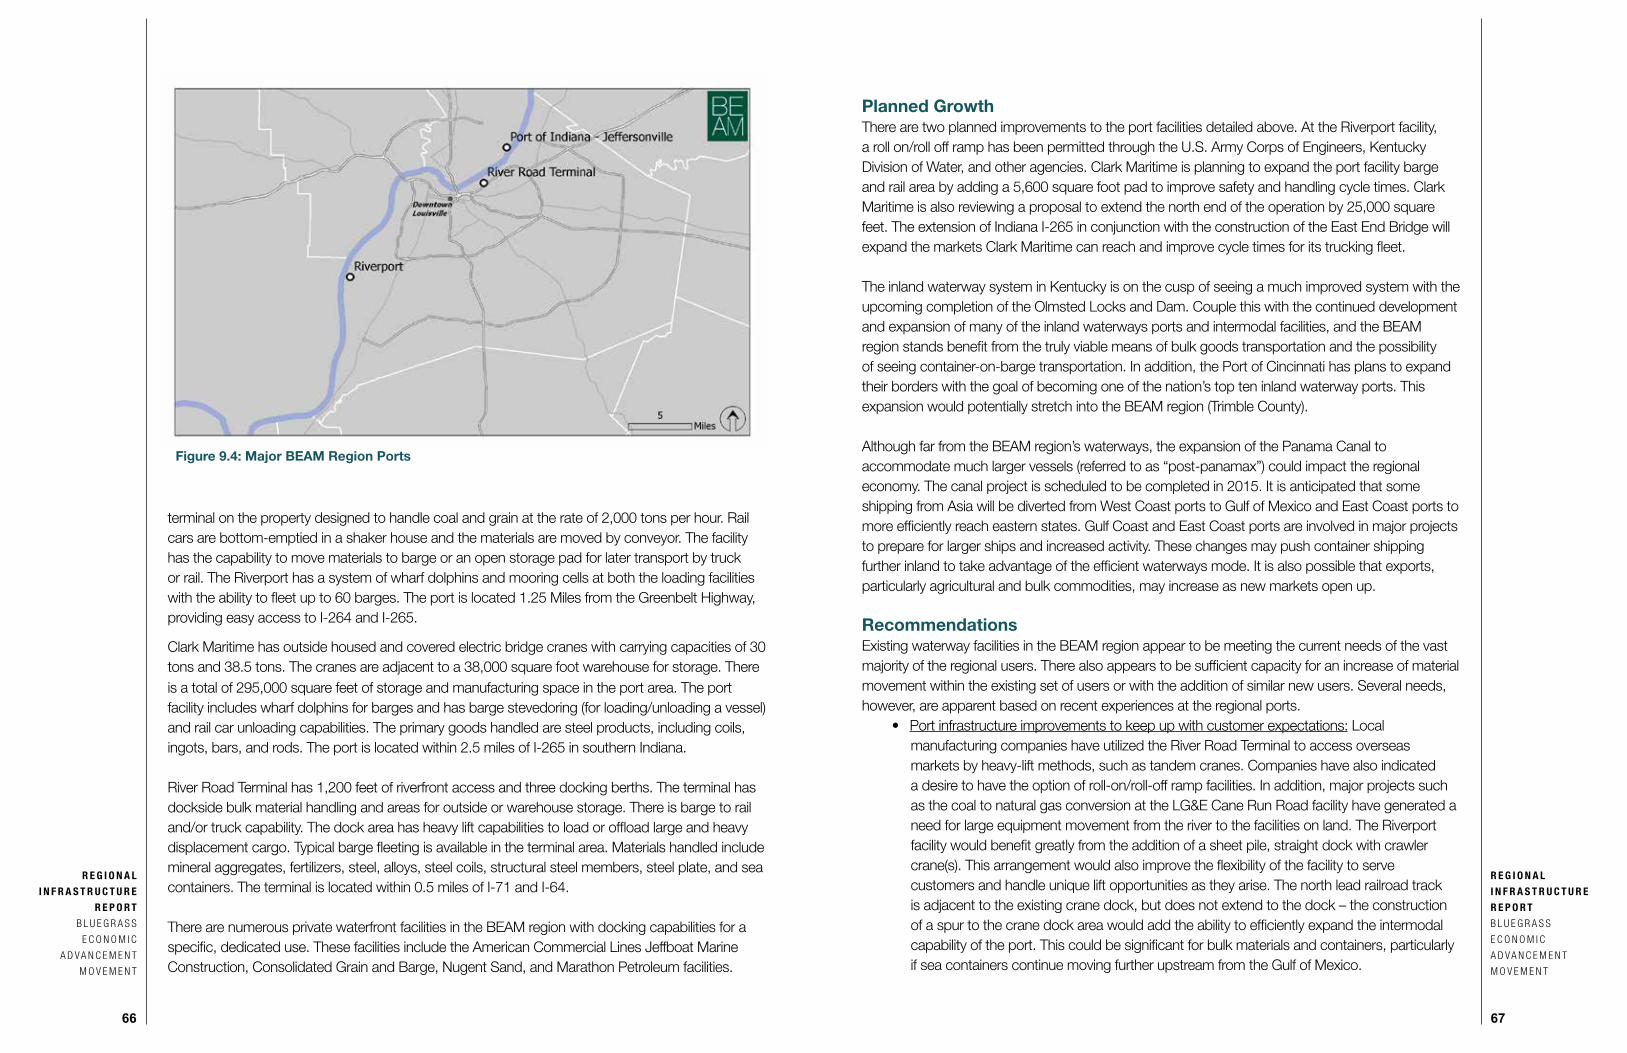
R E G I O N A L
I N F R A S T R U C T U R E
R E P O R T
B L U E G R A S S
E C O N O M I C
A D V A N C E M E N T
M O V E M E N T
66
R E G I O N A L
I N F R A S T R U C T U R E
R E P O R T
B L U E G R A S S
E C O N O M I C
A D V A N C E M E N T
M O V E M E N T
67
terminal on the property designed to handle coal and grain at the rate of 2,000 tons per hour. Rail cars are bottom-emptied in a shaker house and the materials are moved by conveyor. The facility has the capability to move materials to barge or an open storage pad for later transport by truck or rail. The Riverport has a system of wharf dolphins and mooring cells at both the loading facilities with the ability to fleet up to 60 barges. The port is located 1.25 Miles from the Greenbelt Highway, providing easy access to I-264 and I-265.
Clark Maritime has outside housed and covered electric bridge cranes with carrying capacities of 30 tons and 38.5 tons. The cranes are adjacent to a 38,000 square foot warehouse for storage. There is a total of 295,000 square feet of storage and manufacturing space in the port area. The port facility includes wharf dolphins for barges and has barge stevedoring (for loading/unloading a vessel) and rail car unloading capabilities. The primary goods handled are steel products, including coils, ingots, bars, and rods. The port is located within 2.5 miles of I-265 in southern Indiana.
River Road Terminal has 1,200 feet of riverfront access and three docking berths. The terminal has dockside bulk material handling and areas for outside or warehouse storage. There is barge to rail and/or truck capability. The dock area has heavy lift capabilities to load or offload large and heavy displacement cargo. Typical barge fleeting is available in the terminal area. Materials handled include mineral aggregates, fertilizers, steel, alloys, steel coils, structural steel members, steel plate, and sea containers. The terminal is located within 0.5 miles of I-71 and I-64.
There are numerous private waterfront facilities in the BEAM region with docking capabilities for a specific, dedicated use. These facilities include the American Commercial Lines Jeffboat Marine Construction, Consolidated Grain and Barge, Nugent Sand, and Marathon Petroleum facilities.
Planned GrowthThere are two planned improvements to the port facilities detailed above. At the Riverport facility, a roll on/roll off ramp has been permitted through the U.S. Army Corps of Engineers, Kentucky Division of Water, and other agencies. Clark Maritime is planning to expand the port facility barge and rail area by adding a 5,600 square foot pad to improve safety and handling cycle times. Clark Maritime is also reviewing a proposal to extend the north end of the operation by 25,000 square feet. The extension of Indiana I-265 in conjunction with the construction of the East End Bridge will expand the markets Clark Maritime can reach and improve cycle times for its trucking fleet.
The inland waterway system in Kentucky is on the cusp of seeing a much improved system with the upcoming completion of the Olmsted Locks and Dam. Couple this with the continued development and expansion of many of the inland waterways ports and intermodal facilities, and the BEAM region stands benefit from the truly viable means of bulk goods transportation and the possibility of seeing container-on-barge transportation. In addition, the Port of Cincinnati has plans to expand their borders with the goal of becoming one of the nation’s top ten inland waterway ports. This expansion would potentially stretch into the BEAM region (Trimble County).
Although far from the BEAM region’s waterways, the expansion of the Panama Canal to accommodate much larger vessels (referred to as “post-panamax”) could impact the regional economy. The canal project is scheduled to be completed in 2015. It is anticipated that some shipping from Asia will be diverted from West Coast ports to Gulf of Mexico and East Coast ports to more efficiently reach eastern states. Gulf Coast and East Coast ports are involved in major projects to prepare for larger ships and increased activity. These changes may push container shipping further inland to take advantage of the efficient waterways mode. It is also possible that exports, particularly agricultural and bulk commodities, may increase as new markets open up.
RecommendationsExisting waterway facilities in the BEAM region appear to be meeting the current needs of the vast majority of the regional users. There also appears to be sufficient capacity for an increase of material movement within the existing set of users or with the addition of similar new users. Several needs, however, are apparent based on recent experiences at the regional ports.
• Port infrastructure improvements to keep up with customer expectations: Local manufacturing companies have utilized the River Road Terminal to access overseas markets by heavy-lift methods, such as tandem cranes. Companies have also indicated a desire to have the option of roll-on/roll-off ramp facilities. In addition, major projects such as the coal to natural gas conversion at the LG&E Cane Run Road facility have generated a need for large equipment movement from the river to the facilities on land. The Riverport facility would benefit greatly from the addition of a sheet pile, straight dock with crawler crane(s). This arrangement would also improve the flexibility of the facility to serve customers and handle unique lift opportunities as they arise. The north lead railroad track is adjacent to the existing crane dock, but does not extend to the dock – the construction of a spur to the crane dock area would add the ability to efficiently expand the intermodal capability of the port. This could be significant for bulk materials and containers, particularly if sea containers continue moving further upstream from the Gulf of Mexico.
Figure 9.4: Major BEAM Region Ports

R E G I O N A L
I N F R A S T R U C T U R E
R E P O R T
B L U E G R A S S
E C O N O M I C
A D V A N C E M E N T
M O V E M E N T
68
R E G I O N A L
I N F R A S T R U C T U R E
R E P O R T
B L U E G R A S S
E C O N O M I C
A D V A N C E M E N T
M O V E M E N T
69
• Continuation of state funding source: In 2013, the Kentucky General Assembly approved and designated a revenue stream from the general fund. The Secretary of the Kentucky Transportation Cabinet (KTC) offers these funds in the form of 50/50 grants to the public riverports. Projects must be port-related, and KTC consults with the Water Transportation Advisory Board regarding the selection of applications. The continuation of this grant funding source is important to the infrastructure needs of the existing public ports. The grants provide necessary funding for maintenance and improvement projects, which allow the ports to continue or improve their level of service to customers.
____________________________________________________________________________________
Sources:Iowa Department of Transportation: iowadot.gov/compare.pdf Kentucky Transportation Cabinet: transportation.ky.gov Kentucky Transportation Cabinet, Kentucky Riverport Improvement Project, 2008: transportation.ky.gov/Riverports “The Far Reaching Effects of Canal Expansion.” Mid-America Freight Coalition, 2011: midamericafreight.orgMoreno, Jenalia. “Panama Canal expansion means big changes at port.” Houston Chronicle, 2011: chron.com
CHAPTER 10: MAJOR DEVELOPMENT SITES
IntroductionThe BEAM region has an extensive inventory of property for development, including 35 sites at least 50 acres in size. Locations of these sites are shown in Figure 10.1. Site details are compiled in Table 10.1, including basic site information (such as acreage and zoning) and a general assessment of how well they are served by various types of infrastructure. Additional development site information can be found at www.thinkkentucky.com for Kentucky and www.in.gov for Indiana.
The development sites listed are all considered “shovel ready” sites. The two sites with the greatest total acreage available are the 6,000-acre River Ridge Commerce Center in Clark County (Ind.) and across the river from eastern Louisville; and the 1,500-acre Glendale, Kentucky site in Hardin County. Water service is available for both of these sites. Wastewater is not currently available for the Glendale site, but plans are being developed to provide this service. Both sites are served by rail and have direct access to an interstate or major highway. The next six largest sites are all located in Kentucky and have at least 300 acres available for development.
Recommendations• Conduct detailed assessments of all infrastructure needs for the BEAM region’s top 8 economic development sites (those greater than 300 acres and located along the region’s I-64 and I-65 corridors).
• Fund the construction of critical facilities for the BEAM region’s top 8 economic development sites to meet infrastructure needs of targeted manufacturing industries.

R E G I O N A L
I N F R A S T R U C T U R E
R E P O R T
B L U E G R A S S
E C O N O M I C
A D V A N C E M E N T
M O V E M E N T
70
R E G I O N A L
I N F R A S T R U C T U R E
R E P O R T
B L U E G R A S S
E C O N O M I C
A D V A N C E M E N T
M O V E M E N T
71
Map ID
1
2
3
4
5
6
7
8
9
10
11
Site ID
093-005
163-002
093-003
211-008
179-007
151-019
211-010
067-004
185-012
111-013
Site Name (County)
River Ridge Commerce Center (Clark, Ind.)
Glendale MegaSite(Hardin)
Buttermilk Falls Industrial Site (Meade)
T.J. Patterson Industrial Park (Hardin)
Norfolk Southern Site (Shelby)
Bardstown-Nelson Co Industrial Park (Nelson)
Berea-Menelaus Industrial Park (Madison)
Shelbyville (Shelby)
Coldstream Research Campus (Fayette)
East LaGrange (Oldham)
Blankenbaker Station Business Park I, II, and III (Jefferson)
Interstate/ Hwy
Distance
0 mi
0 mi
20 mi
5 mi
0 mi
0.1 mi
1.5 mi
0.25 mi
0 mi
4 mi
1 mi
Table 10.1: Development Sites in the BEAM Region
Current Zoning
IR (River Ridge only,allows industrial, commercial and office)
I-1 (Industrial - restrictions on parcel allow for 1 large facility only)
I-2 (Heavy Industrial)
I-1 (Industrial)
Agricultural and Industrial
Light Industrial I-1
I-2 (Industrial)
Agricultural and Industrial
P-2 (Office, Industrial, Research Park)
I-2 (Heavy Industrial), CO-1 (Conservation Residential District)
PEC (Planned Employment Center)
Total Acres*
6,000
1,551
480
448
400
337
319
303
251
245
236
Largest Possible Tract**
1,200
1,551
341
218
272
133
273
272
60
218
140
Rail Served
Yes
Yes
Yes
Yes
Yes
No
No
Yes
No
No
No
River Access
No
No
Yes
No
No
No
No
No
No
No
No
Nearest Airport
19 mi
46 mi
38 mi
38 mi
37 mi
41 mi
44 mi
29 mi
9 mi
30 mi
14 mi
Water/ Sewer
Yes/Yes
Yes/No
Yes/Yes
Yes/Yes
Yes/Yes
Nearby/ Yes
Yes/Yes
Yes/ Nearby
Yes/Yes
Yes/ Nearby
Yes/Yes
Figure 10.1: Development Sites in the BEAM Region
Table 10.1: Development Sites in the BEAM Region
Table 10.1: Development Sites in the BEAM Region (continued)

R E G I O N A L
I N F R A S T R U C T U R E
R E P O R T
B L U E G R A S S
E C O N O M I C
A D V A N C E M E N T
M O V E M E N T
72
FOR MORE INFORMATION:
Scott ShapiroSenior Advisor to Mayor Jim Gray
Office of the Mayor, [email protected]
Chris PoynterDirector of Communications
Office of the Mayor, [email protected]
The report can also be found at www.louisvilleky.gov/BEAM and
www.lexingtonky.gov/BEAM
REGIONAL INFRASTRUCTURE
REPORT BLUEGRASS ECONOMIC
ADVANCEMENT MOVEMENT
BEAM

REGIONAL INFRASTRUCTURE
REPORT BLUEGRASS ECONOMIC
ADVANCEMENT MOVEMENT
BEAM