
BEA2014 -Understanding the Global Book Market & How it will Change
65
Jonathan Nowell BookExpo America 28 May 2014 UNDERSTANDING THE GLOBAL BOOK MARKET AND HOW IT WILL CHANGE Booth 1113
-
Upload
bookexpoamerica -
Category
Data & Analytics
-
view
2.398 -
download
3
description
Today, all businesses in the publishing ecosystem need data. Big data and small data chunks provide publishers, booksellers, service providers and others with a deeper insight into the market and a grasp of key trends. Nielsen Book the leading market research company in the industry worldwide presents a global market overview for the book industry – highlighting key trends across the world with emphasis on the US market. This deep dive data presentation – both print and digital - from across the Nielsen business lines will include; consumer confidence, consumer research, and future trends in the book market. Information discussed will focus on book publishing, sales and marketing strategy and up-coming global trends. Quantified data from Nielsen in consumer purchasing, buying habits and devices used, will help BEA attendees gain a greater understanding of the industry and its highs and lows.
Transcript of BEA2014 -Understanding the Global Book Market & How it will Change

Jonathan Nowell BookExpo America
28 May 2014
UNDERSTANDING THE GLOBAL BOOK MARKET
AND HOW IT WILL CHANGE
Booth 1113

Co
pyr
igh
t ©
2013
Th
e N
iels
en C
om
pan
y. C
on
fid
enti
al a
nd
pro
pri
etar
y.
2
AGENDA
• DATA SOURCES
• INTERNATIONAL CONTEXT
• PRINT TRENDS (YEAR-TO-DATE DATA TO 19th APRIL 2014)
• E-BOOKS IN THE US
• E-BOOKS IN THE UK (DATA TO 19th JANUARY 2014)
• THOUGHTS ABOUT THE FUTURE

Co
pyr
igh
t ©
2013
Th
e N
iels
en C
om
pan
y. C
on
fid
enti
al a
nd
pro
pri
etar
y.
3
• Nielsen’s BookScan
• EPOS sales data supplied by retailers in 10 countries worldwide
• Nielsen’s Books & Consumers US survey
• Survey of 6,000 book buyers per month, selected from a nationally representative sample by age, gender, location
• Online questionnaire of ~75 questions
• Nielsen Insight into the UK E-book Consumer Market: May 2014
• Data from Kantar panel of 15,000 13-79 year olds, nationally representative of the UK population
• Online questionnaire collecting monthly book buying data
MAIN DATA SOURCES

INTERNATIONAL CONTEXT

Co
pyr
igh
t ©
2012
Th
e N
iels
en C
om
pan
y. C
on
fid
enti
al a
nd
pro
pri
etar
y.
5
CONSUMER CONFIDENCE TO Q1-2014
Asia-Pac lead the way
Russia
Brazil
US
Northern Europe
Southern Europe and France

Co
pyr
igh
t ©
2012
Th
e N
iels
en C
om
pan
y. C
on
fid
enti
al a
nd
pro
pri
etar
y.
6
0
20
40
60
80
100
120
140
160
121
106 100 100
89 87 82 82
61
45
Global average 96
Q1 2014 Nielsen Consumer Confidence Index
CONSUMER CONFIDENCE INDEX
Base : All respondents n=31972
Nielsen Global Survey of Consumer Confidence & Spending Intentions

Co
pyr
igh
t ©
2012
Th
e N
iels
en C
om
pan
y. C
on
fid
enti
al a
nd
pro
pri
etar
y.
7
BOOKSCAN’S TEN INTERNATIONAL TERRITORIES
A combined total of over 1 billion print book sales measured in 2013

Co
pyr
igh
t ©
2012
Th
e N
iels
en C
om
pan
y. C
on
fid
enti
al a
nd
pro
pri
etar
y.
8
?
-6.4% -1.1%
-4.4% -6.7%
-10.2%
1.1%
0.03%
9.5%
-9.6%
BOOKSCAN’S TEN INTERNATIONAL TERRITORIES As of April, three territories showing year to date growth in print book volume sales

Co
pyr
igh
t ©
2012
Th
e N
iels
en C
om
pan
y. C
on
fid
enti
al a
nd
pro
pri
etar
y.
9
-15.0% -10.0% -5.0% 0.0% 5.0% 10.0% 15.0%
Adult Fiction
Non-Fiction
Children's
Total ES
IT
ROI
UK
EUROPEAN GENRE PERFORMANCE, 2014YTD VS 2013YTD
Nielsen BookScan

Co
pyr
igh
t ©
2012
Th
e N
iels
en C
om
pan
y. C
on
fid
enti
al a
nd
pro
pri
etar
y.
10
-30.0% -20.0% -10.0% 0.0% 10.0% 20.0% 30.0%
Adult Fiction
Non-Fiction
Children's
Total SA
IND
NZ
AUS
US
INTERNATIONAL GENRE PERFORMANCE, 2014YTD VS 2013YTD
Nielsen BookScan

Co
pyr
igh
t ©
2012
Th
e N
iels
en C
om
pan
y. C
on
fid
enti
al a
nd
pro
pri
etar
y.
11
Volume 2014YTD
41%
29%
26%
4%
F
T
S
Y
BRAZIL BY PRODUCT CLASS
28%
27%
41%
4%
F
T
S
Y
Value 2014YTD
Nielsen BookScan
23%
18%
8% T6 Religion
5%
F2
Y2
Y5
T6
T17
S5
S4
F1
T4
T1
S2
S1
T9
T2
T5
Volume 2014YTD by mid-level product class
Volume YTD: 12 million Value YTD: R$500 million
Avg. Weekly Sales 2014: 752k, R$31million

Co
pyr
igh
t ©
2012
Th
e N
iels
en C
om
pan
y. C
on
fid
enti
al a
nd
pro
pri
etar
y.
12
BRAZIL TOP 20 JULY 2013-APRIL 2014
Nielsen BookScan
Pos Title Author Publisher ASP
1 Kairos: O Tempo De Deus Rossi, Padre Marcelo Globo Livros R$16.54
2 Nada A Perder: Meus Desafios Diante Do Impossivel - Livro 2
Macedo, Edir Editora Planeta do Brasil R$27.48
3 A Culpa E Das Estrelas Green, John Intrinseca R$27.44
4 Inferno Brown, Dan Editora Sextante R$34.75
5 Destrua Este Diario Smith, Keri Intrinseca R$23.12
6 Cinquenta Tons De Cinza James, E.L. Intrinseca R$24.24
7 1889 Gomes, Laurentino Globo Livros R$38.49
8 Livro - Dona Benta: Comer Bem - Edicao Especial Completa
Nacional, Editora IBEP R$20.07
9 Cidades De Papel Green, John Intrinseca R$27.14
10 Silencio Das Montanhas, O Hosseini, Khaled Globo Livros R$34.00
11 Cinquenta Tons De Liberdade James, E.L. Intrinseca R$23.90
12 Teorema Katherine, O Green, John Intrinseca R$27.27
13 Cinquenta Tons Mais Escuros James, E.L. Intrinseca R$24.05
14 Pequeno Principe, O Saint-Exupery, Antoine Ediouro Livros R$19.61
15 Casa de Hades, A Riordan, Rick Intrinseca R$35.24
16 Lado Bom Da Vida, O Quick, Matthew Intrinseca R$22.46
17 Casamento Blindado Cardoso, Renato & Cristiane Ediouro Livros R$23.53
18 Eu Nao Consigo Emagrecer Dukan, Pierre Editorial Record R$27.49
19 Quem E Voce Alasca? Green, John WMF Martins Fontes R$28.36
20 Ladrao De Raios, O – Vol 1 Riordan, Rick Intrinseca R$23.51

PRINT TRENDS

Co
pyr
igh
t ©
2012
Th
e N
iels
en C
om
pan
y. C
on
fid
enti
al a
nd
pro
pri
etar
y.
14
Australia Volume Sales
0
2
4
6
8
10
12
14
16
Adult Fiction Trade Non-Fiction Specialist Non-Fiction Children's Total
Mill
ion
s
2012YTD
2013YTD
2014YTD
AUSTRALIA – RECENT TRENDS Fiction only broad genre in decline
Nielsen BookScan

Co
pyr
igh
t ©
2012
Th
e N
iels
en C
om
pan
y. C
on
fid
enti
al a
nd
pro
pri
etar
y.
15
India Volume Sales
0
1
2
3
4
5
6
Adult Fiction Trade Non-Fiction Specialist Non-Fiction Children's Total
Mill
ion
s
2012YTD
2013YTD
2014YTD
INDIA – RECENT TRENDS Specialist Non-Fiction leads growth
Nielsen BookScan

Co
pyr
igh
t ©
2012
Th
e N
iels
en C
om
pan
y. C
on
fid
enti
al a
nd
pro
pri
etar
y.
16
TCM Value Sales
£0
£50
£100
£150
£200
£250
£300
£350
£400
£450
£500
2005YTD 2006YTD 2007YTD 2008YTD 2009YTD 2010YTD 2011YTD 2012YTD 2013YTD 2014YTD
Mill
ion
s UK LONGER TERM TRENDS Year-on-year decline in TCM slowing so far in 2014
Nielsen BookScan
-1.4%

Co
pyr
igh
t ©
2013
Th
e N
iels
en C
om
pan
y. C
on
fid
enti
al a
nd
pro
pri
etar
y.
17
2014 UK BESTSELLERS
Nielsen BookScan
2014YTD
2013YTD

Co
pyr
igh
t ©
2012
Th
e N
iels
en C
om
pan
y. C
on
fid
enti
al a
nd
pro
pri
etar
y.
18
Adult Fiction TCM Sales
£0
£20
£40
£60
£80
£100
£120
£140
Mill
ion
s UK LONGER TERM SECTOR TRENDS
Adult Trade Non-Fiction TCM Sales
Nielsen BookScan
£0
£50
£100
£150
£200
£250
Mill
ion
s
-6.3% -4.1%

Co
pyr
igh
t ©
2013
Th
e N
iels
en C
om
pan
y. C
on
fid
enti
al a
nd
pro
pri
etar
y.
19
FOOD & DRINK LEADS YEAR-ON-YEAR DECLINE IN TRADE NON-FICTION AT -15.1% But Biographies with Atlas, Maps & Travel are leading the long term decline
£0
£20
£40
£60
£80
£100
£120
£140
£160
£180
£200
2009YTD 2010YTD 2011YTD 2012YTD 2013YTD 2014YTD
£18 £19 £24 £19 £21 £18
£25 £22 £21
£19 £17 £17
£18 £17 £17
£17 £16 £16
£24 £19
£20
£18 £16 £16
£15 £14
£14
£14 £13 £13
Mill
ion
s
T18 Fiction Related Items
T2 Dictionaries & Reference
T7 Politics & Government
T10 Mind, Body & Spirit
T12 Transport
T15 Sport
T13 Humour, Trivia & Puzzles
T6 Religion
T3 Literature, Poetry & Criticism
T17 Personal Development
T8 The World / Ideas / Culture: General Interest
T9 Family, Health & Relationships
T11 Leisure & Lifestyle
T5 History & Military
T4 Biographies & Autobiographies
T1 The Arts
T14 Atlases, Maps & Travel
T16 Food & Drink

Co
pyr
igh
t ©
2012
Th
e N
iels
en C
om
pan
y. C
on
fid
enti
al a
nd
pro
pri
etar
y.
20
Adult Specialist Non-Fiction TCM Sales
£0
£10
£20
£30
£40
£50
£60
£70
Mill
ion
s UK LONGER TERM SECTOR TRENDS
Children’s (Ex. Y5) TCM Sales
Nielsen BookScan
£0
£10
£20
£30
£40
£50
£60
£70
£80
Mill
ion
s
-1.3%
+8.7%

Co
pyr
igh
t ©
2012
Th
e N
iels
en C
om
pan
y. C
on
fid
enti
al a
nd
pro
pri
etar
y.
21
US Volume Sales
0
50
100
150
200
250
2005YTD 2006YTD 2007YTD 2008YTD 2009YTD 2010YTD 2011YTD 2012YTD 2013YTD 2014YTD
Mill
ion
s US LONGER TERM TRENDS Includes Walmart sales as of 2013
Nielsen BookScan
+0.03%

Co
pyr
igh
t ©
2012
Th
e N
iels
en C
om
pan
y. C
on
fid
enti
al a
nd
pro
pri
etar
y.
22
US Volume Sales by Product Class 2013YTD
42%
25%
26%
7% Adult Non-Fiction
Juvenile Fiction
Adult Fiction
Juvenile Non-Fiction
US MARKET BY GENRE Juvenile Fiction sales have overtaken Adult Fiction in 2014 so far
41%
28%
23%
8% Adult Non-Fiction
Juvenile Fiction
Adult Fiction
Juvenile Non-Fiction
US Volume Sales by Product Class 2014YTD
Nielsen BookScan

Co
pyr
igh
t ©
2013
Th
e N
iels
en C
om
pan
y. C
on
fid
enti
al a
nd
pro
pri
etar
y.
23
2014 US BESTSELLERS DOMINATED BY JUVENILE FICTION
Nielsen BookScan
2014YTD
2013YTD
Co
pyr
igh
t ©
2012
Th
e N
iels
en C
om
pan
y. C
on
fid
enti
al a
nd
pro
pri
etar
y.
24
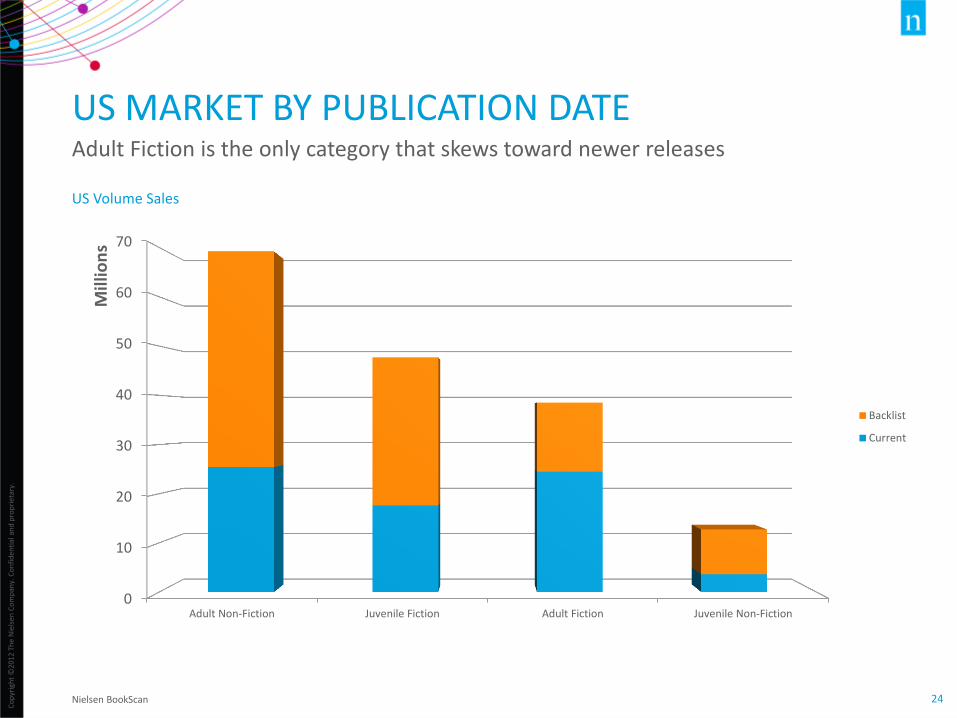
US Volume Sales
0
10
20
30
40
50
60
70
Adult Non-Fiction Juvenile Fiction Adult Fiction Juvenile Non-Fiction
Mill
ion
s
Backlist
Current
US MARKET BY PUBLICATION DATE Adult Fiction is the only category that skews toward newer releases
Nielsen BookScan

Co
pyr
igh
t ©
2012
Th
e N
iels
en C
om
pan
y. C
on
fid
enti
al a
nd
pro
pri
etar
y.
25
US Volume Sales by Publisher
0
10
20
30
40
50
60
Mill
ion
s
2013YTD
2014YTD
TOP 10 US PUBLISHERS IN 2014 SO FAR Four of the top publishers in growth on 2013
Nielsen BookScan
+3.1%
+12.2%
+8.8% +8.4%

Co
pyr
igh
t ©
2012
Th
e N
iels
en C
om
pan
y. C
on
fid
enti
al a
nd
pro
pri
etar
y.
26
US Volume Sales – Adult Fiction
0
10
20
30
40
50
60
70
2005YTD 2006YTD 2007YTD 2008YTD 2009YTD 2010YTD 2011YTD 2012YTD 2013YTD 2014YTD
Mill
ion
s US LONGER TERM SECTOR TRENDS Includes Walmart sales as of 2013
Nielsen BookScan
-13.1%

Co
pyr
igh
t ©
2013
Th
e N
iels
en C
om
pan
y. C
on
fid
enti
al a
nd
pro
pri
etar
y.
27
2014 US FICTION BESTSELLERS
Nielsen BookScan
2014YTD
2013YTD

Co
pyr
igh
t ©
2012
Th
e N
iels
en C
om
pan
y. C
on
fid
enti
al a
nd
pro
pri
etar
y.
28
US Volume Sales – Adult Fiction
0
2
4
6
8
10
12
Mill
ion
s
2013YTD
2014YTD
US ADULT FICTION BY CATEGORY Graphic Novels and Westerns are the only categories in growth
Nielsen BookScan

Co
pyr
igh
t ©
2012
Th
e N
iels
en C
om
pan
y. C
on
fid
enti
al a
nd
pro
pri
etar
y.
29
Percent Growth in Volume Sales
GRAPHIC NOVELS SEE INTERNATIONAL GROWTH Eight out of ten territories have increased sales so far in 2014
Nielsen BookScan
0% 10% 20% 30% 40%
ES
IN
US
ROI
UK
AUS
IT
NZ

Co
pyr
igh
t ©
2012
Th
e N
iels
en C
om
pan
y. C
on
fid
enti
al a
nd
pro
pri
etar
y.
30
US Volume Sales – General Fiction
-35.1%
+11.1% -13.7%
+42.8%
+14.1%
Literary Historical General Contemporary Women Short Stories (single author) Sagas Humorous Family Life Coming of Age Erotica African American / Urban Media Tie-In Anthologies (multiple authors) Urban African American / Contemporary Women Biographical Political Gay Alternative History Dystopian Native American & Aboriginal African American / General African American / Historical Mashups Amish & Mennonite Cultural Heritage Lesbian Sports Holidays African American / Erotica Satire Sea Stories
US GENERAL FICTION BY BISAC DESCRIPTION Literary and Historical account for almost half of General Fiction sales 2014YTD
Nielsen BookScan

Co
pyr
igh
t ©
2012
Th
e N
iels
en C
om
pan
y. C
on
fid
enti
al a
nd
pro
pri
etar
y.
31
US Volume Sales – Adult Non-Fiction
0
10
20
30
40
50
60
70
80
90
100
2005YTD 2006YTD 2007YTD 2008YTD 2009YTD 2010YTD 2011YTD 2012YTD 2013YTD 2014YTD
Mill
ion
s US LONGER TERM SECTOR TRENDS Includes Walmart sales as of 2013
Nielsen BookScan
-1.3%

Co
pyr
igh
t ©
2013
Th
e N
iels
en C
om
pan
y. C
on
fid
enti
al a
nd
pro
pri
etar
y.
32
2014 US NON-FICTION BESTSELLERS
Nielsen BookScan
2014YTD
2013YTD

Co
pyr
igh
t ©
2012
Th
e N
iels
en C
om
pan
y. C
on
fid
enti
al a
nd
pro
pri
etar
y.
33
US Volume Sales – Adult Non-Fiction
0
2
4
6
8
10
12
Mill
ion
s
2013YTD
2014YTD
US ADULT NON-FICTION BY CATEGORY Already a top category, Religion/Bibles grew 8.3% on 2013YTD
Nielsen BookScan

Co
pyr
igh
t ©
2012
Th
e N
iels
en C
om
pan
y. C
on
fid
enti
al a
nd
pro
pri
etar
y.
34
US Volume Sales – Religion/Bibles
0
0.2
0.4
0.6
0.8
1
1.2
1.4
Mill
ion
s
2013YTD
2014YTD
TOP IMPRINTS IN RELIGION/BIBLES Thomas Nelson up 34% year-on-year; only two imprints of top ten in decline
Nielsen BookScan

Co
pyr
igh
t ©
2012
Th
e N
iels
en C
om
pan
y. C
on
fid
enti
al a
nd
pro
pri
etar
y.
35
Percent Growth in US Volume Sales – Self-Help
-20%
-10%
0%
10%
20%
30%
40%
50%
60%
70%
80%
Personal Growth / General
Personal Growth / Success
Motivational & Inspirational
Creativity
Personal Growth / Happiness
General
Personal Growth / Self-Esteem
Spiritual
Sexual Instruction
Mood Disorders / General
GROWTH IN SELF-HELP BOOKS More than half of top categories up on 2013
Nielsen BookScan

Co
pyr
igh
t ©
2012
Th
e N
iels
en C
om
pan
y. C
on
fid
enti
al a
nd
pro
pri
etar
y.
36
US Volume Sales – All Juvenile
0
10
20
30
40
50
60
70
2005YTD 2006YTD 2007YTD 2008YTD 2009YTD 2010YTD 2011YTD 2012YTD 2013YTD 2014YTD
Mill
ion
s US LONGER TERM SECTOR TRENDS Includes Walmart sales as of 2013
Nielsen BookScan
+11.9%

Co
pyr
igh
t ©
2012
Th
e N
iels
en C
om
pan
y. C
on
fid
enti
al a
nd
pro
pri
etar
y.
37
YTD Volume Sales in Y Children’s, Young Adult & Educational/All Juvenile (US)
0 10,000,000 20,000,000 30,000,000 40,000,000 50,000,000 60,000,000
US
UK
AUS
IN
ROI
2014YTD
2013YTD
GROWTH IN INTERNATIONAL CHILDREN’S MARKET Five territories up year-on-year in Children’s sector
Nielsen BookScan

Co
pyr
igh
t ©
2012
Th
e N
iels
en C
om
pan
y. C
on
fid
enti
al a
nd
pro
pri
etar
y.
38
US Volume Sales – Juvenile Fiction
0
5
10
15
20
25
30
35
40
45
50
2011YTD 2012YTD 2013YTD 2014YTD
Mill
ion
s
Holidays/Festivals/Religion
Concepts
Animals
Classics
History/Sports/People/Places
Social Situations/Family/Health
Science Fiction/Fantasy/Magic
General
US JUVENILE FICTION BY CATEGORY Science Fiction/Fantasy/Magic up 47% on 2013
Nielsen BookScan

Co
pyr
igh
t ©
2012
Th
e N
iels
en C
om
pan
y. C
on
fid
enti
al a
nd
pro
pri
etar
y.
40
US Volume Sales – All Juvenile
0
0.5
1
1.5
2
2.5
3
Mill
ion
s
2013YTD
2014YTD
DIVERGENT CARRIES VERONICA ROTH TO TOP AUTHOR IN JUVENILE FICTION New entries in top ten for 2014: Roth, Green, Riggs, Zusak
Nielsen BookScan

E-BOOKS IN THE US

Co
pyr
igh
t ©
2012
Th
e N
iels
en C
om
pan
y. C
on
fid
enti
al a
nd
pro
pri
etar
y.
42
0
5
10
15
20
25
30
35
40
45
50
Q12010
Q22010
Q32010
Q42010
Q12011
Q22011
Q32011
Q42011
Q12012
Q22012
Q32012
Q42012
Q12013
Q22013
Q32013
Q42013
Jan-14
%
Volume
Value
E-BOOK SHARE OF US BOOK PURCHASES
Source: US Books & Consumers © Nielsen 2014 2014 data provisional and require caution

Co
pyr
igh
t ©
2012
Th
e N
iels
en C
om
pan
y. C
on
fid
enti
al a
nd
pro
pri
etar
y.
43
0
10
20
30
40
50
60
Q12010
Q22010
Q32010
Q42010
Q12011
Q22011
Q32011
Q42011
Q12012
Q22012
Q32012
Q42012
Q12013
Q22013
Q32013
Q42013
Jan-14
%
Adult fiction
Adult NF
Children's
E-BOOK SHARE OF US BOOK PURCHASES, WITHIN CATEGORY: VOLUME
Source: US Books & Consumers © Nielsen 2014 2014 data provisional and require caution

Co
pyr
igh
t ©
2013
Th
e N
iels
en C
om
pan
y. C
on
fid
enti
al a
nd
pro
pri
etar
y.
44
E-BOOK SHARE OF US BOOK PURCHASES WITHIN GENRE: VOLUME, Y/E JAN 2014
Source: US Books & Consumers © Nielsen 2014
35%+
Crime
SF
Romance
25-34%
Thriller
General fiction
Historical fiction
Fantasy
Horror
Action/adventure
Christian fiction
Children’s fiction
True crime
10-24%
Biography
Fitness/health
Religion/MBS
Sport
Humour
IT/business
YA fiction
Literary fiction
History
Travel
Cookery
Self help
Art
Children’s NF
<10%
Graphic novel
Bibles
Science/nature
Home/garden
Picture books
Early learning

Co
pyr
igh
t ©
2012
Th
e N
iels
en C
om
pan
y. C
on
fid
enti
al a
nd
pro
pri
etar
y.
45
44%
70%
5%
26%
0%
10%
20%
30%
40%
50%
60%
70%
80%
Q12010
Q22010
Q32010
Q42010
Q12011
Q22011
Q32011
Q42011
Q12012
Q22012
Q32012
Q42012
Q12013
Q22013
Q32013
Q42013
Jan-14
Smartphone
Tablet
eReader
HOUSEHOLD OWNERSHIP AMONG US BOOK BUYERS
Source: US Books & Consumers © Nielsen 2014

Co
pyr
igh
t ©
2012
Th
e N
iels
en C
om
pan
y. C
on
fid
enti
al a
nd
pro
pri
etar
y.
46
68
35
42
4 7
0
10
20
30
40
50
60
70
80
90
Q12010
Q22010
Q32010
Q42010
Q12011
Q22011
Q32011
Q42011
Q12012
Q22012
Q32012
Q42012
Q12013
Q22013
Q32013
Q42013
Jan-14
% eReader
Tablet
SmartPhone
DEVICE SHARE OF US E-BOOK PURCHASES
Source: US Books & Consumers © Nielsen 2014

E-BOOKS IN THE UK

Co
pyr
igh
t ©
2012
Th
e N
iels
en C
om
pan
y. C
on
fid
enti
al a
nd
pro
pri
etar
y.
48
Cumulative Volume sales of e-books among the UK population aged 13-79
20,000,000
40,000,000
60,000,000
80,000,000
100,000,000
120,000,000
140,000,000
23
-Jan
-11
20
-Fe
b-1
1
20
-Mar
-11
17
-Ap
r-1
1
15
-May
-11
12
-Ju
n-1
1
10
-Ju
l-1
1
07
-Au
g-1
1
04
-Se
p-1
1
02
-Oct
-11
30
-Oct
-11
27
-No
v-1
1
25
-De
c-1
1
22
-Jan
-12
19
-Fe
b-1
2
18
-Mar
-12
15
-Ap
r-1
2
13
-May
-12
10
-Ju
n-1
2
08
-Ju
l-1
2
05
-Au
g-1
2
02
-Se
p-1
2
30
-Se
p-1
2
28
-Oct
-12
25
-No
v-1
2
23
-De
c-1
2
20
-Jan
-13
17
-Fe
b-1
3
17
-Mar
-13
14
-Ap
r-1
3
13
-May
-13
09
-Ju
n-1
3
07
-Ju
l-1
3
04
-Au
g-1
3
01
-Se
p-1
3
29
-Se
p-1
3
27
-Oct
-13
24
-No
v-1
3
22
-De
c-1
3
19
-Jan
-14
125.1m
Fiction Non-fiction Children's
GROWTH AND COMPOSITION OF UK E-BOOK MARKET, JAN 2011- JAN 2014
Nielsen Insight into the E-book Consumer Market

Co
pyr
igh
t ©
2012
Th
e N
iels
en C
om
pan
y. C
on
fid
enti
al a
nd
pro
pri
etar
y.
50
0.0%
5.0%
10.0%
15.0%
20.0%
25.0%
23
-Jan
-11
20
-Fe
b-1
1
20
-Mar
-11
17
-Ap
r-1
1
15
-May
-11
12
-Ju
n-1
1
10
-Ju
l-1
1
07
-Au
g-1
1
04
-Se
p-1
1
02
-Oct
-11
30
-Oct
-11
27
-No
v-1
1
25
-De
c-1
1
22
-Jan
-12
19
-Fe
b-1
2
18
-Mar
-12
15
-Ap
r-1
2
13
-May
-12
10
-Ju
n-1
2
08
-Ju
l-1
2
05
-Au
g-1
2
02
-Se
p-1
2
30
-Se
p-1
2
28
-Oct
-12
25
-No
v-1
2
23
-De
c-1
2
20
-Jan
-13
17
-Fe
b-1
3
17
-Mar
-13
14
-Ap
r-1
3
13
-May
-13
09
-Ju
n-1
3
07
-Ju
l-1
3
04
-Au
g-1
3
01
-Se
p-1
3
29
-Se
p-1
3
27
-Oct
-13
24
-No
v-1
3
22
-De
c-1
3
19
-Jan
-14
UK MARKET PENETRATION OF E-BOOKS Percentage of the UK population aged 13-79 that have bought an e-book: Jan 2011-2014
22%
Nielsen Insight into the E-book Consumer Market: May 2014

Co
pyr
igh
t ©
2012
Th
e N
iels
en C
om
pan
y. C
on
fid
enti
al a
nd
pro
pri
etar
y.
51
Numbers of individuals aged 13-79 entering the e-book market: period-on-period growth in population number terms
0
100,000
200,000
300,000
400,000
500,000
600,000
700,000
Jan
11
Feb
11
Mar
11
Ap
r 1
1
May
11
Jun
11
Jul 1
1
Au
g 1
1
Sep
11
Oct
11
(1)
Oct
11
(2)
No
v 1
1
Dec
11
Jan
12
Feb
12
Mar
12
Ap
r 1
2
May
12
Jun
12
Jul 1
2
Au
g 1
2
Sep
12
(1
)
Sep
12
(2
)
Oct
12
No
v 1
2
Dec
12
Jan
13
Feb
13
Mar
13
Ap
r 1
3
May
13
Jun
13
Jul 1
3
Au
g 1
3
Sep
13
(1
)
Sep
13
(2
)
Oct
13
No
v 1
3
Dec
13
Jan
14
Feb
-14
Mar
-14
Ap
r-1
4
May
-14
Jun
-14
Jul-
14
Au
g-1
4
Sep
14
(1
)
Sep
14
(2
)
Oct
-14
No
v-1
4
Dec
-14
Jan
-15
New buyers projected to fall below 100k throughout 2014
Nielsen Insight into the E-book Consumer Market: May 2014
Forecasted E-book Adoption
GROWTH IN E-BOOK BUYERS SLOWING

Co
pyr
igh
t ©
2012
Th
e N
iels
en C
om
pan
y. C
on
fid
enti
al a
nd
pro
pri
etar
y.
52
0
5
10
15
20
25
30
35
40
45
50
Q1 2012 Q2 2012 Q3 2012 Q4 2012 Q1 2013 Q2 2013 Q3 2013 Q4 2013 Jan-14
%
Volume
Value
E-BOOK SHARE OF UK BOOK PURCHASES
Source: UK Books & Consumers © Nielsen 2014 2014 data provisional and require caution

Co
pyr
igh
t ©
2012
Th
e N
iels
en C
om
pan
y. C
on
fid
enti
al a
nd
pro
pri
etar
y.
53
0
10
20
30
40
50
60
Q1 2012 Q2 2012 Q3 2012 Q4 2012 Q1 2013 Q2 2013 Q3 2013 Q4 2013 Jan-14
%
Adult fiction
Adult NF
Children's
E-BOOK SHARE OF UK BOOK PURCHASES, WITHIN CATEGORY: VOLUME
Source: UK Books & Consumers © Nielsen 2014 2014 data provisional and require caution

Co
pyr
igh
t ©
2013
Th
e N
iels
en C
om
pan
y. C
on
fid
enti
al a
nd
pro
pri
etar
y.
54
E-BOOK SHARE OF UK BOOK PURCHASES WITHIN GENRE: VOLUME, Y/E JAN 2014
Source: UK Books & Consumers © Nielsen 2014
45%+
Crime
Fantasy
Romance
25-44%
Thriller
General fiction
Historical fiction
Erotic fiction
Horror
Classic fiction
Sci fi
True crime
Self help
10-24%
Biography
Fitness/diet
Religion/MBS
Sport
Humour
IT
YA fiction
<10%
Graphic novel
Food & drink
Science/nature
Travel
Art
Business
Home/garden
Picture books
Children’s NF
Early learning

Co
pyr
igh
t ©
2012
Th
e N
iels
en C
om
pan
y. C
on
fid
enti
al a
nd
pro
pri
etar
y.
55
46
61
14
51
21 24
0
10
20
30
40
50
60
70
80
90
100
%
Smartphone
Tablet
eReader
HOUSEHOLD OWNERSHIP AMONG UK BOOK BUYERS
Source: UK Books & Consumers © Nielsen 2014

Co
pyr
igh
t ©
2012
Th
e N
iels
en C
om
pan
y. C
on
fid
enti
al a
nd
pro
pri
etar
y.
56
84
47
40
5 8
0
10
20
30
40
50
60
70
80
90
Q1 2012 Q2 2012 Q3 2012 Q4 2012 Q1 2013 Q2 2013 Q3 2013 Q4 2013 Jan-14
% eReader
Tablet
SmartPhone
DEVICE SHARE OF UK E-BOOK PURCHASES
Source: UK Books & Consumers © Nielsen 2014

THOUGHTS ABOUT THE FUTURE

Co
pyr
igh
t ©
2012
Th
e N
iels
en C
om
pan
y. C
on
fid
enti
al a
nd
pro
pri
etar
y.
58
CHANGING FACE OF THE AMERICAN CONSUMER
With important implications on the future …
URBANIZATION & INDUSTRIALIZATION
DECLINING BIRTH RATES
AGING POPULATION
Uneven Population Growth
Older Consumers With New Needs
Changes in Per Household Spending
Immigration & Growth in
Ethnic Families
Declining % of HHs with Children

Co
pyr
igh
t ©
2013
Th
e N
iels
en C
om
pan
y. C
on
fid
enti
al a
nd
pro
pri
etar
y.
59
KEY ATTRIBUTES OF TWO SPENDING POWERHOUSES
Hardwired Untethered
By Appointment Always On
Listeners Sharers
Physical Virtual
BOOMERS MILLENNIALS

Co
pyr
igh
t ©
2013
Th
e N
iels
en C
om
pan
y. C
on
fid
enti
al a
nd
pro
pri
etar
y.
61
DO YOU KNOW YOUR CATEGORY’S ENTHUSIAST?
Source: FreshFacts® Shopper Insights powered by Spire, 52 weeks ending 8/10/13
1% of muffin buyers
23% of muffin sales
account for

Co
pyr
igh
t ©
2013
Th
e N
iels
en C
om
pan
y. C
on
fid
enti
al a
nd
pro
pri
etar
y.
62
DO YOU KNOW YOUR BOOK ENTHUSIAST?
Source: FreshFacts® Shopper Insights powered by Spire, 52 weeks ending 8/10/13
1% of book buyers
15% of book sales
account for

Co
pyr
igh
t ©
2013
Th
e N
iels
en C
om
pan
y. C
on
fid
enti
al a
nd
pro
pri
etar
y.
63
THE WORLD IS YOUR OYSTER
Source: BBC
• 2.0bn people learning English
• 600m as first language

Co
pyr
igh
t ©
2013
Th
e N
iels
en C
om
pan
y. C
on
fid
enti
al a
nd
pro
pri
etar
y.
64
Our brains process 11,000,000 bits of sensory information every second.
But our conscious minds can only handle about 40 bits per second.
That’s a selection ratio of 0.000004%.
What happens to the other 10,999,960 bits of information?
Consumer brains process them subconsciously.
The majority of processing is subconscious

Co
pyr
igh
t ©
2013
Th
e N
iels
en C
om
pan
y. C
on
fid
enti
al a
nd
pro
pri
etar
y.
65
TWO THINGS WE HAVE LEARNED FROM NEUROSCIENCE
Milliseconds matter
We make decisions differently than we thought

Co
pyr
igh
t ©
2012
Th
e N
iels
en C
om
pan
y. C
on
fid
enti
al a
nd
pro
pri
etar
y.
66
If this is true, our goal is to
persuade.
TRADITIONAL VIEW
THINK
ACT
FEEL
If this is true, our goal is to
engage emotion.
EMERGING VIEW (FROM COGNITIVE SCIENCE)
FEEL
ACT
THINK Rationalize Our
Decisions
EMOTIONS LEAD, REASON FOLLOWS

Co
pyr
igh
t ©
2013
Th
e N
iels
en C
om
pan
y. C
on
fid
enti
al a
nd
pro
pri
etar
y.
68
SUMMARY – OPTIMISTIC!!
• Global consumer confidence is patchy but improving
• English language markets are huge and digital makes them reachable
• Traditional book markets are flat – some in decline
• Emerging markets are growing fast
• ebooks will continue to grow – but pace will be wildly different in each market
• Consumer $ is moving from boomer to millennial – maximise boomer spend now!
• We will need to publish and sell books differently … as we compete for consumer time and $ …

Jonathan Nowell BookExpo America
28 May 2014
Booth1113


