Be the Best, Be the One 2017 (BBBO2017)
108
Transcript of Be the Best, Be the One 2017 (BBBO2017)

1 Sumitomo Corporation Fact Book 2018
Financial Section
1. Course of Operations and Operating Results
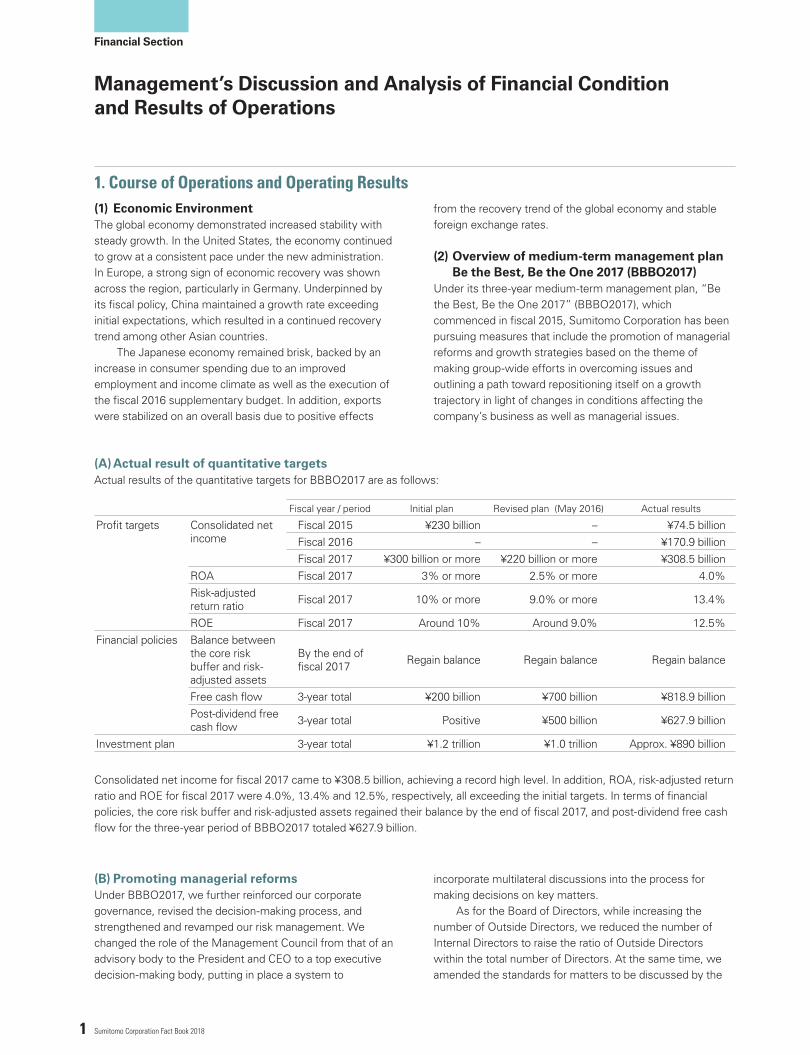
(A) Actual result of quantitative targets
(B) Promoting managerial reforms
Management’s Discussion and Analysis of Financial Conditionand Results of Operations
The global economy demonstrated increased stability with steady growth. In the United States, the economy continued to grow at a consistent pace under the new administration. In Europe, a strong sign of economic recovery was shown across the region, particularly in Germany. Underpinned by its fiscal policy, China maintained a growth rate exceeding initial expectations, which resulted in a continued recovery trend among other Asian countries. The Japanese economy remained brisk, backed by an increase in consumer spending due to an improved employment and income climate as well as the execution of the fiscal 2016 supplementary budget. In addition, exports were stabilized on an overall basis due to positive effects
Under BBBO2017, we further reinforced our corporate governance, revised the decision-making process, and strengthened and revamped our risk management. We changed the role of the Management Council from that of an advisory body to the President and CEO to a top executive decision-making body, putting in place a system to
incorporate multilateral discussions into the process for making decisions on key matters. As for the Board of Directors, while increasing the number of Outside Directors, we reduced the number of Internal Directors to raise the ratio of Outside Directors within the total number of Directors. At the same time, we amended the standards for matters to be discussed by the
Fiscal year / period Initial plan Revised plan (May 2016) Actual results
Profit targets Consolidated net income
Fiscal 2015 ¥230 billion – ¥74.5 billionFiscal 2016 – – ¥170.9 billionFiscal 2017 ¥300 billion or more ¥220 billion or more ¥308.5 billion
ROA Fiscal 2017 3% or more 2.5% or more 4.0%Risk-adjusted return ratio Fiscal 2017 10% or more 9.0% or more 13.4%
ROE Fiscal 2017 Around 10% Around 9.0% 12.5%Financial policies Balance between
the core risk buffer and risk-adjusted assets
By the end of fiscal 2017 Regain balance Regain balance Regain balance
Free cash flow 3-year total ¥200 billion ¥700 billion ¥818.9 billionPost-dividend free cash flow 3-year total Positive ¥500 billion ¥627.9 billion
Investment plan 3-year total ¥1.2 trillion ¥1.0 trillion Approx. ¥890 billion
Actual results of the quantitative targets for BBBO2017 are as follows:
Consolidated net income for fiscal 2017 came to ¥308.5 billion, achieving a record high level. In addition, ROA, risk-adjusted return ratio and ROE for fiscal 2017 were 4.0%, 13.4% and 12.5%, respectively, all exceeding the initial targets. In terms of financial policies, the core risk buffer and risk-adjusted assets regained their balance by the end of fiscal 2017, and post-dividend free cash flow for the three-year period of BBBO2017 totaled ¥627.9 billion.
from the recovery trend of the global economy and stable foreign exchange rates.
Under its three-year medium-term management plan, “Be the Best, Be the One 2017” (BBBO2017), which commenced in fiscal 2015, Sumitomo Corporation has been pursuing measures that include the promotion of managerial reforms and growth strategies based on the theme of making group-wide efforts in overcoming issues and outlining a path toward repositioning itself on a growth trajectory in light of changes in conditions affecting the company’s business as well as managerial issues.
(1) Economic Environment
(2) Overview of medium-term management plan Be the Best, Be the One 2017 (BBBO2017)

2Sumitomo Corporation Fact Book 2018
(C) Promoting growth strategies
Metal Products Business Unit
Actual investment results during the three-year period of BBBO2017 are as follows:
We made investment, in particular, focusing on three strong areas of business: Automobiles and Transportation System-related, Lifestyle and Information Services, and Social Infrastructure. Also, in the energy-related field, the IoT and AI-related field, and other fields with high growth potential, we undertook cross-organizational collaboration to participate in these businesses as company-wide projects.
Investment
Major Investments3-year Plans(15/4-18/3)
Results(15/4-18/3)
Automobile & Transportation System-related 380.0 250.0
Construction equipment rental business in the U.S., Aircraft engine leasing business, Automotive forged parts manufacturing business in Europe
Lifestyle & Information service 190.0 210.0Real estate business in Japan and over seas, Capital investments in ICT businesses in Japan, Additional investment in telecommunications business in Myanmar
Infrastructure 140.0 150.0Off-shore wind power generation business in Europe, Water concession business in Brazil, Biomass power generation business in Japan
Food & Agriculture 100.0 110.0 Produce marketer and distributor in Ireland, Agricultural input & service business in Brazil
Mineral Resources & Energy related (excl. upstream interests) 50.0 30.0 Manganese alloy manufacturing and sales business in
MalaysiaUpstream Interests 140.0 140.0 Nickel project in Madagascar
Total 1000.0 890.0
Board of Directors and increased the matters to be reported to the Board of Directors including the progress of the management plan and the status of activities by key committees to strengthen the Board’s supervisory function over the execution of operations. Meanwhile, to make the processes for deciding on the nomination and remuneration of Directors more transparent and objective, we established the Nomination and Remuneration Advisory Committee to serve as an advisory body to the Board of Directors. The Nomination and
In the steel sheet segment, the business unit focused on enhancing the value and strengthening the competitiveness of the steel service center business. As a part of such efforts, Sumitomo Corporation concluded an agreement for a strategic business alliance by integrating its steel service center business conducted in the Chugoku region by Summit Steel Co., Ltd. into Hiroshima Steel Center Co., Ltd., a subsidiary of Marubeni-Itochu Steel Inc. In the tubular product segment, Sumitomo Corporation acquired shares of
Remuneration Advisory Committee is chaired by an Outside Director and Outside Directors comprise the majority of its members. With regard to the risk management, we are establishing the Business Unit Investment Committee in addition to the Company-wide level Investment Committee, to conduct discussions from a variety of angles at both the initial assessment stage and the execution stage of an investment project. We also revised our hurdle rate for investments and our post-investment monitoring system.
a U.S.-based oil country tubular goods (OCTG) distributor with nationwide locations, a sales and logistics network and a broad customer base with the aim of further enhancing the value chain and expanding services and functions in the tubular product business in North America. In the line pipe business, Sumitomo Corporation acquired certain stake in a startup Dutch manufacturer of thermoplastic composite pipes (TCP) using glass fiber, carbon fiber and resin to enhance the value it provides and expand its customer base by introducing innovative technologies.
(3) Activities of Business Units

3 Sumitomo Corporation Fact Book 2018
Financial Section
In the ships, aerospace and transportation systems segment, Sumitomo Corporation agreed on the reorganization of Sumitomo Mitsui Finance and Leasing Company, Ltd., a joint venture between Sumitomo Corporation and Sumitomo Mitsui Financial Group, Inc., by adjusting the ownership ratios to 50% each. Under the new structure, the unit will strive to further enhance its competitiveness and achieve sustainable growth of its comprehensive leasing business, aircraft leasing business and auto leasing business. In the automobile segment, the business unit promoted investment and business development in new mobility businesses including electric vehicles (EV), autonomous driving and car sharing, among others, while strengthening its existing broad value chain. In the construction equipment segment, the business unit focused on meeting a variety of needs of the customers of both the construction equipment business and the rental business across the globe. Also, Sumitomo Corporation engaged in business and transactions that will contribute to the economic development of emerging markets, such as the conclusion of an export sales agreement for road construction machinery with the Uganda Ministry of Works & Transport.
Through the development and expansion of infrastructure that meet the needs of each country, society and industry, the business unit has been promoting initiatives that contribute to the creation of a society where people can live in harmony with the global environment and to the business unit focused on developing environmentally friendly infrastructure as a key initiative and promoted the renewable energy generation business. In the United Kingdom, progress was made in the construction of two offshore wind farms, while in Japan, the operation commenced at the biomass power generation plant in Handa City, Aichi Prefecture and the solar power generation facilities in Minamisoma City, Fukushima Prefecture. Meanwhile, in emerging economies, the business unit steadily executed a wide range of initiatives in order to respond to the increasing infrastructure demand. Specifically, Sumitomo Corporation made a capital investment in Brazil’s largest privately owned water and sewage company while embarking on the construction of a combined-cycle gas turbine power plant in Tunisia and an ultra-super critical coal-fired thermal power plant in Bangladesh*. In addition, the unit commenced sales of industrial parks in Chennai City, India.
As a business unit providing products and services close to consumers, the Media, ICT, Lifestyle Related Goods & Services Business Unit focused on the reinforcement of Sumitomo Corporation’s earning base by ensuring the continued growth of Jupiter Telecommunications Co., Ltd. (cable television), SCSK Corporation (IT services), Jupiter Shop Channel Co., Ltd. (TV Shopping channel), SUMMIT, INC. (supermarket), TOMOD’S INC. (drugstore) and real estate business and so on, with the aim of realizing comfortable and excitingly enriching lifestyles . Specifically, in the real estate business, in addition to the opening of the office/retail facility GINZA SIX in the Ginza 6-chome district, the business unit focused on overseas businesses such as the establishment of the fund that targets properties located in the United States and the housing business in Asia. In addition, the business unit entered into new business areas where future growths are anticipated. For example, the business unit participated in the digital media-related business and the healthcare business as well as making capital investment into a Canadian wood pellet manufacturer.
The Mineral Resources, Energy, Chemical & Electronics Business Unit promoted initiatives that contribute to the sustainable and prosperous growth of industry and communities across the world by providing a stable supply of mineral resources, energy, chemical and electronics in an environmentally conscious manner. In the areas of resources and energy, the business unit continued to focus on the stable operation and cost reduction of existing projects. In addition, Sumitomo Corporation jointly with three other Japanese companies agreed to participate in the FPSO* owning and chartering business for oil and gas fields located offshore of Ghana. Through the project, Sumitomo Corporation will endeavor to expand its oil and gas business, while contributing to resolving the country’s issue of energy resource shortage. In the life sciences segment, Sumitomo Corporation participated in the generic pharmaceuticals business in the United States, which constitutes the world’s largest pharmaceuticals market. Through this business, Sumitomo Corporation will seek to contribute to promoting physical and mental human health by widely supplying high-quality generic medications in the United States.
* This high-efficiency power plant equipment generates high-pressure steam and temperatures that realize improved control of fuel consumption and CO2 emissions, and contributes to reducing environmental impact.
* FPSO (floating production, storage and offloading) refers to facilities used for offshore crude oil and gas production, that is, for storage of the produced crude oil in a tank and direct offloading onto a tanker.
Environment & Infrastructure Business Unit
Media, ICT, Lifestyle Related Goods & Services Business Unit
Mineral Resources, Energy, Chemical & Electronics Business Unit
Transportation & Construction Systems Business Unit

4Sumitomo Corporation Fact Book 2018
Revenues for the fiscal year ended March 31, 2018 amounted to ¥4,827.3 billion, representing an increase of ¥830.3 billion from the previous fiscal year, owing mainly to robust mineral resources prices and earnings improvement in tubular products business in North America. Gross profit totaled ¥956.5 billion increased by ¥113.8 billion, owing to the factors such as the increase in earnings of San Cristobal silver-zinc-lead mining project in Bolivia and earnings improvement in tubular products business in North America. Selling, general and administrative expenses increased by ¥37.9 billion to ¥731.6 billion. Other gain (loss) increased by ¥29.6 billion to ¥9.4 billion mainly due to tax provisions recorded in San Cristobal silver-zinc-lead mining project in Bolivia in the previous fiscal year. Gain (loss) on securities and other investments increased by ¥14.9 billion to ¥27.8 billion mainly due to the one-off profits from asset replacement. Share of profit (loss) of investments accounted for using the equity method increased by ¥66.3 billion to ¥149.7 billion, owing to the factors such as higher mineral resources prices, solid performances by leasing business and the aluminum smelting business in Malaysia, and absence of
impairment loss recorded in Copper and molybdenum mining business in Chile in the previous fiscal year, although they were offset by the impairment loss recorded in Indonesian commercial bank PT. Bank Tabungan Pensiunan Nasional Tbk in this fiscal year. As a result, Profit for the year attributable to owners of the parent totaled ¥308.5 billion, representing an increase of ¥137.6 billion from the previous fiscal year. Please refer to “2. Analysis of Financial Condition and Results of Operations” for operating results by business segment.
Revenues for the fiscal year ended March 31, 2018 significantly increased from the previous fiscal year, owing mainly to robust mineral resources prices and earnings improvement in tubular products business in North America, etc. Please refer to “(4) Operating results” and “Notes to the Consolidated Financial Statements 4. Segment Information” for further information.
2. Analysis of Financial Condition and Results of Operations
We are an integrated trading company (sogo shosha) engaged in a wide range of business activities on a global basis. Our business foundation consists of trust, global relations with over 100,000 business partners around the world, a global network with offices and subsidiaries worldwide, intellectual capital and advanced functions in business development, logistic solutions, financial services, IT solutions, risk management and intelligence gathering and analysis. Through integration of these elements, we provide a diverse array of value to our customers. Based on this business foundation and these functions, we engage in general trading of a wide range of goods and commodities and in various business activities. We act as both a principal and an agent in these trading transactions. We also provide a range of services for a variety of industries, such as: financing for customers and suppliers; planning, coordination and operation of urban and industrial infrastructure projects; consulting in areas such as system integration and technology development; and transportation and logistics. In addition, we engage in other diverse business activities, including investing in a variety of industries ranging from photovoltaic power generation to communications;
developing natural resources; manufacturing and processing products such as steel products and textiles; developing and managing real estate; and operating retail stores.
We conduct our business through five industry-based business segments and overseas regional operations. Our industry-based business segments are:
Metal Products Transportation & Construction Systems Environment & Infrastructure Media, ICT, Lifestyle Related Goods & Services Mineral Resources, Energy, Chemical & Electronics
Each business segment operates with a degree of autonomy in pursuing its strategic goals, managing operations, and ensuring accountability. Each business unit also has its own Planning & Coordination Departments to strengthen the function of strategy design and its implementation support. In today’s increasingly global business environment, our worldwide network of offices, subsidiaries and associated companies, and our global relationships with customers, suppliers and business partners have allowed us to conduct and expand our
(1) Introduction
(4) Operating results
(5) Purchases, Sales Contracts and Trading Transactions

5 Sumitomo Corporation Fact Book 2018
Financial Section
operations around the world. Our five industry-based business units and overseas operations regularly collaborate with one another to leverage their combined strengths to conduct their respective businesses more effectively as well as to meet our corporate targets and goals. We have designed our infrastructure to centralize and consolidate information from all of our business units and overseas operations to facilitate proper integration and risk control. In April 2018, in order to aggressively pursue our growth strategies under “Medium-Term Management Plan 2020” in light of changes in the megatrends and surrounding business environment, we reorganized our five business segments into six business segment based on a strategic review of our business segments and fields of business. While expeditiously responding to changes in the business environment, each business segment will strive to accelerate collaboration with other business segments and further reinforce existing earnings pillars. Our industry-based business segments after reorganization are:
Metal Products Transportation & Construction Systems Infrastructure Media & Digital* Living Related & Real Estate Mineral Resources, Energy, Chemical & Electronics
Promotion of growth strategies
Reinforcement of management bases
Note: As used in this “Management’s Discussion and Analysis of Financial Condition and Results of Operations,” “the Company” is used to refer to Sumitomo Corporation, and “the Companies” is used to refer to the Company and its subsidiaries, unless otherwise indicated.
The following discussion of our medium-term targets contains forward-looking statements and measures that have been calculated based on a number of judgments, estimates, and assumptions. Unless otherwise stated, the forward-looking statements reflect management’s current assumptions and expectations of future events as of March 31, 2018. Accordingly, they are inherently susceptible to uncertainties and changes in circumstances and are not guarantees of future performance.
The Company has formulated the “Medium-Term Management Plan 2020,” which will cover the three years from fiscal 2018 to fiscal 2020. Under the plan, we will take on an unceasing challenge to create new value by focusing on the promotion of growth strategies, while continuing to reinforce our management bases in a business environment where all industries have become increasingly borderless and integrated on the back of the rapid development of technologies such as IoT and AI, which has resulted in significant changes in industrial structures.
(A) Medium-Term Management Plan 2020
(2) Our Medium-Term Targets
Medium-Term Management Plan 2020-Unceasing Challenge for New Value Creation-
Increasing the value of existingbusinesses
Leveraging cross-businessplatform
Creating the next-generationbusinesses
Expanding business support function
Enhancement of financial soundness
Enhancement of governance Enhancement of human resources strategy
* Changes to the names of business units and divisions took effect on October 1, 2018.
6Sumitomo Corporation Fact Book 2018
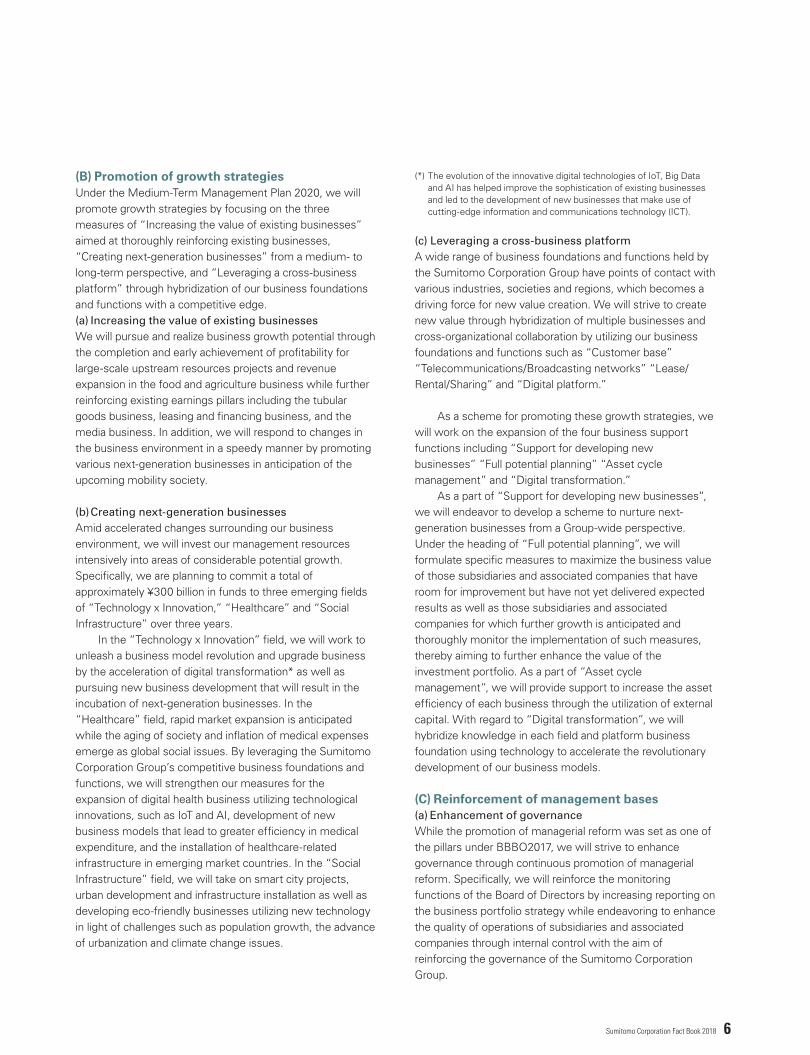
(B) Promotion of growth strategiesUnder the Medium-Term Management Plan 2020, we will promote growth strategies by focusing on the three measures of “Increasing the value of existing businesses” aimed at thoroughly reinforcing existing businesses, “Creating next-generation businesses” from a medium- to long-term perspective, and “Leveraging a cross-business platform” through hybridization of our business foundations and functions with a competitive edge.(a) Increasing the value of existing businessesWe will pursue and realize business growth potential through the completion and early achievement of profitability for large-scale upstream resources projects and revenue expansion in the food and agriculture business while further reinforcing existing earnings pillars including the tubular goods business, leasing and financing business, and the media business. In addition, we will respond to changes in the business environment in a speedy manner by promoting various next-generation businesses in anticipation of the upcoming mobility society.
(b) Creating next-generation businessesAmid accelerated changes surrounding our business environment, we will invest our management resources intensively into areas of considerable potential growth. Specifically, we are planning to commit a total of approximately ¥300 billion in funds to three emerging fields of “Technology x Innovation,” “Healthcare” and “Social Infrastructure” over three years. In the “Technology x Innovation” field, we will work to unleash a business model revolution and upgrade business by the acceleration of digital transformation* as well as pursuing new business development that will result in the incubation of next-generation businesses. In the “Healthcare” field, rapid market expansion is anticipated while the aging of society and inflation of medical expenses emerge as global social issues. By leveraging the Sumitomo Corporation Group’s competitive business foundations and functions, we will strengthen our measures for the expansion of digital health business utilizing technological innovations, such as IoT and AI, development of new business models that lead to greater efficiency in medical expenditure, and the installation of healthcare-related infrastructure in emerging market countries. In the “Social Infrastructure” field, we will take on smart city projects, urban development and infrastructure installation as well as developing eco-friendly businesses utilizing new technology in light of challenges such as population growth, the advance of urbanization and climate change issues.
(c) Leveraging a cross-business platformA wide range of business foundations and functions held by the Sumitomo Corporation Group have points of contact with various industries, societies and regions, which becomes a driving force for new value creation. We will strive to create new value through hybridization of multiple businesses and cross-organizational collaboration by utilizing our business foundations and functions such as “Customer base” “Telecommunications/Broadcasting networks” “Lease/Rental/Sharing” and “Digital platform.”
As a scheme for promoting these growth strategies, we will work on the expansion of the four business support functions including “Support for developing new businesses” “Full potential planning” “Asset cycle management” and “Digital transformation.” As a part of “Support for developing new businesses”, we will endeavor to develop a scheme to nurture next-generation businesses from a Group-wide perspective. Under the heading of “Full potential planning”, we will formulate specific measures to maximize the business value of those subsidiaries and associated companies that have room for improvement but have not yet delivered expected results as well as those subsidiaries and associated companies for which further growth is anticipated and thoroughly monitor the implementation of such measures, thereby aiming to further enhance the value of the investment portfolio. As a part of “Asset cycle management”, we will provide support to increase the asset efficiency of each business through the utilization of external capital. With regard to “Digital transformation”, we will hybridize knowledge in each field and platform business foundation using technology to accelerate the revolutionary development of our business models.
(a) Enhancement of governanceWhile the promotion of managerial reform was set as one of the pillars under BBBO2017, we will strive to enhance governance through continuous promotion of managerial reform. Specifically, we will reinforce the monitoring functions of the Board of Directors by increasing reporting on the business portfolio strategy while endeavoring to enhance the quality of operations of subsidiaries and associated companies through internal control with the aim of reinforcing the governance of the Sumitomo Corporation Group.
(C) Reinforcement of management bases
(*) The evolution of the innovative digital technologies of IoT, Big Data and AI has helped improve the sophistication of existing businesses and led to the development of new businesses that make use of cutting-edge information and communications technology (ICT).

7 Sumitomo Corporation Fact Book 2018
Financial Section
(b) Enhancement of human resources strategyBased on the basic concept of “Diversity & Inclusion—Making diverse strengths a source of competitiveness” we will work on the enhancement of our human resources strategy. In implementing various measures, we will focus on acknowledging and respecting the individuality and diversity of Sumitomo Corporation Group employees while encouraging individuals to rise to the challenge, developing their strengths, and making good use of those strengths. For example, we will promote the reform of work practices in order to support a wide range of working styles. We will also develop a system to put the right person in the right place at the right time, on a global consolidation basis.
(c) Enhancement of financial soundnessWe will expand our cash flow earning power, proactively recover funds by continuously pursuing the regeneration of businesses, steadily make investment necessary for future growth by using recovered cash as funds, and continuously reduce interest-bearing liabilities. In addition, we will continue to maintain the balance between core risk buffer and risk-adjusted assets. The total cash allocation for 3 years is as follows. Besides enhanced cash generating capabilities, we expect
cash inflow of ¥1,800 billion through the promotion of proactive asset replacement. Using this cash inflow, we plan to allocate ¥1,300 billion to investments and loans and ¥300 billion to a return as dividends. Furthermore, we aim to further improve our financial soundness by securing ¥200 billion or more as total free cash flow after dividends for 3 years and using it for the repayment of interest-bearing liabilities.
(*) Basic Profit cash flow = Basic profit – Share of profit (loss) of investments accounted for using the equity method + Dividend from investments accounted for using the equity method
Basic Profit = (Gross profit + Selling, general and administrative expenses (excluding provision for doubtful receivables) + Interest expense, net of interest income + Dividends) × (1-Tax rate) + Share of profit (loss) of investments accounted for using the equity method.
(D) Quantitative targetsWe plan to post profit attributable to owners of the parent of ¥320.0 billion and basic profit of ¥340.0 billion for FY2018. For the mineral resource business, although we do not anticipate large changes in the mineral resources prices, we expect a decrease in profit due to the temporary profit in the previous fiscal year. For the tubular products business, we expect improvement in profit due to an increase in demand from market recovery. For non-mineral resources businesses, we expect major businesses and operating companies of each division will remain steady, mainly driven by the power EPC project and the real estate business. ROA and ROE during the “Medium-Term Management Plan 2020” are expected to be 4% or higher and 10% or higher, respectively.
Projection of cash allocation during "Medium-Term Management Plan 2020"(three years)
Approx.1,800
Approx.1,800
Total
Cash In Cash Out
Basic profitcash flow
(*)
(Billions of yen)
Dividends(Approx. ¥300)
Repayment ofinterest-bearing
liabilities(Approx. ¥200)
Investmentand Loan
(Approx. ¥1,300)Depreciation
andamortization
Assetreplacement and others
(Approx. ¥600)
Cash flowearnings.Approx.¥1,200

8Sumitomo Corporation Fact Book 2018
(*) Excluding the impacts of impairment loss
(E) Dividend policyWe aim to increase dividends by achieving mid-long term earnings growth while adhering to our fundamental policy of paying shareholders a stable dividend over the long term. For “Medium-Term Management Plan 2020,” we will decide the dividend amount in view of the situations regarding basic profit and cash flow, with a consolidated payout ratio of 30%
as a guideline. The annual dividend forecast for FY 2018 is projected to be ¥75 per share as we forecast our profit for FY2018 is ¥320 billion. We sincerely ask for the further support and encouragement of our shareholders as we take on future challenges.
Targeting steady growth inprofits by implementinggrowth strategies
Targeting steady growth inprofits by implementinggrowth strategies
Efficiency indicators
ROA 4% or higher
ROE 10% or higher
FY2020
(Billions of yen)FY2017Results
Profit attributable toowners of the parent 308.5
Basic profit(*) 323.7
Efficiency indicators
ROA 4% or higher
ROE 10% or higher
Efficiency indicators
ROA 4% or higher
ROE 10% or higher
FY2015 FY2016 FY2017 FY2018
Basic profit(*)
Mineral resources businesses
Tubular products business
Non-mineral resources businesses
193.2
207.3 223.1 243.5
4.716.1
75.5
(4.7)
(9.5) (12.5)
226.7
323.7
FY2018Plan
320.0
340.0
340.0
FY2018Plan
320.0
340.0
340.0
65.0
10.0
265.0
3. Certain Line Items in Our Consolidated Statement of Comprehensive IncomeThe following is a description of certain line items in our Consolidated statement of comprehensive income: Revenues. We categorize our revenues into sales of tangible products and sales of services and others. We generate revenues from sales of tangible products:
in connection with our wholesale, retail, manufacturing and processing operations;
in connection with our real estate operations; and under long-term construction contracts, etc.
We generate revenues from the sale of services and others in connection with:
services related to customized software development; loans, finance leases and operating leases of commercial real estate, automobiles, vessels and aircrafts; and
other service arrangements, such as arranging finance and coordinating logistics for suppliers and buyers in connection with trading activities.
The Companies enter into transactions that include multiple-element software and non-software related revenue arrangements, which may include any combination of products, equipment, software, installation services and/or financing. A multiple-element arrangement is separated into multiple units of accounting if certain criteria are met. Gross Profit. Gross profit primarily consists of:
gross profit on transactions for which we act as a principal; and
fees and commissions received on transactions for which we act as an agent.
To the extent revenues are recorded on a gross basis, any expenses or commissions or other payments to third parties that are directly attributable to the sales are recorded as cost of sales. Gross profit reflects the net amount of gross revenues after cost of sales. As a part of sales of services and others, we recognize revenues from fees and commissions on a net basis. As a result, sales of services

9 Sumitomo Corporation Fact Book 2018
Financial Section
and others contribute a larger portion of our gross profit than they do of our revenues. For the year ended March 31, 2018, sales of services and others accounted for 10.2% of our total revenues, and the gross profit from sales of services and others accounted for 21.5% of our gross profit. Impairment Losses on Long-Lived Assets. At the end of each reporting period, the carrying amounts of non-financial assets, excluding inventories, deferred tax assets, and biological assets are assessed whether there is any indication of impairment. If any such indication exists, the recoverable amount of the non-financial asset is estimated. Regarding goodwill, intangible assets with indefinite useful lives and intangible assets not yet available for use, the recoverable amount is estimated at the same time every year. If the carrying amount of an asset or a cash-generating unit (“CGU”) exceeds the recoverable amount of it, an impairment loss is recognized in profit or loss. Impairment losses on long-lived assets include reversals of impairment losses when applicable. Gain (Loss) on Sale of Long-Lived Assets, Net. As a result of strategic and active replacement of our asset portfolio, we may, at times, recognize gains and losses on sales of some of our real estate assets. Dividends. Dividends reflect dividends declared by companies in which we hold interests other than our consolidated subsidiaries or equity-accounted investees. Gain (Loss) on Securities and Other Investments, Net. We maintain a significant level of investments in order to supplement our trading activities. Among those investments, financial assets measured at fair value through profit and loss (“FVTPL”) are initially measured at fair value. Subsequently, they are measured at fair value, and gains and losses arising from changes in fair value are recognized in profit or loss. Financial assets measured at amortized cost are initially measured at fair value (including directly attributable transaction costs). Subsequently, the carrying amount of the financial assets measured at amortized cost is calculated using the effective interest method, less impairment losses when necessary. We recognize gains and losses on sales of our financial assets measured at amortized cost and investments in our consolidated subsidiaries or equity-accounted investees when we elect to sell investment holdings.
Share of Profit (Loss) of Investments Accounted for Using the Equity Method. In connection with our investment strategy and the development of business opportunities, we may, from time to time, acquire or make investments in newly established or existing companies, enter into joint ventures with other entities or form strategic business alliances with industry participants, in each case in a variety of business segments. In general, we account for the profits or losses of any such investee under the equity method when the level of the investment is between 20% and 50% of the total voting equity of the investee. Financial Assets Measured at Fair Value Through Other Comprehensive Income. Financial assets measured at fair value through other comprehensive income (“FVTOCI”) are initially measured at their fair value (including directly attributable transaction costs). Subsequently, they are measured at fair value, and changes in fair value are recognized in other comprehensive income. Remeasurements of Defined Benefit Pension Plans. The Companies recognize remeasurements of the net defined benefit liability (asset) in other comprehensive income. Exchange Differences on Translating Foreign Operations. Assets and liabilities of foreign operations (including goodwill and fair value adjustments arising on the acquisition of foreign operations) are translated into Japanese yen using the spot exchange rate at the reporting date. Income and expenses are translated into Japanese yen at the average spot exchange rates for the period. Exchange differences arising from translation of financial statements of foreign operations are recognized in other comprehensive income. These differences are presented as “Exchange differences on translating foreign operations” in Other components of equity after the date of transition to IFRSs. Cash-Flow Hedges. When derivatives are designated as hedging instruments to hedge the exposure to variability in cash flows that are attributable to particular risks associated with recognized assets or liabilities or highly probable forecast transactions which could affect profit or loss, the effective portion of changes in the fair value of derivatives is recognized in other comprehensive income.
10Sumitomo Corporation Fact Book 2018
4. Critical Accounting PoliciesThe preparation of our consolidated financial statements in accordance with IFRSs requires management to make judgments, estimates and assumptions that affect the reported amounts of assets and liabilities and the disclosure of contingent assets and liabilities at the date of the financial statements and the reported amounts of revenues and expenses during the reporting period. On an ongoing basis, we evaluate our estimates, which are based on historical experience and various other assumptions that are believed to be reasonable under the circumstances. The results of these evaluations form the basis for making judgments about the carrying values of assets and liabilities and the reported amounts of revenues and expenses that are not readily apparent from other sources. Actual results may differ from those estimates under different assumptions. For a summary of our significant accounting policies, including the critical accounting policies discussed below, see Note 3 to our consolidated financial statements. The followings are the critical accounting policies that are important to our financial condition and results of operations and require significant management judgments and estimates:
Most of our revenues are the result (i) of the sale of tangible products in connection with wholesale, retail, manufacturing, and processing operations from which revenue is recognized based on the transfer of title, delivery or shipment, or the attainment of customer acceptance and (ii) from the provision of services and other sales, from which revenue is recognized based on the delivery of the services. Revenue recognition in these situations does not involve difficult, subjective or complex judgments or estimations. Recognition of revenue using the percentage-of-completion method for certain long-term construction contracts, etc., is based on the ratio of costs incurred to total estimated project costs and is dependent on our ability to estimate these costs reliably. The impact of revisions of profit estimates on fixed price contracts is recognized in the period in which the revisions are made; anticipated losses on fixed price contracts are charged to profit or loss when losses can be estimated; and provisions are recognized when a present obligation is identified and the amount can be estimated reliably.
Acting as an intermediary in executing transactions with third parties is a distinctive role of an integrated trading company (sogo shosha). In recognizing revenue from transactions, we must determine whether we are acting as a “principal” in the transaction, and should report revenue on a gross basis based on the sales amount of the transaction, or acting as an “agent” in the transaction, and should recognize net fees or commissions earned. The evaluation of the relevant factors in making this determination is subject to significant subjective judgments. In certain situations, others might make a different determination. Similarly, if our risks and obligations in a certain type of transaction change, the determination of whether revenue should be recognized on a net or gross basis for that type of transaction may also change. The amounts of gross profit and profit for the year attributable to owners of the parent are not affected by whether revenue is reported on a gross or net basis. Factors that indicate that we are acting as a principal, and thus should recognize revenue on a gross basis include:
the Companies have the primary responsibility for providing the goods or services to the customer or for fulfilling the orders;
the Companies have inventory risk before or after the customer order, during shipping or on return;
the Companies have latitude in establishing prices, either directly or indirectly; and
the Companies bear the customer’s credit risk for the amount receivable from the customer.
Factors that indicate that we are acting as an agent, and thus should recognize revenue on a net basis relative to the service offered include:
the consideration of services rendered (commission or fee) is fixed; and
the consideration is determined by multiplying the amount of goods and services provided to customers by a stated percentage.
Revenue Recognition
Revenue Presentation - Gross Versus Net

11 Sumitomo Corporation Fact Book 2018
Financial Section
We engage in a variety of businesses and carry financial assets measured at amortized cost. To ascertain whether these financial assets are impaired, we regularly assess them for objective evidence of impairment, which includes default or delinquency of the borrower. The fair value of these assets for which impairment losses are recognized is determined based on estimated future cash flows discounted at the effective interest rate.
We carry financial assets measured at fair value such as marketable securities, and other investments. The Companies have decided to classify equity instruments into FVTOCI or FVTPL. Financial assets classified as FVTOCI are held for objective, such as expansion of the medium and long-term revenue through maintenance and reinforcement of relationships with investees. Their changes in fair values are not included in the assessment of business performance. Financial assets classified as FVTPL are held to make profits from the changes in fair values and are included in the assessment of business performance. Fair values of these assets are based on market prices or determined by the discounted future cash flow method, profitability and net assets of the investees, and other valuation approaches.
We maintain significant non-current assets in the operation of our global business. We review non-current assets, such as real estate and intangibles subject to amortization, for impairment whenever events or changes in circumstances suggest that the carrying amount of such assets may not be recoverable. Determining whether impairment has occurred typically requires various estimates and assumptions, including determining whether cash flows are directly related
to the potentially impaired asset, the useful life over which cash flows will occur, their amount, and the asset’s residual value, if any. We also review goodwill and other intangible assets with indefinite useful lives for impairment at least annually, or more often if events or circumstances, such as adverse changes in the business climate, indicate that there may be impairment. In turn, we estimate the recoverable amount at the impairment tests. The recoverable amount of an asset or a cash-generating unit is the higher of its value in use and its fair value less costs of disposal. In assessing value in use, the estimated future cash flows are discounted to their present value using a pre-tax discount rate that reflects the time value of money and the risks specific to the asset. We derive cash flow estimates from our historical experience and our internal business plans, and discount them by applying an appropriate discount rate. Changes in strategy or in market conditions could significantly affect these estimates.
We reduce deferred tax assets when, in management’s judgment, it is more likely than not that the deferred tax assets, or a portion thereof, will not be realized. In assessing the realizability of deferred tax assets, we must determine whether we will be able to generate adequate future taxable income in the tax jurisdictions that give rise to the deferred tax assets during the periods in which the underlying temporary differences become deductible or before net operating loss carry forwards expire. We consider all available evidence, both positive and negative, in making this assessment. Determination of the deferred tax assets is based on estimates and judgment. A change in the ability of our operations to generate future taxable income in the tax jurisdictions that give rise to the deferred tax assets could change our assessment as to the realizability of these assets.
Recoverability of Non-current Assets
Tax Asset Valuation
Financial Assets Measured at Fair Value
Impairment of Financial Assets Measured at Amortized Cost
12Sumitomo Corporation Fact Book 2018
5. Results of Operations
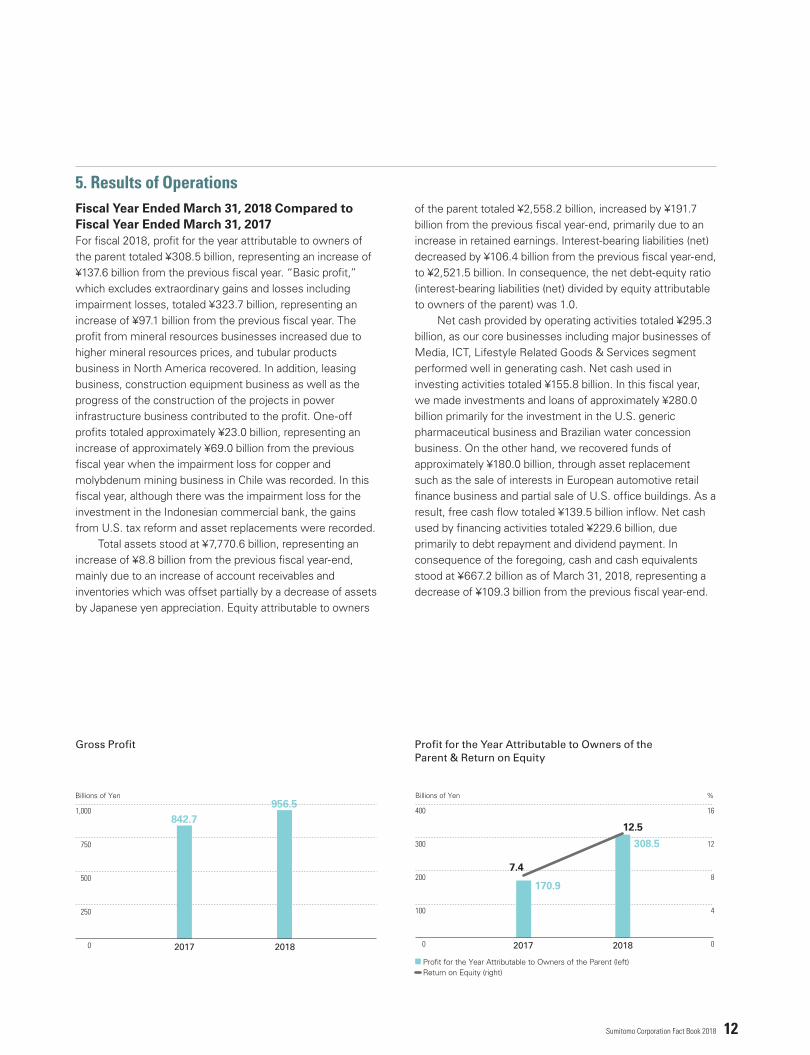
For fiscal 2018, profit for the year attributable to owners of the parent totaled ¥308.5 billion, representing an increase of ¥137.6 billion from the previous fiscal year. “Basic profit,” which excludes extraordinary gains and losses including impairment losses, totaled ¥323.7 billion, representing an increase of ¥97.1 billion from the previous fiscal year. The profit from mineral resources businesses increased due to higher mineral resources prices, and tubular products business in North America recovered. In addition, leasing business, construction equipment business as well as the progress of the construction of the projects in power infrastructure business contributed to the profit. One-off profits totaled approximately ¥23.0 billion, representing an increase of approximately ¥69.0 billion from the previous fiscal year when the impairment loss for copper and molybdenum mining business in Chile was recorded. In this fiscal year, although there was the impairment loss for the investment in the Indonesian commercial bank, the gains from U.S. tax reform and asset replacements were recorded. Total assets stood at ¥7,770.6 billion, representing an increase of ¥8.8 billion from the previous fiscal year-end, mainly due to an increase of account receivables and inventories which was offset partially by a decrease of assets by Japanese yen appreciation. Equity attributable to owners
of the parent totaled ¥2,558.2 billion, increased by ¥191.7 billion from the previous fiscal year-end, primarily due to an increase in retained earnings. Interest-bearing liabilities (net) decreased by ¥106.4 billion from the previous fiscal year-end, to ¥2,521.5 billion. In consequence, the net debt-equity ratio (interest-bearing liabilities (net) divided by equity attributable to owners of the parent) was 1.0. Net cash provided by operating activities totaled ¥295.3 billion, as our core businesses including major businesses of Media, ICT, Lifestyle Related Goods & Services segment performed well in generating cash. Net cash used in investing activities totaled ¥155.8 billion. In this fiscal year, we made investments and loans of approximately ¥280.0 billion primarily for the investment in the U.S. generic pharmaceutical business and Brazilian water concession business. On the other hand, we recovered funds of approximately ¥180.0 billion, through asset replacement such as the sale of interests in European automotive retail finance business and partial sale of U.S. office buildings. As a result, free cash flow totaled ¥139.5 billion inflow. Net cash used by financing activities totaled ¥229.6 billion, due primarily to debt repayment and dividend payment. In consequence of the foregoing, cash and cash equivalents stood at ¥667.2 billion as of March 31, 2018, representing a decrease of ¥109.3 billion from the previous fiscal year-end.
Fiscal Year Ended March 31, 2018 Compared to Fiscal Year Ended March 31, 2017
Gross Profit Profit for the Year Attributable to Owners of theParent & Return on Equity
12.5
308.5
7.4
0
4
8
12
16
201820170
100
200
300
400
170.9
Billions of Yen %
Profit for the Year Attributable to Owners of the Parent (left) Return on Equity (right)
842.7
0
250
500
750
1,000956.5
20182017
Billions of Yen
13 Sumitomo Corporation Fact Book 2018
Financial Section
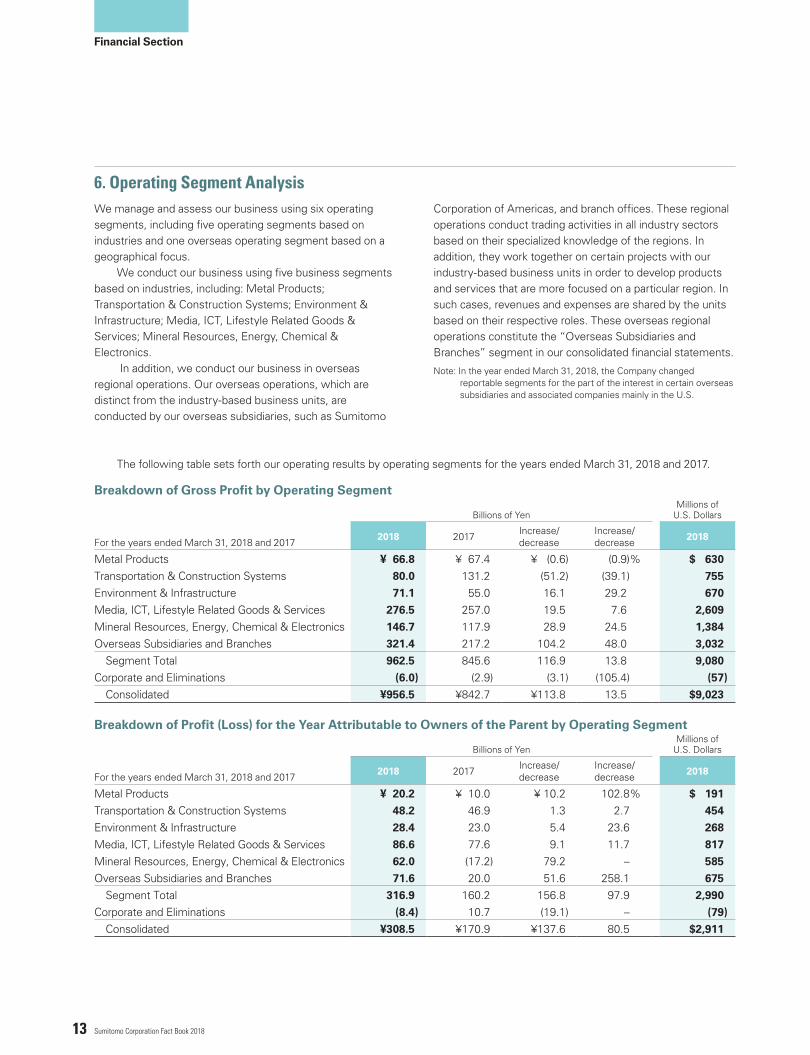
The following table sets forth our operating results by operating segments for the years ended March 31, 2018 and 2017.
Billions of YenMillions of
U.S. Dollars
For the years ended March 31, 2018 and 2017 2018 2017 Increase/decrease
Increase/decrease 2018
Metal Products ¥ 66.8 ¥ 67.4 ¥ (0.6) (0.9)% $ 630
Transportation & Construction Systems 80.0 131.2 (51.2) (39.1) 755
Environment & Infrastructure 71.1 55.0 16.1 29.2 670
Media, ICT, Lifestyle Related Goods & Services 276.5 257.0 19.5 7.6 2,609
Mineral Resources, Energy, Chemical & Electronics 146.7 117.9 28.9 24.5 1,384
Overseas Subsidiaries and Branches 321.4 217.2 104.2 48.0 3,032
Segment Total 962.5 845.6 116.9 13.8 9,080
Corporate and Eliminations (6.0) (2.9) (3.1) (105.4) (57)
Consolidated ¥956.5 ¥842.7 ¥113.8 13.5 $9,023
Breakdown of Gross Profit by Operating Segment
Billions of YenMillions of
U.S. Dollars
For the years ended March 31, 2018 and 2017 2018 2017 Increase/decrease
Increase/decrease 2018
Metal Products ¥ 20.2 ¥ 10.0 ¥ 10.2 102.8% $ 191
Transportation & Construction Systems 48.2 46.9 1.3 2.7 454
Environment & Infrastructure 28.4 23.0 5.4 23.6 268
Media, ICT, Lifestyle Related Goods & Services 86.6 77.6 9.1 11.7 817
Mineral Resources, Energy, Chemical & Electronics 62.0 (17.2) 79.2 – 585
Overseas Subsidiaries and Branches 71.6 20.0 51.6 258.1 675
Segment Total 316.9 160.2 156.8 97.9 2,990
Corporate and Eliminations (8.4) 10.7 (19.1) – (79)
Consolidated ¥308.5 ¥170.9 ¥137.6 80.5 $2,911
Breakdown of Profit (Loss) for the Year Attributable to Owners of the Parent by Operating Segment
6. Operating Segment AnalysisWe manage and assess our business using six operating segments, including five operating segments based on industries and one overseas operating segment based on a geographical focus. We conduct our business using five business segments based on industries, including: Metal Products; Transportation & Construction Systems; Environment & Infrastructure; Media, ICT, Lifestyle Related Goods & Services; Mineral Resources, Energy, Chemical & Electronics. In addition, we conduct our business in overseas regional operations. Our overseas operations, which are distinct from the industry-based business units, are conducted by our overseas subsidiaries, such as Sumitomo
Corporation of Americas, and branch offices. These regional operations conduct trading activities in all industry sectors based on their specialized knowledge of the regions. In addition, they work together on certain projects with our industry-based business units in order to develop products and services that are more focused on a particular region. In such cases, revenues and expenses are shared by the units based on their respective roles. These overseas regional operations constitute the “Overseas Subsidiaries and Branches” segment in our consolidated financial statements.
Note: In the year ended March 31, 2018, the Company changed reportable segments for the part of the interest in certain overseas subsidiaries and associated companies mainly in the U.S.

14Sumitomo Corporation Fact Book 2018
Gross profit totaled ¥66.8 billion, a decrease of ¥0.6 billion, or 0.9%, from ¥67.4 billion in the previous year. Profit for the year attributable to owners of the parent totaled ¥20.2 billion, an increase of ¥10.2 billion, or 102.8%, from ¥10.0 billion in the previous year. This was due to stable performances of overseas steel service centers and one-off profit from asset replacement. In addition, shares in tubular products business in North America which had showed sluggish performances were transferred from this segment to the Overseas subsidiaries and Branches segment in the first quarter of this fiscal year.
Gross profit totaled ¥80.0 billion, a decrease of ¥51.2 billion, or 39.1%, from ¥131.2 billion in the previous year. Profit for the year attributable to owners of the parent totaled ¥48.2 billion, an increase of ¥1.3 billion, or 2.7%, from ¥46.9 billion in the previous year. Although earnings decreased as we transferred a part of shares in subsidiaries in Americas from this segment to the Overseas subsidiaries and Branches segment in the first quarter of this fiscal year, shipping market showed gradual recovery and leasing business and construction equipment sales & marketing business showed robust performances.
Gross profit totaled ¥71.1 billion, an increase of ¥16.1 billion, or 29.2%, from ¥55.0 billion in the previous year. Profit for the year attributable to owners of the parent totaled ¥28.4 billion, an increase of ¥5.4 billion, or 23.6%, from ¥23.0 billion in the previous year. This was due to a stable performance of overseas IPP/IWPP business and progress in construction of large-scale projects in power infrastructure business.
Gross profit totaled ¥276.5 billion, an increase of ¥19.5 billion, or 7.6%, from ¥257.0 billion in the previous year. Profit for the year attributable to owners of the parent totaled ¥86.6 billion, an increase of ¥9.1 billion, or 11.7%, from ¥77.6 billion in the previous year. This was due to robust performances of domestic major group companies and real estate business and one-off profit from asset replacement.
Gross profit totaled ¥146.7 billion, an increase of ¥28.9 billion, or 24.5%, from ¥117.9 billion in the previous year. Profit for the year attributable to owners of the parent totaled to ¥62.0 billion, an increase of ¥79.2 billion from a loss of ¥17.2 billion in the previous year. San Cristobal silver-zinc-lead mining project in Bolivia and Iron ore mining project in South Africa showed robust performances mainly due to the higher mineral resources prices, in addition to an absence of the impairment loss of ¥33.6 billion recorded in Copper and molybdenum mining business in Chile in the previous fiscal year.
Gross profit totaled ¥321.4 billion, an increase of ¥104.2 billion, or 48.0%, from ¥217.2 billion in the previous year. Profit for the year attributable to owners of the parent totaled ¥71.6 billion, an increase of ¥51.6 billion, or 258.1%, from ¥20.0billion in the previous year. This was owing to one-off profits from U.S. tax reform and earnings improvement in tubular products business in North America. In addition, part of shares in subsidiaries in Americas was transferred from each Business Unit to this segment in the first quarter of this fiscal year.
Fiscal Year Ended March 31, 2018 Compared to Fiscal Year Ended March 31, 2017Metal Products
Transportation & Construction Systems
Media, ICT, Lifestyle Related Goods & Services
Mineral Resources, Energy, Chemical & Electronics
Overseas Subsidiaries and Branches
Environment & Infrastructure
Profit (Loss) for the Year Attributable to Owners of the Parent by Operating Segment
-20
0
20
60
40
80
100
Billions of Yen
‘18‘17Metal
Products
‘18‘17Overseas Subsidiaries
and Branches
‘18‘17Mineral Resources,Energy, Chemical &
Electronics*
‘18‘17Media, ICT, Lifestyle
Related Goods &Services*
‘18‘17Environment &Infrastructure
‘18‘17Transportation &
Construction Systems*
10.020.2
46.9 48.2
23.0 28.4
77.686.6
(17.2)
62.0
20.0
71.6

15 Sumitomo Corporation Fact Book 2018
Financial Section
7. Capital Resources and LiquidityOur basic policy for fund raising activities is to maintain and enhance financial soundness, and we are committed to secure stable, medium-to long-term low-interest rate funds and liquidity for our operations. We have implemented a group financing policy for our fund management on a consolidated basis in which funds are raised principally by the Company, finance subsidiaries and overseas regional entities and efficiently utilized through our cash management system with in Group. As of March 31, 2018, we had ¥3,203.9 billion of bonds and borrowings. Our short-term debt, excluding current maturities of long-term debt, was ¥197.5 billion, an increase of ¥8.2 billion from the previous year. Our short-term debt consisted of ¥168.2 billion of loans, principally from banks, and ¥29.3 billion of commercial paper. As of March 31, 2018, we had bonds and long-term debt of ¥3,006.4 billion, a decrease of ¥222.7 billion from the previous year, including current maturities of ¥405.8 billion. As of March 31, 2018, the balance of our borrowings from banks and insurance companies was ¥2,602.7 billion, a decrease of ¥235.3 billion from the previous year, and the balance of notes and bonds was ¥403.7 billion, an increase of ¥12.6 billion from the previous year. Most of our loans from banks contain covenant provisions customary in Japan. We do not believe those provisions materially limit our operating or financial flexibility. However, several of the loan agreements require maintenance of certain financial ratios and minimum levels of tangible net worth. Under some agreements, principally with government-owned financial institutions, we may be required to make early repayments of an outstanding amount if the lender concludes that we are able to repay the outstanding amount through improved earnings or from the proceeds of an equity or debt offering, and makes such a prepayment request. Certain agreements provide that the banks may require the borrower to obtain bank approval prior to the payment of dividends and other appropriations of earnings. We have not been asked to make any such prepayments and currently do not anticipate any prepayment requests. See “Risk Factors – Risks stemming from restriction on access to liquidity and capital.” We have maintained a stable funds procurement by extending fundraising periods to diversify the maturity dates. Our basic policy is to maintain the appropriate balance between funds mainly obtained through indirect financing including bank loans based on our sound relationship with broad range of financial institutions and funds obtained through direct financing such as commercial paper and corporate bonds. With an aim to diversity the sources of
funds, we continue to procure foreign currency funds through bank loans, currency swaps, commercial paper issued by finance subsidiaries and overseas regional entities, and Euro medium-term note (“MTN”). In addition, in September 2017, we have issued unsecure bonds payable in U.S. dollars. As of March 31, 2018, our long-term and short-term credit ratings are Baa1/P-2 (stable outlook) from Moody’s Investors Service, A-/A-2 (stable outlook) from Standard & Poor’s and A+/a-1 (stable outlook) from Rating and Investment Information, Inc. In order to facilitate our direct access to capital markets for funding, we have established several funding programs, including:
¥200 billion Japanese shelf registration for primary debt offerings;
¥1.0 trillion commercial paper program in Japan; $1,500 million commercial paper program, established by our U.S. subsidiary, Sumitomo Corporation of Americas;
U.S.$3,000 million Euro Medium Term Note program jointly established by Sumitomo Corporation Capital Europe, Sumitomo Corporation of Americas and Sumitomo Corporation Capital Asia; and
U.S.$1,500 million Euro-denominated commercial paper program established by Sumitomo Corporation Capital Europe.
In addition, we continuously determine various worst case scenarios, including the current financial market turmoil, to maintain adequate levels of liquidity in any market condition. As of March 31, 2018, we maintain cash and deposits and committed lines of credit with major Japanese and overseas financial institutions in the aggregate amount of $1,260 million, as well as the following long-term committed line of credit in the amount up to ¥425 billion, which should secure sufficient liquidity to provide funds required for the operation of the Company and its subsidiaries and repayments of borrowings and bonds that will become due within one year. To date, we have not drawn on any of these lines of credit. We believe these lines of credit do not contain any material covenants, ratings triggers or other restrictions that could potentially impair our ability to draw down the funds. We also have several uncommitted lines of credit. These lines of credit consist of:
$1,060 million multi-borrower and multi-currency line of credit provided by a syndicate of major European and U.S. banks, under which we can obtain loans for Sumitomo Corporation or any of our subsidiaries in the United Kingdom, the United States and Singapore;

16Sumitomo Corporation Fact Book 2018
$100 million U.S. dollar-denominated line of credit provided to Sumitomo Corporation of Americas by a major U.S. bank;
$100 million multi-currency line of credit provided to Sumitomo Corporation Capital Europe by a major European bank;
¥310 billion line of credit provided by a syndicate of major Japanese banks, including ¥100 billion multi-currency facility; and
¥115 billion line of credit provided by a syndicate of Japanese regional banks.
As of March 31, 2018 and 2017
Billions of Yen Millions of
U.S. Dollars
2018 2017 2018
Short-term ¥ 197.5 ¥ 189.3 $ 1,863
Loans, principally from banks 168.2 143.7 1,587
Commercial paper 29.3 45.6 276
Long-term, including current maturities of long-term debt 3,006.4 3,229.1 28,363
Secured long-term debt
Loans 233.1 277.8 2,199
Unsecured long-term debt
Loans 2,369.6 2,560.1 22,355
Bonds and notes 403.7 391.1 3,809
Interest-bearing liabilities (gross) 3,203.9 3,418.3 30,226
Cash and cash equivalents & time deposits 682.3 790.5 6,437
Interest-bearing liabilities (net) 2,521.5 2,627.9 23,789
Total assets 7,770.6 7,761.8 73,308
Equity attributable to owners of the parent 2,558.2 2,366.5 24,134
Equity attributable to owners of the parent ratio (%) 32.9 30.5 32.9
Debt-Equity Ratio (gross) (times) 1.3 1.4 1.3
Debt-Equity Ratio (net) (times) 1.0 1.1 1.0
Capital Resources and Liquidity
Working Capital & Current Ratio(Current Assets / Current Liabilities)
Equity Attributable to Owners of the Parent &Equity Attributable to Owners of the Parent Ratio
161.1
1,319.1
152.6
0
40
80
120
160
200
201820170
600
300
900
1,200
1,500
1,145.3
Billions of Yen %
Working Capital (left) Current Ratio (right)
32.9
2,558.2
30.5
0
10
20
30
40
50
201820170
1,200
600
1,800
2,400
3,000
2,366.5
Billions of Yen %
Equity Attributable to Owners of the Parent (left) Equity Attributable to Owners of the Parent Ratio (right)

17 Sumitomo Corporation Fact Book 2018
Financial Section
Cash FlowsInterest-Bearing Liabilities (Net) &Debt-Equity Ratio (Net)
As of March 31, 2018, our contractual cash obligations for the periods indicated were as follows:
Billions of Yen
Bonds and borrowings Non-cancelable operating leases
Less than 1 year ¥ 603.2 ¥ 26.8 1-2 years 451.0 24.7 2-3 years 389.7 21.4 3-4 years 288.2 18.0 4-5 years 278.3 16.5 More than 5 years 1,193.4 118.0
Total ¥ 3,203.9 ¥ 225.5
Billions of YenMillions of
U.S. Dollars
For the years ended March 31, 2018 and 2017 2018 2017 2018
Net cash from operating activities ¥ 295.3 ¥ 345.8 $ 2,786
Net cash used in investing activities (155.8) (180.7) (1,469)
Free cash flow 139.5 165.1 1,317
Net cash from (used in) financing activities (229.6) (254.4) (2,166)
Net (decrease) increase in cash and cash equivalents (90.1) (89.3) (849)
Cash and cash equivalents at the beginning of year 776.5 868.8 7,325
Effect of exchange rate changes on cash and cash equivalents (14.7) (3.0) (139)
Cash and cash equivalents at the end of year ¥ 667.2 ¥ 776.5 $ 6,294
Summary Statements of Consolidated Cash Flows
Payments due by period
139.5295.3
(155.8)
165.1
20182017-200
0
200
400 345.8
(180.7)
Billions of Yen
Net Cash from Operating Activities Net Cash used in Investing Activities Free Cash Flow
1.0
2,521.5
1.1
0
1.0
2.0
3.0
201820170
1,000
2,000
3,000 2,627.9
Billions of Yen Times
Interest-Bearing Liabilities (Net) (left) Debt-Equity Ratio (Net) (right)

18Sumitomo Corporation Fact Book 2018
As of March 31, 2018, we had financing commitments in connection with loans and investments in equity capital, and also we had contracts for the use of equipment, that was an aggregate amount of ¥1,162.1 billion. As of March 31, 2018, we have no material commitments for capital expenditures. In addition to our commitments discussed above, in connection with our businesses, from time to time, we incur various contingent liabilities, such as guarantees of our customers’ obligations. In addition, we are, from time to time, subject to contingent liabilities arising from litigation. These contingent liabilities are discussed in detail in “8. Contingencies” and “9. Litigation and others” described below. Although we currently do not believe that our cash needs under such contingent liabilities will be significant, if, contrary to expectations, defaults under guarantees are substantial or there is a major adverse outcome in our litigation, such contingent liabilities may create significant new cash needs for us. Our primary future recurring cash needs will be for
working capital, capital investments in new and existing business ventures and debt service. Our growth strategy contemplates the making of investments, in the form of acquisitions, equity investments and loans. We invested ¥97.8 billion in acquisitions of property, plant and equipment and investment property and ¥142.8 billion in acquisitions of other investments in the year ended March 31, 2018. We are currently contemplating acquisitions of companies complementary to our existing businesses and also to related business areas in all business segments. These investments, however, are either at a preliminary evaluation stage or are subject to a number of conditions, and accordingly, may not be completed. And we believe that our existing cash, current credit arrangements and cash flows from operations will be sufficient to meet our cash needs during the foreseeable future, although we cannot assure you that this will be the case. If our future cash flows from operations are less than we expect, we may need to incur additional debt, pursue other sources of liquidity, or modify our investment plans.
8. Contingencies
9. Litigation and others
In connection with our businesses, from time to time, we incur various contingent liabilities, such as guarantees of our customers’ obligations. We conduct business with counterparties around the world, and we make an effort to control the related trade receivables and guarantees in order to minimize concentrations of credit risk. We do not anticipate losses on the commitments and guarantees
The Companies are involved in certain legal actions and claims incidental to its business. In the opinion of management, none of these actions or claims will have a
discussed below in excess of established allowances. As of March 31, 2018, we are contingently liable for guarantees (continuing through 2043) in the aggregate amount of ¥130.3 billion, including ¥82.9 billion relating to our associated companies and ¥47.4 billion to third parties. The guarantees are primarily to enhance the credit standings of our associated companies, suppliers and buyers.
material adverse effect on the financial position or results of operations of the Companies.

19 Sumitomo Corporation Fact Book 2018
Financial Section
10. New standards and interpretations not yet appliedThe new standards, interpretations, and amendments that have been issued as of the date of the approval for the consolidated financial statements, which the Companies have not yet applied as of March 31, 2018, are as follows.
IFRSs Title
Reporting periods on or after which the applications are
required
Reporting periods of the application by the
Companies (The reporting period ended)
Summaries of new IFRSs and amendments
IFRS 2 Share-based Payment January 1, 2018 March 31, 2019 Clarification of the accounting for classification and
measurement of share-based payment transactions
IFRS 9
Financial Instruments
January 1, 2018 March 31, 2019
New requirements for general hedge accounting Limited amendments to the requirements of classification and measurement of financial assets, and new requirements for impairment
IFRS 9 Financial Instruments January 1, 2019 March 31, 2020 Amendment to the accounting for particular financial assets with negative compensation
IFRS 10 Consolidated Financial Statements To be determined To be determined Accounting for the sale or contribution of assets
between an investor and its associate or joint venture
IFRS 15Revenue from Contracts with Customers
January 1, 2018 March 31, 2019Establishment of accounting for revenue recognition that applies to contracts with customers
IFRS 16 Leases January 1, 2019 March 31, 2020 Amendments to lease accounting
IFRS 17 Insurance Contracts January 1, 2021 March 31, 2022 Amendments to the accounting of insurance contracts
IAS 19 Employee benefits January 1, 2019 March 31, 2020 Clarification of the accounting for a plan amendment, curtailment, or settlement
IAS 28Investments in Associates and Joint Ventures
To be determined To be determinedAccounting for the sale or contribution of assets between an investor and its associate or joint venture
IAS 28Investments in Associates and Joint Ventures
January 1, 2019 March 31, 2020 Clarification of the accounting for long-term interests in associates and joint ventures
IAS 40 Investment Property January 1, 2018 March 31, 2019 Clarification of requirements on transfers to, or from, investment properties
IFRIC 22
Foreign Currency Transactions and Advance Consideration
January 1, 2018 March 31, 2019Clarification of the accounting for the transactions that involve advance consideration paid or received in a foreign currency
IFRIC 23Uncertainty over Income Tax Treatments
January 1, 2019 March 31, 2020 Clarification of the accounting for income tax when there is uncertainty over income tax treatments
The Companies are required to apply International Financial Reporting Standard No.9 Financial Instruments (issued in July 2014) (“IFRS 9”) and International Financial Reporting Standard No. 15 Revenue from Contracts with Customers (“IFRS 15”) from April 1, 2018. The application of IFRS 9 will mainly have an impact on the accounting for the principal payment deferrals agreed with the project finance lender in August 2016 with regard to the Nickel mining and refining business in Madagascar. The balance of Investments accounted for using the equity method and retained earnings as of the beginning of the year
ending March 31, 2019 will decrease by ¥1.8 billion each as a result of an increase in debts and a decrease in retained earnings of Ambatovy Minerals S.A and Dynatec Madagascar S.A, equity-accounted investees by the same amount. The primary change due to the application of IFRS 15 is recognition of incremental costs of obtaining a contract with customers as an asset by Jupiter Telecommunications Co., Ltd., an equity-accounted investee, which will result in an increase in Investments accounted for using the equity method and retained earnings as of as of the beginning of the year ending March 31, 2019 by ¥6.6 billion each.
20Sumitomo Corporation Fact Book 2018
The Companies are currently evaluating the potential impacts that application of other new standards and interpretations will have on the consolidated financial statements.
11. Quantitative and Qualitative Disclosure about Market RiskIn the normal course of business, we are exposed to risks arising from fluctuations in interest and currency exchange rates, commodity prices and equity prices. In order to manage these risks, we use financial and commodity derivative instruments including: foreign exchange forwards, currency swaps and options; interest rate swaps, futures and options; and commodity futures, forwards, swaps, and options. To a lesser degree, we also use derivative commodity instruments for trading purposes within prescribed position limits and loss limits imposed under the risk management structure described below.
Our business activities expose us to market risks arising from changes in interest rates, which we monitor and for which we take measures to minimize through the departments which Chief Financial Officer of the Corporate Group manages. In particular, interest rate fluctuations will impact our borrowing costs because the significant amount of our outstanding debt instruments is floating rate instruments and because we have short-term borrowings that we refinance from time to time. However, the impact on our borrowing costs will be partially offset by increased returns on certain of our assets, which will also be impacted by interest rate fluctuations. To manage this risk, we enter into interest rate swap agreements, future contracts and option contracts that serve to modify and match the interest rate characteristics of our assets and liabilities.
The nature of our global operations expose us to market risks caused by fluctuations in foreign currency exchange rates related to imports, exports and financing in currencies other than the local currency. In order to mitigate foreign currency exchange rate risks, except for certain risks including the risk associated with foreign investments considered to be permanent, we use derivative instruments including foreign exchange forward contracts, currency swap agreements and currency option contracts with third parties in addition to borrowing and deposit transactions denominated in foreign currencies.
We trade in commodities such as physical precious and base metals, energy products (crude oil and refined oil products) and agricultural products (wheat, coffee, sugar and others), and engage in investments in metal mining, and oil and gas
development. As a result of these activities, we are exposed to commodity price risks. We intend to reduce commodity price risks by hedging sales, matching the volume and timing of selling and purchasing commodities, or using derivatives. We use derivatives for trading purposes within well-defined position limits and loss limits.
We are exposed to equity price risk inherent in stock we hold in financial institutions and our customers and suppliers for strategic purposes and in the other investments held by us. We do not engage in continuous hedging measures against the market exposures on those securities. As of March 31, 2018, we had fair value exposure on our marketable equity securities in the aggregate amount of ¥354.2 billion.
Any business department wishing to enter into a derivative transaction or any other type of transaction exposing us to market risk must obtain approval from the President or General Manager, depending on the magnitude of the transaction, before entering into the transaction. The President or General Manager, as the case may be, reviews requests with the assistance of staff members who have expertise in derivative contracts. The request must identify the counterparty, the applicable market and credit risks and state the objectives of the transaction, the trading limit, and the loss limit amount. The departments which Chief Financial Officer manages provide the following with respect to the execution and monitoring of transactions:
back office support services for financial and derivative commodity transactions, such as opening accounts, confirming the execution of contracts, processing settlement and delivery of funds, and maintaining accounting records for the transactions;
confirmation of balances of each transaction position; and monitoring of the status of positions and analyzing and calculating the risks of related transactions on a company-wide basis, and issuing periodic reports to our senior management.
Our subsidiaries are required to comply with the risk management structure described above when they execute commodity market transactions.
Interest Rate Risk
Commodity Price Risk
Equity Price Risk
Risk Management Structure
Foreign Currency Exchange Rate Risk
21 Sumitomo Corporation Fact Book 2018
Financial Section
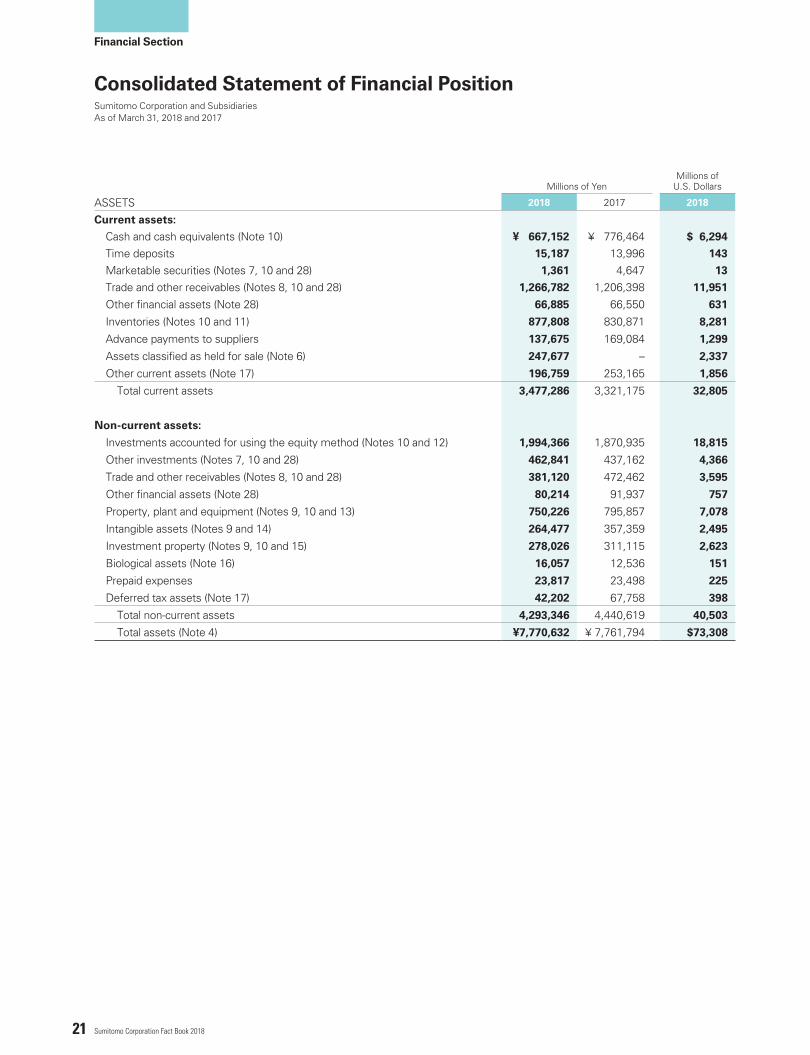
Sumitomo Corporation and SubsidiariesAs of March 31, 2018 and 2017
Millions of YenMillions of
U.S. Dollars
ASSETS 2018 2017 2018
Current assets:
Cash and cash equivalents (Note 10) ¥ 667,152 ¥ 776,464 $ 6,294
Time deposits 15,187 13,996 143
Marketable securities (Notes 7, 10 and 28) 1,361 4,647 13
Trade and other receivables (Notes 8, 10 and 28) 1,266,782 1,206,398 11,951
Other financial assets (Note 28) 66,885 66,550 631
Inventories (Notes 10 and 11) 877,808 830,871 8,281
Advance payments to suppliers 137,675 169,084 1,299
Assets classified as held for sale (Note 6) 247,677 – 2,337
Other current assets (Note 17) 196,759 253,165 1,856
Total current assets 3,477,286 3,321,175 32,805
Non-current assets:
Investments accounted for using the equity method (Notes 10 and 12) 1,994,366 1,870,935 18,815
Other investments (Notes 7, 10 and 28) 462,841 437,162 4,366
Trade and other receivables (Notes 8, 10 and 28) 381,120 472,462 3,595
Other financial assets (Note 28) 80,214 91,937 757
Property, plant and equipment (Notes 9, 10 and 13) 750,226 795,857 7,078
Intangible assets (Notes 9 and 14) 264,477 357,359 2,495
Investment property (Notes 9, 10 and 15) 278,026 311,115 2,623
Biological assets (Note 16) 16,057 12,536 151
Prepaid expenses 23,817 23,498 225
Deferred tax assets (Note 17) 42,202 67,758 398
Total non-current assets 4,293,346 4,440,619 40,503
Total assets (Note 4) ¥7,770,632 ¥ 7,761,794 $73,308
Consolidated Statement of Financial Position

22Sumitomo Corporation Fact Book 2018
See the accompanying notes to the consolidated financial statements.
Millions of YenMillions of
U.S. Dollars
LIABILITIES AND EQUITY 2018 2017 2018
Current liabilities:
Bonds and borrowings (Notes 8, 18, 19 and 28) ¥ 603,249 ¥ 659,257 $ 5,691
Trade and other payables (Notes 20 and 28) 1,038,657 1,029,294 9,799
Other financial liabilities (Note 28) 59,413 53,264 561
Income tax payables 39,639 20,737 374
Accrued expenses 89,778 105,164 847
Advances from customers 159,896 223,584 1,508
Provisions (Note 21) 5,711 4,490 54
Liabilities associated with assets classified as held for sale (Note 6) 74,207 – 700
Other current liabilities 87,599 80,129 826
Total current liabilities 2,158,149 2,175,919 20,360
Non-current liabilities:
Bonds and borrowings (Notes 8, 18, 19 and 28) 2,600,616 2,759,069 24,535
Trade and other payables (Notes 20 and 28) 104,108 121,126 982
Other financial liabilities (Note 28) 33,853 40,599 319
Accrued pension and retirement benefits (Note 22) 27,362 28,076 258
Provisions (Note 21) 40,503 33,210 382
Deferred tax liabilities (Note 17) 111,720 116,840 1,054
Total non-current liabilities 2,918,162 3,098,920 27,530
Total liabilities 5,076,311 5,274,839 47,890
Equity:
Common stock (Note 23) 219,279 219,279 2,069
Additional paid-in capital (Note 24) 265,126 263,937 2,501
Treasury stock (2,796) (3,113) (26)
Other components of equity (Note 25) 248,564 309,094 2,345
Retained earnings (Note 24) 1,827,987 1,577,288 17,245
Equity attributable to owners of the parent 2,558,160 2,366,485 24,134
Non-controlling interests 136,161 120,470 1,284
Total equity 2,694,321 2,486,955 25,418
Total liabilities and equity ¥7,770,632 ¥7,761,794 $73,308

23 Sumitomo Corporation Fact Book 2018
Financial Section
Sumitomo Corporation and SubsidiariesFor the years ended March 31, 2018 and 2017
See the accompanying notes to the consolidated financial statements.
Millions of YenMillions of
U.S. Dollars
2018 2017 2018
Revenues:Sales of tangible products ¥4,333,190 ¥3,504,159 $40,879Sales of services and others 494,133 492,815 4,662
Total revenues (Notes 4, 15, 28 and 31) 4,827,323 3,996,974 45,541Cost:
Cost of tangible products sold (3,581,975) (2,951,459) (33,792)Cost of services and others (288,875) (202,817) (2,726)
Total cost (Notes 9, 13, 14, 15, 22, 28 and 31) (3,870,850) (3,154,276) (36,518)Gross profit (Note 4) 956,473 842,698 9,023
Other income (expenses):Selling, general and administrative expenses (Notes 5, 13, 14 and 30) (731,616) (693,759) (6,902)Impairment losses on long-lived assets (Notes 13, 14 and 15) (7,226) (18,803) (68)Gain (loss) on sale of long-lived assets, net 2,859 (876) 27Other, net (Notes 31) 9,419 (20,132) 89
Total other income (expenses) (726,564) (733,570) (6,854)Finance income (costs):
Interest income 27,530 26,009 260Interest expense (33,297) (27,738) (314)Dividends 10,652 9,372 100Gain (loss) on securities and other investments, net (Note 28) 27,767 12,873 262
Finance income (costs), net (Note 31) 32,652 20,516 308Share of profit (loss) of investments accounted for using the equity method (Note 12) 149,734 83,457 1,413
Profit before tax 412,295 213,101 3,890Income tax expense (Note 32) (78,385) (25,896) (740)
Profit for the year 333,910 187,205 3,150Profit for the year attributable to:
Owners of the parent (Note 4) ¥ 308,521 ¥ 170,889 $ 2,911Non-controlling interests 25,389 16,316 239
Other comprehensive income:Items that will not be reclassified to profit or loss
Financial assets measured at fair value through other comprehensive income 21,073 22,771 199Remeasurements of defined benefit pension plans 3,219 10,884 30Share of other comprehensive income of investments accounted for using the equity method 1,292 (541) 12
Total items that will not be reclassified to profit or loss 25,584 33,114 241Items that may be reclassified subsequently to profit or loss
Exchange differences on translating foreign operations (77,122) (47,621) (727)Cash-flow hedges (2,722) 2,495 (26)Share of other comprehensive income of investments accounted for using the equity method 2,399 6,061 23
Total items that may be reclassified subsequently to profit or loss (77,445) (39,065) (730)Other comprehensive income, net of tax (Note 25) (51,861) (5,951) (489)
Comprehensive income for the year 282,049 181,254 2,661Comprehensive income for the year attributable to:
Owners of the parent ¥ 256,329 ¥ 169,715 $ 2,418Non-controlling interests 25,720 11,539 243
Yen U.S. Dollars
Earnings per share (attributable to owners of the parent) (Note 33):Basic ¥ 247.13 ¥ 136.91 $ 2.33Diluted 246.91 136.81 2.33
Consolidated Statement of Comprehensive Income

24Sumitomo Corporation Fact Book 2018
Sumitomo Corporation and SubsidiariesFor the years ended March 31, 2018 and 2017
See the accompanying notes to the consolidated financial statements.
Millions of YenMillions of
U.S. Dollars
2018 2017 2018
Equity (Note 23):Common stock:
Balance, beginning of year ¥ 219,279 ¥ 219,279 $ 2,069
Balance, end of year 219,279 219,279 2,069
Additional paid-in capital (Note 24):
Balance, beginning of year 263,937 256,500 2,490
Acquisition (disposal) of non-controlling interests, net 102 8,865 1
Others 1,087 (1,428) 10
Balance, end of year 265,126 263,937 2,501
Treasury stock:
Balance, beginning of year (3,113) (3,344) (29)
Acquisition (disposal) of treasury stock, net (Note 27) 317 231 3
Balance, end of year (2,796) (3,113) (26)
Other components of equity (Note 25):
Balance, beginning of year 309,094 311,880 2,916
Other comprehensive income for the year (52,192) (1,174) (493)
Transfer to retained earnings (8,338) (1,612) (78)
Balance, end of year 248,564 309,094 2,345
Retained earnings (Note 24):
Balance, beginning of year 1,577,288 1,467,194 14,880
Transfer from other components of equity 8,338 1,612 78
Profit for the year attributable to owners of the parent 308,521 170,889 2,911
Cash dividends (Note 26) (66,160) (62,407) (624)
Balance, end of year 1,827,987 1,577,288 17,245
Equity attributable to owners of the parent ¥2,558,160 ¥2,366,485 $24,134
Non-controlling interests:
Balance, beginning of year 120,470 140,436 1,136
Cash dividends to non-controlling interests (7,697) (20,117) (73)
Acquisition (disposal) of non-controlling interests and others, net (2,332) (11,388) (22)
Profit for the year attributable to non-controlling interests 25,389 16,316 239
Other comprehensive income for the year (Note 25) 331 (4,777) 4
Balance, end of year 136,161 120,470 1,284
Total equity ¥2,694,321 ¥2,486,955 $25,418
Comprehensive income for the year attributable to:
Owners of the parent 256,329 169,715 2,418
Non-controlling interests 25,720 11,539 243
Total comprehensive income for the year ¥ 282,049 ¥ 181,254 $ 2,661
Consolidated Statement of Changes in Equity
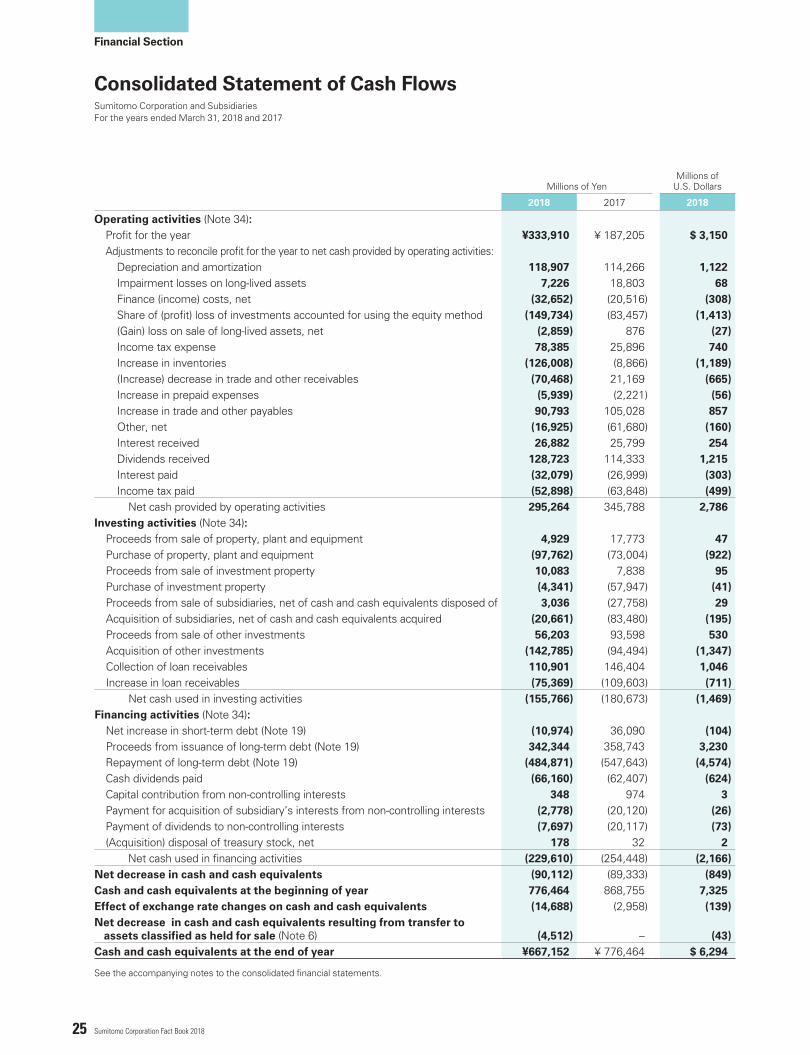
25 Sumitomo Corporation Fact Book 2018
Financial Section
Sumitomo Corporation and SubsidiariesFor the years ended March 31, 2018 and 2017
See the accompanying notes to the consolidated financial statements.
Millions of YenMillions of
U.S. Dollars
2018 2017 2018
Operating activities (Note 34):Profit for the year ¥333,910 ¥ 187,205 $ 3,150Adjustments to reconcile profit for the year to net cash provided by operating activities:
Depreciation and amortization 118,907 114,266 1,122Impairment losses on long-lived assets 7,226 18,803 68Finance (income) costs, net (32,652) (20,516) (308)Share of (profit) loss of investments accounted for using the equity method (149,734) (83,457) (1,413)(Gain) loss on sale of long-lived assets, net (2,859) 876 (27)Income tax expense 78,385 25,896 740Increase in inventories (126,008) (8,866) (1,189)(Increase) decrease in trade and other receivables (70,468) 21,169 (665)Increase in prepaid expenses (5,939) (2,221) (56)Increase in trade and other payables 90,793 105,028 857Other, net (16,925) (61,680) (160)Interest received 26,882 25,799 254Dividends received 128,723 114,333 1,215Interest paid (32,079) (26,999) (303)Income tax paid (52,898) (63,848) (499)
Net cash provided by operating activities 295,264 345,788 2,786Investing activities (Note 34):
Proceeds from sale of property, plant and equipment 4,929 17,773 47Purchase of property, plant and equipment (97,762) (73,004) (922)Proceeds from sale of investment property 10,083 7,838 95Purchase of investment property (4,341) (57,947) (41)Proceeds from sale of subsidiaries, net of cash and cash equivalents disposed of 3,036 (27,758) 29Acquisition of subsidiaries, net of cash and cash equivalents acquired (20,661) (83,480) (195)Proceeds from sale of other investments 56,203 93,598 530Acquisition of other investments (142,785) (94,494) (1,347)Collection of loan receivables 110,901 146,404 1,046Increase in loan receivables (75,369) (109,603) (711)
Net cash used in investing activities (155,766) (180,673) (1,469)Financing activities (Note 34):
Net increase in short-term debt (Note 19) (10,974) 36,090 (104)Proceeds from issuance of long-term debt (Note 19) 342,344 358,743 3,230Repayment of long-term debt (Note 19) (484,871) (547,643) (4,574)Cash dividends paid (66,160) (62,407) (624)Capital contribution from non-controlling interests 348 974 3Payment for acquisition of subsidiary’s interests from non-controlling interests (2,778) (20,120) (26)Payment of dividends to non-controlling interests (7,697) (20,117) (73)(Acquisition) disposal of treasury stock, net 178 32 2
Net cash used in financing activities (229,610) (254,448) (2,166)Net decrease in cash and cash equivalents (90,112) (89,333) (849)Cash and cash equivalents at the beginning of year 776,464 868,755 7,325Effect of exchange rate changes on cash and cash equivalents (14,688) (2,958) (139)Net decrease in cash and cash equivalents resulting from transfer to
assets classified as held for sale (Note 6) (4,512) – (43)Cash and cash equivalents at the end of year ¥667,152 ¥ 776,464 $ 6,294
Consolidated Statement of Cash Flows
26Sumitomo Corporation Fact Book 2018
Sumitomo Corporation and SubsidiariesFor the years ended March 31, 2018 and 2017
Notes to the Consolidated Financial Statements
1. Reporting Entity
2. Basis of Preparation
Sumitomo Corporation (the “Company”) is a company incorporated in Japan. The consolidated financial statements of the Company as at and for the year ended March 31, 2018 comprise the financial statements of the Company and its subsidiaries (together, the “Companies”), and the interests in associates and joint arrangements. The Company is an integrated trading company (sogo shosha). The Companies are engaged in a wide range of business activities on global basis. The Companies’ business foundation consists of trust, global relations with over 100,000 business partners around the world, a global network with offices and subsidiaries worldwide, intellectual capital, and advanced functions in business development, logistic solutions, financial services, IT solutions, risk management and intelligence gathering and analysis. Through integration of these elements, the Companies provide a diverse array of value to our customers. Based on this business foundation and these functions, the
The consolidated financial statements have been prepared in accordance with International Financial Reporting Standards (“IFRSs”).
The consolidated financial statements have been prepared under the historical cost basis except for the following significant items: derivatives are measured at fair value; financial instruments at fair value through profit or loss are measured at fair value;
financial instruments at fair value through other comprehensive income are measured at fair value;
defined benefit liabilities (assets) are the present value of the defined benefit obligation less the fair value of plan assets;
inventories acquired with the purpose of generating profits from short-term fluctuations in price are measured at fair value less costs to sell;
biological assets are measured at fair value less costs to sell; and
non-current assets or disposal groups classified as held for sale are measured at the lower of carrying amount and fair value less costs to sell.
Companies engage in general trading of a wide range of goods and commodities and in various business activities. The Companies act as both a principal and an agent in these trading transactions. The Companies also provide a range of services for a variety of industries, such as: financing for customers and suppliers; planning, coordination and operation of urban and industrial infrastructure projects; consulting in areas such as system integration and technology development; and transportation and logistics. In addition, the Companies engage in other diverse business activities, including investing in a variety of industries ranging from photovoltaic power generation to communications; developing natural resources; manufacturing and processing products such as steel products and textiles; developing and managing real estate; and operating retail stores.
The consolidated financial statements are presented in Japanese yen, which is also the Company’s functional currency. All financial information presented in Japanese yen has been rounded to the nearest million. The translation of Japanese yen amounts into United States dollars for the year ended March 31, 2018 is included solely for the convenience of readers and has been made at the rate of ¥106 = U.S. $1, the approximate exchange rate prevailing at the Federal Reserve Bank of New York on March 31, 2018. Such translation should not be construed as a representation that the Japanese yen amounts have been, or could in the future be converted into United States dollars at that or any rate.
The preparation of consolidated financial statements in accordance with IFRSs requires management to make judgments, estimates and assumptions that affect the application of accounting policies and the reported amounts of assets and liabilities, income and expenses. Actual results could differ from these estimates. The estimates and underlying assumptions are reviewed on an ongoing basis. Revisions to accounting estimates are recognized in the period in which the estimates are revised and in future periods in which the revision affects. Judgments and estimates made by management in the application of accounting policies that have a significant
(1) Statement of Compliance (3) Functional Currency and Presentation Currency
(4) Use of Estimates and Judgments
(2) Basis of Measurement

27 Sumitomo Corporation Fact Book 2018
Financial Section
3. Significant Accounting Policies
effect on the amounts recognized in the consolidated financial statements are as follows: Note 8 - Revenue Recognition Note 9 - Accounting for Arrangement containing a Lease Notes 28 and 31 - Financial Instruments
The following notes include information in respect of uncertainties of judgments and estimates which have a significant risk to cause material adjustment in the next fiscal year:
Significant accounting policies applied in the preparation of the accompanying consolidated financial statements are summarized below:
The Companies have applied International Financial Reporting Standard No. 3 Business Combinations (“IFRS 3”) and International Financial Reporting Standard No. 10 Consolidated Financial Statements to all business combinations. The Companies have applied the acquisition method to business combinations disclosed in Note 5. The Companies control an investee when the Companies are exposed, or have rights, to variable returns from their involvement with the investee and have the ability to affect those returns through their power over the investee. The acquisition date is the date when the control is transferred to the acquirer. Judgments may be required in deciding the acquisition date and as to whether the control is transferred from one party to another. Goodwill is measured at the fair value of the considerations transferred, including the recognized amount of any non-controlling interests in the acquiree at the date of acquisition, less the net recognized amount of the identifiable assets acquired and the liabilities assumed at the acquisition date (ordinarily measured at fair value). The considerations transferred include the fair value of the assets transferred from the Companies to the former owners of the acquiree, assumed liabilities, and equity interest issued by the Companies. The considerations transferred also include the fair value of contingent consideration. The contingent liabilities of the acquiree are recognized in the business combinations if, and only if, they are present obligations that arose from past events and their fair value
Notes 13, 14 and 15 - Impairment of Non-financial Assets Note 17 - Use of Tax Losses Note 22 - Measurement of Defined Benefit Obligations Notes 21 and 37 - Provisions and Contingencies
The Companies have applied the Standards and Interpretations required to be adopted from the year ended March 31, 2018. These applications had no material effect on the consolidated financial statements.
can be measured with sufficient reliability. Non-controlling interests that are present ownership interests and entitle their holders to a proportionate share of the entity’s net assets in the event of liquidation are initially measured either at fair value or at the non-controlling interests’ proportionate share of the recognized amounts of the acquiree’s identifiable net assets. The choice of measurement basis is made on a transaction-by-transaction basis. Other types of non-controlling interests are measured at fair value or, when applicable, on the basis specified in another IFRS. Acquisition-related costs incurred by the Companies in connection with business combinations such as finder’s and legal fees, due diligence, and other professional or consulting fees are recognized as expenses when incurred. Additional acquisitions of non-controlling interests are accounted for as equity transactions, and no goodwill is recognized. The identifiable assets acquired, the liabilities and contingent liabilities assumed in accordance with the recognition principles of IFRS 3 are measured at their fair values at the acquisition date, except: Deferred tax assets or liabilities and liabilities (or assets) related to employee benefit arrangements are recognized and measured in accordance with International Accounting Standard No. 12 Income Taxes and International Accounting Standard No. 19 Employee Benefits, respectively; and
Non-current assets and operations classified as held for sale are measured in accordance with International Financial Reporting Standard No. 5 Non-current Assets Held for Sale and Discontinued Operations.
If the initial accounting for business combinations is incomplete by the end of the reporting period in which the business combinations occur, the Companies report provisional amounts for the items for which the acquisition accounting is incomplete. Those provisional amounts are
(1) Basis of Consolidation
(5) Changes in Accounting Policies
1. Business combinations

28Sumitomo Corporation Fact Book 2018
retrospectively adjusted during the measurement period to reflect new information obtained about facts and circumstances that existed at the acquisition date and, if known, would have affected the amounts recognized at that date. Additional assets or liabilities are recognized if new information, if known, would have resulted in the additional recognition of assets or liabilities. The measurement period does not exceed one year.
Subsidiaries are entities which are controlled by the Companies. The financial statements of subsidiaries are included in the consolidated financial statements from the date when control is obtained until the date when it is lost. The accounting policies of subsidiaries have been adjusted in order to ensure consistency with the accounting policies adopted by the Company, when necessary. The consolidated financial statements include the financial statements of certain subsidiaries, of which the end of the reporting period is different from that of the Company because it is impracticable to unify the end of the reporting period of the subsidiaries with that of the Company. Due to the requirement of local laws and regulations, it is impracticable to unify the closing dates with that of the Company. It is also impracticable to prepare additional financial statements as of the same date as the financial statements of the Company due to the characteristics of the local business and the IT environment for the accounting system. The difference between the end of the reporting period of subsidiaries and that of the Company does not exceed three months. When the financial statements of subsidiaries used in the preparation of the consolidated financial statements are prepared as of the dates different from the end of the reporting period of the Company, adjustments are made for the effects of significant transactions or events that occur between the end of the reporting period of the subsidiaries and that of the Company. On the disposal of interests in subsidiaries, if the Companies retain control over the subsidiaries, they are accounted for as equity transactions. Any difference between the adjustment to the non-controlling interests and the fair value of the consideration received is recognized directly in equity as “Equity attributable to owners of the parent.”
Business combinations of entities under common control are business combinations in which all the combining entities or businesses are ultimately controlled by the same party or parties both before and after the business combination, and
that control is not transitory. The Companies have consistently accounted for all such transactions based on carrying amounts.
Associates are entities over which the Companies have significant influence but do not have control to govern the financial and operating policies. Significant influence is presumed to exist when the Companies hold between 20 % and 50 % of the voting power of another entity. Investments in joint arrangements are classified as either joint operations or joint ventures depending on the contractual rights and obligations of each investor. The Companies account for the assets, liabilities, revenues and expenses relating to their interest in a joint operation in accordance with the IFRS applicable to the particular assets, liabilities, revenues and expenses. Investments in associates and joint ventures (“equity-accounted investees”) are accounted for using the equity method, and recognized at cost on acquisition. The investments include goodwill identified on acquisition (net of accumulated impairment losses). The Companies’ share of the income and expenses of the equity-accounted investees and changes in the Companies’ share in equity are included in the consolidated financial statements from the date when significant influence or joint control is obtained until the date when it is lost. The accounting policies of equity-accounted investees have been adjusted when necessary to ensure consistency with those applied by the Company. The consolidated financial statements include some equity-accounted investees, of which the end of the reporting period is different from that of the Company because it is impracticable to unify the end of the reporting date of those equity-accounted investees with that of the Company in connection with other shareholders and for other reasons. The end of the reporting period of those equity-accounted investees is mainly the end of December. Adjustments are made for the effects of significant transactions or events that occur due to differences in the end of the reporting period.
All inter-company transactions, balances, and any unrealized gains and losses arising from inter-company transactions, are eliminated in preparing the consolidated financial statements. Unrealized gains on transactions with equity-accounted investees are eliminated to the extent of the Companies’ interest in the investees. Unrealized losses are eliminated in the same way as unrealized gains unless there is evidence of impairment.
2. Subsidiaries
4. Associates and joint arrangements
5. Transactions eliminated in consolidation
3. Business combinations of entities under common control

29 Sumitomo Corporation Fact Book 2018
Financial Section
Foreign currency transactions are translated into functional currencies of individual companies using the spot exchange rate at the date of the transactions. At the end of each reporting period, monetary assets and liabilities denominated in foreign currencies are retranslated into functional currencies using the spot exchange rate at the reporting date. Exchange differences on monetary items are the differences between the amortized costs denominated in functional currencies at the beginning of the reporting period adjusted by effective interest and interest payments during the year, and the amortized costs denominated in foreign currencies translated using the spot exchange rate at the reporting date. Non-monetary assets and liabilities measured at fair value that are denominated in foreign currencies are retranslated using the spot exchange rates at the date when the fair value was determined. Exchange differences arising from retranslation are recognized in profit or loss. However, exchange differences arising from FVTOCI financial assets, hedges of a net investment in foreign operations (see 3. below) and cash-flow hedges are recognized in other comprehensive income. Non-monetary items measured at historical cost in foreign currencies are translated using the spot exchange rate at the date of the transaction.
Assets and liabilities of foreign operations (including goodwill and fair value adjustments arising on the acquisition of foreign operations) are translated into Japanese yen using the spot exchange rate at the reporting date. Income and expenses are translated into Japanese yen at the average exchange rate for the period. Exchange differences arising from translation of financial statements of foreign operations are recognized in other comprehensive income. These differences are presented as “Exchange differences on translating foreign operations” in Other components of equity after the date of transition to IFRSs. On disposal of the entire interest in foreign operations and on the partial disposal of the interest involving loss of control, significant influence or joint control, the cumulative amount of the exchange differences is reclassified to profit or loss as a part of gains or losses on disposal.
The Companies apply hedge accounting to a part of the exchange differences arising between the functional currencies of foreign operations and the Company’s functional currency (Japanese Yen), regardless of whether
investments in foreign operations are held directly by the Company or indirectly through its subsidiaries. Exchange differences arising from the retranslation of financial instruments designated as hedging instruments for a net investment in foreign operations are recognized in other comprehensive income to the extent that the hedge is effective, and are presented as “Exchange differences on translating foreign operations” in Other components of equity. The ineffective portion of the gains or losses on the hedging instruments is recognized in profit or loss. On disposal of hedged portion of net investments, the cumulative amount of exchange differences is reclassified to profit or loss as a part of gains or losses on disposal.
The Companies have early-applied International Financial Reporting Standard No. 9 Financial Instruments (issued in November 2009, revised in October 2010) (“IFRS 9”) to the accounting for financial instruments.
The Companies recognize trade and other receivables on the date they are originated. All other financial assets are recognized on the contract date when the Companies become a party to the contractual provisions of the instrument. The following is a summary of the classification and measurement model of the non-derivative financial assets;
Financial assets measured at amortized costFinancial assets that meet the following conditions are subsequently measured at amortized cost: The asset is held within a business model whose objective is to hold assets in order to collect contractual cash flows; and
The contractual terms of the instrument give rise on specified dates to cash flows that are solely payments of principal and interest on the principal amount outstanding.
Financial assets measured at amortized cost are initially measured at fair value (plus directly attributable transaction costs). Subsequently, the carrying amount of the financial assets measured at amortized cost is calculated using the effective interest method, less impairment loss when necessary.
Financial assets measured at FVTPLFinancial assets other than equity instruments that do not meet the above conditions in relation to amortized cost measurement are measured at FVTPL. Those financial assets include financial assets held for trading.
(2) Foreign Currencies
(3) Financial Instruments
1. Foreign currency transactions
1. Non-derivative financial assets
2. Foreign operations
3. Hedges of a net investment in foreign operations
30Sumitomo Corporation Fact Book 2018
Equity investments are measured at fair value with gains or losses on re-measurement recognized in profit or loss unless the Companies make an irrevocable election to measure equity investments at FVTOCI on initial recognition. Financial assets measured at FVTPL are initially measured at fair value and transaction costs are recognized in profit or loss when they occur.
Financial assets measured at FVTOCIOn initial recognition, the Companies may make an irrevocable election to measure investments in equity instruments at FVTOCI. The election is made only for the equity investment other than held for trading. Financial assets measured at FVTOCI are initially measured at their fair value (including directly attributable transaction costs). Subsequently, they are measured at fair value, and gains and losses arising from changes in fair value are recognized in other comprehensive income and presented as “Financial assets measured at fair value through other comprehensive income” in Other components of equity. The amount of Other components of equity is transferred directly to retained earnings, not to profit or loss, when the equity investment is derecognized or the decline in its fair value compared to its acquisition cost is significant and other-than-temporary. However, dividends on financial assets measured at FVTOCI are recognized in profit or loss as finance income.
Derecognition of financial assetsThe Companies derecognize a financial asset when the contractual rights to the cash flows from the asset expire, or when the Companies transfer the contractual rights to receive cash flows from financial assets in transactions in which substantially all the risks and rewards of ownership of the asset are transferred to another entity. Any interests in transferred financial assets that qualify for derecognition that is created or retained by the Companies are recognized as a separate asset or liability.
Cash and cash equivalents are cash and highly liquid investments that are readily convertible to known amounts of cash, including short-term time deposits with original maturities of three months or less.
Debt securities issued are initially recognized on the issue date. All other financial liabilities are recognized when the Companies become a party to the contractual provisions of the instruments. The Companies derecognize financial liabilities when
they are extinguished, i.e. when the obligation specified in the contract is discharged, cancelled or expired. The Companies classify borrowings, corporate bonds, trade payables and other payables as non-derivative financial liabilities, and initially measure them at fair value (minus directly attributable transaction costs). Non-derivative financial liabilities held for trading are measured at fair value after initial recognition and the change in fair value is recognized in profit or loss. Non-derivative financial liabilities held for other than trading are measured at amortized cost using the effective interest method after initial recognition.
Common stockProceeds from issuance of equity instruments by the Company are included in “Common stock” and “Additional paid-in capital.” The direct issue costs (net of tax) are deducted from “Additional paid-in capital.”
Treasury stockWhen the Companies reacquire treasury stocks, the consideration paid, net of direct transaction costs and tax, is recognized as a deduction from equity. When the Companies sell treasury stocks, the consideration received is recognized as an increase in equity.
The Companies utilize derivatives to manage interest rate risk, foreign currency risk and the risk of the price fluctuation of commodity inventories and trading commitments. The primary derivatives used by the Companies include foreign exchange forward contracts, currency swaps, interest rate swaps and commodity future contracts. At the initial designation of the hedging relationship, the Companies document the relationship between the hedging instrument and the hedged item, along with their risk management objective and strategy for undertaking the hedge, the hedging instrument, the hedged item, the nature of the risk being hedged, and how the hedging instrument’s effectiveness in offsetting the hedged risk will be assessed. At the inception of the hedge and on an ongoing basis, the Companies assess whether the hedging instrument is highly effective in offsetting changes in fair values or cash flows of the hedged item attributable to the hedged risk throughout the period for which the hedge is designated. To qualify as a cash flow hedge of a forecast transaction, the transaction must be highly probable. Derivatives are initially recognized at fair value with transaction costs recognized in profit or loss when they occur. Subsequently, derivatives are measured at fair value,
4. Equity
5. Derivatives including hedge accounting
2. Cash and cash equivalents
3. Non-derivative financial liabilities
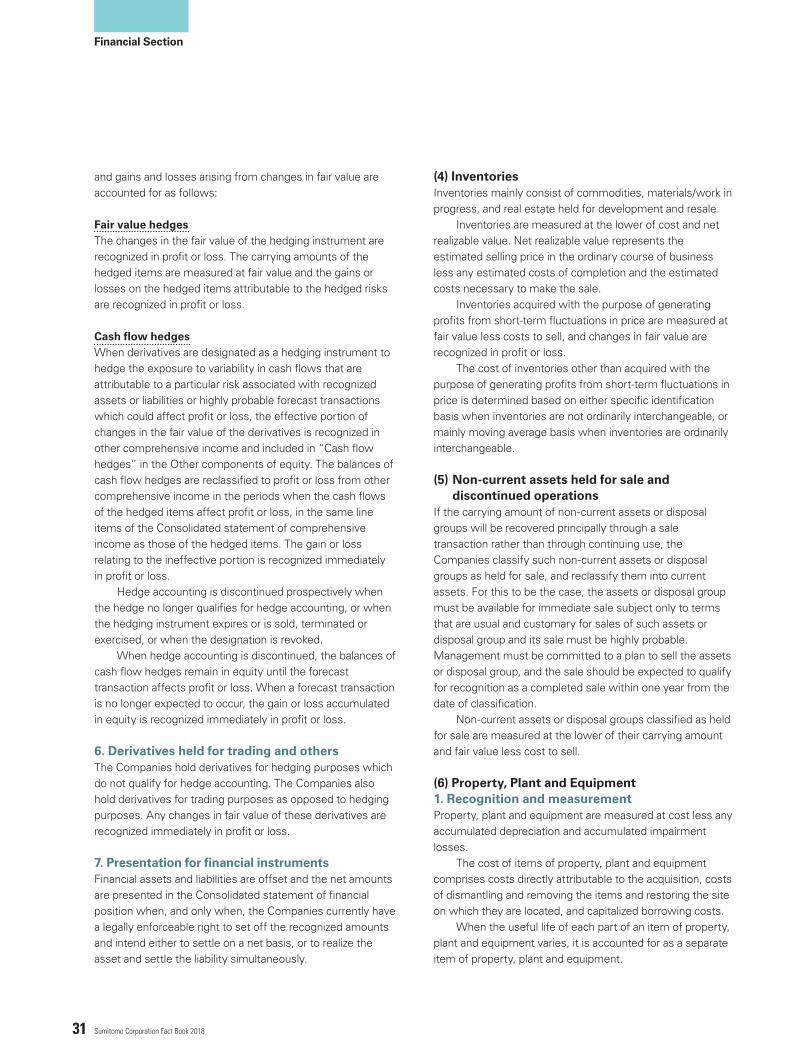
31 Sumitomo Corporation Fact Book 2018
Financial Section
and gains and losses arising from changes in fair value are accounted for as follows:
Fair value hedgesThe changes in the fair value of the hedging instrument are recognized in profit or loss. The carrying amounts of the hedged items are measured at fair value and the gains or losses on the hedged items attributable to the hedged risks are recognized in profit or loss.
Cash flow hedgesWhen derivatives are designated as a hedging instrument to hedge the exposure to variability in cash flows that are attributable to a particular risk associated with recognized assets or liabilities or highly probable forecast transactions which could affect profit or loss, the effective portion of changes in the fair value of the derivatives is recognized in other comprehensive income and included in “Cash flow hedges” in the Other components of equity. The balances of cash flow hedges are reclassified to profit or loss from other comprehensive income in the periods when the cash flows of the hedged items affect profit or loss, in the same line items of the Consolidated statement of comprehensive income as those of the hedged items. The gain or loss relating to the ineffective portion is recognized immediately in profit or loss. Hedge accounting is discontinued prospectively when the hedge no longer qualifies for hedge accounting, or when the hedging instrument expires or is sold, terminated or exercised, or when the designation is revoked. When hedge accounting is discontinued, the balances of cash flow hedges remain in equity until the forecast transaction affects profit or loss. When a forecast transaction is no longer expected to occur, the gain or loss accumulated in equity is recognized immediately in profit or loss.
The Companies hold derivatives for hedging purposes which do not qualify for hedge accounting. The Companies also hold derivatives for trading purposes as opposed to hedging purposes. Any changes in fair value of these derivatives are recognized immediately in profit or loss.
Financial assets and liabilities are offset and the net amounts are presented in the Consolidated statement of financial position when, and only when, the Companies currently have a legally enforceable right to set off the recognized amounts and intend either to settle on a net basis, or to realize the asset and settle the liability simultaneously.
Inventories mainly consist of commodities, materials/work in progress, and real estate held for development and resale. Inventories are measured at the lower of cost and net realizable value. Net realizable value represents the estimated selling price in the ordinary course of business less any estimated costs of completion and the estimated costs necessary to make the sale. Inventories acquired with the purpose of generating profits from short-term fluctuations in price are measured at fair value less costs to sell, and changes in fair value are recognized in profit or loss. The cost of inventories other than acquired with the purpose of generating profits from short-term fluctuations in price is determined based on either specific identification basis when inventories are not ordinarily interchangeable, or mainly moving average basis when inventories are ordinarily interchangeable.
If the carrying amount of non-current assets or disposal groups will be recovered principally through a sale transaction rather than through continuing use, the Companies classify such non-current assets or disposal groups as held for sale, and reclassify them into current assets. For this to be the case, the assets or disposal group must be available for immediate sale subject only to terms that are usual and customary for sales of such assets or disposal group and its sale must be highly probable. Management must be committed to a plan to sell the assets or disposal group, and the sale should be expected to qualify for recognition as a completed sale within one year from the date of classification. Non-current assets or disposal groups classified as held for sale are measured at the lower of their carrying amount and fair value less cost to sell.
Property, plant and equipment are measured at cost less any accumulated depreciation and accumulated impairment losses. The cost of items of property, plant and equipment comprises costs directly attributable to the acquisition, costs of dismantling and removing the items and restoring the site on which they are located, and capitalized borrowing costs. When the useful life of each part of an item of property, plant and equipment varies, it is accounted for as a separate item of property, plant and equipment.
(4) Inventories
(6) Property, Plant and Equipment
(5) Non-current assets held for sale and discontinued operations
6. Derivatives held for trading and others
1. Recognition and measurement
7. Presentation for financial instruments
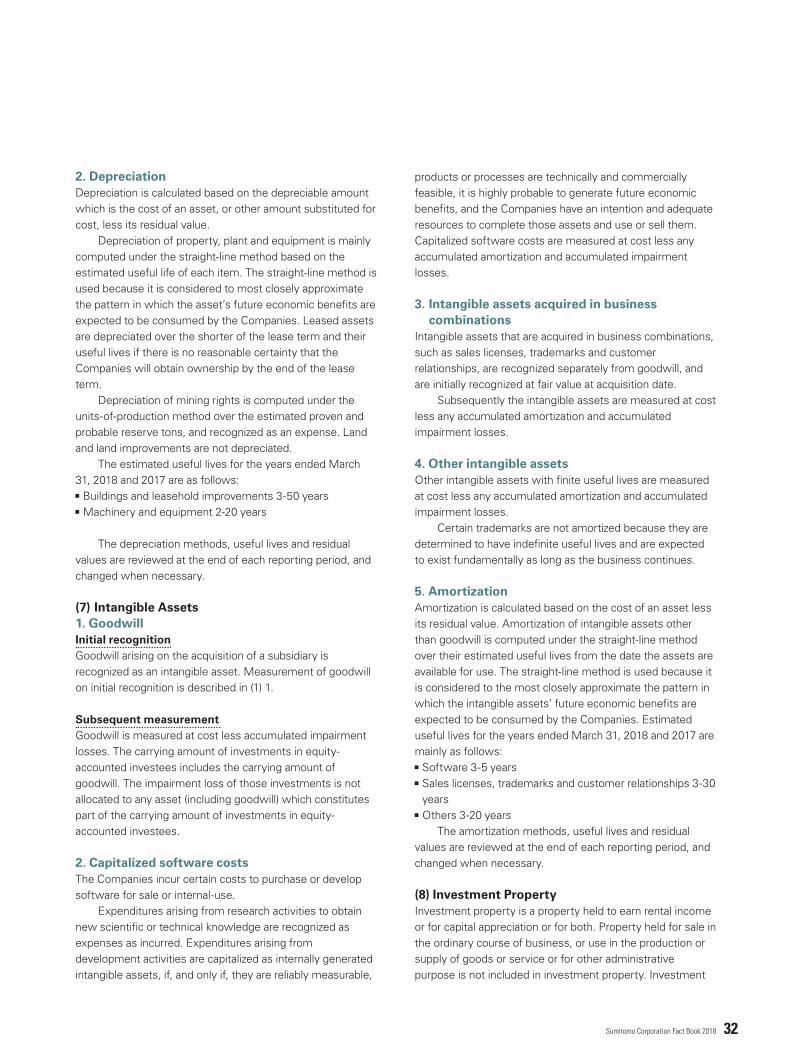
32Sumitomo Corporation Fact Book 2018
Depreciation is calculated based on the depreciable amount which is the cost of an asset, or other amount substituted for cost, less its residual value. Depreciation of property, plant and equipment is mainly computed under the straight-line method based on the estimated useful life of each item. The straight-line method is used because it is considered to most closely approximate the pattern in which the asset’s future economic benefits are expected to be consumed by the Companies. Leased assets are depreciated over the shorter of the lease term and their useful lives if there is no reasonable certainty that the Companies will obtain ownership by the end of the lease term. Depreciation of mining rights is computed under the units-of-production method over the estimated proven and probable reserve tons, and recognized as an expense. Land and land improvements are not depreciated. The estimated useful lives for the years ended March 31, 2018 and 2017 are as follows: Buildings and leasehold improvements 3-50 years Machinery and equipment 2-20 years
The depreciation methods, useful lives and residual values are reviewed at the end of each reporting period, and changed when necessary.
Initial recognitionGoodwill arising on the acquisition of a subsidiary is recognized as an intangible asset. Measurement of goodwill on initial recognition is described in (1) 1.
Subsequent measurementGoodwill is measured at cost less accumulated impairment losses. The carrying amount of investments in equity-accounted investees includes the carrying amount of goodwill. The impairment loss of those investments is not allocated to any asset (including goodwill) which constitutes part of the carrying amount of investments in equity-accounted investees.
The Companies incur certain costs to purchase or develop software for sale or internal-use. Expenditures arising from research activities to obtain new scientific or technical knowledge are recognized as expenses as incurred. Expenditures arising from development activities are capitalized as internally generated intangible assets, if, and only if, they are reliably measurable,
products or processes are technically and commercially feasible, it is highly probable to generate future economic benefits, and the Companies have an intention and adequate resources to complete those assets and use or sell them. Capitalized software costs are measured at cost less any accumulated amortization and accumulated impairment losses.
Intangible assets that are acquired in business combinations, such as sales licenses, trademarks and customer relationships, are recognized separately from goodwill, and are initially recognized at fair value at acquisition date. Subsequently the intangible assets are measured at cost less any accumulated amortization and accumulated impairment losses.
Other intangible assets with finite useful lives are measured at cost less any accumulated amortization and accumulated impairment losses. Certain trademarks are not amortized because they are determined to have indefinite useful lives and are expected to exist fundamentally as long as the business continues.
Amortization is calculated based on the cost of an asset less its residual value. Amortization of intangible assets other than goodwill is computed under the straight-line method over their estimated useful lives from the date the assets are available for use. The straight-line method is used because it is considered to the most closely approximate the pattern in which the intangible assets’ future economic benefits are expected to be consumed by the Companies. Estimated useful lives for the years ended March 31, 2018 and 2017 are mainly as follows: Software 3-5 years Sales licenses, trademarks and customer relationships 3-30 years
Others 3-20 years The amortization methods, useful lives and residual values are reviewed at the end of each reporting period, and changed when necessary.
Investment property is a property held to earn rental income or for capital appreciation or for both. Property held for sale in the ordinary course of business, or use in the production or supply of goods or service or for other administrative purpose is not included in investment property. Investment
3. Intangible assets acquired in business combinations
4. Other intangible assets
5. Amortization
2. Capitalized software costs
(7) Intangible Assets
(8) Investment Property
1. Goodwill
2. Depreciation

33 Sumitomo Corporation Fact Book 2018
Financial Section
property is measured at cost less any accumulated depreciation (see (6) 2.) and accumulated impairment losses.
Leases are classified as finance leases when lessor transfers substantially all the risks and rewards of ownership to the Companies. Leased assets are initially recognized at fair value or, if lower, at the present value of the minimum lease payments. Subsequent to initial recognition, the leased assets are accounted for in accordance with the accounting policies applicable to the assets. All other leases are classified as operating leases, and are not reported in the Companies’ Consolidated statement of financial position.
Financial assets measured at amortized cost are assessed on a quarterly basis whether there is objective evidence that the asset may be impaired. Financial assets are considered to be impaired when there is objective evidence which indicates that loss events have occurred after the initial recognition of the assets, and when it is reasonably anticipated that the loss events have a negative impact on the estimated future cash flows of the assets. Objective evidence of impairment for financial assets measured at amortized cost includes: a default or delinquency of the borrower, granting the borrower a concession that the Companies would not otherwise consider, indications for bankruptcy of the issuer or obligor and the disappearance of active markets. The Companies assess whether evidence of impairment exists individually and collectively for financial assets measured at amortized cost. An individually significant financial asset is individually assessed for impairment. All individually significant financial assets found not to be specifically impaired are then collectively assessed for any impairment that has been incurred, but not yet reported. Financial assets that are not individually significant are collectively assessed for impairment in a group of financial assets with similar risk characteristics. In assessing collective impairment, the Companies evaluate historical trends of the probability of default, timing of recoveries and the amount of loss incurred. In addition, an adjustment is made to reflect management judgment on whether current economic and credit conditions are such that the actual losses are likely to be greater or less than suggested by historical trends. The impairment loss for financial assets measured at amortized cost is measured as the difference between the asset’s carrying amount and the present value of estimated
future cash flows discounted at the asset’s original effective interest rate, and recognized in profit or loss. Interest on the impaired assets continues to be recognized through unwinding of the discount. If there are events which decrease the amount of impairment after the recognition of the impairment, the reversal of the impairment loss is recognized in profit or loss.
At the end of each reporting period, the carrying amounts of non-financial assets, excluding inventories, biological assets and deferred tax assets, are assessed to determine whether there is any indication of impairment. If any such indication exists, the recoverable amount of the non-financial asset is estimated. Regarding goodwill and intangible assets with indefinite useful lives, and intangible assets not yet available for use, the recoverable amount is estimated at the same time every year. The recoverable amount of an asset or a cash-generating unit (“CGU”) is the higher of its value in use and its fair value less costs to sell. In assessing value in use, the estimated future cash flows are discounted to their present value using a pre-tax discount rate that reflects the time value of money and the risks specific to the asset. A CGU is the smallest group of assets which generates cash inflows from continuing use that are largely independent of the cash inflows from other assets or groups of assets. A CGU of goodwill is determined based on the unit by which the goodwill is monitored for internal management purposes, and does not exceed an operating segment before aggregation. Because the corporate assets do not generate independent cash inflows, if there is an indication that corporate assets may be impaired, the recoverable amount is determined for the CGU to which the corporate assets belong. If the carrying amount of an asset or a CGU exceeds the recoverable amount, an impairment loss is recognized in profit or loss. The impairment loss recognized related to a CGU is allocated first to reduce the carrying amount of any goodwill allocated to the unit and then to the other assets of the unit on a pro-rata basis based on the carrying amount of each asset in the unit. An impairment loss recognized for goodwill is not reversed in subsequent periods. Assets other than goodwill are reviewed at the end of each reporting period to determine whether there is any indication that an impairment loss recognized in prior years may no longer exist or may have decreased. An impairment loss recognized in prior years for an asset is reversed to profit or loss if an event occurs that changes the estimates used to determine the
(9) Leased Assets
(10) Impairment1. Non-derivative financial assets
2. Non-financial assets

34Sumitomo Corporation Fact Book 2018
asset’s recoverable amount. A reversal of impairment loss does not exceed the carrying amount, net of depreciation and amortization, that would have been determined if no impairment loss had been recognized for the asset for prior years. Goodwill that forms part of the carrying amount of investments in equity-accounted investees is not separately recognized, and it is not tested for impairment separately. The entire carrying amount of the investments is tested for impairment as a single asset, whenever there is any objective evidence that the investments are impaired.
Defined benefit plans are post-employment benefit plans other than defined contribution plans (see 2. below). The Companies’ net defined benefit obligations are calculated separately for each plan by estimating the future amount of benefit that employees have earned in exchange for their service for the previous years. The benefits are discounted to determine the present value, and fair value of plan assets is deducted. The discount rates are equivalent to the market yields of AA credit-rated corporate bonds at the end of each reporting period that have maturity terms approximating those of the Companies’ obligations. These calculations are performed annually by qualified actuaries using the projected unit credit method. When plan amendments are made, the change in defined benefit obligations related to past service by employees is recognized in profit or loss immediately. The Companies recognize remeasurements of the net defined benefit liability (asset) in other comprehensive income and immediately reclassify them from Other components of equity to retained earnings.
The employees of certain subsidiaries are provided with defined contribution plans. Defined contribution plans are post-employment benefit plans in which the Companies pay fixed contributions into separate entities and will have no legal or constructive obligation to make further contributions. The Obligations for contributions to defined contribution plans are recognized as an expense during the period when the service is rendered. Certain subsidiaries participate in multi-employer plans in addition to lump-sum benefit plans or pension benefit plans, and recognize the contribution during a period as an expense in profit or loss and contribution payable as a liability. Other than the above, the Company and certain subsidiaries have elective defined contribution pension plans
for employees who elect to contribute a portion of their bonuses received for their services rendered during the year.
Short-term employee benefits are measured on an undiscounted basis and are expensed during the period when the service is rendered. Bonus accrual is recognized as a liability, when the Companies have present legal or constructive obligations to pay as a result of past employee service, and when reliable estimates of the obligation can be made.
The Companies have stock option plans as incentive plans for directors, executive officers, and corporate officers under the Companies’ grade system. The fair value of stock options at the grant date is recognized as an employee expense over the vesting period from the grant date as a corresponding increase in equity. The fair value of the stock options is measured using the Black-Scholes or other model, taking into account the terms of the options granted. The Companies regularly review the assumptions made and revise estimates of the number of options that are expected to vest, when necessary.
Provisions are recognized when the Companies have present legal or constructive obligations as a result of past events, it is probable that outflows of resources embodying economic benefits will be required to settle the obligations, and reliable estimates can be made of the amount of the obligations. Provisions are discounted to their present value using a pre-tax rate that reflects the time value of money and the risks specific to the liability. The unwinding of the discount is recognized as finance costs.
Asset retirement obligationsThe Companies account for asset retirement obligations mainly related to the dismantlement of crude oil, coal, and ore mining and drilling facilities in accordance with the Companies’ published environmental policies and the requirements of laws and regulations applicable to the Companies.
Revenue is measured at the fair value of the consideration for goods sold and services provided in the ordinary course of business, less sales related taxes. Revenue from the sale of goods is recognized when all the following conditions have been satisfied:
3. Short-term employee benefits
4. Share-based payments(11) Employee Benefits
(12) Provisions
(13) Revenue
1. Defined benefit plans
2. Defined contribution plans

35 Sumitomo Corporation Fact Book 2018
Financial Section
the Companies have transferred to the buyer the significant risks and rewards of ownership of the goods;
the Companies retain neither continuing managerial involvement to the degree usually associated with ownership nor effective control over the goods sold;
the amount of revenue can be measured reliably; it is probable that the economic benefits associated with the transaction will flow to the Companies; and
the costs incurred in respect of the transaction can be measured reliably.
The outcome of a transaction involving rendering services can be estimated reliably, and revenue is recognized by reference to the stage of completion of the transaction at the end of the reporting period, when all the following conditions are satisfied: the amount of revenue can be measured reliably; it is probable that the economic benefits associated with the transaction will flow to the entity;
the stage of completion of the transaction at the end of the reporting period can be measured reliably; and
the costs incurred for the transaction and the costs to complete the transaction can be measured reliably.
When the outcome of the transaction involving the rendering of services cannot be estimated reliably, revenue is recognized only to the extent of the expenses recognized that are recoverable.
The policies on revenue recognition, multiple-element transactions, and gross versus net in presentation of revenue are as follows;
The Companies generate revenue from sales of tangible products (a) in connection with the Companies’ wholesale, retail, manufacturing and processing operations, (b) in connection with the Companies’ real estate operations, and (c) under long-term construction contracts, etc.
(a) Wholesale, retail, manufacturing and processing operations
The Companies recognize revenue from sales of tangible products in connection with the Companies’ wholesale, retail, manufacturing and processing operations when there is persuasive evidence such as the execution of a transaction based on a sales contract, that is, when the Companies have transferred to the buyer the significant risks and rewards of ownership of the goods, and it is probable that the economic benefits associated with the transaction will flow to the Companies, and the costs incurred in respect of the
transaction and the possibility of product returns can be estimated reasonably, and the Companies do not retain continuing managerial involvement over the goods sold, and the amount of revenue can be measured reliably. Depending upon the terms of the contract, this may occur at the time of delivery or shipment or upon the attainment of customer acceptance. The conditions of acceptance are governed by the terms of the contract or customer arrangement and those not meeting the predetermined specifications are not recognized as revenue until the attainment of customer acceptance. The Companies’ policy is not to accept product returns unless the products are defective. The Companies have no material exposure to losses under warranty provisions. Such losses are recognized when probable and estimable. The amounts of rebates and discounts are deducted from revenue, and they are not material. The Companies recognize revenue upon delivery, shipment, or upon the attainment of customer acceptance for steel service center operations in which the Companies process and cut steel sheets to customer specifications (Metal Products Business Unit), dealership operations in which the Companies sell automobiles to general consumers and distribute construction equipment and machinery to construction companies (Transportation & Construction Systems Business Unit), retail business operations such as supermarkets and drugstores (Media, ICT, Lifestyle Related Goods & Services Business Unit), and plastic products (Mineral Resources, Energy, Chemical & Electronics Business Unit).
(b) Real estate operationsRevenue from the sale of land, office buildings, and condominiums is recognized when all the following conditions are satisfied: the companies have transferred to the buyer the significant risks and rewards of ownership of the asset sold;
the companies retain neither continuing managerial involvement to the degree usually associated with ownership nor effective control over the asset sold;
the amount of revenue can be measured reliably; it is probable that the economic benefits associated with the transaction will flow to the Companies;
the costs incurred or to be incurred in respect of the transaction can be measured reliably; and
there are no significant clauses in sales agreements that oblige the Companies to complete the asset sold.
For sale transactions with some degree of continuing managerial involvement (for example, guarantee to the buyer), revenue recognized at the date of sale is reduced by the estimated exposure to loss measured at the fair value
(9) Leased Assets
(10) Impairment1. Non-derivative financial assets
1. Revenue from sales of tangible products

36Sumitomo Corporation Fact Book 2018
related to the continuing involvement. In circumstances where the terms of the transaction provide for the Companies to receive additional consideration which is contingent upon fulfillment of certain conditions without risk of loss, and the transaction otherwise qualifies for profit recognition, the contingent future profits are recognized when the contingency is resolved. In those cases where the Companies transfer to the buyer control and significant risks and rewards of ownership of the work in progress in its current state as construction progresses, and if all the criteria described above are met, revenue is recognized using the percentage of completion (“POC”) method in accordance with IFRIC Interpretation 15 Agreements for the Construction of Real Estate.
(c) Long-term construction contracts, etc.The Companies generate revenue from sales of tangible products under long-term construction contracts, etc., principally in connection with the construction of power plants in which the Companies provide engineering, procurement and construction service (Environment & Infrastructure Business Unit), and software development business in which the Companies customize the software to customer specifications (Media, ICT, Lifestyle Related Goods & Services Business Unit). Revenue from fixed price long-term construction contracts, etc., is recognized when the outcome of a contract can be estimated reliably. Revenue and costs are recognized generally by the POC method. Under the POC method, revenue is recognized by reference to the stage of completion measured based on the proportion of contract costs incurred for work performed to date relative to the estimated total contract costs. If circumstances arise that may change the original estimates of revenues, costs, or extent of progress toward completion, then, revisions to the estimates are made. These revisions may result in increases or decreases in estimated revenues or estimated costs, and such revisions are reflected in profit or loss in which the circumstances that give rise to the revision become known by management. When the outcome of a contract cannot be estimated reliably, contract revenue is recognized to the extent that it is probable that contract costs incurred will be recoverable. Contract costs are recognized as expenses in the period in which they are incurred. The Companies review the cost performance and estimates to complete projections on its contracts at least on a quarterly basis. The impact of revisions of profit estimates on fixed price contracts is recognized in the period in which the revisions are made. The expected losses on fixed price contracts are recognized as an expense when such losses
can be estimated. Provisions are recognized for contingent liabilities in the period in which they become known and estimable pursuant to specific contract terms and conditions. When costs incurred by the end of reporting period plus recognized profits (less recognized losses) exceed progress billings, the surplus is presented as receivables from customers. For contracts where progress billings exceed contract costs incurred by the end of the reporting period plus recognized profits (less recognized losses), the surplus is presented as payables to customers. Amounts received before the related work is performed are recognized as liabilities and are included in “Advances from customers” in the Consolidated statement of financial position. Amounts billed for work performed but not yet paid by the customer are reported in the Consolidated statement of financial position and recognized as “Trade and other receivables” and some other assets.
The Companies also generate revenue from sales of services and others in connection with (a) services related to customized software development, (b) loans, finance leases and operating leases of commercial real estate, automobiles and vessels, and (c) other service arrangements to suppliers and customers such as arranging finance and coordinating logistics in connection with trading activities.
(a) Services related to customized software developmentRevenue from services contracts related to customized software development to customer specifications is recognized by reference to the stage of completion of the contract activity at the end of the reporting period. The stage of completion is estimated by reference to the proportion of contracts cost incurred for work performed to date. Revenue from maintenance is recognized over the contractual period or as the services are rendered (Media, ICT, Lifestyle Related Goods & Services Business Unit). (b) Loans, finance leases and operating leases of commercial real estate, automobiles and vesselsRevenue from loans is recognized using the effective interest method over the terms of the loans, which is the rate that exactly discounts the estimated future cash receipts through the expected residual period of the financial asset to that asset’s net carrying amount. Revenue from finance leases is calculated using the interest rate implicit in the lease, which is the discount rate that results in the aggregate present value of the minimum lease payments and the unguaranteed residual value to be equal to the sum of the fair value of the leased asset and any initial direct costs of the lessor.
2. Revenue from sales of services and others

37 Sumitomo Corporation Fact Book 2018
Financial Section
Revenue from operating leases is recognized in profit or loss on a straight-line basis over the lease term.The Companies recognize revenue from operating leases in connection with vessels leased to shipping companies (Transportation & Construction Systems Business Unit) and rental of commercial real estate (Media, ICT, Lifestyle Related Goods & Services Business Unit).
(c) Other service arrangements to suppliers and customers such as arranging finance and coordinating logistics in connection with trading activities
Revenue from other service arrangements includes transactions in which the Companies act between customer and supplier as an agent or a broker to provide such services as arranging finance or coordinating logistics in connection with trading activities. Such revenue is recognized when the contracted services are rendered.
The Companies enter into multiple-element transactions related revenue arrangements, which may include any combination of products, equipment, software, installation services and/or financing. A multiple-element arrangement is separated into more than one unit of accounting if all of the following criteria are met: the delivered element(s) has (have) the standalone value to the customer;
there is objective and reliable evidence of the fair value of the undelivered element(s); and
if the arrangement includes a general right of return relative to the delivered element(s), the delivery or performance of the undelivered element(s) is considered probable and substantially in the control of the Companies.
If these criteria are not met, revenue is deferred until the earlier of when such criteria are met or when all of the undelivered elements are delivered. If there is objective and reliable evidence of fair value for all units of accounting in an arrangement, the arrangement consideration is allocated to the separate units of accounting based on each unit’s relative fair value. There may be cases, however, in which there is objective and reliable evidence of fair value of the undelivered element(s) but no such evidence for the delivered element(s). In those cases, the residual method is used to allocate the arrangement consideration. Under the residual method, the amount of consideration allocated to the delivered element(s) equals the total arrangement consideration less the aggregate fair value of the undelivered element(s).
In the ordinary course of business, the Companies frequently act as an intermediary or an agent in executing transactions with third parties. In these arrangements, the Companies determine whether to report revenue based on the “gross” amount billed to the ultimate customer for tangible products or services provided or on the “net” amount received from the customer after commissions and other payments to third parties. However, the amounts of “Gross profit” and “Profit for the year attributable to owners of the parent” are not affected by whether revenue is reported on a gross or net basis. Determining whether revenue should be reported in gross or net is based on an assessment of whether the Companies are acting as a “principal” or an “agent” in a transaction. Accordingly, to the extent that the Companies are acting as a principal in a transaction, the Companies report revenue on a gross basis and to the extent that the Companies are acting as an agent in a transaction, the Companies report revenue on a net basis. The determination of whether the Companies are acting as a principal or an agent in a transaction involves judgment and is based on an evaluation of the terms of an arrangement with respect to exposure to the significant risks and rewards associated with the sale of tangible products or the rendering of services. Factors that indicate that the Companies act as a principal, and thus recognize revenue on a gross basis include: the Companies have the primary responsibility for providing the goods or services to the customer or for fulfilling the orders;
the Companies have inventory risk before or after the customer order, during shipping or on return;
the Companies have latitude in establishing prices, either directly or indirectly; and
the Companies bear the customer’s credit risk for the amount receivable from the customer.
Factors that indicate that the Companies act as an agent, and thus recognize revenue on a net basis include: the consideration of services rendered (commission or fee) is fixed; and
the consideration is determined by multiplying the amount of goods and services provided to customers by a stated percentage.
Operating lease payments are recognized in profit or loss on a straight-line basis over the lease term. Lease incentives are deemed as inseparable part of the total lease payments and are recognized over the lease term.
(9) Leased Assets
(14) Lease Payments
(10) Impairment1. Non-derivative financial assets
3. Multiple-element arrangements
4. Gross versus net

38Sumitomo Corporation Fact Book 2018
Minimum lease payments made under finance leases are allocated to finance costs and the reduction of the outstanding liabilities. Finance costs are allocated to each period during the lease term so as to produce a constant rate of interest on the remaining balance of liabilities. Contingent fees are accounted for as adjustments to minimum lease payments over the remaining lease term, when an adjustment to the lease payments becomes certain. The Companies assess whether an arrangement is, or contains, a lease at the inception of the arrangement. If fulfillment of the arrangement is dependent on the use of a specific asset, it contains a lease. Arrangements convey the right to use the assets when the arrangements convey to the Companies the right to control the use of the underlying assets. Payments and other consideration required by the arrangements are allocated at the inception of the arrangements or upon a reassessment of the arrangements into lease payments and payments of other elements on the basis of their relative fair values. If the Companies conclude that it is impracticable to separate the payments for finance leases reliably, assets and liabilities are recognized at the amount equal to the fair value of the underlying assets. Subsequently, the liabilities are reduced as payments are made and finance costs incurred on liabilities are recognized using the Companies’ incremental borrowing rate.
Finance income mainly comprises interest income, dividend income, gains on sale of securities, changes in fair value of financial assets measured at FVTPL, gains on hedging instruments recognized in profit or loss. Interest income is recognized when incurred using the effective interest method. Dividend income is recognized on the date when the right to receive payment is established. Interest income from a financial asset (excluding financial assets measured at FVTPL) is accrued using the effective interest method. Finance costs mainly comprise interest expense, losses on sale of securities, changes in fair value of financial assets measured at FVTPL, impairment loss on financial assets, losses on hedging instruments recognized in profit or loss. Borrowing costs that are not directly attributable to the acquisition, construction or production of qualifying assets are recognized in profit or loss using the effective interest method.
Borrowing costs directly attributable to the acquisition, construction or production of certain qualifying assets, which take a considerable period of time to get ready for their intended use or sale, are added to the costs of those assets,
until the assets are substantially ready for their intended use or sale. All other borrowing costs are recognized in profit or loss when incurred.
Income taxes comprise current taxes and deferred taxes. These are recognized in profit or loss, except for the taxes which arise from business combinations or are recognized either in other comprehensive income or directly in equity. Current taxes are the expected taxes payables or receivables on the taxable profit, using the tax rates enacted or substantially enacted by the end of the reporting period, adjusted by taxes payables or receivables in prior years. Deferred tax assets and liabilities are recognized on temporary differences between the carrying amounts of assets and liabilities for accounting purposes and their tax basis. Deferred tax assets and liabilities are not recognized if the temporary difference arises from the initial recognition of an asset or liability in a transaction which is not related to a business combination and, at the time of transaction, affects neither accounting profit nor taxable profit. Deferred tax liabilities are not recognized if the taxable temporary difference arises from the initial recognition of goodwill. Deferred tax liabilities are recognized for taxable temporary differences associated with investments in subsidiaries, associates and joint arrangements. However, if the Companies are able to control the timing of the reversal of the temporary differences and it is probable that the temporary differences will not reverse in the foreseeable future, deferred tax liabilities are not recognized. Deferred tax assets arising from deductible temporary differences associated with investments in subsidiaries, associates and joint arrangements are recognized only to the extent that it is probable that there will be sufficient taxable profit against which the benefit of temporary differences can be utilized and the temporary differences will reverse in the foreseeable future. Deferred tax assets and liabilities are measured at the tax rates that are expected to apply in the period when the temporary differences will reverse, based on tax laws that have been enacted or substantively enacted by the end of reporting period. Deferred tax assets and deferred tax liabilities are offset when: there is a legally enforceable right to offset current tax assets against current tax liabilities; and income taxes are levied by the same taxation authority on either the same taxable entity or different taxable entities which intend either to settle current tax assets and liabilities on a net basis, or to realize the assets and settle the liabilities simultaneously. Deferred tax assets are recognized for unused tax
(15) Finance Income and Costs
(17) Income Taxes
(16) Borrowing Costs

39 Sumitomo Corporation Fact Book 2018
Financial Section
losses, tax credits and deductible temporary differences, to the extent that it is probable that future taxable profits will be available against which they can be utilized. Deferred tax assets are reviewed at the end of each reporting period and reduced to the extent that it is no longer probable that the related tax benefits will be realized.
The Companies disclose basic and diluted earnings per share (attributable to owners of the parent) related to common stock. Basic earnings per share is calculated by dividing profit for the year (attributable to owners of the parent) by the weighted average number of common stock outstanding during the reporting period, adjusted for the number of treasury stock acquired. For the purpose of calculating
diluted earnings per share, profit for the year (attributable to owners of the parent) and the weighted average number of common stock outstanding, adjusted for the number of treasury stock, are adjusted for the effects of all dilutive potential common stock. Potential common stock of the Company is related to the stock option plan.
Operating segments are components of business activities from which the Companies may earn revenues and incur expenses, including revenues and expenses relating to transactions with other operating segments. Discrete financial information for operating results of all operating segments is available, and is regularly reviewed by management in order to determine the allocation of resources to the segment and assess its performance.
(18) Earnings per Share (attributable to owners of the parent)
(19) Operating Segments
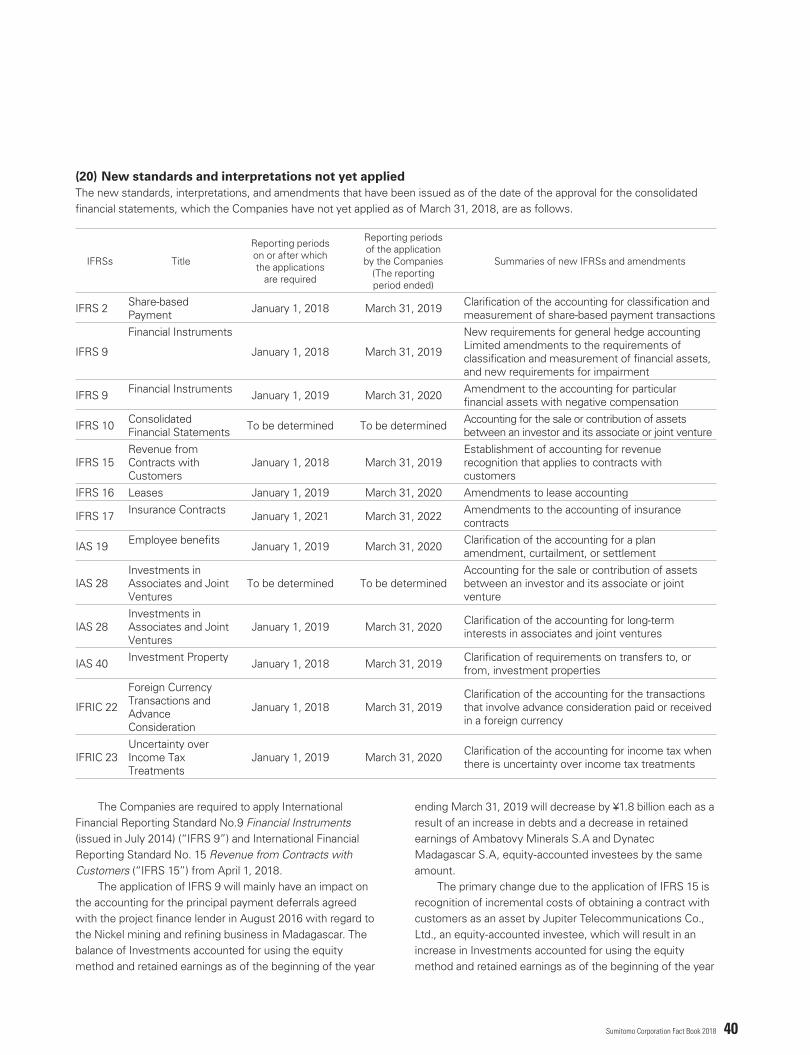
40Sumitomo Corporation Fact Book 2018
The new standards, interpretations, and amendments that have been issued as of the date of the approval for the consolidated financial statements, which the Companies have not yet applied as of March 31, 2018, are as follows.
(20) New standards and interpretations not yet applied
IFRSs Title
Reporting periodson or after whichthe applications
are required
Reporting periodsof the applicationby the Companies
(The reportingperiod ended)
Summaries of new IFRSs and amendments
IFRS 2 Share-based Payment January 1, 2018 March 31, 2019 Clarification of the accounting for classification and
measurement of share-based payment transactions
IFRS 9
Financial Instruments
January 1, 2018 March 31, 2019
New requirements for general hedge accountingLimited amendments to the requirements of classification and measurement of financial assets, and new requirements for impairment
IFRS 9 Financial Instruments January 1, 2019 March 31, 2020 Amendment to the accounting for particular financial assets with negative compensation
IFRS 10 Consolidated Financial Statements To be determined To be determined Accounting for the sale or contribution of assets
between an investor and its associate or joint venture
IFRS 15Revenue from Contracts with Customers
January 1, 2018 March 31, 2019Establishment of accounting for revenue recognition that applies to contracts with customers
IFRS 16 Leases January 1, 2019 March 31, 2020 Amendments to lease accounting
IFRS 17 Insurance Contracts January 1, 2021 March 31, 2022 Amendments to the accounting of insurance contracts
IAS 19 Employee benefits January 1, 2019 March 31, 2020 Clarification of the accounting for a plan amendment, curtailment, or settlement
IAS 28Investments in Associates and Joint Ventures
To be determined To be determinedAccounting for the sale or contribution of assets between an investor and its associate or joint venture
IAS 28Investments in Associates and Joint Ventures
January 1, 2019 March 31, 2020 Clarification of the accounting for long-term interests in associates and joint ventures
IAS 40 Investment Property January 1, 2018 March 31, 2019 Clarification of requirements on transfers to, or from, investment properties
IFRIC 22
Foreign Currency Transactions and Advance Consideration
January 1, 2018 March 31, 2019Clarification of the accounting for the transactions that involve advance consideration paid or received in a foreign currency
IFRIC 23Uncertainty over Income Tax Treatments
January 1, 2019 March 31, 2020 Clarification of the accounting for income tax when there is uncertainty over income tax treatments
The Companies are required to apply International Financial Reporting Standard No.9 Financial Instruments (issued in July 2014) (“IFRS 9”) and International Financial Reporting Standard No. 15 Revenue from Contracts with Customers (“IFRS 15”) from April 1, 2018. The application of IFRS 9 will mainly have an impact on the accounting for the principal payment deferrals agreed with the project finance lender in August 2016 with regard to the Nickel mining and refining business in Madagascar. The balance of Investments accounted for using the equity method and retained earnings as of the beginning of the year
ending March 31, 2019 will decrease by ¥1.8 billion each as a result of an increase in debts and a decrease in retained earnings of Ambatovy Minerals S.A and Dynatec Madagascar S.A, equity-accounted investees by the same amount. The primary change due to the application of IFRS 15 is recognition of incremental costs of obtaining a contract with customers as an asset by Jupiter Telecommunications Co., Ltd., an equity-accounted investee, which will result in an increase in Investments accounted for using the equity method and retained earnings as of the beginning of the year

41 Sumitomo Corporation Fact Book 2018
Financial Section
ending March 31, 2019 by ¥6.6 billion each. The Companies are currently evaluating the potential impacts that application of other new standards and interpretations will have on the consolidated financial statements.
4. Segment Information
The Companies conduct business through five industry-based business operating segments (business units) and overseas regional segment (Overseas Subsidiaries and Branches). The Companies’ industry-based business segments are:
Metal Products Transportation & Construction Systems Environment & Infrastructure Media, ICT, Lifestyle Related Goods & Services Mineral Resources, Energy, Chemical & Electronics
“Trading” used in the following descriptions of the Companies’ business units represents sales transactions where the business units act as a principal or an agent. See Note 3. (13) for the Companies’ accounting policy on revenue recognition.
Metal Products—The Metal Products Business Unit encompasses various metal products, including steel products such as steel sheets, tubular products, and non-ferrous metal products such as aluminum and titanium. This segment also has an extensive value chain that satisfies the diverse needs of customers in a broad range of fields. In the steel sheet-related field, this segment provides just-in-time delivery services for steel sheet products mainly to automotive and home appliance manufacturers via worldwide steel service center network, which provides functions including procurement, inventory management, and processing. In the tubular products field, this segment has functions as a total service provider by developing oil field services in addition to unique supply chain management (SCM) system for oil and gas companies. In the non-ferrous products & metals field, a priority of this segment is to expand production and sales locations for aluminum ingot and sheets. This segment consists of the Steel Sheet Products Division, the Metal Products for Automotive Industry Division, the Light Metals & Metal Products for Transportation Division, and the Tubular Products Division.
Transportation & Construction Systems—The Transportation & Construction Systems Business Unit engages in global transactions involving ships, aircrafts, transportation systems, motor vehicles, construction equipment and related components and parts. Activities of this segment range from trading, leasing and financing to designing and arranging the construction of public transportation systems. This segment consists of the Ship, Aerospace & Transportation Systems Division, two Automotive Divisions, and the Construction & Mining Systems Division.
Environment & Infrastructure—The Environment & Infrastructure Business Unit engages in a wide range of large-scale overseas infrastructure development projects such as power generation and power plant Engineering, Procurement and Construction (EPC). This segment also engages in electricity retail in Japan, renewable energy businesses such as wind, solar photovoltaic and geothermal power generation, industrial infrastructure businesses such as industrial facilities and equipment, water businesses, environmental solutions, and storage battery businesses. This segment also engages in providing logistics services such as delivery, customs clearance and transportation services, arrangements for insurance, and development and operation of overseas industrial parks. This segment consists of the Social Infrastructure Business Division, the Global Power Infrastructure Business Division and the Logistics & Insurance Business Division.
Media, ICT, Lifestyle Related Goods & Services—The Media, ICT, Lifestyle Related Goods & Services Business Unit engages in cable television operations, video contents businesses, IT service businesses, cell-phone related businesses, telecommunications, venture investments, and retail businesses such as TV shopping channels, e-commerce businesses, supermarkets, drugstores, and fashion businesses. This segment also engages in trading, marketing, manufacturing, selling,
(1) Operating Segment
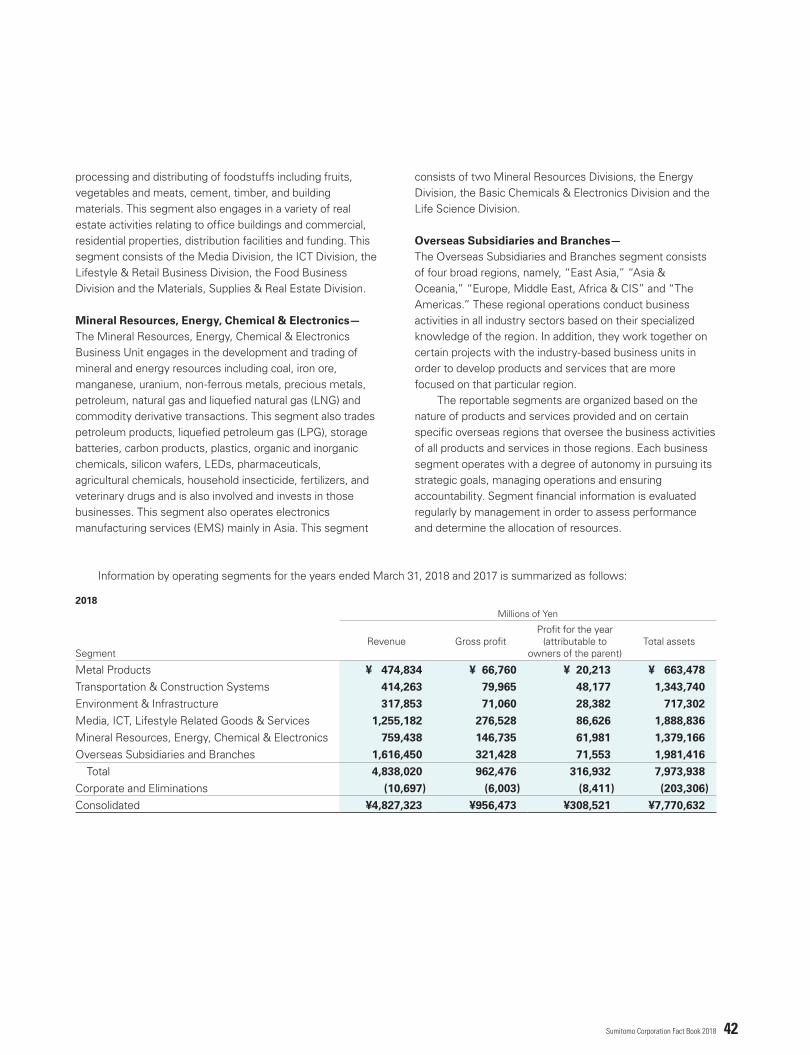
42Sumitomo Corporation Fact Book 2018
processing and distributing of foodstuffs including fruits, vegetables and meats, cement, timber, and building materials. This segment also engages in a variety of real estate activities relating to office buildings and commercial, residential properties, distribution facilities and funding. This segment consists of the Media Division, the ICT Division, the Lifestyle & Retail Business Division, the Food Business Division and the Materials, Supplies & Real Estate Division.
Mineral Resources, Energy, Chemical & Electronics—The Mineral Resources, Energy, Chemical & Electronics Business Unit engages in the development and trading of mineral and energy resources including coal, iron ore, manganese, uranium, non-ferrous metals, precious metals, petroleum, natural gas and liquefied natural gas (LNG) and commodity derivative transactions. This segment also trades petroleum products, liquefied petroleum gas (LPG), storage batteries, carbon products, plastics, organic and inorganic chemicals, silicon wafers, LEDs, pharmaceuticals, agricultural chemicals, household insecticide, fertilizers, and veterinary drugs and is also involved and invests in those businesses. This segment also operates electronics manufacturing services (EMS) mainly in Asia. This segment
Information by operating segments for the years ended March 31, 2018 and 2017 is summarized as follows:
2018Millions of Yen
SegmentRevenue Gross profit
Profit for the year (attributable to
owners of the parent)Total assets
Metal Products ¥ 474,834 ¥ 66,760 ¥ 20,213 ¥ 663,478
Transportation & Construction Systems 414,263 79,965 48,177 1,343,740
Environment & Infrastructure 317,853 71,060 28,382 717,302
Media, ICT, Lifestyle Related Goods & Services 1,255,182 276,528 86,626 1,888,836
Mineral Resources, Energy, Chemical & Electronics 759,438 146,735 61,981 1,379,166
Overseas Subsidiaries and Branches 1,616,450 321,428 71,553 1,981,416
Total 4,838,020 962,476 316,932 7,973,938
Corporate and Eliminations (10,697) (6,003) (8,411) (203,306)
Consolidated ¥4,827,323 ¥956,473 ¥308,521 ¥7,770,632
consists of two Mineral Resources Divisions, the Energy Division, the Basic Chemicals & Electronics Division and the Life Science Division.
Overseas Subsidiaries and Branches—The Overseas Subsidiaries and Branches segment consists of four broad regions, namely, “East Asia,” “Asia & Oceania,” “Europe, Middle East, Africa & CIS” and “The Americas.” These regional operations conduct business activities in all industry sectors based on their specialized knowledge of the region. In addition, they work together on certain projects with the industry-based business units in order to develop products and services that are more focused on that particular region. The reportable segments are organized based on the nature of products and services provided and on certain specific overseas regions that oversee the business activities of all products and services in those regions. Each business segment operates with a degree of autonomy in pursuing its strategic goals, managing operations and ensuring accountability. Segment financial information is evaluated regularly by management in order to assess performance and determine the allocation of resources.

43 Sumitomo Corporation Fact Book 2018
Financial Section
In the year ended March 31, 2018, the Companies changed reportable segments for the part of the interest in certain overseas subsidiaries and associated companies mainly in the U.S. that resulted in decrease of the total assets of business segments by ¥87,429 million ($825 million), and the increase of the total assets of the Overseas Subsidiaries and Branches segment by the same amount. Management regularly makes such a review that each business is conducted under appropriate business segment whereby the Company can make the best allocation of its business resources and functions. Above change was the result of those review. Corporate assets consist primarily of cash and cash equivalents and marketable securities maintained by corporate headquarters that are not related to specific operating segments. Profit for the year attributable to owners of the parent in Corporate and Eliminations includes certain profits and losses that are not allocated to operating segments and intersegment eliminations. Certain profits and losses in Corporate and Eliminations are reallocated once the
Company determines their attributable operating segments. Transactions between segments are made on an arm’s-length basis. In the year ended March 31, 2018, impairment losses in Indonesian commercial bank PT. Bank Tabungan Pensiunan Nasional Tbk were recognized in the Transportation & Construction Systems business segment. The impact to the Profit for the year attributable to owners of the parent was a loss of ¥9,421 million ($89 million). In the year ended March 31, 2018, impairment losses in Indonesian commercial bank PT. Bank Tabungan Pensiunan Nasional Tbk were recognized in the Overseas Subsidiaries and Branches segment. The impact to the Profit for the year attributable to owners of the parent was a loss of ¥3,765 million ($36 million). In the year ended March 31, 2017, impairment losses in the Copper and molybdenum mining business in Chile were recognized in the Mineral Resources, Energy, Chemical & Electronics business segment, which post-tax impact to the Profit for the year attributable to owners of the parent was a loss of ¥33,597 million.
2017Millions of Yen
SegmentRevenue Gross profit
Profit for the year (attributable to
owners of the parent)Total assets
Metal Products ¥ 485,148 ¥ 67,358 ¥ 9,966 ¥ 676,055Transportation & Construction Systems 519,389 131,207 46,911 1,471,865Environment & Infrastructure 229,424 54,982 22,954 666,251Media, ICT, Lifestyle Related Goods & Services 962,594 257,040 77,550 1,909,301Mineral Resources, Energy, Chemical & Electronics 653,990 117,851 (17,200) 1,333,571Overseas Subsidiaries and Branches 1,154,743 217,182 19,979 1,864,439
Total 4,005,288 845,620 160,160 7,921,482Corporate and Eliminations (8,314) (2,922) 10,729 (159,688)Consolidated ¥3,996,974 ¥842,698 ¥170,889 ¥7,761,794
2018Millions of U.S. Dollars
SegmentRevenue Gross profit
Profit for the year (attributable to
owners of the parent)Total assets
Metal Products $ 4,480 $ 630 $ 191 $ 6,259
Transportation & Construction Systems 3,908 755 454 12,677
Environment & Infrastructure 2,999 670 268 6,767
Media, ICT, Lifestyle Related Goods & Services 11,841 2,609 817 17,819
Mineral Resources, Energy, Chemical & Electronics 7,164 1,384 585 13,011
Overseas Subsidiaries and Branches 15,250 3,032 675 18,693
Total 45,642 9,080 2,990 75,226
Corporate and Eliminations (101) (57) (79) (1,918)
Consolidated $45,541 $9,023 $2,911 $73,308

44Sumitomo Corporation Fact Book 2018
The Companies’ revenue by geographical areas for the years ended March 31, 2018 and 2017 is as follows:
The carrying amount of non-current assets, excluding Financial assets and Deferred tax assets, by geographical areas as of March 31, 2018 and 2017 is as follows:
Breakdown by products and services are not available.
Millions of Yen Millions of U.S. Dollars
2018 2017 2018
Japan ¥2,027,826 ¥1,706,352 $ 19,131
Asia 708,197 659,092 6,681
North America:U.S. 1,029,830 821,613 9,715
Others 189,852 166,791 1,791
Europe 669,511 440,035 6,316
Others 202,107 203,091 1,907
Total ¥4,827,323 ¥3,996,974 $ 45,541
Millions of Yen Millions of U.S. Dollars
2018 2017 2018
Japan ¥ 589,075 ¥ 568,403 $ 5,557
Asia 44,328 46,241 418
North America:U.S. 262,527 443,812 2,477
Others 15,541 15,842 147
Europe 281,697 278,793 2,658
Others 139,435 147,274 1,315
Total ¥1,332,603 ¥1,500,365 $12,572
(2) Geographic Information
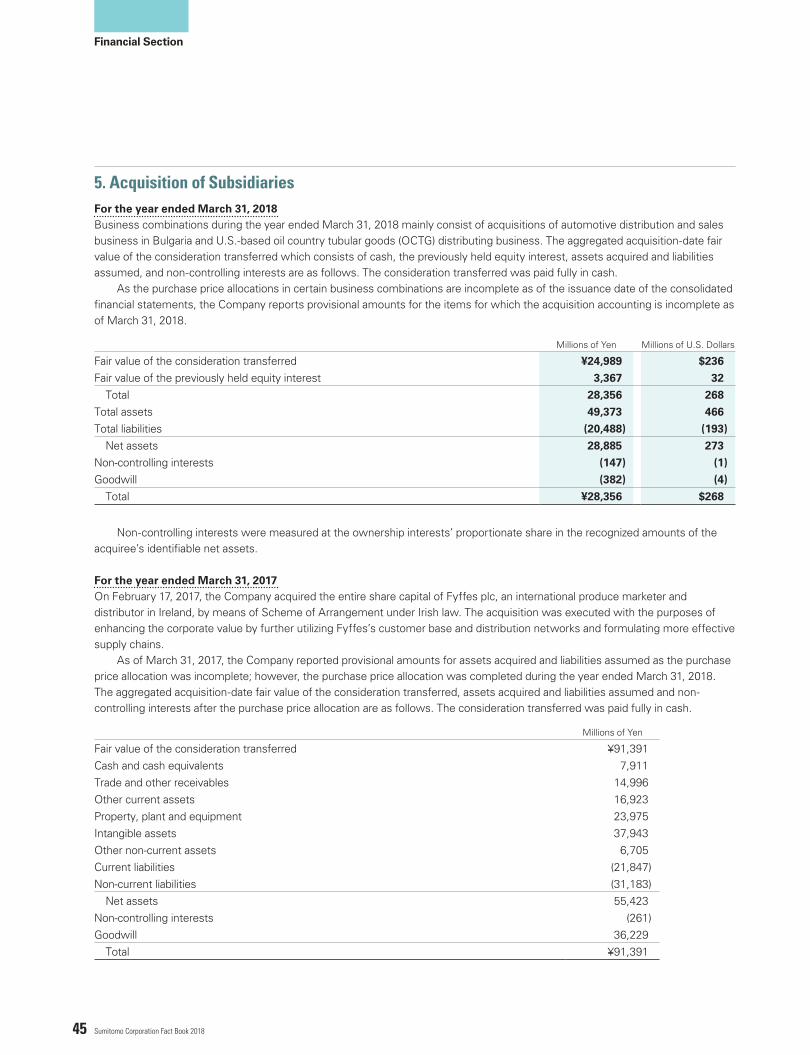
45 Sumitomo Corporation Fact Book 2018
Financial Section
For the year ended March 31, 2018Business combinations during the year ended March 31, 2018 mainly consist of acquisitions of automotive distribution and sales business in Bulgaria and U.S.-based oil country tubular goods (OCTG) distributing business. The aggregated acquisition-date fair value of the consideration transferred which consists of cash, the previously held equity interest, assets acquired and liabilities assumed, and non-controlling interests are as follows. The consideration transferred was paid fully in cash. As the purchase price allocations in certain business combinations are incomplete as of the issuance date of the consolidated financial statements, the Company reports provisional amounts for the items for which the acquisition accounting is incomplete as of March 31, 2018.
Millions of Yen Millions of U.S. Dollars
Fair value of the consideration transferred ¥24,989 $236
Fair value of the previously held equity interest 3,367 32
Total 28,356 268
Total assets 49,373 466
Total liabilities (20,488) (193)
Net assets 28,885 273
Non-controlling interests (147) (1)
Goodwill (382) (4)
Total ¥28,356 $268
Non-controlling interests were measured at the ownership interests’ proportionate share in the recognized amounts of the acquiree’s identifiable net assets.
For the year ended March 31, 2017On February 17, 2017, the Company acquired the entire share capital of Fyffes plc, an international produce marketer and distributor in Ireland, by means of Scheme of Arrangement under Irish law. The acquisition was executed with the purposes of enhancing the corporate value by further utilizing Fyffes’s customer base and distribution networks and formulating more effective supply chains. As of March 31, 2017, the Company reported provisional amounts for assets acquired and liabilities assumed as the purchase price allocation was incomplete; however, the purchase price allocation was completed during the year ended March 31, 2018. The aggregated acquisition-date fair value of the consideration transferred, assets acquired and liabilities assumed and non-controlling interests after the purchase price allocation are as follows. The consideration transferred was paid fully in cash.
Millions of Yen
Fair value of the consideration transferred ¥91,391Cash and cash equivalents 7,911Trade and other receivables 14,996Other current assets 16,923Property, plant and equipment 23,975Intangible assets 37,943Other non-current assets 6,705Current liabilities (21,847)Non-current liabilities (31,183)
Net assets 55,423Non-controlling interests (261)Goodwill 36,229
Total ¥91,391
5. Acquisition of Subsidiaries

46Sumitomo Corporation Fact Book 2018
Assets classified as held for sale and liabilities associated with assets classified as held for sale are related to TBC Corporation (“TBC”), a consolidated subsidiary of the Company. The Company and Compagnie Générale des Établissements Michelin (“Michelin”) have reached a definitive agreement for the purpose of strategic partnership to combine the replacement tire wholesale and retail business in the United States, Mexico and Canada. Under the agreement, Tire Center LLC, a tire wholesale distributor and a subsidiary of Michelin North America, Inc. (“MNAI”) will be merged into TBC, a tire wholesale distributor and
retailer and a 100% owned subsidiary of Sumitomo Corporation of Americas (“SCOA,” a 100% owned subsidiary of the Company) forming an entity that will be held 50% each and jointly operated by SCOA and MNAI. The Company concluded the above agreement with Michelin as of January 2, 2018 and agreed to transfer a part of TBC shares owned by the Companies to MNAI, and the related assets and liabilities are classified as held for sale as of March 31, 2018. The deal was closed on April 5, 2018, as assignment of stock was completed after obtaining approvals from related authorities both domestically and internationally.
Assets classified as held for sale and liabilities associated with assets classified as held for sale disclosed above are after elimination of inter-company receivables and payables and included in Overseas Subsidiaries and Branches segment in Note 4 “Segment information.” Exchange losses on translating foreign operations of
¥2,328 million ($22 million) arising from translations of assets classified as held for sale and liabilities associated with assets classified as held for sale are included in Other component of equity in the Consolidated statement of financial position.
Goodwill consists primarily of future economic benefits and is recognized in the Media, ICT, Lifestyle Related Goods & Services Business Unit. The acquisition-related costs of ¥1,944 million were included in “Selling, general and administrative expenses” in the Consolidated statement of comprehensive income for the year ended March 31, 2017.
Assets and liabilities classified as held for sale as of March 31, 2018 are as follows:
Millions of YenMillions of
U.S. Dollars
Cash and cash equivalents ¥ 4,512 $ 43
Trade and other receivables 31,782 300
Inventories 82,094 774
Property, plant and equipment 52,477 495
Intangible assets 74,085 699
Others 2,727 26
Total assets classified as held for sale 247,677 2,337
Bonds and borrowings 4,786 45
Trade and other payables 31,703 299
Accrued expenses 24,332 230
Others 13,386 126
Total liabilities associated with assets classifies as held for sale ¥ 74,207 $ 700
6. Assets Classified as Held for Sale and Liabilities Associated with Assets Classified as Held for Sale

47 Sumitomo Corporation Fact Book 2018
Financial Section
The amounts of “Marketable securities” and “Other investments” in the Consolidated statement of financial position are as follows:
The fair values of “Marketable securities” and “Other investments” measured at amortized cost as of March 31, 2018 and 2017 are ¥6,523 million ($62 million) and ¥5,987 million, respectively.
The Companies classify investments as financial assets measured at FVTOCI when those investments are held for the objective, such as expansion of the medium and long-term revenue through maintenance and reinforcement of relationships with investees.
The fair value and dividends received from “Other investments” measured at FVTOCI held as of March 31, 2018 and 2017 are as follows:
Millions of Yen Millions of U.S. Dollars
2018 2017 2018
Fair value Dividends Fair value Dividends Fair value Dividends
Listed ¥354,245 ¥ 7,067 ¥339,168 ¥5,347 $3,342 $66
Unlisted 84,107 3,391 75,375 3,674 793 32
Total ¥438,352 ¥10,458 ¥414,543 ¥9,021 $4,135 $98
7. Marketable Securities and Other Investments
Millions of Yen Millions of U.S. Dollars
2018 2017 2018
Marketable securities:FVTPL ¥ – ¥ 3,967 $ –
Amortized cost 1,361 680 13
Total 1,361 4,647 13
Other investments:FVTPL 19,327 17,312 182
FVTOCI 438,352 414,543 4,135
Amortized cost 5,162 5,307 49
Total ¥462,841 ¥437,162 $4,366

48Sumitomo Corporation Fact Book 2018
The fair values of “Other investments” measured at FVTOCI as of March 31, 2018 mainly consist of the following:
The fair values of “Other investments” measured at FVTOCI as of March 31, 2017 mainly consist of the following:
Millions of Yen Millions of U.S. Dollars
2018 2018
NIPPON STEEL & SUMITOMO METAL CORPORATION ¥42,686 $403 TOYOTA MOTOR CORPORATION 22,874 216YAMAZAKI BAKING CO., LTD. 20,656 195Sumitomo Realty & Development Co., LTD. 20,332 192Asahi Group Holdings, Ltd. 17,059 161Sumitomo Metal Mining Co., Ltd. 15,680 148DAIKIN INDUSTRIES, LTD. 13,359 126NISSHIN SEIFUN GROUP INC. 12,847 121MS&AD Insurance Group Holdings, Inc. 10,065 95Sumitomo Rubber Industries, Ltd. 9,379 88Mazda Motor Corporation 8,559 81Sumitomo Electric Industries, Ltd. 8,130 77Sumitomo Forestry Co., Ltd. 7,478 71YAMATO KOGYO CO., LTD. 7,265 69KATO SANGYO CO., LTD. 7,193 68Dai-ichi Life Holdings, Inc. 7,137 67NICHIHA CORPORATION 6,513 61Daikyo Nishikawa Corporation 6,232 59SUMITOMO HEAVY INDUSTRIES, LTD. 6,021 57ISUZU MOTORS LIMITED 5,573 53SKY Perfect JSAT Holdings Inc. 5,320 50Rengo Co., Ltd. 4,838 46
Millions of Yen
2017
NIPPON STEEL & SUMITOMO METAL CORPORATION ¥46,860YAMAZAKI BAKING CO., LTD. 21,423TOYOTA MOTOR CORPORATION 20,250Asahi Group Holdings, Ltd. 16,875Sumitomo Realty & Development Co., LTD. 14,912DAIKIN INDUSTRIES, LTD. 12,733Sumitomo Metal Mining Co., Ltd. 11,085MS&AD Insurance Group Holdings, Inc. 10,620NISSHIN SEIFUN GROUP INC. 10,118Mazda Motor Corporation 9,755Sumitomo Electric Industries, Ltd. 9,245Sumitomo Rubber Industries, Ltd. 9,114Sumitomo Forestry Co., Ltd. 7,408Dai-ichi Life Holdings, Inc. 7,335YAMATO KOGYO CO., LTD. 7,068SUMITOMO HEAVY INDUSTRIES, LTD. 5,790KATO SANGYO CO., LTD. 5,515INTERNATIONAL STEELS LIMITED 5,497NICHIHA CORPORATION 5,240SKY Perfect JSAT Holdings Inc. 5,231Daikyo Nishikawa Corporation 5,214ISUZU MOTORS LIMITED 5,029

49 Sumitomo Corporation Fact Book 2018
Financial Section
“Other investments” measured at FVTOCI which were disposed of during the years ended March 31, 2018 and 2017 are as follows:
Millions of Yen Millions of U.S. Dollars
2018 2017 2018
Fair value at the date of sale
Cumulative gains or (losses)
Dividends Fair value at the date of sale
Cumulative gains or (losses)
Dividends Fair value at the date of sale
Cumulative gains or (losses)
Dividends
¥10,958 ¥8,602 ¥68 ¥7,250 ¥(11,714) ¥252 $103 $81 $1
The Companies sold or exchanged the investments mainly as a result of reviewing business relationships or as a result of business combinations in the investees. In connection with the disposal, the Companies reclassified cumulative gains (net of tax) of ¥6,439 million ($61 million) and ¥1,410 million from Other components of equity to retained earnings for the years ended March 31, 2018 and 2017, respectively.
For financial assets measured at FVTOCI of which the decline in fair value compared to its acquisition cost is significant and other than temporary, the Companies reclassified cumulative losses (net of tax) of ¥617 million ($6 million) and ¥9,558 million from Other components of equity to retained earnings for the years ended March 31, 2018 and 2017, respectively.
The components of Trade and other receivables as of March 31, 2018 and 2017 are as follows:
8. Trade and Other Receivables
Millions of Yen Millions of U.S. Dollars
2018 2017 2018
Notes receivable ¥ 72,502 ¥ 60,197 $ 684
Accounts receivable 1,064,423 1,007,951 10,042
Receivables due from equity-accounted investees 167,266 165,194 1,578
Loans receivable 73,896 126,806 697
Finance lease receivable 222,399 270,805 2,098
Other receivables 69,184 74,552 653
Less: Allowance for doubtful receivables (21,768) (26,645) (206)
Trade and other receivables ¥1,647,902 ¥1,678,860 $15,546
Financial assets measured at FVTPL of ¥23,749 million ($224 million) and ¥24,706 million are included in Accounts receivable as of March 31, 2018 and 2017, respectively.
The components of Trade and other receivables in the Consolidated statement of financial position as of March 31, 2018 and 2017 are as follows:
Millions of Yen Millions of U.S. Dollars
2018 2017 2018
Current assets ¥1,266,782 ¥1,206,398 $11,951
Non-current assets 381,120 472,462 3,595
Total ¥1,647,902 ¥1,678,860 $15,546

50Sumitomo Corporation Fact Book 2018
Trade and other receivables by operating segment as of March 31, 2018 and 2017 are summarized as follows:
Movements in Allowance for doubtful receivables for the years ended March 31, 2018 and 2017 are as follows:
Certain notes receivables derived mainly from export transactions are transferred to banks on a discounted basis. The Companies are liable to the banks for defaults by the note issuer. As such, the Companies continue to recognize the discounted notes receivables of ¥1,446 million ($14 million) and ¥4,411 million as of March 31, 2018 and 2017, respectively, and these discounted notes are presented in “Trade and other receivables” in the Consolidated statement of financial position. The associated liabilities are presented in “Bonds and borrowings.”
Allowance for doubtful receivables is recognized against the receivables based on estimated irrecoverable amounts determined by considering individual customers’ risk factors such as historical performance, recent developments, changes in original terms, internal risk-ratings, industry trends and other specific factors as well as general risk factors, including sovereign risk of the country where the customer resides. Credit insurance and collateral obtained are also considered in the estimation of irrecoverable amounts.
Millions of Yen Millions of U.S. Dollars
2018 2017 2018
Metal Products ¥ 244,930 ¥ 241,155 $ 2,311
Transportation & Construction Systems 256,058 273,280 2,415
Environment & Infrastructure 266,400 319,154 2,513
Media, ICT, Lifestyle Related Goods & Services 230,637 215,915 2,176
Mineral Resources, Energy, Chemical & Electronics 444,462 465,442 4,193
Others 205,415 163,914 1,938
Trade and other receivables ¥1,647,902 ¥1,678,860 $15,546
Millions of Yen Millions of U.S. Dollars
2018 2017 2018
Balance, beginning of year ¥26,645 ¥25,839 $251
Impairment losses 577 2,278 5
Charge-off (5,116) (1,391) (48)
Exchange differences on translating foreign operations (338) (81) (3)
Balance, end of year ¥21,768 ¥26,645 $205
As of March 31, 2018 and 2017, the total gross amount of impaired trade and other receivables is ¥13,913 million ($131 million) and ¥16,494 million, respectively and the cumulative impairment losses recognized as of March 31, 2018 and 2017 are ¥10,235 million ($97 million) and ¥12,827 million, respectively.
The age of trade and other receivables that are past due but not impaired as of March 31, 2018 and 2017 is as follows: Receivables disclosed below include amounts considered recoverable through credit insurance and collateral and are not considered to be impaired as of March 31, 2018 and 2017.
Millions of Yen Millions of U.S. Dollars
2018 2017 2018
Past due within 90 days ¥ 79,340 ¥103,268 $ 749
Past due over 90 days until 1 year 14,198 14,129 134
Past due over 1 year 18,495 17,968 174
Total ¥112,033 ¥135,365 $1,057

51 Sumitomo Corporation Fact Book 2018
Financial Section
9. Leases
The Companies lease office buildings, vessels, aircraft engines and certain other assets to third parties under cancelable or non-cancelable operating leases. Costs of the leased properties as of March 31, 2018 and 2017 are ¥393,367 million ($3,711 million) and ¥457,586 million,
Future minimum lease payments receivable under non-cancelable operating leases as of March 31, 2018 and 2017 are as follows:
Contingent rental income recognized in profit for the years ended March 31, 2018 and 2017 are ¥12,186 million ($115 million) and ¥12,400 million, respectively.
respectively. Accumulated depreciation and accumulated impairment losses as of March 31, 2018 and 2017 are ¥93,331 million ($880 million) and ¥98,488 million, respectively. These assets are included in “Property, plant and equipment,” “Intangible assets,” and “Investment property” in the Consolidated statement of financial position.
(1) As lessor
Millions of Yen Millions of U.S. Dollars
2018 2017 2018
Due in 1 year or less ¥21,539 ¥28,190 $ 203
Due after 1 year through 5 years 50,364 71,893 475
Due after 5 years 26,022 47,012 245
The Companies lease automobiles, vessels, power stations, service equipment and other assets under arrangements which are classified as finance leases under International Accounting Standard No.17 Leases (“IAS 17”). The significant leased item is a coal-fired thermal power plant owned by the Companies in Indonesia and currently leased to the Indonesian state-owned electricity corporation.
Future receivable under finance leases as of March 31, 2018 and 2017 are as follows:
Minimum lease payments receivable
Millions of Yen Millions of U.S. Dollars
2018 2017 2018
Due in 1 year or less ¥ 81,614 ¥ 81,817 $ 770
Due after 1 year through 5 years 156,048 188,131 1,472
Due after 5 years 48,206 83,427 455
Unguaranteed residual value 4,308 4,479 41
Less: Future finance income (67,777) (87,049) (640)
Net investment in the lease ¥222,399 ¥270,805 $2,098
Net investment in the lease
Millions of Yen Millions of U.S. Dollars
2018 2017 2018
Due in 1 year or less ¥ 73,310 ¥ 74,081 $ 692
Due after 1 year through 5 years 120,105 145,913 1,133
Due after 5 years 26,132 47,865 247
Unguaranteed residual value 2,852 2,946 27
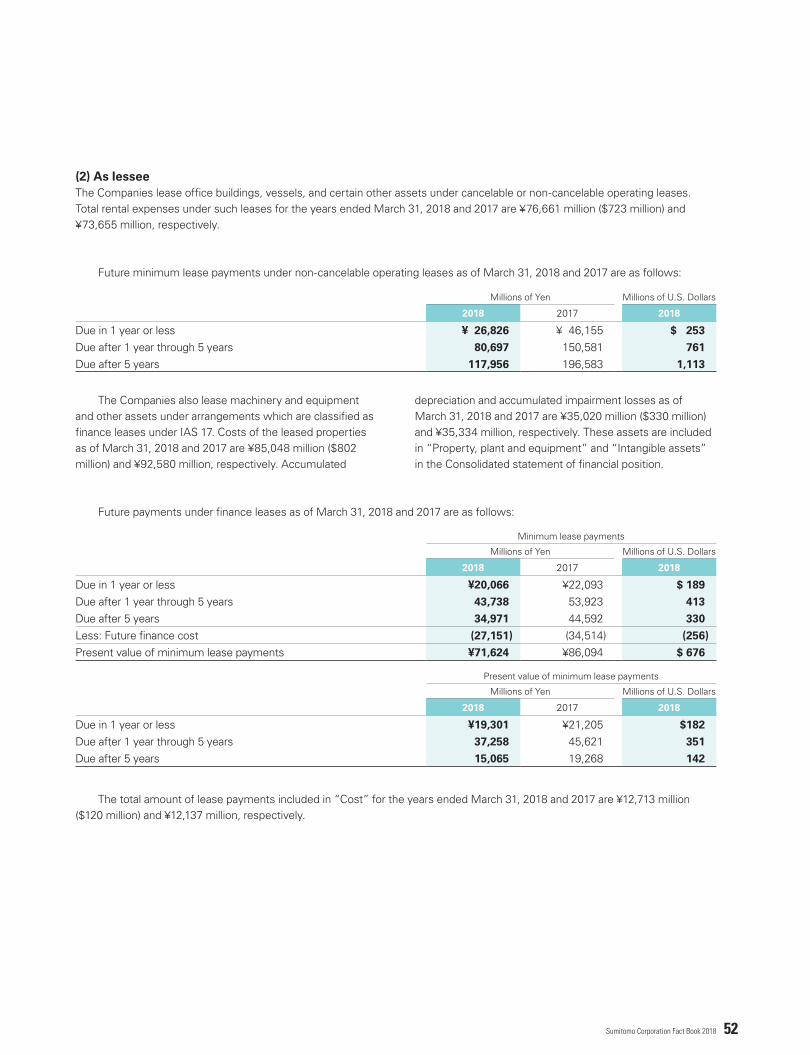
52Sumitomo Corporation Fact Book 2018
The Companies lease office buildings, vessels, and certain other assets under cancelable or non-cancelable operating leases. Total rental expenses under such leases for the years ended March 31, 2018 and 2017 are ¥76,661 million ($723 million) and ¥73,655 million, respectively.
The Companies also lease machinery and equipment and other assets under arrangements which are classified as finance leases under IAS 17. Costs of the leased properties as of March 31, 2018 and 2017 are ¥85,048 million ($802 million) and ¥92,580 million, respectively. Accumulated
Future minimum lease payments under non-cancelable operating leases as of March 31, 2018 and 2017 are as follows:
Future payments under finance leases as of March 31, 2018 and 2017 are as follows:
The total amount of lease payments included in “Cost” for the years ended March 31, 2018 and 2017 are ¥12,713 million ($120 million) and ¥12,137 million, respectively.
depreciation and accumulated impairment losses as of March 31, 2018 and 2017 are ¥35,020 million ($330 million) and ¥35,334 million, respectively. These assets are included in “Property, plant and equipment” and “Intangible assets” in the Consolidated statement of financial position.
(2) As lessee
Millions of Yen Millions of U.S. Dollars
2018 2017 2018
Due in 1 year or less ¥ 26,826 ¥ 46,155 $ 253
Due after 1 year through 5 years 80,697 150,581 761
Due after 5 years 117,956 196,583 1,113
Minimum lease payments
Millions of Yen Millions of U.S. Dollars
2018 2017 2018
Due in 1 year or less ¥20,066 ¥22,093 $ 189
Due after 1 year through 5 years 43,738 53,923 413
Due after 5 years 34,971 44,592 330
Less: Future finance cost (27,151) (34,514) (256)
Present value of minimum lease payments ¥71,624 ¥86,094 $ 676
Present value of minimum lease payments
Millions of Yen Millions of U.S. Dollars
2018 2017 2018
Due in 1 year or less ¥19,301 ¥21,205 $182
Due after 1 year through 5 years 37,258 45,621 351
Due after 5 years 15,065 19,268 142

53 Sumitomo Corporation Fact Book 2018
Financial Section
10. Assets Pledged as SecurityAssets pledged to secure borrowings, guarantee of contracts and others as of March 31, 2018 and 2017 are as follows:
Millions of Yen Millions of U.S. Dollars
2018 2017 2018
Cash and deposits ¥ 82,977 ¥ 52,714 $ 783
Marketable securities and investments 185,709 153,135 1,752
Trade and other receivables 335,881 350,247 3,169
Inventories 21,681 23,471 205
Property, plant and equipment (Carrying amount) 85,671 70,554 808
Investment property (Carrying amount) 6,829 21,249 64
Total ¥718,748 ¥671,370 $6,781
Trust receipts issued under customary import financing arrangements give recipient banks a security interest in the merchandise imported and/or the accounts receivable or sales proceeds resulting from the sales of such merchandise. The Companies repay the related notes and acceptances
payable at the maturity dates without applying the sales proceeds to specific notes or acceptances. The large volume of transactions makes it impracticable to determine the aggregate amounts of assets covered by outstanding trust receipts.
11. InventoriesThe components of Inventories as of March 31, 2018 and 2017 are as follows:
Millions of Yen Millions of U.S. Dollars
2018 2017 2018
Real estate held for development and resale ¥126,770 ¥101,728 $1,196
Commodities 631,741 632,744 5,960
Materials /work in progress 119,297 96,399 1,125
Inventories ¥877,808 ¥830,871 $8,281
Of the inventories disclosed above, the carrying amounts of inventories that are measured at fair value less costs to sell as of March 31, 2018 and 2017 are ¥69,745 million ($658 million) and ¥51,433 million, respectively.
The write-down of Inventories recognized as expense for the years ended March 31, 2018 and 2017 are ¥9,120 million ($86 million) and ¥10,119 million, respectively.

54Sumitomo Corporation Fact Book 2018
12. Investments Accounted for Using the Equity Method
Summarized financial information for the Companies’ interest in associates, based on the amounts reported in the Companies’ consolidated financial statements as of, and for the years ended, March 31, 2018 and 2017 are as follows:
Sumitomo Mitsui Finance and Leasing Company, LimitedSumitomo Mitsui Finance and Leasing Company, Limited’s summarized financial information as of, and for the years ended, March 31, 2018 and 2017 are as follows: Note that the following summarized financial information includes the amount of goodwill to Sumitomo Mitsui Finance and Leasing Company, Limited and other figures.
Millions of Yen Millions of U.S. Dollars
2018 2017 2018
Total carrying amount ¥1,612,629 ¥1,422,451 $15,213
Millions of Yen Millions of U.S. Dollars
2018 2017 2018
Profit for the year ¥110,923 ¥114,277 $1,046
Other comprehensive income 5,182 4,648 49
Comprehensive income for the year ¥116,105 ¥118,925 $1,095
Millions of Yen Millions of U.S. Dollars
2018 2017 2018
Current assets ¥3,389,814 ¥3,379,865 $31,980
Non-current assets 2,457,204 2,378,459 23,181
Total assets ¥5,847,018 ¥5,758,324 $55,161
Current liabilities ¥2,746,561 ¥2,650,399 $25,911
Non-current liabilities 2,114,135 2,195,651 19,945
Total liabilities ¥4,860,696 ¥4,846,050 $45,856
Non-controlling interests ¥ 110,534 ¥ 101,719 $ 1,043
Equity 875,788 810,555 8,262
Total equity ¥ 986,322 ¥ 912,274 $ 9,305
Millions of Yen Millions of U.S. Dollars
2018 2017 2018
Revenues ¥719,064 ¥571,878 $6,784
Profit for the year 83,615 67,022 789
Other comprehensive income 946 1,232 9
Comprehensive income for the year ¥ 84,561 ¥ 68,254 $ 798
The Companies recognized the impairment loss of ¥15,069 million ($142 million) relating to Indonesian commercial bank PT. Bank Tabungan Pensiunan Nasional Tbk in the year ended March 31, 2018, as a result of revising the long-term business plan. Impairment losses recognized in the Transportation & Construction Systems segment, the Overseas Subsidiaries and Branches segment and Corporate and Eliminations were ¥9,421 million ($89 million), ¥3,765 million ($36 million) and ¥1,883 ($17 million), respectively.
The impairment loss was included in “Share of profit (loss) of investments accounted for using the equity method” in the Consolidated statement of comprehensive income.
The major associated company accounted for using the equity method included in the summarized financial information above is Sumitomo Mitsui Finance and Leasing Company, Limited (40% owned).
(1) Investments in Associates

55 Sumitomo Corporation Fact Book 2018
Financial Section
Sumitomo Mitsui Finance and Leasing Company, Limited engages in a variety of financial services including leasing. The dividends which the Company received from Sumitomo Mitsui Finance and Leasing Company, Limited for the years ended March 31, 2018 and 2017 are ¥8,066 million ($76 million) and ¥7,326 million, respectively.
Summarized financial information for the Companies’ interest in joint ventures, based on the amounts reported in the Companies’ consolidated financial statements as of, and for the years ended, March 31, 2018 and 2017 are as follows:
The Companies engage in various agency transactions between equity-accounted investees and third parties. Net fees earned on these transactions are not material. Transactions with equity-accounted investees for the years ended March 31, 2018 and 2017 are summarized as follows:
Transactions with equity-accounted investees stated above are made on an arm’s length basis.
Millions of Yen Millions of U.S. Dollars
2018 2017 2018
Total carrying amount ¥381,737 ¥448,484 $3,601
Millions of Yen Millions of U.S. Dollars
2018 2017 2018
Profit (loss) for the year ¥38,811 ¥(30,820) $366
Other comprehensive income (1,491) 872 (14)
Comprehensive income for the year ¥37,320 ¥(29,948) $352
Millions of Yen Millions of U.S. Dollars
2018 2017 2018
Management and secondment fees, received ¥5,783 ¥5,821 $55
Interest income 7,980 6,679 75
Interest expense 146 76 1
In Copper and molybdenum mining business in Chile, an impairment loss of ¥33,601 million was recognized in year ended March 31, 2017 as a result of revision of a medium and long-term copper price to slightly less than US $3/lb which was applied to the long-term business plan based on the current performance of mining operation and the medium and long-term trend in copper prices. Impairment losses of ¥33,597 million and ¥4 million were recognized in
the Mineral Resources, Energy, Chemical & Electronics segment and the Overseas Subsidiaries and Branches segment, respectively. The impairment loss was included in “Share of profit (loss) of investments accounted for using the equity method” in the Consolidated statement of comprehensive income.
(2) Investments in Joint Ventures
(3) Summary of Transactions with Equity-accounted Investees

56Sumitomo Corporation Fact Book 2018
13. Property, Plant and EquipmentCost and accumulated depreciation and impairment losses of Property, plant and equipment as of March 31, 2018 and 2017 are as follows:
[Cost]Millions of Yen
Land and landimprovements
Buildingsand
leaseholdimprovements
Machineryand
equipmentProjects inprogress Mining rights Total
Balance as of April 1, 2016 ¥89,218 ¥335,622 ¥853,854 ¥30,945 ¥367,288 ¥1,676,927Acquisitions 427 8,191 69,434 47,104 1,813 126,969Reclassification 727 10,129 2,286 (21,491) (593) (8,942)Acquisitions through business
combinations 6,852 9,450 7,803 – – 24,105Deconsolidation of subsidiaries (1,927) (5,504) (21,998) (247) (5,906) (35,582)Disposals (3,484) (7,838) (20,056) (978) (101,109) (133,465)Exchange differences on translating
foreign operations (238) (2,417) (9,226) (317) (28,175) (40,373)Others (122) 2,405 627 (1,240) (2,290) (620)Balance as of March 31, 2017 91,453 350,038 882,724 53,776 231,028 1,609,019Acquisitions 4,940 7,923 57,127 63,607 2,604 136,201
Reclassification (610) 11,368 24,694 (60,334) 268 (24,614)
Acquisitions through business combinations 1,071 2,022 7,182 7 – 10,282
Deconsolidation of subsidiaries and reclassification to assets held for sale (7,949) (37,437) (75,847) (4,199) (126,801) (252,233)
Disposals (1,619) (3,137) (15,091) (81) (33) (19,961)
Exchange differences on translating foreign operations 88 (4,710) (31,419) (537) (5,737) (42,315)
Others 51 2,697 5,105 (2,720) 2,611 7,744
Balance as of March 31, 2018 ¥87,425 ¥328,764 ¥854,475 ¥49,519 ¥103,940 ¥1,424,123
Millions of U.S. Dollars
Land and landimprovements
Buildingsand
leaseholdimprovements
Machineryand
equipmentProjects inprogress Mining rights Total
Balance as of March 31, 2017 $863 $3,302 $8,328 $ 507 $ 2,179 $ 15,179Acquisitions 47 75 539 600 24 1,285
Reclassification (6) 107 233 (569) 3 (232)
Acquisitions through business combinations 10 19 68 0 – 97
Deconsolidation of subsidiaries and reclassification to assets held for sale (75) (353) (716) (40) (1,196) (2,380)
Disposals (15) (30) (142) (1) (0) (188)
Exchange differences on translating foreign operations 1 (44) (297) (5) (54) (399)
Others 0 25 48 (25) 25 73
Balance as of March 31, 2018 $825 $3,101 $8,061 $ 467 $ 981 $ 13,435

57 Sumitomo Corporation Fact Book 2018
Financial Section
The losses recognized from impairment are included in “Impairment losses on long-lived assets” in the Consolidated statement of comprehensive income.
[Accumulated depreciation and impairment losses]Millions of Yen
Land and landimprovements
Buildingsand
leaseholdimprovements
Machineryand
equipment Mining rights Total
Balance as of April 1, 2016 ¥(1,571) ¥(157,922) ¥(420,958) ¥(311,467) ¥(891,918)Deconsolidation of subsidiaries 368 4,975 20,650 5,752 31,745Disposals 235 4,151 13,832 91,220 109,438Depreciation expenses – (16,425) (63,920) (5,061) (85,406)Impairment losses (28) (2,060) (7,592) (68) (9,748)Exchange differences on translating foreign operations 6 884 3,638 23,407 27,935Others 167 480 3,332 813 4,792Balance as of March 31, 2017 (823) (165,917) (451,018) (195,404) (813,162)Deconsolidation of subsidiaries and reclassification to
assets held for sale – 18,481 47,149 126,801 192,431
Disposals – 2,304 12,354 – 14,658
Depreciation expenses – (21,145) (65,752) (2,996) (89,893)
Impairment losses (307) (3,397) (1,527) (1) (5,232)
Exchange differences on translating foreign operations 18 1,686 14,713 3,720 20,137
Others 27 1,653 6,492 (1,008) 7,164
Balance as of March 31, 2018 ¥(1,085) ¥(166,335) ¥(437,589) ¥ (68,888) ¥(673,897)
Millions of U.S. Dollars
Land and landimprovements
Buildingsand
leaseholdimprovements
Machineryand
equipment Mining rights Total
Balance as of March 31, 2017 $ (8) $(1,565) $(4,255) $(1,843) $(7,671)Deconsolidation of subsidiaries and reclassification to
assets held for sale – 174 445 1,196 1,815
Disposals – 22 116 – 138
Depreciation expenses – (200) (620) (28) (848)
Impairment losses (3) (32) (14) (0) (49)
Exchange differences on translating foreign operations 0 16 139 35 190
Others 1 16 61 (10) 68
Balance as of March 31, 2018 $(10) $(1,569) $(4,128) $ (650) $(6,357)
[Carrying amount]
Land and landimprovements
Buildingsand
leaseholdimprovements
Machineryand
equipmentProjects inprogress Mining rights Total
2018 (Millions of Yen) ¥86,340 ¥162,429 ¥416,886 ¥49,519 ¥35,052 ¥750,226
2017 (Millions of Yen) ¥90,630 ¥184,121 ¥431,706 ¥53,776 ¥35,624 ¥795,8572018 (Millions of U.S. Dollars) $815 $1,532 $3,933 $467 $331 $7,078
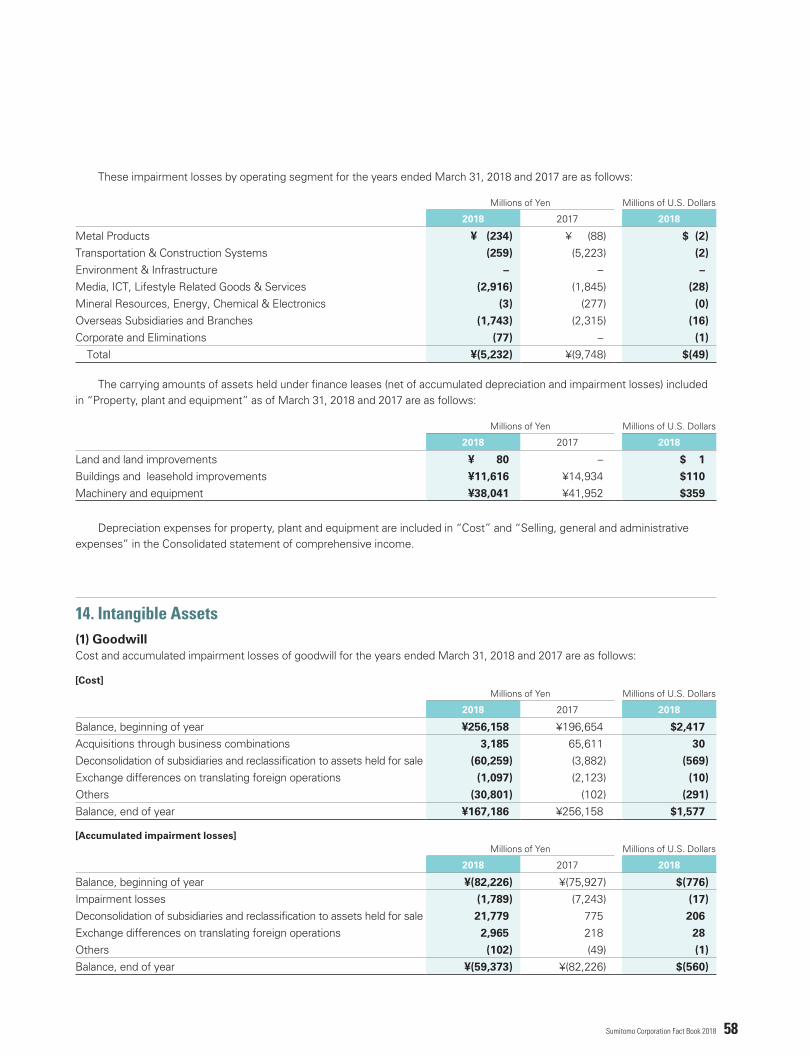
58Sumitomo Corporation Fact Book 2018
These impairment losses by operating segment for the years ended March 31, 2018 and 2017 are as follows:
The carrying amounts of assets held under finance leases (net of accumulated depreciation and impairment losses) included in “Property, plant and equipment” as of March 31, 2018 and 2017 are as follows:
Depreciation expenses for property, plant and equipment are included in “Cost” and “Selling, general and administrative expenses” in the Consolidated statement of comprehensive income.
Millions of Yen Millions of U.S. Dollars
2018 2017 2018
Metal Products ¥ (234) ¥ (88) $ (2)
Transportation & Construction Systems (259) (5,223) (2)
Environment & Infrastructure – – –
Media, ICT, Lifestyle Related Goods & Services (2,916) (1,845) (28)
Mineral Resources, Energy, Chemical & Electronics (3) (277) (0)
Overseas Subsidiaries and Branches (1,743) (2,315) (16)
Corporate and Eliminations (77) – (1)
Total ¥(5,232) ¥(9,748) $(49)
Millions of Yen Millions of U.S. Dollars
2018 2017 2018
Land and land improvements ¥ 80 – $ 1
Buildings and leasehold improvements ¥11,616 ¥14,934 $110
Machinery and equipment ¥38,041 ¥41,952 $359
[Cost]Millions of Yen Millions of U.S. Dollars
2018 2017 2018
Balance, beginning of year ¥256,158 ¥196,654 $2,417
Acquisitions through business combinations 3,185 65,611 30
Deconsolidation of subsidiaries and reclassification to assets held for sale (60,259) (3,882) (569)
Exchange differences on translating foreign operations (1,097) (2,123) (10)
Others (30,801) (102) (291)
Balance, end of year ¥167,186 ¥256,158 $1,577
[Accumulated impairment losses]Millions of Yen Millions of U.S. Dollars
2018 2017 2018
Balance, beginning of year ¥(82,226) ¥(75,927) $(776)
Impairment losses (1,789) (7,243) (17)
Deconsolidation of subsidiaries and reclassification to assets held for sale 21,779 775 206
Exchange differences on translating foreign operations 2,965 218 28
Others (102) (49) (1)
Balance, end of year ¥(59,373) ¥(82,226) $(560)
14. Intangible Assets
Cost and accumulated impairment losses of goodwill for the years ended March 31, 2018 and 2017 are as follows:(1) Goodwill

59 Sumitomo Corporation Fact Book 2018
Financial Section
The impairment losses recognized on goodwill for the years ended March 31, 2018 and 2017 are ¥1,789 million ($17 million) and ¥7,243 million, respectively, and are included in “Impairment losses on long-lived assets” in the Consolidated statement of comprehensive income. The impairment losses on goodwill during the year ended March 31, 2017 consisted of mainly operations related to Edgen Group. The impairment loss of ¥2,601 million was recognized due to revision of the business plan resulting from stagnation of the oil prices. The
Millions of Yen Millions of U.S. Dollars
2018 2017 2018
Metal Products ¥ 12,114 ¥ 12,118 $ 114
Transportation & Construction Systems 4,638 20,513 44
Environment & Infrastructure – – –
Media, ICT, Lifestyle Related Goods & Services 52,561 81,359 496
Mineral Resources, Energy, Chemical & Electronics 4,226 4,546 40
Overseas Subsidiaries and Branches 34,274 55,396 323
Total ¥107,813 ¥173,932 $1,017
Goodwill arising from business combinations is allocated to each of the Companies’ CGU that is expected to benefit from the synergies of the business combination at the date of acquisition of the business.
The carrying amounts of goodwill by operating segments as of March 31, 2018 and 2017 are as follows:
[Carrying amount]Carrying amount
2018 (Millions of Yen) ¥107,813
2017 (Millions of Yen) ¥173,9322018 (Millions of U.S. Dollars) $ 1,017
impairment losses of ¥754 million and ¥1,847 million were recognized in the Metal Products segment and the Overseas Subsidiaries and Branches segment, respectively. Goodwill with a carrying amount of ¥34,609 million ($327 million) related to TBC is reclassified to assets held for sale. In addition, a portion of Goodwill is reclassified to Other intangible assets as the purchase price allocation for the acquisition of Fyffes plc is complete.
Goodwill is tested for impairment annually or more frequently when there are indicators of impairment.
Significant portion of goodwill as of March 31, 2018 is related to Fyffes plc of ¥39,304 million ($371 million) and as of March 31, 2017 was related to Fyffes plc of ¥65,167 million and TBC Corporation of ¥36,508 million.
For the impairment test of goodwill related to Fyffes plc, goodwill is allocated across multiple CGUs and their recoverable amounts are calculated based on the value in use. The value in use is estimated by using the present value of 3-year future cash flows based on the business plan that was used as the basis of consideration paid, amended to reflect the recent business environment, with support of an independent appraiser. The key assumptions with significant impact on the calculation of the value in use are sales volume and the margin of trading, etc. The growth rates used are
determined by considering the long term average growth rate of the market or the country which the CGU belongs to, and the growth rates used at the impairment test of goodwill related to Fyffes plc are approximately 2%. The discount rates used are calculated based on the weighted average capital cost or capital cost of each CGU, and the discount rates used at the impairment test of goodwill related to Fyffes plc are approximately 6 to 8%.
There is a possibility that the impairment loss may be recognized for Fyffes plc if the key assumptions for business plan used for estimating future cash flows change.
For other impairment tests of goodwill, recoverable amounts are calculated based on value in use. The value in use is the present value calculated by discounting the estimated cash flows based on the business plans approved by management and a growth rate. The business plans are

60Sumitomo Corporation Fact Book 2018
Cost and accumulated depreciation and impairment losses of other intangible assets as of March 31, 2018 and 2017 are as follows:(2) Other Intangible Assets
not longer than five years in principle, and reflect the management assessments of future industry trends and historical data based on the external and internal information. The growth rates used are determined by considering the long term average growth rates of the market or the country which the CGU belongs to. The growth rates used do not
exceed the long term average growth rates of the market or country (domestic: approximately 1% or less, overseas: approximately 4% or less). The discount rates used are calculated based on the weighted average capital cost or capital cost of each CGU (domestic: approximately 4 to 9%, overseas: approximately 6 to 16%).
[Cost]Millions of Yen
Software
Sales licenses,trademarks and
customerrelationships Others Total
Balance as of April 1, 2016 ¥121,748 ¥243,014 ¥18,481 ¥383,243Acquisitions through business combinations 4 8,656 11 8,671Separate acquisitions 10,882 201 959 12,042Deconsolidation of subsidiaries (1,648) (3,390) (104) (5,142)Disposals (2,543) (247) (2,941) (5,731)Exchange differences on translating foreign operations (187) (2,407) (441) (3,035)Others 1,443 880 (854) 1,469Balance as of March 31, 2017 ¥129,699 ¥246,707 ¥15,111 ¥391,517Acquisitions through business combinations 142 – – 142
Separate acquisitions 9,211 40 569 9,820
Deconsolidation of subsidiaries and reclassification to assets held for sale (946) (73,120) (215) (74,281)
Disposals (3,684) (545) (162) (4,391)
Exchange differences on translating foreign operations (830) (6,603) (355) (7,788)
Others 1,713 31,034 (261) 32,486
Balance as of March 31, 2018 ¥135,305 ¥197,513 ¥14,687 ¥347,505
Millions of U.S. Dollars
Software
Sales licenses,trademarks and
customerrelationships Others Total
Balance as of March 31, 2017 $1,224 $2,327 $143 $3,694Acquisitions through business combinations 1 – – 1
Separate acquisitions 87 1 5 93
Deconsolidation of subsidiaries and reclassification to assets held for sale (9) (690) (2) (701)
Disposals (35) (5) (2) (42)
Exchange differences on translating foreign operations (8) (62) (3) (73)
Others 16 292 (2) 306
Balance as of March 31, 2018 $1,276 $1,863 $139 $3,278
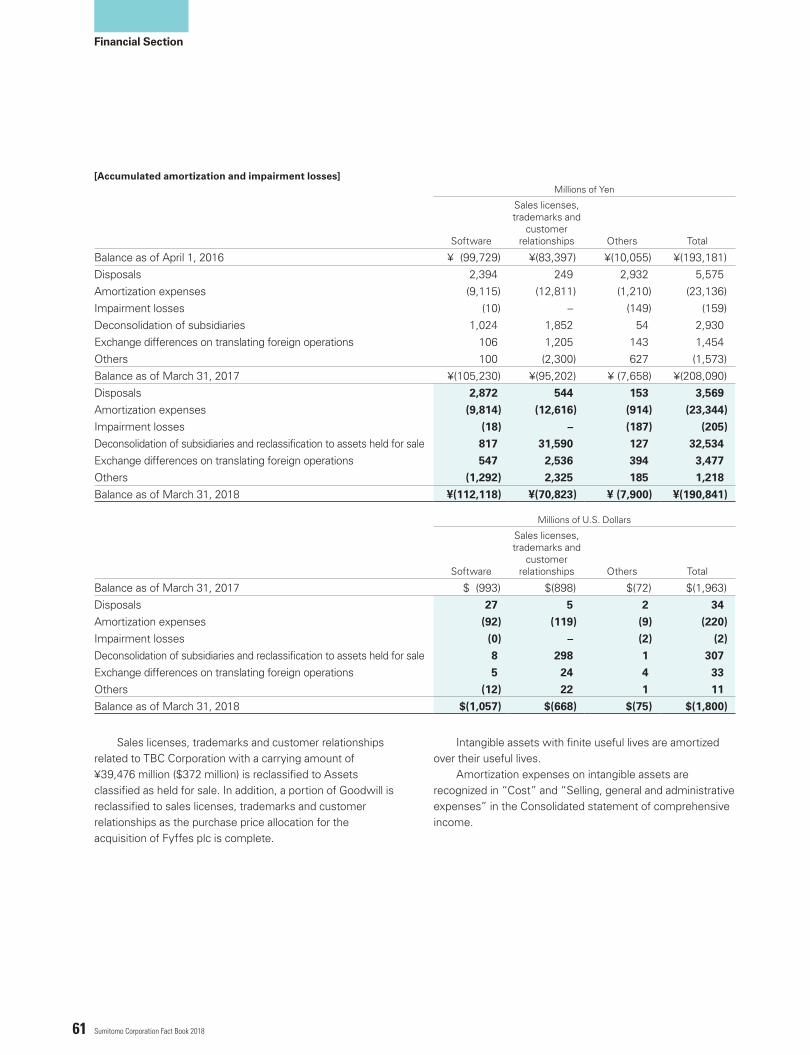
61 Sumitomo Corporation Fact Book 2018
Financial Section
Sales licenses, trademarks and customer relationships related to TBC Corporation with a carrying amount of ¥39,476 million ($372 million) is reclassified to Assets classified as held for sale. In addition, a portion of Goodwill is reclassified to sales licenses, trademarks and customer relationships as the purchase price allocation for the acquisition of Fyffes plc is complete.
Intangible assets with finite useful lives are amortized over their useful lives. Amortization expenses on intangible assets are recognized in “Cost” and “Selling, general and administrative expenses” in the Consolidated statement of comprehensive income.
[Accumulated amortization and impairment losses]Millions of Yen
Software
Sales licenses,trademarks and
customerrelationships Others Total
Balance as of April 1, 2016 ¥ (99,729) ¥(83,397) ¥(10,055) ¥(193,181)Disposals 2,394 249 2,932 5,575Amortization expenses (9,115) (12,811) (1,210) (23,136)Impairment losses (10) – (149) (159)Deconsolidation of subsidiaries 1,024 1,852 54 2,930Exchange differences on translating foreign operations 106 1,205 143 1,454Others 100 (2,300) 627 (1,573)Balance as of March 31, 2017 ¥(105,230) ¥(95,202) ¥ (7,658) ¥(208,090)Disposals 2,872 544 153 3,569
Amortization expenses (9,814) (12,616) (914) (23,344)
Impairment losses (18) – (187) (205)
Deconsolidation of subsidiaries and reclassification to assets held for sale 817 31,590 127 32,534
Exchange differences on translating foreign operations 547 2,536 394 3,477
Others (1,292) 2,325 185 1,218
Balance as of March 31, 2018 ¥(112,118) ¥(70,823) ¥ (7,900) ¥(190,841)
Millions of U.S. Dollars
Software
Sales licenses,trademarks and
customerrelationships Others Total
Balance as of March 31, 2017 $ (993) $(898) $(72) $(1,963)Disposals 27 5 2 34
Amortization expenses (92) (119) (9) (220)
Impairment losses (0) – (2) (2)
Deconsolidation of subsidiaries and reclassification to assets held for sale 8 298 1 307
Exchange differences on translating foreign operations 5 24 4 33
Others (12) 22 1 11
Balance as of March 31, 2018 $(1,057) $(668) $(75) $(1,800)

62Sumitomo Corporation Fact Book 2018
Significant portions of sales licenses, trademarks and customer relationships as of March 31, 2018 are related to Fyffes plc of ¥39,711 million ($375 million; average remaining amortization period of 19 years for intangible assets with finite useful lives), and as of March 31, 2017 were related to TBC Corporation of ¥41,911 million. Intangible assets with indefinite useful lives as of March 31, 2018 and 2017 included above are ¥14,277 million ($135 million) and ¥6,756 million, respectively, and consist mainly of trademarks. Those trademarks were acquired through business combinations which are expected to exist as long as business continues, therefore the management considers
the useful lives for these as indefinite. The carrying amount of Intangible assets leased under finance leases, net of accumulated amortization and impairment losses, as of March 31, 2018 and 2017 are ¥291 million ($2 million) and ¥360 million, respectively, and are included in Intangible assets, mainly software. The internally generated intangible assets, net of accumulated amortization and impairment losses, as of March 31, 2018 and 2017 are ¥8,909 million ($84 million) and ¥11,711 million, respectively, and mainly are included in software.
[Carrying amount]
Software
Sales licenses,trademarks and
customerrelationships Others Total
2018 (Millions of Yen) ¥23,187 ¥126,690 ¥6,787 ¥156,664
2017 (Millions of Yen) ¥24,469 ¥151,505 ¥7,453 ¥183,4272018 (Millions of U.S. Dollars) $219 $1,195 $64 $1,478
15. Investment PropertyCost and accumulated depreciation and impairment losses of investment property as of March 31, 2018 and 2017 are as follows:
[Cost]Millions of Yen Millions of U.S. Dollars
2018 2017 2018
Balance, beginning of year ¥359,012 ¥309,050 $3,387
Acquisitions 3,985 57,541 38
Deconsolidation of subsidiaries (25,105) – (237)
Disposals (11,865) (10,406) (112)
Exchange differences on translating foreign operations (2,721) 1,663 (26)
Reclassification 2,008 897 19
Others 20 267 0
Balance, end of year ¥325,334 ¥359,012 $3,069

63 Sumitomo Corporation Fact Book 2018
Financial Section
[Accumulated depreciation and impairment losses]Millions of Yen Millions of U.S. Dollars
2018 2017 2018
Balance, beginning of year ¥(47,897) ¥(42,427) $(452)
Depreciation expenses (5,670) (5,724) (54)
Impairment losses – (1,653) –
Deconsolidation of subsidiaries 1,682 – 16
Disposals 4,744 2,198 45
Exchange differences on translating foreign operations 274 (81) 3
Reclassification (497) (218) (5)
Others 56 8 1
Balance, end of year ¥(47,308) ¥(47,897) $(446)
16. Biological AssetsBiological assets as of March 31, 2018 and 2017 are as follows:
Millions of Yen Millions of U.S. Dollars
2018 2017 2018
Balance, beginning of year ¥12,536 ¥11,911 $118
Increases due to purchases 3,649 582 34
Decreases due to harvest (824) (788) (8)
The gain or loss arising from changes in fair value less costs to sell 1,074 735 10
Exchange differences on translating foreign operations (378) 96 (3)
Balance, end of year ¥16,057 ¥12,536 $151
The fair value as of the end of each reporting period is based on a valuation conducted by independent valuation appraisers having current experience in the locations and categories of the investment property being valued and the appropriate and recognized professional qualifications, such as a registered appraiser. The valuation, which conforms to the standards of the country where the investment property is located, is based on market evidence of transaction prices for similar properties. All of Investment property are classified in the level 3 under International Financial Reporting Standard No.13 Fair
Value Measurement, and measured with unobservable inputs for the assets or liabilities. Rental income from investment property for the years ended March 31, 2018 and 2017 are ¥23,795 million ($224 million) and ¥28,103 million, respectively, and are reported in “Revenue” in the Consolidated statement of comprehensive income. Expenses directly attributable to generating rental income (including repairs and maintenance) for the years ended March 31, 2018 and 2017 are ¥16,719 million ($158 million) and ¥19,567 million, respectively, and are included mainly in “Cost.”
Impairment losses recognized for the year ended March 31, 2017 were ¥1,653 million and were included in “Impairment losses on long-lived assets” in the Consolidated statement of comprehensive income.
[Carrying amount and fair value]Carrying amount Fair value
2018 (Millions of Yen) ¥278,026 ¥327,930
2017 (Millions of Yen) ¥311,115 ¥361,3882018 (Millions of U.S. Dollars) $2,623 $3,094

64Sumitomo Corporation Fact Book 2018
17. Deferred TaxesThe tax effects of temporary differences that give rise to significant components of deferred tax assets and liabilities as of March 31, 2018 and 2017 are as follows:
The Companies own forest assets (mainly pines) in New Zealand. The assets are measured at fair value less estimated selling cost. All of Biological assets are classified in the level 3 under International Financial Reporting Standard No. 13 Fair Value Measurement, and measured with unobservable inputs for the assets or liabilities.
Millions of Yen Millions of U.S. Dollars
2018 2017 2018
Deferred tax assets:Net operating loss carry forwards ¥ 51,116 ¥ 58,200 $ 482
Securities and other investments 17,305 20,862 163
Inventories and long-lived assets 42,931 41,230 405
Allowance for doubtful receivables 4,583 33,613 43
Retirement benefit plans 10,158 11,797 96
Others 57,778 78,298 545
Deferred tax assets total ¥ 183,871 ¥ 244,000 $ 1,734
Deferred tax liabilities:Investments accounted for using the equity method ¥ (47,136) ¥ (49,707) $ (445)
Securities and other investments (81,249) (73,763) (766)
Long-lived assets (84,279) (98,626) (795)
Others (40,725) (70,986) (384)
Deferred tax liabilities total ¥(253,389) ¥(293,082) $(2,390)
Deferred tax assets and liabilities reported in the Consolidated statement of financial position as of March 31, 2018 and 2017 are as follows:
Millions of Yen Millions of U.S. Dollars
2018 2017 2018
Deferred tax assets ¥ 42,202 ¥ 67,758 $ 398
Deferred tax liabilities (111,720) (116,840) (1,054)

65 Sumitomo Corporation Fact Book 2018
Financial Section
Changes in deferred tax assets and liabilities for the years ended March 31, 2018 and 2017 are as follows:
Millions of Yen Millions of U.S. Dollars
2018 2017 2018
Net deferred tax assets (liabilities):Balance, beginning of year ¥(49,082) ¥(49,810) $(463)
Amount recognized in other comprehensive income:
Financial assets measured at FVTOCI (9,051) (9,936) (85)
Remeasurements of defined benefit pension plans (1,489) (5,223) (14)
Exchange differences on translating foreign operations (6,073) (976) (57)
Cash-flow hedges 1,390 (1,345) 13
Share of other comprehensive income of investments accounted for using the equity method (27) 466 (1)
Amount recognized in profit or loss 940 22,440 9
Effects of acquisitions and divestitures (6,126) (4,698) (58)
Balance, end of year ¥(69,518) ¥(49,082) $(656)
The Companies consider the probability that a portion of, or all of the future deductible temporary differences or operating loss carry forwards can be utilized against future taxable profits on recognition of deferred tax assets. In assessing the recoverability of deferred tax assets, the Companies consider the scheduled reversal of deferred tax liabilities, projected future taxable income and tax planning strategies. Based on the level of historical taxable profits and projected future taxable income during the periods in which deferred tax assets can be recognized, the Companies determined that it is probable that the tax benefits can be utilized. The amount of the deferred tax assets considered realizable could be reduced in the near term if estimates of future taxable income during the carryforward period are reduced. As a result of the assessment of the recoverability of deferred tax assets, the net change in deferred tax assets for the years ended March 31, 2018 and 2017 is a decrease of ¥10,460 million ($99 million) and an increase of ¥15,257 million, respectively.
Deferred tax assets were not recognized for certain tax losses and deductible temporary differences which relate principally to the net operating loss carry forwards of certain domestic subsidiaries. The Companies performed an analysis of each of these subsidiaries to assess their ability to realize such deferred tax assets and reduce the amount of those assets to the extent that the Companies believe it is not probable that tax benefits will be utilized. No deferred tax assets are recognized at certain domestic subsidiaries attributable to tax losses carry forwards and deductible temporary differences when it is not probable that future taxable profit will be available. The amounts of unused tax loss carry forwards and deductible temporary differences for which no deferred tax asset is recognized amounted to ¥398,705 million ($3,761 million) and ¥140,805 million ($1,328 million) as of March 31, 2018 and ¥577,890 million and ¥132,711 million as of March 31, 2017, respectively. The deductible temporary differences do not expire under current tax legislation.
The tax losses for which deferred tax assets are not recognized as of March 31, 2018 and 2017 expire as follows:
Millions of Yen Millions of U.S. Dollars
2018 2017 2018
1st year ¥103,680 ¥ 1,430 $ 978
2nd year 34,647 107,061 327
3rd year 1,236 34,432 12
4th year 864 2,302 8
5th year and thereafter 258,278 432,665 2,436
Total ¥398,705 ¥577,890 $3,761

66Sumitomo Corporation Fact Book 2018
As of March 31, 2018 and 2017, in principle, the Companies did not recognize a deferred tax liability on the taxable temporary differences associated with investments in subsidiaries because the Companies were in a position to control the timing of the reversal of the temporary differences and it was probable that such differences would not reverse in the foreseeable future. The amount of taxable temporary differences associated with investments in subsidiaries on which a deferred tax liability was not
recognized in the accompanying consolidated financial statements as of March 31, 2018 and 2017 totaled to ¥998,879 million ($9,423 million) and ¥1,043,299 million, respectively. Other current assets as of March 31, 2018 and 2017 included tax receivables of ¥34,253 million ($323 million) and ¥45,140 million, respectively.
18. Bonds and BorrowingsDetails of the bonds and borrowings (non-current), and interest rates as of March 31, 2018 and 2017 are as follows:
Millions of Yen Millions of U.S. Dollars
2018 2017 2018
Secured:Loans from banks and insurance companies, maturing serially
through 2037, average interest rate 3.05% ¥ 233,109 ¥ 277,845 $ 2,199
Unsecured:
Loans from banks and insurance companies, maturing serially through 2035, average interest rate 0.85% 2,369,572 2,560,143 22,355
Bonds payable in Japanese yen due,2017, fixed rates 0.50% to 1.98% – 20,038 –
2018, fixed and floating rates 0.34% to 1.89% – 30,168 –
2019, fixed rates 0.76% to 2.21% 35,515 35,965 335
2020, fixed rates 0.33% to 1.46% 30,467 30,669 288
2021, fixed rate 0.14% 9,964 9,955 94
2022, fixed rates 0.14% to 1.71% 98,259 89,017 927
2023, fixed rate 0.86% 30,694 30,783 290
2024, fixed rates 0.77% to 0.83% 35,517 35,571 335
2027, fixed rates 0.33% 19,904 – 188
2029, fixed rates 1.24% to 1.29% 27,559 27,634 260
2030, fixed rate 2.26% 12,093 12,178 114
2031, fixed rate 2.19% 11,977 12,035 113
2033, fixed rate 0.66% 10,006 – 94
Bonds payable in U.S. dollars due,2022, fixed rates 2.50% 50,632 – 478
Medium-term notes, maturing serially through 2022, average interest rate 1.68% 31,099 57,061 293
Subtotal 3,006,367 3,229,062 28,363
Less: Current maturities (405,751) (469,993) (3,828)
Bonds and borrowings (non-current) ¥2,600,616 ¥2,759,069 $24,535
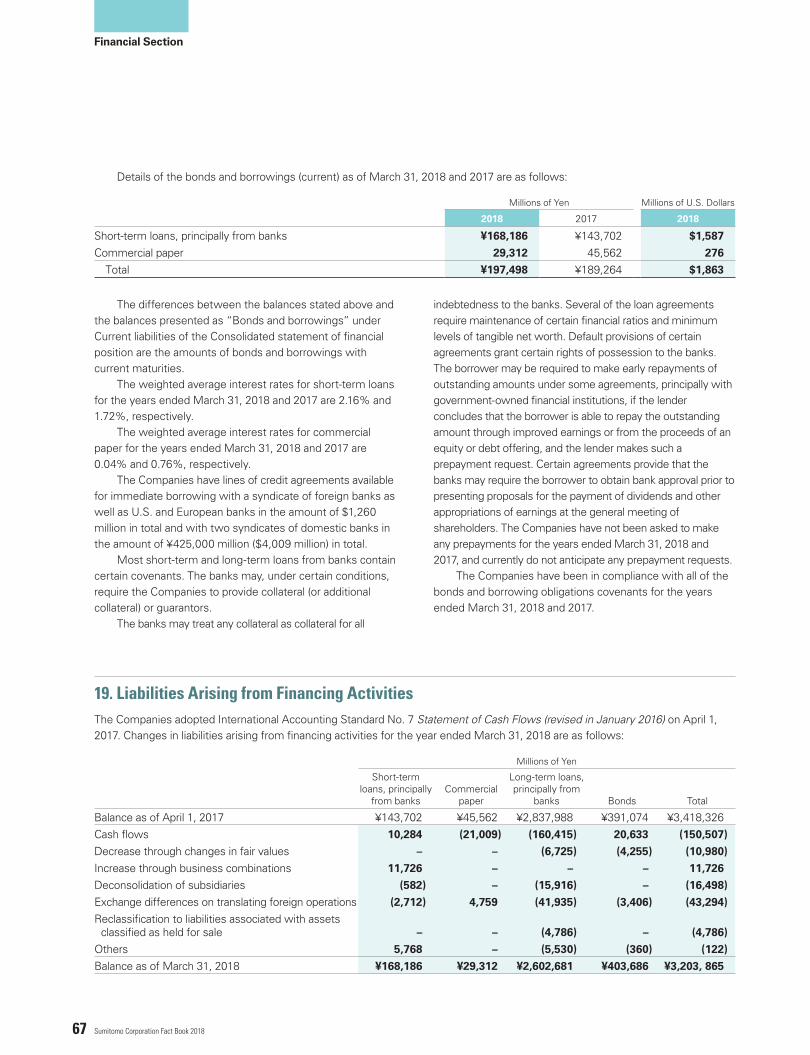
67 Sumitomo Corporation Fact Book 2018
Financial Section
The differences between the balances stated above and the balances presented as “Bonds and borrowings” under Current liabilities of the Consolidated statement of financial position are the amounts of bonds and borrowings with current maturities. The weighted average interest rates for short-term loans for the years ended March 31, 2018 and 2017 are 2.16% and 1.72%, respectively. The weighted average interest rates for commercial paper for the years ended March 31, 2018 and 2017 are 0.04% and 0.76%, respectively. The Companies have lines of credit agreements available for immediate borrowing with a syndicate of foreign banks as well as U.S. and European banks in the amount of $1,260 million in total and with two syndicates of domestic banks in the amount of ¥425,000 million ($4,009 million) in total. Most short-term and long-term loans from banks contain certain covenants. The banks may, under certain conditions, require the Companies to provide collateral (or additional collateral) or guarantors. The banks may treat any collateral as collateral for all
indebtedness to the banks. Several of the loan agreements require maintenance of certain financial ratios and minimum levels of tangible net worth. Default provisions of certain agreements grant certain rights of possession to the banks. The borrower may be required to make early repayments of outstanding amounts under some agreements, principally with government-owned financial institutions, if the lender concludes that the borrower is able to repay the outstanding amount through improved earnings or from the proceeds of an equity or debt offering, and the lender makes such a prepayment request. Certain agreements provide that the banks may require the borrower to obtain bank approval prior to presenting proposals for the payment of dividends and other appropriations of earnings at the general meeting of shareholders. The Companies have not been asked to make any prepayments for the years ended March 31, 2018 and 2017, and currently do not anticipate any prepayment requests. The Companies have been in compliance with all of the bonds and borrowing obligations covenants for the years ended March 31, 2018 and 2017.
19. Liabilities Arising from Financing ActivitiesThe Companies adopted International Accounting Standard No. 7 Statement of Cash Flows (revised in January 2016) on April 1, 2017. Changes in liabilities arising from financing activities for the year ended March 31, 2018 are as follows:
Details of the bonds and borrowings (current) as of March 31, 2018 and 2017 are as follows:
Millions of Yen Millions of U.S. Dollars
2018 2017 2018
Short-term loans, principally from banks ¥168,186 ¥143,702 $1,587
Commercial paper 29,312 45,562 276
Total ¥197,498 ¥189,264 $1,863
Millions of Yen
Short-term loans, principally
from banksCommercial
paper
Long-term loans, principally from
banks Bonds Total
Balance as of April 1, 2017 ¥143,702 ¥45,562 ¥2,837,988 ¥391,074 ¥3,418,326Cash flows 10,284 (21,009) (160,415) 20,633 (150,507)
Decrease through changes in fair values – – (6,725) (4,255) (10,980)
Increase through business combinations 11,726 – – – 11,726
Deconsolidation of subsidiaries (582) – (15,916) – (16,498)
Exchange differences on translating foreign operations (2,712) 4,759 (41,935) (3,406) (43,294)
Reclassification to liabilities associated with assets classified as held for sale – – (4,786) – (4,786)
Others 5,768 – (5,530) (360) (122)
Balance as of March 31, 2018 ¥168,186 ¥29,312 ¥2,602,681 ¥403,686 ¥3,203, 865

68Sumitomo Corporation Fact Book 2018
In the Consolidated statement of cash flows, other than the items listed above, Net increase in short-term debt includes deposits from associate and Proceeds from issuance of long-term debt and Repayment of long-term debt include amounts related to lease obligations, etc.
20. Trade and Other PayablesThe components of Trade and other payables as of March 31, 2018 and 2017 are as follows:
Millions of Yen Millions of U.S. Dollars
2018 2017 2018
Notes payable ¥ 33,535 ¥ 29,299 $ 316
Accounts payable 934,576 830,713 8,817
Payables to equity-accounted investees 50,878 39,907 480
Finance lease obligations 59,914 77,136 565
Other payables 63,862 173,365 603
Trade and other payables ¥1,142,765 ¥1,150,420 $10,781
The amount of Trade and other payables above includes financial liabilities measured at FVTPL of ¥91,788 million ($866 million) and ¥78,782 million as of March 31, 2018 and 2017, respectively. Payables to equity-accounted investees above include finance lease obligations of ¥11,710 million ($111 million) and ¥8,958 million as of March 31, 2018 and 2017, respectively.
Trade and other payables in the Consolidated statement of financial position as of March 31, 2018 and 2017 are as follows:
Millions of Yen Millions of U.S. Dollars
2018 2017 2018
Current liabilities ¥1,038,657 ¥1,029,294 $ 9,799
Non-current liabilities 104,108 121,126 982
Total ¥1,142,765 ¥1,150,420 $10,781
Millions of U.S. Dollars
Short-term loans, principally
from banksCommercial
paper
Long-term loans, principally from
banks Bonds Total
Balance as of April 1, 2017 $1,356 $ 430 $26,773 $3,689 $32,248Cash flows 97 (199) (1,513) 195 (1,420)
Decrease through changes in fair values – – (63) (41) (104)
Increase through business combinations 111 – – – 111
Deconsolidation of subsidiaries (6) – (150) – (156)
Exchange differences on translating foreign operations (25) 45 (396) (32) (408)
Reclassification to liabilities associated with assets classified as held for sale – – (45) – (45)
Others 54 – (52) (3) (1)
Balance as of March 31, 2018 $1,587 $ 276 $24,554 $3,808 $30,225
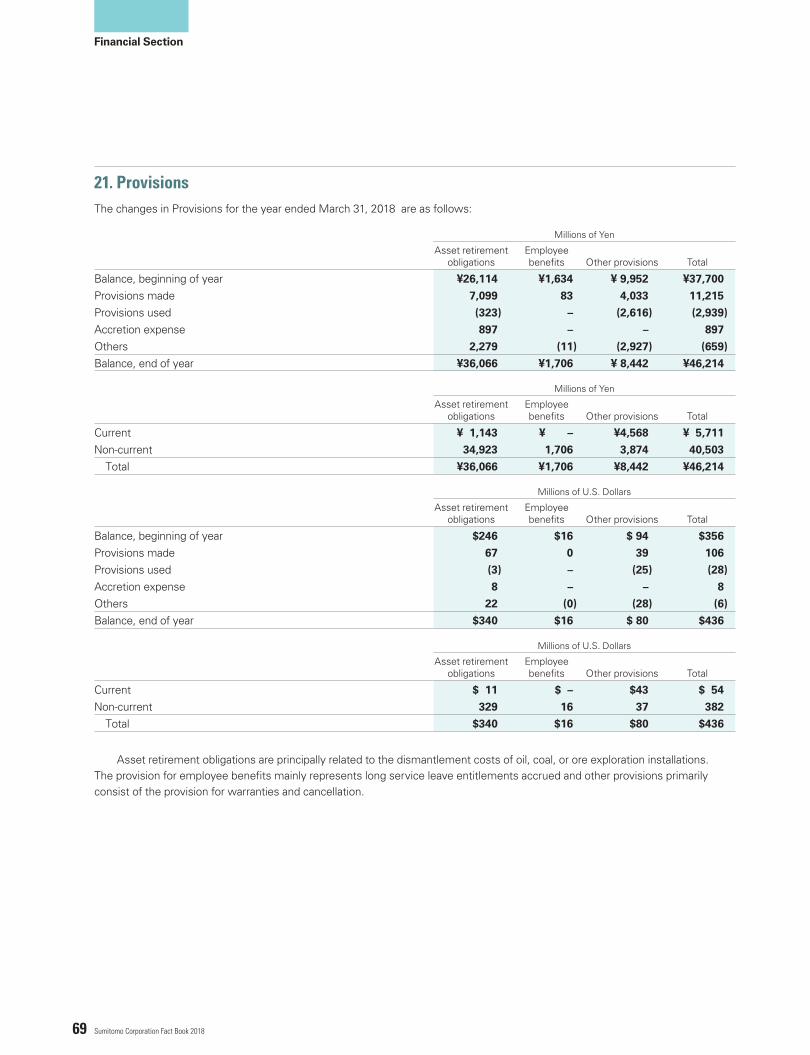
69 Sumitomo Corporation Fact Book 2018
Financial Section
The changes in Provisions for the year ended March 31, 2018 are as follows:
Asset retirement obligations are principally related to the dismantlement costs of oil, coal, or ore exploration installations.The provision for employee benefits mainly represents long service leave entitlements accrued and other provisions primarily consist of the provision for warranties and cancellation.
Millions of Yen
Asset retirementobligations
Employee benefits Other provisions Total
Balance, beginning of year ¥26,114 ¥1,634 ¥ 9,952 ¥37,700
Provisions made 7,099 83 4,033 11,215
Provisions used (323) – (2,616) (2,939)
Accretion expense 897 – – 897
Others 2,279 (11) (2,927) (659)
Balance, end of year ¥36,066 ¥1,706 ¥ 8,442 ¥46,214
Millions of U.S. Dollars
Asset retirementobligations
Employee benefits Other provisions Total
Balance, beginning of year $246 $16 $ 94 $356
Provisions made 67 0 39 106
Provisions used (3) – (25) (28)
Accretion expense 8 – – 8
Others 22 (0) (28) (6)
Balance, end of year $340 $16 $ 80 $436
Millions of Yen
Asset retirementobligations
Employee benefits Other provisions Total
Current ¥ 1,143 ¥ – ¥4,568 ¥ 5,711
Non-current 34,923 1,706 3,874 40,503
Total ¥36,066 ¥1,706 ¥8,442 ¥46,214
Millions of U.S. Dollars
Asset retirementobligations
Employee benefits Other provisions Total
Current $ 11 $ – $43 $ 54
Non-current 329 16 37 382
Total $340 $16 $80 $436
21. Provisions

70Sumitomo Corporation Fact Book 2018
Changes in the present value of the defined benefit obligations and changes in the fair value of the plan assets for the years ended March 31, 2018 and 2017 are as follows:
22. Employee Benefits
The Company has non-contributory defined benefit pension plans and lump-sum retirement benefit plans covering substantially all employees other than directors and executive officers. The plans provide benefits based upon years of service, compensation at the time of severance, and other factors. The Company has a responsibility to manage pension assets faithfully and has an obligation to make employee benefit contribution comply with laws and regulations. Under the Defined Benefit Corporate Pension Act, the Company recalculates the amount of pension contribution every three years to ascertain the validity of the contribution and so forth. The Company establishes the steering committee organized by related officers and employees as an advisory body to discuss important issues concerning the pension
plan. The committee holds a meeting timely to report net gains from investment, status of the system and method of accounting or to argue system revisions and investment policy change. Most of the subsidiaries have unfunded retirement benefit plans and/or funded pension plans. Employees, other than directors, are entitled to, under most circumstances, upon mandatory retirement at normal retirement age or earlier termination of employment, a lump-sum retirement benefit based on compensation at the time of retirement, years of service and other factors. Certain subsidiaries have defined contribution retirement benefit plans. Other than the above, the Company and certain subsidiaries have elective defined contribution pension plans for employees who elect to contribute a portion of their bonuses received for their services rendered during the year.
(1) Post-employment benefit
[Changes in the defined benefit obligations]Millions of Yen Millions of U.S. Dollars
2018 2017 2018
Balance, beginning of year ¥(371,133) ¥(358,402) $(3,501)
Service cost (12,183) (11,785) (115)
Interest on obligation (3,958) (2,355) (37)
Past service cost 108 914 1
Remeasurement (7,770) 6,885 (73)
Exchange differences on translating foreign operations (1,699) 1,648 (16)
Benefits paid 14,047 12,251 132
Curtailments or Settlements 10,594 – 100
Acquisitions, disposals and reclassification to liabilities associated with assets held for sale (net) 1,473 (20,289) 14
Balance, end of year ¥(370,521) ¥(371,133) $(3,495)
[Changes in the plan assets]Millions of Yen Millions of U.S. Dollars
2018 2017 2018
Balance, beginning of year ¥350,768 ¥327,084 $3,309
Interest on plan assets 3,758 2,800 35
Remeasurement 12,478 9,222 118
Exchange differences on translating foreign operations 871 (213) 8
Contributions by the employer 4,870 5,526 46
Benefits paid (12,493) (11,002) (118)
Settlements (9,883) – (93)
Acquisitions, disposals and reclassification to liabilities associated with assets held for sale (net) (1,115) 17,351 (10)
Balance, end of year ¥349,254 ¥350,768 $3,295

71 Sumitomo Corporation Fact Book 2018
Financial Section
The major categories of plan assets as of March 31, 2018 are as follows:
The measurement dates used to determine the benefit obligations are mainly March 31 of each year. The Companies’ funding policy is based on a number of factors including the tax deductibility of contributions, funded status, actuarial calculations and other considerations. Contributions are intended to provide not only for benefits attributable to service to date, but also for those expected to be earned in the future. In addition, the Company may contribute cash to an employee retirement benefit trust for any funding deficits in benefit obligations at the fiscal year end. The Companies’ investment policy is designed to increase the value of plan assets within acceptable risk levels to ensure payments of pension benefits to eligible participants, including future participants. Taking into account the return and risk on plan assets thereon, the Companies
formulate a strategic asset mix which aims at an optimal portfolio on a long-term basis and supervise asset management by selecting investment management companies and monitoring asset allocations. The strategic asset mix is subject to review in response to changes in expected market conditions or funded status. The strategic asset mix is not based on limitations but guidelines, and therefore, the actual allocation may temporarily exceed or fall below the guidelines. The Companies’ target allocation is 26% equity securities, 41% debt securities, and 33% others. The Companies hold a meeting regularly with the asset management institutions and discuss important issues regarding pension assets investment, and request the institutions to inform violations of investment policy and important business and operating conditions of the institutions.
Millions of Yen
Categories of plan assets
Prices are quoted in a
market
Prices are not quoted in a
market Total
Cash and cash equivalents ¥ 34,388 ¥ – ¥34,388
Equity securities:Domestic 35,402 – 35,402
Foreign 63,937 – 63,937
Debt securities:Domestic 24,948 – 24,948
Foreign 105,365 – 105,365
Hedge funds – 56,977 56,977
Life insurance company general accounts – 20,458 20,458
Private equity – 2,049 2,049
Others – 5,730 5,730
Total ¥264,040 ¥85,214 ¥349,254

72Sumitomo Corporation Fact Book 2018
The major categories of plan assets as of March 31, 2018 are as follows:
The major categories of plan assets as of March 31, 2017 are as follows:
Principal assumptions used in the actuarial valuations for the years ended March 31, 2018 and 2017 are as follows:
Millions of Yen
Categories of plan assets
Prices are quoted in a
market
Prices are not quoted in a
market Total
Cash and cash equivalents ¥ 58,387 ¥ – ¥ 58,387Equity securities:
Domestic 31,751 – 31,751Foreign 66,991 – 66,991
Debt securities:Domestic 29,685 – 29,685Foreign 86,566 – 86,566
Hedge funds – 50,738 50,738Life insurance company general accounts – 19,724 19,724Private equity – 3,046 3,046Others – 3,880 3,880
Total ¥273,380 ¥77,388 ¥350,768
Millions of U.S. Dollars
Categories of plan assets
Prices are quoted in a
market
Prices are not quoted in a
market Total
Cash and cash equivalents $ 325 $ – $ 325
Equity securities:
Domestic 334 – 334
Foreign 603 – 603
Debt securities:
Domestic 235 – 235
Foreign 994 – 994
Hedge funds – 538 538
Life insurance company general accounts – 193 193
Private equity – 19 19
Others – 54 54
Total $2,491 $804 $3,295
%
2018 2017
Discount rate as of March 31 1.0 1.0The expected rate of salary increase 2.9 2.8

73 Sumitomo Corporation Fact Book 2018
Financial Section
The numbers of shares authorized and issued as of March 31, 2018 and 2017 are as follows:
The number of shares of treasury stock as of March 31, 2018 and 2017 included in the number of shares issued shown above were 2,070,753 shares and 2,333,692 shares, respectively.
23. Common Stock
24. Reserves
Under the Companies Act of Japan (“the Companies Act”), at least 50% of the proceeds of certain issues of common shares shall be credited to Common stock. The remainder of the proceeds shall be credited to Additional paid-in capital. The Companies Act permits, upon approval at the general meeting of shareholders, the transfer of amounts from Additional paid-in capital to Common stock.
The Companies Act provides that a 10% dividend of retained earnings shall be appropriated as additional paid-in capital or
as a legal reserve until the aggregate amount of the additional paid-in capital and the legal reserve equals 25% of common stock. The legal reserve may be used to eliminate or reduce a deficit or be transferred to retained earnings upon approval at the general meeting of shareholders. Retained earnings available for dividends under the Companies Act is based on the amount recorded in the Company’s general accounting records maintained in accordance with accounting principles generally accepted in Japan. The Companies Act limits the amount of retained earnings available for dividends. Retained earnings of
(1) Additional Paid-in Capital
(2) Retained Earnings
2018(Number of shares)
2017(Number of shares)
Authorized:Ordinary shares 2,000,000,000 2,000,000,000
Issued: Balance, beginning of year 1,250,602,867 1,250,602,867Adjustment for the year – –Balance, end of year 1,250,602,867 1,250,602,867
The changes in the key assumptions may affect the valuations of defined benefit obligations as of March 31, 2018 and 2017, a 0.5% increase in discount rate would lead to a decrease of ¥23,255 million ($219 million) and ¥22,295 million, respectively, a 0.5% decrease in discount rate would lead to an increase of ¥27,557 million ($260 million) and ¥26,569 million, respectively. This analysis shows the sensitivity to the key assumptions without taking into account projected all cash flow information. The employer’s contributions expected to be paid for the year ending March 31, 2019 are ¥10,101 million ($95 million). The weighted-average duration of the defined benefit obligation for the year ending March 31, 2018 is 18 years. The Companies’ pension and retirement benefits expense at the defined contribution plans for the years
ended March 31, 2018 and 2017 are ¥5,690 million ($54 million) and ¥4,717 million, respectively. In addition to lump-sum retirement benefit plans or retirement benefit pension plans, certain domestic subsidiaries participate in multi-employer defined benefit plans, and recognize the payments made during the fiscal year as an expense and contribution payable as a liability. The amount of contributions expected to be paid by the subsidiaries for the year ending March 31, 2019 are ¥369 million ($3 million).
The employee benefits expense included in “Cost” for the years ended March 31, 2018 and 2017 are ¥159,286 million ($1,503 million) and ¥145,675 million, respectively.
(2) Employee Benefits Expense

74Sumitomo Corporation Fact Book 2018
The changes in Other components of equity for the years ended March 31, 2018 and 2017 are as follows:
The following table provides each component of Other comprehensive income (loss) included in Non-controlling interests for the years ended March 31, 2018 and 2017.
25. Other Components of Equity and Other Comprehensive Income (Loss)
¥494,504 million ($4,665 million) and ¥367,656 million, shown by the Company’s accounting records for the years ended March 31, 2018 and 2017, respectively, were not restricted by the limitations under the Companies Act.
Millions of Yen Millions of U.S. Dollars
2018 2017 2018
Financial assets measured at FVTOCIBalance, beginning of year ¥173,005 ¥142,580 $1,632
Adjustment for the year 22,651 22,277 214
Transfer to retained earnings (5,822) 8,148 (55)
Balance, end of year ¥189,834 ¥173,005 $1,791
Remeasurements of defined benefit pension plansBalance, beginning of year ¥ – ¥ – $ –
Adjustment for the year 2,516 9,760 24
Transfer to retained earnings (2,516) (9,760) (24)
Balance, end of year ¥ – ¥ – $ –
Exchange differences on translating foreign operationsBalance, beginning of year ¥157,626 ¥199,395 $1,487
Adjustment for the year (77,002) (41,769) (726)
Balance, end of year ¥ 80,624 ¥157,626 $ 761
Cash-flow hedgesBalance, beginning of year ¥ (21,537) ¥ (30,095) $ (203)
Adjustment for the year (357) 8,558 (4)
Balance, end of year ¥ (21,894) ¥ (21,537) $ (207)
Other components of equityBalance, beginning of year ¥309,094 ¥311,880 $2,916
Adjustment for the year (52,192) (1,174) (493)
Transfer to retained earnings (8,338) (1,612) (78)
Balance, end of year ¥248,564 ¥309,094 $2,345
Millions of Yen Millions of U.S. Dollars
2018 2017 2018
Financial assets measured at FVTOCI ¥ 131 ¥ 233 $ 1
Remeasurements of defined benefit pension plans 286 844 3
Exchange differences on translating foreign operations (120) (5,852) (1)
Cash-flow hedges 34 (2) 1
Other comprehensive income (loss) ¥ 331 ¥(4,777) $ 4

75 Sumitomo Corporation Fact Book 2018
Financial Section
The following table provides an analysis of each component of other comprehensive income (loss) and related tax effects (including those on Non-controlling interests) for the years ended March 31, 2018 and 2017.
2018 Millions of Yen
Pretax amountTax (expense) or
benefitNet-of-tax amount
Financial assets measured at FVTOCI:Gains (losses) recorded in other comprehensive income during the year ¥ 30,124 ¥ (9,051) ¥ 21,073Adjustment for the year 30,124 (9,051) 21,073
Remeasurements of defined benefit pension plans:Gains (losses) recorded in other comprehensive income during the year 4,708 (1,489) 3,219Adjustment for the year 4,708 (1,489) 3,219
Exchange differences on translating foreign operations: Aggregated adjustment during the year resulting from translation of foreign
currency financial statements (69,132) (6,007) (75,139)Reclassification to profit or loss for the year (1,917) (66) (1,983)Adjustment for the year (71,049) (6,073) (77,122)
Cash-flow hedges:Unrealized gains (losses) arising during the year (2,523) 656 (1,867)Reclassification to profit or loss for the year (1,589) 734 (855)Adjustment for the year (4,112) 1,390 (2,722)
Share of other comprehensive income of investments accounted for using the equity method:Unrealized gains (losses) arising during the year 1,311 (27) 1,284Reclassification to profit or loss for the year 2,407 – 2,407Adjustment for the year 3,718 (27) 3,691
Total other comprehensive income (loss) ¥(36,611) ¥(15,250) ¥(51,861)
2017 Millions of Yen
Pretax amountTax (expense) or
benefitNet-of-tax amount
Financial assets measured at FVTOCI:Gains (losses) recorded in other comprehensive income during the year ¥ 32,707 ¥ (9,936) ¥ 22,771Adjustment for the year 32,707 (9,936) 22,771
Remeasurements of defined benefit pension plans:Gains (losses) recorded in other comprehensive income during the year 16,107 (5,223) 10,884Adjustment for the year 16,107 (5,223) 10,884
Exchange differences on translating foreign operations: Aggregated adjustment during the year resulting from translation of foreign
currency financial statements (30,095) 5,954 (24,141)Reclassification to profit or loss for the year (16,550) (6,930) (23,480)Adjustment for the year (46,645) (976) (47,621)
Cash-flow hedges:Unrealized gains (losses) arising during the year 5,712 (1,446) 4,266Reclassification to profit or loss for the year (1,872) 101 (1,771)Adjustment for the year 3,840 (1,345) 2,495
Share of other comprehensive income of investments accounted for using the equity method:Unrealized gains (losses) arising during the year 873 466 1,339Reclassification to profit or loss for the year 4,181 – 4,181Adjustment for the year 5,054 466 5,520
Total other comprehensive income (loss) ¥ 11,063 ¥(17,014) ¥ (5,951)

76Sumitomo Corporation Fact Book 2018
2018 Millions of U.S. Dollars
Pretax amountTax (expense) or
benefitNet-of-tax amount
Financial assets measured at FVTOCI:Gains (losses) recorded in other comprehensive income during the year $ 284 $ (85) $ 199Adjustment for the year 284 (85) 199
Remeasurements of defined benefit pension plans:Gains (losses) recorded in other comprehensive income during the year 44 (14) 30Adjustment for the year 44 (14) 30
Exchange differences on translating foreign operations: Aggregated adjustment during the year resulting from translation of foreign
currency financial statements (652) (57) (709)Reclassification to profit or loss for the year (18) (0) (18)Adjustment for the year (670) (57) (727)
Cash-flow hedges:Unrealized gains (losses) arising during the year (24) 6 (18)Reclassification to profit or loss for the year (15) 7 (8)Adjustment for the year (39) 13 (26)
Share of other comprehensive income of investments accounted for using the equity method:Unrealized gains (losses) arising during the year 13 (1) 12Reclassification to profit or loss for the year 23 – 23Adjustment for the year 36 (1) 35
Total other comprehensive income (loss) $(345) $(144) $(489)
(1) Dividends paid during the years ended March 31, 2018 and 2017 are as follows:
(2) Dividends whose record date is in the current fiscal year but whose effective date is in the following fiscal year are as follows:
Resolution Class of shares
Amount of dividends Dividends per share
Record date Effective date Millions of Yen
(Millions of U.S. Dollars)Yen
(U.S. Dollars)
Ordinary general meeting of shareholders held on June 24, 2016 Ordinary shares ¥31,202 ¥25 March 31, 2016 June 27, 2016
Board of Directors’ meeting held on November 1, 2016 Ordinary shares ¥31,204 ¥25 September 30,
2016December 1, 2016
Ordinary general meeting of shareholders held on June 23, 2017 Ordinary shares ¥31,207
($294)¥25
($0.24) March 31, 2017 June 26, 2017
Board of Directors’ meeting held on November 6, 2017 Ordinary shares ¥34,955
($330)¥28
($0.26)September 30, 2017
December 1, 2017
Resolution Class of shares
Amount of dividends Dividends per shareRecord
date Effective
date Millions of Yen
(Millions of U.S. Dollars)Source of dividends
Yen(U.S. Dollars)
Ordinary general meeting of shareholders held on June 22, 2018 Ordinary shares ¥ 42,450
($400)Retained earnings
¥ 34($0.32)
March 31, 2018
June 25, 2018
26. Dividends

77 Sumitomo Corporation Fact Book 2018
Financial Section
The Company’s stock option activities for the years ended March 31, 2018 and 2017 are as follows:
Stock options outstanding and exercisable as of March 31, 2018 are as follows:
2018 2017
Number ofshares
Weighted averageexercise price Number of
shares
Weighted averageexercise price
Yen U.S. Dollars Yen
Outstanding, beginning of year 547,000 ¥1,328 $13 496,000 ¥1,400Granted 205,000 1,516 14 182,000 1,124Exercised 134,600 1,369 13 30,000 1,191Cancelled or expired 43,000 1,314 12 101,000 1,358
Outstanding, end of year 574,400 1,386 13 547,000 1,328Options exercisable, end of year 371,400 ¥1,316 $12 367,000 ¥1,428
2018
Outstanding Exercisable
Exercise price range Number of shares
Weighted average exercise price
Weighted averageremaining life Number of
shares
Weighted average exercise price
Yen Yen U.S. Dollars in years Yen U.S. Dollars
¥1,001 - 1,200 163,000 ¥1,124 $11 3.25 163,000 ¥1,124 $11
1,201 - 1,400 35,000 1,312 12 0.25 35,000 1,312 12
1,401 - 1,600 376,400 1,507 14 3.15 173,400 1,496 14
574,400 ¥1,386 $13 3.00 371,400 ¥1,316 $12
27. Share-based PaymentsInformation relating to the Company’s share-based payments is as follows:
The Company has stock option plans for directors, executive officers, and corporate officers under the Company’s qualification system. Under the plans, each stock option entitles the recipient to acquire 100 shares of common stock at an exercise price equal to the greater of (i) 105% of the average closing market price of the Company’s common stock on the Tokyo Stock Exchange for the calendar month before the grant date (excluding days when there are no transactions), or (ii) the closing market price of the
Company’s common stock on the Tokyo Stock Exchange on the grant date (or the closing market price on the day immediately preceding that date, if there are no transactions on that date). The options vest 100% at the grant date. The options granted are exercisable beginning April 1 of the fiscal year after the fiscal year in which they are granted. They are exercisable for four years and three months from that date. On May 17, 2017, the Board of Directors authorized the issue of new stock options for up to 205,000 shares of common stock. The options for 205,000 shares were granted under these authorizations.
Stock option plan
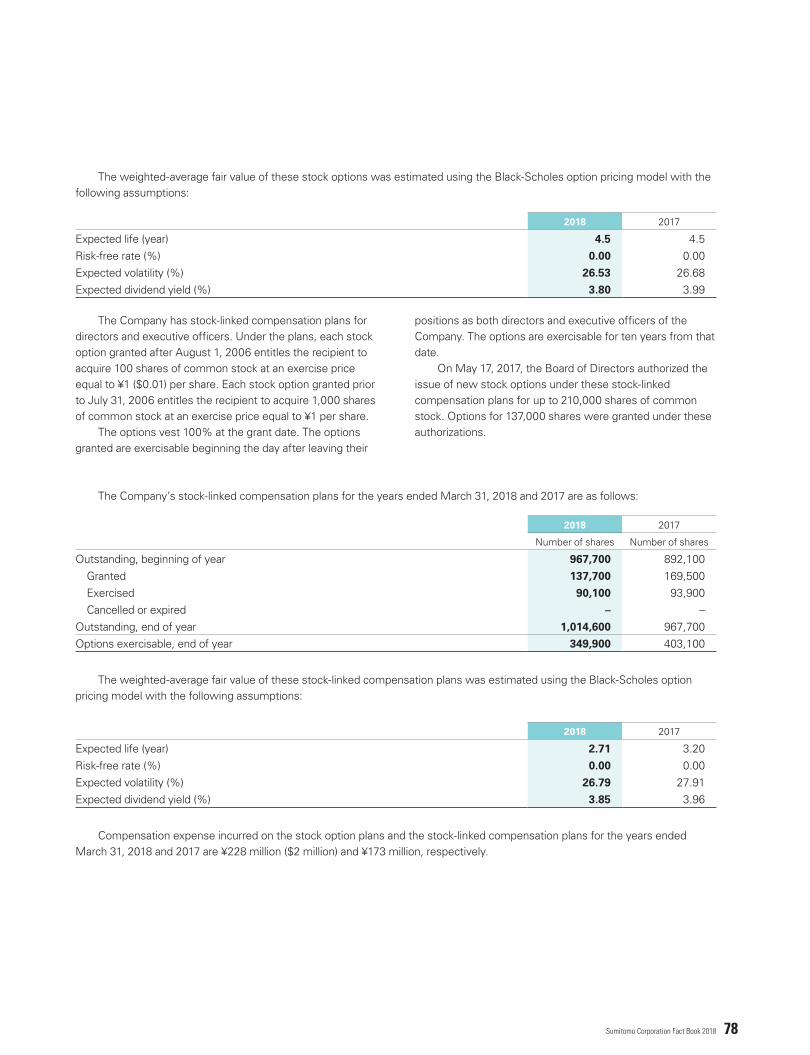
78Sumitomo Corporation Fact Book 2018
The weighted-average fair value of these stock options was estimated using the Black-Scholes option pricing model with the following assumptions:
The Company’s stock-linked compensation plans for the years ended March 31, 2018 and 2017 are as follows:
The weighted-average fair value of these stock-linked compensation plans was estimated using the Black-Scholes option pricing model with the following assumptions:
Compensation expense incurred on the stock option plans and the stock-linked compensation plans for the years ended March 31, 2018 and 2017 are ¥228 million ($2 million) and ¥173 million, respectively.
The Company has stock-linked compensation plans for directors and executive officers. Under the plans, each stock option granted after August 1, 2006 entitles the recipient to acquire 100 shares of common stock at an exercise price equal to ¥1 ($0.01) per share. Each stock option granted prior to July 31, 2006 entitles the recipient to acquire 1,000 shares of common stock at an exercise price equal to ¥1 per share. The options vest 100% at the grant date. The options granted are exercisable beginning the day after leaving their
positions as both directors and executive officers of the Company. The options are exercisable for ten years from that date. On May 17, 2017, the Board of Directors authorized the issue of new stock options under these stock-linked compensation plans for up to 210,000 shares of common stock. Options for 137,000 shares were granted under these authorizations.
2018 2017
Expected life (year) 4.5 4.5Risk-free rate (%) 0.00 0.00Expected volatility (%) 26.53 26.68Expected dividend yield (%) 3.80 3.99
2018 2017
Expected life (year) 2.71 3.20Risk-free rate (%) 0.00 0.00Expected volatility (%) 26.79 27.91Expected dividend yield (%) 3.85 3.96
2018 2017
Number of shares Number of shares
Outstanding, beginning of year 967,700 892,100Granted 137,700 169,500Exercised 90,100 93,900Cancelled or expired – –
Outstanding, end of year 1,014,600 967,700Options exercisable, end of year 349,900 403,100
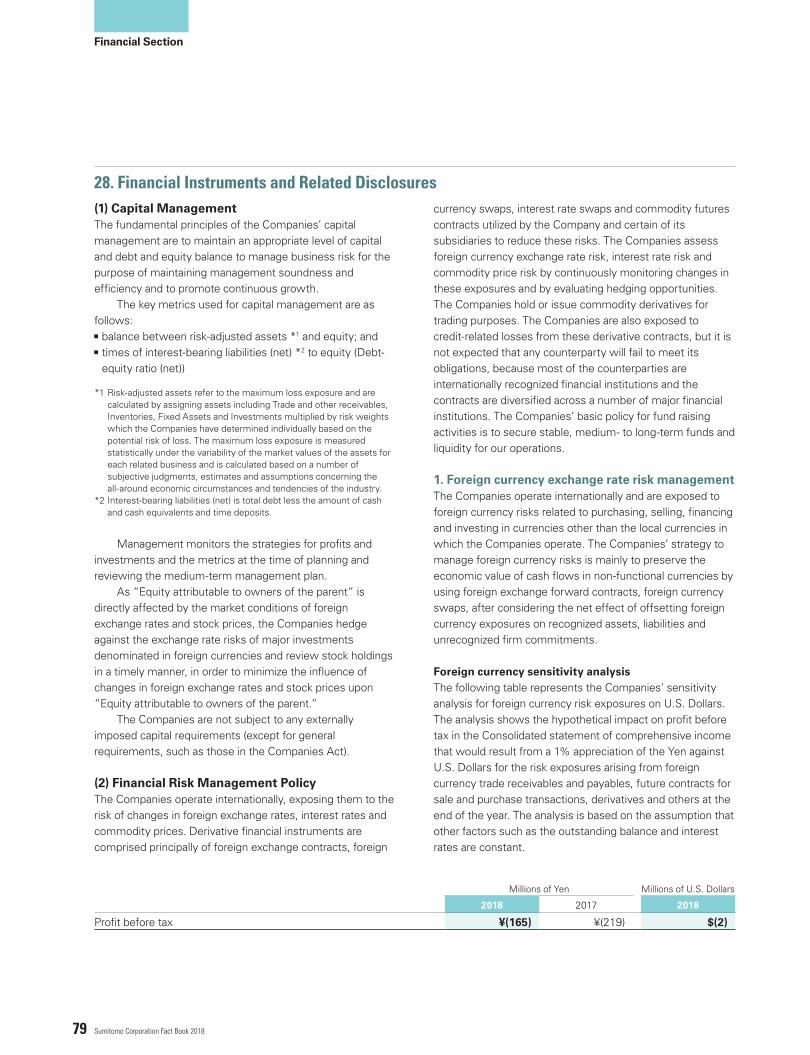
79 Sumitomo Corporation Fact Book 2018
Financial Section
28. Financial Instruments and Related Disclosures
The fundamental principles of the Companies’ capital management are to maintain an appropriate level of capital and debt and equity balance to manage business risk for the purpose of maintaining management soundness and efficiency and to promote continuous growth. The key metrics used for capital management are as follows: balance between risk-adjusted assets *1 and equity; and times of interest-bearing liabilities (net) *2 to equity (Debt-equity ratio (net))
Management monitors the strategies for profits and investments and the metrics at the time of planning and reviewing the medium-term management plan. As “Equity attributable to owners of the parent” is directly affected by the market conditions of foreign exchange rates and stock prices, the Companies hedge against the exchange rate risks of major investments denominated in foreign currencies and review stock holdings in a timely manner, in order to minimize the influence of changes in foreign exchange rates and stock prices upon “Equity attributable to owners of the parent.” The Companies are not subject to any externally imposed capital requirements (except for general requirements, such as those in the Companies Act).
The Companies operate internationally, exposing them to the risk of changes in foreign exchange rates, interest rates and commodity prices. Derivative financial instruments are comprised principally of foreign exchange contracts, foreign
*1 Risk-adjusted assets refer to the maximum loss exposure and are calculated by assigning assets including Trade and other receivables, Inventories, Fixed Assets and Investments multiplied by risk weights which the Companies have determined individually based on the potential risk of loss. The maximum loss exposure is measured statistically under the variability of the market values of the assets for each related business and is calculated based on a number of subjective judgments, estimates and assumptions concerning the all-around economic circumstances and tendencies of the industry.
*2 Interest-bearing liabilities (net) is total debt less the amount of cash and cash equivalents and time deposits.
currency swaps, interest rate swaps and commodity futures contracts utilized by the Company and certain of its subsidiaries to reduce these risks. The Companies assess foreign currency exchange rate risk, interest rate risk and commodity price risk by continuously monitoring changes in these exposures and by evaluating hedging opportunities. The Companies hold or issue commodity derivatives for trading purposes. The Companies are also exposed to credit-related losses from these derivative contracts, but it is not expected that any counterparty will fail to meet its obligations, because most of the counterparties are internationally recognized financial institutions and the contracts are diversified across a number of major financial institutions. The Companies’ basic policy for fund raising activities is to secure stable, medium- to long-term funds and liquidity for our operations.
The Companies operate internationally and are exposed to foreign currency risks related to purchasing, selling, financing and investing in currencies other than the local currencies in which the Companies operate. The Companies’ strategy to manage foreign currency risks is mainly to preserve the economic value of cash flows in non-functional currencies by using foreign exchange forward contracts, foreign currency swaps, after considering the net effect of offsetting foreign currency exposures on recognized assets, liabilities and unrecognized firm commitments.
Foreign currency sensitivity analysisThe following table represents the Companies’ sensitivity analysis for foreign currency risk exposures on U.S. Dollars. The analysis shows the hypothetical impact on profit before tax in the Consolidated statement of comprehensive income that would result from a 1% appreciation of the Yen against U.S. Dollars for the risk exposures arising from foreign currency trade receivables and payables, future contracts for sale and purchase transactions, derivatives and others at the end of the year. The analysis is based on the assumption that other factors such as the outstanding balance and interest rates are constant.
(1) Capital Management
1. Foreign currency exchange rate risk management
(2) Financial Risk Management Policy
Millions of Yen Millions of U.S. Dollars
2018 2017 2018
Profit before tax ¥(165) ¥(219) $(2)
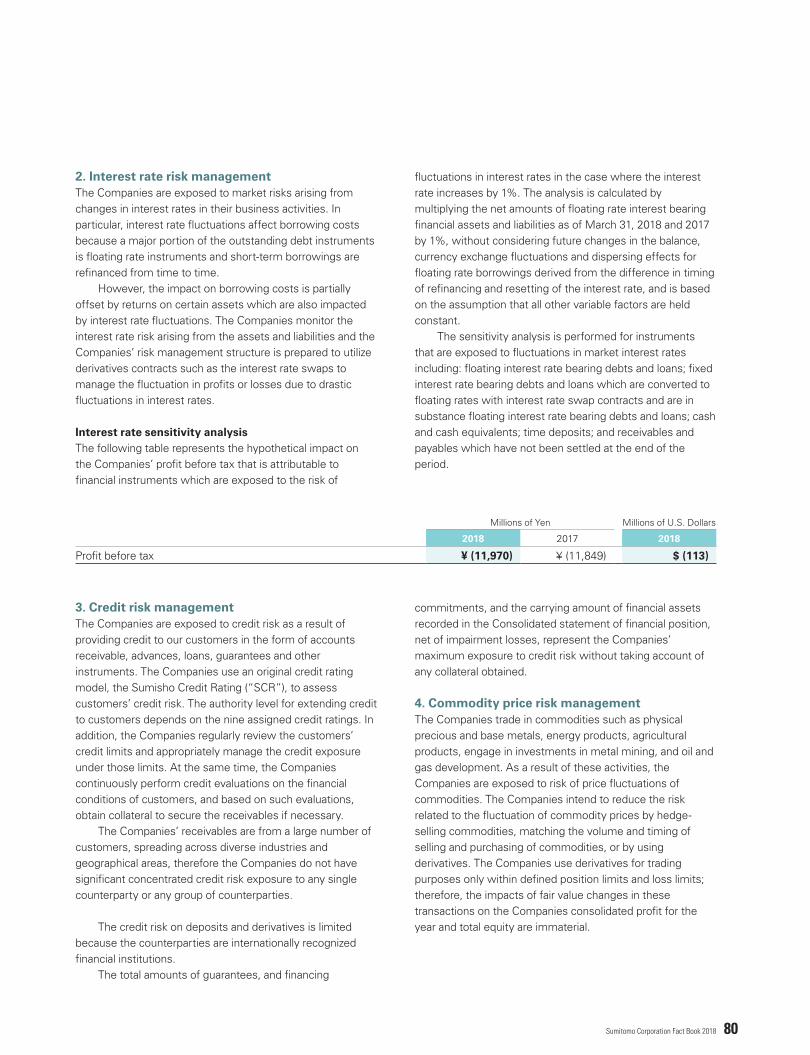
80Sumitomo Corporation Fact Book 2018
The Companies are exposed to market risks arising from changes in interest rates in their business activities. In particular, interest rate fluctuations affect borrowing costs because a major portion of the outstanding debt instruments is floating rate instruments and short-term borrowings are refinanced from time to time. However, the impact on borrowing costs is partially offset by returns on certain assets which are also impacted by interest rate fluctuations. The Companies monitor the interest rate risk arising from the assets and liabilities and the Companies’ risk management structure is prepared to utilize derivatives contracts such as the interest rate swaps to manage the fluctuation in profits or losses due to drastic fluctuations in interest rates.
Interest rate sensitivity analysisThe following table represents the hypothetical impact on the Companies’ profit before tax that is attributable to financial instruments which are exposed to the risk of
The Companies are exposed to credit risk as a result of providing credit to our customers in the form of accounts receivable, advances, loans, guarantees and other instruments. The Companies use an original credit rating model, the Sumisho Credit Rating (“SCR”), to assess customers’ credit risk. The authority level for extending credit to customers depends on the nine assigned credit ratings. In addition, the Companies regularly review the customers’ credit limits and appropriately manage the credit exposure under those limits. At the same time, the Companies continuously perform credit evaluations on the financial conditions of customers, and based on such evaluations, obtain collateral to secure the receivables if necessary. The Companies’ receivables are from a large number of customers, spreading across diverse industries and geographical areas, therefore the Companies do not have significant concentrated credit risk exposure to any single counterparty or any group of counterparties.
The credit risk on deposits and derivatives is limited because the counterparties are internationally recognized financial institutions. The total amounts of guarantees, and financing
fluctuations in interest rates in the case where the interest rate increases by 1%. The analysis is calculated by multiplying the net amounts of floating rate interest bearing financial assets and liabilities as of March 31, 2018 and 2017 by 1%, without considering future changes in the balance, currency exchange fluctuations and dispersing effects for floating rate borrowings derived from the difference in timing of refinancing and resetting of the interest rate, and is based on the assumption that all other variable factors are held constant. The sensitivity analysis is performed for instruments that are exposed to fluctuations in market interest rates including: floating interest rate bearing debts and loans; fixed interest rate bearing debts and loans which are converted to floating rates with interest rate swap contracts and are in substance floating interest rate bearing debts and loans; cash and cash equivalents; time deposits; and receivables and payables which have not been settled at the end of the period.
commitments, and the carrying amount of financial assets recorded in the Consolidated statement of financial position, net of impairment losses, represent the Companies’ maximum exposure to credit risk without taking account of any collateral obtained.
The Companies trade in commodities such as physical precious and base metals, energy products, agricultural products, engage in investments in metal mining, and oil and gas development. As a result of these activities, the Companies are exposed to risk of price fluctuations of commodities. The Companies intend to reduce the risk related to the fluctuation of commodity prices by hedge-selling commodities, matching the volume and timing of selling and purchasing of commodities, or by using derivatives. The Companies use derivatives for trading purposes only within defined position limits and loss limits; therefore, the impacts of fair value changes in these transactions on the Companies consolidated profit for the year and total equity are immaterial.
2. Interest rate risk management
3. Credit risk management
4. Commodity price risk management
Millions of Yen Millions of U.S. Dollars
2018 2017 2018
Profit before tax ¥ (11,970) ¥ (11,849) $ (113)

81 Sumitomo Corporation Fact Book 2018
Financial Section
The Companies’ basic policy for financing operation is to secure stable medium- to long-term funds and sufficient liquidity for the operations. Management has been monitoring liquidity risk by setting various worst case scenarios including financial market turmoil. The Companies secure necessary liquidity from the cash flows from operations, by borrowing from financial institutions with which the Companies have good relationships, bonds issued
The Companies’ remaining contractual maturities for non-derivative financial liabilities (excluding lease obligations and some other liabilities) as of March 31, 2018 and 2017 are as follows:
The Companies’ liquidity analysis for derivatives as of March 31, 2018 and 2017 is summarized in the table below. The table is based on the contractual future cash inflows and outflows of derivative instruments. The net contractual cash inflows and outflows of gross-settled derivative instruments are presented as net cash flows on a transaction-by-transaction basis. When receipt and payment of cash are not fixed, the amount disclosed was calculated based on the projected interest rates by reference to the yield curves at the end of the reporting period.
in the capital markets, and issuance of commercial paper. The Companies deposit these funds with highly creditable financial institutions which are generally given high credit ratings by credit rating agencies. The Companies have several unused long-term committed lines of credit with leading domestic and international financial institutions and several uncommitted lines of credit to reduce the liquidity risk.
5. Liquidity risk management
Millions of Yen
Due in1 year or less
Due after1 year through
5 yearsDue after5 years Total
2018
Bonds and borrowings ¥ 603,249 ¥1,407,210 ¥1,193,406 ¥3,203,865
Trade and other payables 1,002,653 36,201 31,322 1,070,176
Financial guarantee contracts 24,510 77,844 27,987 130,341
2017Bonds and borrowings ¥ 659,257 ¥1,499,094 ¥1,259,975 ¥3,418,326Trade and other payables 1,009,521 19,487 34,228 1,063,236Financial guarantee contracts 78,540 38,662 49,709 166,911
Millions of U.S. Dollars
Due in1 year or less
Due after1 year through
5 yearsDue after5 years Total
2018
Bonds and borrowings $5,691 $13,276 $11,259 $30,226
Trade and other payables 9,459 368 269 10,096
Financial guarantee contracts 231 735 264 1,230
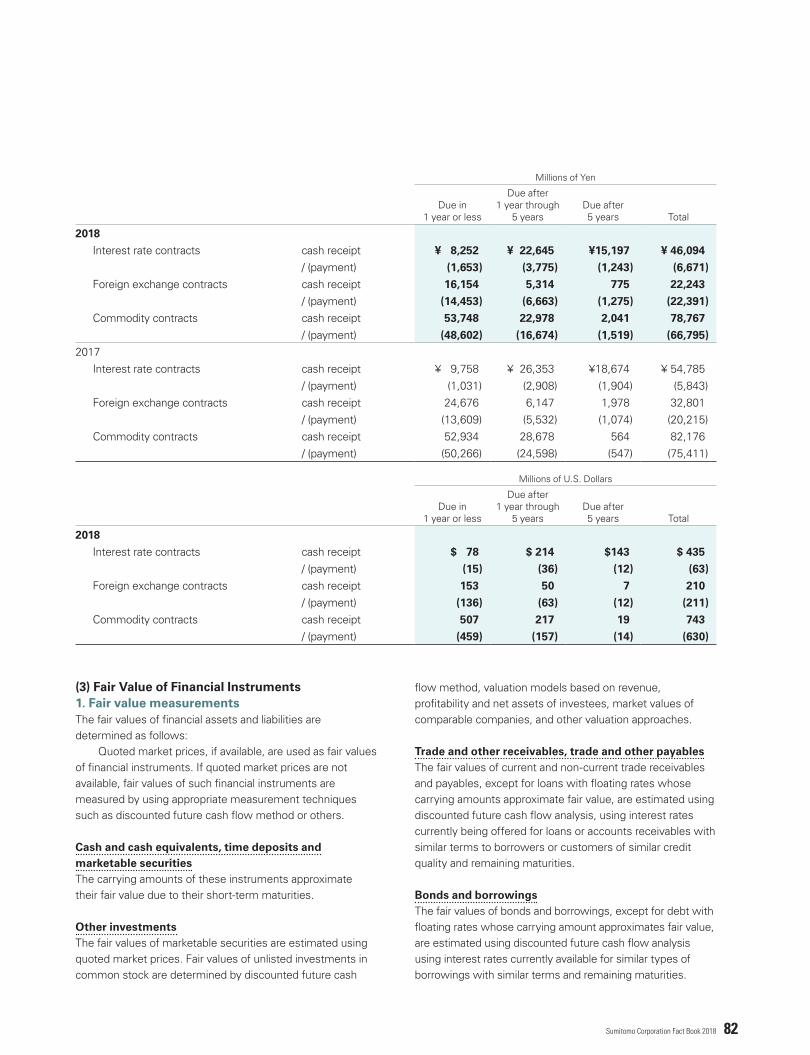
82Sumitomo Corporation Fact Book 2018
Millions of Yen
Due in1 year or less
Due after1 year through
5 yearsDue after5 years Total
2018
Interest rate contracts cash receipt ¥ 8,252 ¥ 22,645 ¥15,197 ¥ 46,094
/ (payment) (1,653) (3,775) (1,243) (6,671)
Foreign exchange contracts cash receipt 16,154 5,314 775 22,243
/ (payment) (14,453) (6,663) (1,275) (22,391)
Commodity contracts cash receipt 53,748 22,978 2,041 78,767
/ (payment) (48,602) (16,674) (1,519) (66,795)
2017 Interest rate contracts cash receipt ¥ 9,758 ¥ 26,353 ¥18,674 ¥ 54,785
/ (payment) (1,031) (2,908) (1,904) (5,843) Foreign exchange contracts cash receipt 24,676 6,147 1,978 32,801
/ (payment) (13,609) (5,532) (1,074) (20,215) Commodity contracts cash receipt 52,934 28,678 564 82,176
/ (payment) (50,266) (24,598) (547) (75,411)
Millions of U.S. Dollars
Due in1 year or less
Due after1 year through
5 yearsDue after5 years Total
2018
Interest rate contracts cash receipt $ 78 $ 214 $143 $ 435
/ (payment) (15) (36) (12) (63)
Foreign exchange contracts cash receipt 153 50 7 210
/ (payment) (136) (63) (12) (211)
Commodity contracts cash receipt 507 217 19 743
/ (payment) (459) (157) (14) (630)
flow method, valuation models based on revenue, profitability and net assets of investees, market values of comparable companies, and other valuation approaches.
Trade and other receivables, trade and other payablesThe fair values of current and non-current trade receivables and payables, except for loans with floating rates whose carrying amounts approximate fair value, are estimated using discounted future cash flow analysis, using interest rates currently being offered for loans or accounts receivables with similar terms to borrowers or customers of similar credit quality and remaining maturities.
Bonds and borrowingsThe fair values of bonds and borrowings, except for debt with floating rates whose carrying amount approximates fair value, are estimated using discounted future cash flow analysis using interest rates currently available for similar types of borrowings with similar terms and remaining maturities.
The fair values of financial assets and liabilities are determined as follows: Quoted market prices, if available, are used as fair values of financial instruments. If quoted market prices are not available, fair values of such financial instruments are measured by using appropriate measurement techniques such as discounted future cash flow method or others.
Cash and cash equivalents, time deposits and marketable securitiesThe carrying amounts of these instruments approximate their fair value due to their short-term maturities.
Other investmentsThe fair values of marketable securities are estimated using quoted market prices. Fair values of unlisted investments in common stock are determined by discounted future cash
1. Fair value measurements(3) Fair Value of Financial Instruments

83 Sumitomo Corporation Fact Book 2018
Financial Section
Guarantee of third party debtThe fair values of financial guarantees are estimated based on the premiums received or receivable from guarantors in arm’s length transactions with unrelated parties.
Interest rate swaps, currency swap agreements and currency option contractsThe fair values of interest rate swaps, currency swap agreements and currency option contracts are estimated by obtaining quotes from brokers and other appropriate valuation techniques based on information available to the Companies.
Foreign exchange forward contractsThe fair values of foreign exchange forward contracts are estimated based on quoted market prices for contracts with similar terms.
Interest rate future contracts and bond future contractsThe fair values of interest rate future contracts and bond future contracts are estimated by using quoted market prices.
Commodity forwards, futures and swap contractsThe fair values of commodity forwards, futures and swap contracts are mainly estimated using quoted market prices.
The fair values of financial instruments measured at amortized cost as of March 31, 2018 and 2017 are as follows: Financial instruments measured at amortized cost that are included in “Marketable securities” and “Other investments” are disclosed in Note 7.
2. Financial instruments measured at amortized cost
Millions of Yen
2018
Carrying amounts Fair value
Financial assets measured at amortized cost: Trade and other receivables ¥1,624,153 ¥1,635,323
Financial liabilities measured at amortized cost: Bonds and borrowings 3,203,865 3,213,812
Trade and other payables 1,050,977 1,051,022
Millions of U.S. Dollars
2018
Carrying amounts Fair value
Financial assets measured at amortized cost: Trade and other receivables $15,322 $15,428
Financial liabilities measured at amortized cost: Bonds and borrowings 30,226 30,319
Trade and other payables 9,915 9,915
Millions of Yen
2017
Carrying amounts Fair value
Financial assets measured at amortized cost: Trade and other receivables ¥1,654,154 ¥1,660,537
Financial liabilities measured at amortized cost: Bonds and borrowings 3,418,326 3,430,437 Trade and other payables 1,071,638 1,071,691
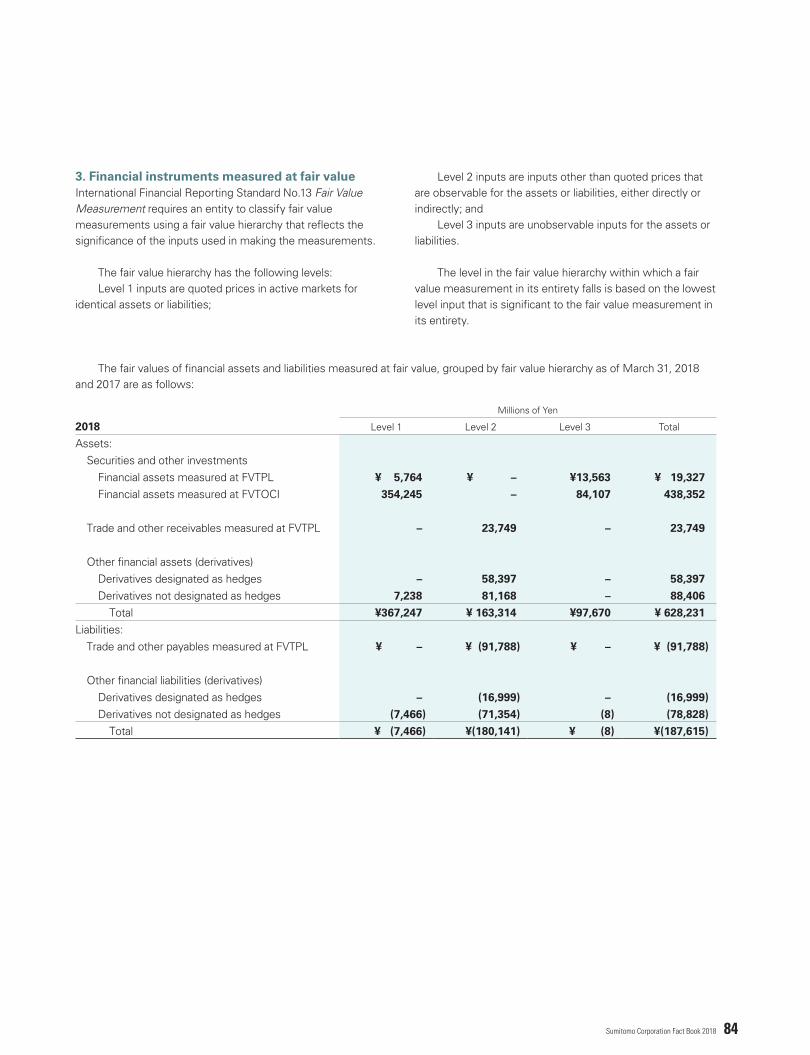
84Sumitomo Corporation Fact Book 2018
Level 2 inputs are inputs other than quoted prices that are observable for the assets or liabilities, either directly or indirectly; and Level 3 inputs are unobservable inputs for the assets or liabilities.
The level in the fair value hierarchy within which a fair value measurement in its entirety falls is based on the lowest level input that is significant to the fair value measurement in its entirety.
International Financial Reporting Standard No.13 Fair Value Measurement requires an entity to classify fair value measurements using a fair value hierarchy that reflects the significance of the inputs used in making the measurements.
The fair value hierarchy has the following levels: Level 1 inputs are quoted prices in active markets for identical assets or liabilities;
The fair values of financial assets and liabilities measured at fair value, grouped by fair value hierarchy as of March 31, 2018 and 2017 are as follows:
3. Financial instruments measured at fair value
Millions of Yen
2018 Level 1 Level 2 Level 3 Total
Assets:Securities and other investments
Financial assets measured at FVTPL ¥ 5,764 ¥ – ¥13,563 ¥ 19,327
Financial assets measured at FVTOCI 354,245 – 84,107 438,352
Trade and other receivables measured at FVTPL – 23,749 – 23,749
Other financial assets (derivatives)Derivatives designated as hedges – 58,397 – 58,397
Derivatives not designated as hedges 7,238 81,168 – 88,406
Total ¥367,247 ¥ 163,314 ¥97,670 ¥ 628,231
Liabilities:Trade and other payables measured at FVTPL ¥ – ¥ (91,788) ¥ – ¥ (91,788)
Other financial liabilities (derivatives)Derivatives designated as hedges – (16,999) – (16,999)
Derivatives not designated as hedges (7,466) (71,354) (8) (78,828)
Total ¥ (7,466) ¥(180,141) ¥ (8) ¥(187,615)
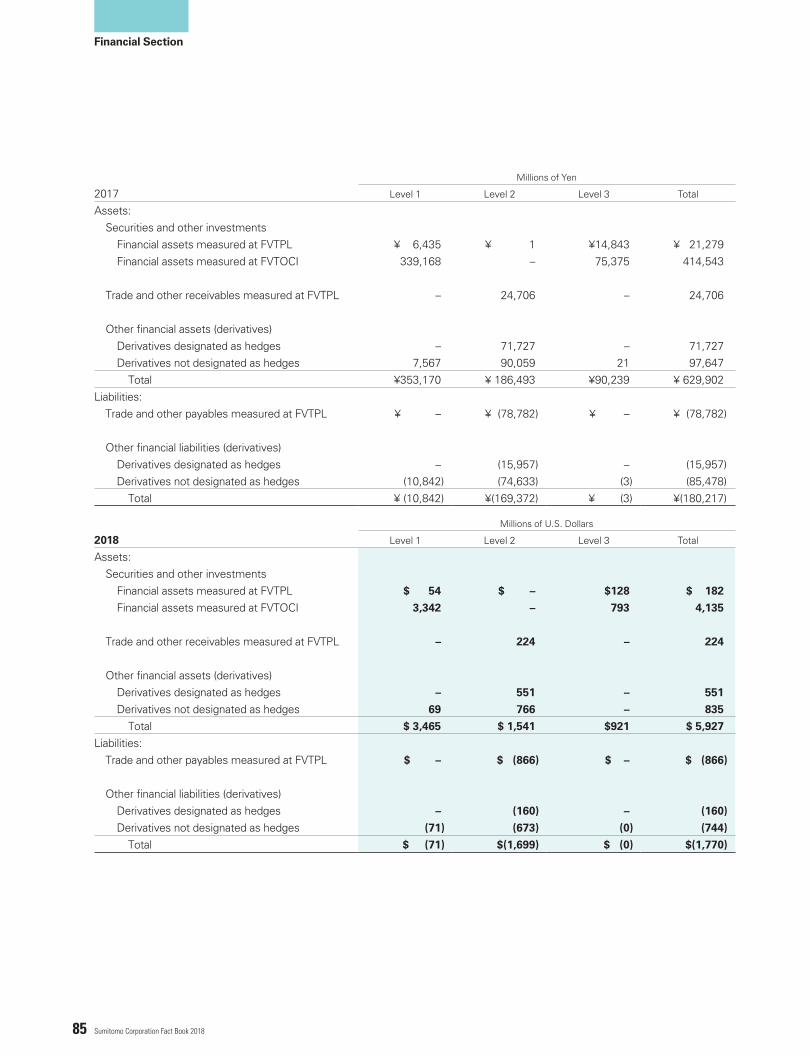
85 Sumitomo Corporation Fact Book 2018
Financial Section
Millions of Yen
2017 Level 1 Level 2 Level 3 Total
Assets:Securities and other investments
Financial assets measured at FVTPL ¥ 6,435 ¥ 1 ¥14,843 ¥ 21,279Financial assets measured at FVTOCI 339,168 – 75,375 414,543
Trade and other receivables measured at FVTPL – 24,706 – 24,706
Other financial assets (derivatives)Derivatives designated as hedges – 71,727 – 71,727Derivatives not designated as hedges 7,567 90,059 21 97,647
Total ¥353,170 ¥ 186,493 ¥90,239 ¥ 629,902Liabilities:
Trade and other payables measured at FVTPL ¥ – ¥ (78,782) ¥ – ¥ (78,782)
Other financial liabilities (derivatives)Derivatives designated as hedges – (15,957) – (15,957)Derivatives not designated as hedges (10,842) (74,633) (3) (85,478)
Total ¥ (10,842) ¥(169,372) ¥ (3) ¥(180,217)
Millions of U.S. Dollars
2018 Level 1 Level 2 Level 3 Total
Assets:Securities and other investments
Financial assets measured at FVTPL $ 54 $ – $128 $ 182
Financial assets measured at FVTOCI 3,342 – 793 4,135
Trade and other receivables measured at FVTPL – 224 – 224
Other financial assets (derivatives)Derivatives designated as hedges – 551 – 551
Derivatives not designated as hedges 69 766 – 835
Total $ 3,465 $ 1,541 $921 $ 5,927
Liabilities:Trade and other payables measured at FVTPL $ – $ (866) $ – $ (866)
Other financial liabilities (derivatives)Derivatives designated as hedges – (160) – (160)
Derivatives not designated as hedges (71) (673) (0) (744)
Total $ (71) $(1,699) $ (0) $(1,770)

86Sumitomo Corporation Fact Book 2018
Reconciliation between the beginning and ending balance of financial assets measured at fair value on a recurring basis using Level 3 inputs for the year ended March 31, 2018 is as follows:
The above profits or losses for the year were included in “Sales of tangible products,” “Cost of tangible products sold” and “Gain (loss) on securities and other investments, net” in the Consolidated statement of comprehensive income.
Millions of Yen
2018
Financial assetsmeasuredat FVTPL
Financial assetsmeasuredat FVTOCI
Net other financialassets
(liabilities)
Balance, beginning of year ¥14,843 ¥75,375 ¥ 18
Purchases 4,817 9,181 –
Comprehensive incomeProfit or loss for the year (2,331) – (11)
Other comprehensive income – 2,712 –
Disposals (2,921) (2,936) –
Settlements (845) (225) (15)
Balance, end of year ¥13,563 ¥84,107 ¥ (8)
Loss for the year included in earnings relating to financial instruments still held at the end of year ¥ (2,712) ¥ – ¥(16)
Millions of U.S. Dollars
2018
Financial assetsmeasuredat FVTPL
Financial assetsmeasuredat FVTOCI
Net other financialassets
(liabilities)
Balance, beginning of year $140 $711 $ 0
Purchases 46 87 –
Comprehensive incomeProfit or loss for the year (22) – (0)
Other comprehensive income – 25 –
Disposals (28) (28) –
Settlements (8) (2) (0)
Balance, end of year $128 $793 $(0)
Loss for the year included in earnings relating to financial instruments still held at the end of year $ (26) $ – $(0)
million ($100 million) and net gains of ¥17,363 million, respectively, and net gains or losses for hedging instruments were net losses of ¥10,589 million ($100 million) and net losses of ¥17,363 million, respectively.
Cash-flow hedgesCash-flow hedge is a type of hedge that uses derivatives to offset the variability of expected future cash flows. The Companies use commodity future contracts and foreign exchange forward contracts to hedge the variability of cash flows related to forecasted transactions and interest rate swaps to hedge the variability of cash flows related to floating-rate borrowings. The Companies recognized changes in the fair values of derivative instruments that are designated and qualified as cash-flow hedges in other
Fair-value hedgesFair-value hedge is a type of hedge that eliminates the risk of changes in the fair values of assets and liabilities or firm commitments. The Companies use commodity futures contracts and foreign exchange forward contracts to hedge the changes in fair values on firm commitments. The Companies use interest rate swaps to hedge the changes in fair values on fixed rate borrowings used to fund assets earning interest at variable rates. Changes in the fair values of derivatives designated as fair-value hedges are recognized in profit or loss and are offset by corresponding changes in the fair values of the hedged item to the extent the hedge is effective. For the years ended March 31, 2018 and 2017, net gains or losses for hedged items were net gains of ¥10,589
(4) Derivatives and Hedge Accounting

87 Sumitomo Corporation Fact Book 2018
Financial Section
The fair values of derivative instruments as of March 31, 2018 and 2017 are as follows:
Other than the above, the Companies have foreign currency borrowings of ¥130,091 million ($1,227 million) that are designated as hedging instruments to hedge the net investments in foreign operations. The differences between the amounts of derivative assets and derivative liabilities stated above and those stated in the Consolidated statement of financial position were resulted from a financial liability for the put option granted to the non-controlling shareholder and offsetting derivative assets and derivative liabilities with deposits. The amounts of “Other financial assets and liabilities” in the Consolidated statement of financial position that are subject to enforceable master netting arrangements or similar arrangements are ¥37,185 million ($351 million).
Derivatives not designated as hedgesThe Companies use derivatives to hedge exposures when it makes economic sense to do so, including circumstances in which the hedging relationship does not qualify for hedge accounting.
The Companies use foreign exchange forward contracts to economically hedge the fluctuations of foreign exchange rates on foreign currency assets, liabilities and unrecognized firm commitments. The Companies also enter into commodity forwards, futures and swap contracts to economically hedge their inventories and unrecognized firm commitments against market price fluctuations. Certain commodity derivatives are entered into for trading purposes to the extent approved by management. These derivatives do not qualify for hedge accounting and any changes in their fair values are recognized in profit or loss.
comprehensive income in Other components of equity. Such amounts are reclassified into profit or loss in the period when the hedged items are recognized in profit or loss. For the years ended March 31, 2018 and 2017, net derivative gains or losses (net of the related tax) that were expected to be reclassified into profit or loss within the next fiscal year were net losses of ¥2,718 million ($26 million) and net losses of ¥2,558 million, respectively.
Hedges of net investments in foreign operationsThe Companies use currency swaps and foreign currency borrowings to hedge the foreign currency risk of the net investments in foreign operations. The Companies recognized changes in fair values of derivatives designated as hedging instruments and exchange differences in foreign currency borrowings designated as hedging instruments in other comprehensive income in Other components of equity to the extent the hedge is effective.
Millions of Yen
2018Fair-valuehedges
Cash-flowhedges
Hedges ofnet investment
in foreignoperations
Derivatives notdesignated as
hedges Total
[Derivative assets]Interest rate contracts ¥45,514 ¥ 279 ¥ – ¥ – ¥ 45,793
Foreign exchange contracts 7 7,815 2,646 11,775 22,243
Commodity contracts 46 2,090 – 76,631 78,767
Total ¥45,567 ¥ 10,184 ¥2,646 ¥ 88,406 ¥146,803
Other financial assets (current) 66,885
Other financial assets (non-current) 80,214
Total ¥147,099
[Derivative liabilities]Interest rate contracts ¥ (2,498) ¥ (4,143) ¥ – ¥ – ¥ (6,641)
Foreign exchange contracts (38) (9,507) (196) (12,650) (22,391)
Commodity contracts (31) (586) – (66,178) (66,795)
Total ¥ (2,567) ¥(14,236) ¥ (196) ¥(78,828) ¥ (95,827)
Other financial liabilities (current) (59,413)
Other financial liabilities (non-current) (33,853)
Total ¥ (93,266)

88Sumitomo Corporation Fact Book 2018
Other than the above, the Companies had foreign currency borrowings of ¥59,228 million that were designated as hedging instruments to hedge the net investments in foreign operations. The differences between the amounts of derivative assets and derivative liabilities stated above and those stated in the Consolidated statement of financial position were resulted from a financial liability for the put option granted to the non-controlling shareholder and offsetting derivative assets and derivative liabilities with deposits. The amounts of “Other financial assets and liabilities” in the Consolidated statement of financial position that were subject to enforceable master netting arrangements or similar arrangements were ¥37,980 million.
Millions of U.S. Dollars
2018Fair-valuehedges
Cash-flowhedges
Hedges ofnet investment
in foreignoperations
Derivatives notdesignated as
hedges Total
[Derivative assets]Interest rate contracts $430 $ 3 $ – $ – $ 433Foreign exchange contracts 0 73 25 112 210Commodity contracts 0 20 – 723 743
Total $430 $ 96 $25 $ 835 $1,386Other financial assets (current) 631Other financial assets (non-current) 757
Total $1,388[Derivative liabilities]
Interest rate contracts $ (24) $ (39) $ – $ – $ (63)Foreign exchange contracts (0) (89) (2) (120) (211)Commodity contracts (0) (6) – (624) (630)
Total $ (24) $(134) $ (2) $(744) $ (904)Other financial liabilities (current) (561)Other financial liabilities (non-current) (319)
Total $ (880)
Millions of Yen
2017Fair-valuehedges
Cash-flowhedges
Hedges ofnet investment
in foreignoperations
Derivatives notdesignated as
hedges Total
[Derivative assets]Interest rate contracts ¥54,011 ¥ 229 ¥ – ¥ 157 ¥ 54,397Foreign exchange contracts – 13,745 1,384 17,672 32,801Commodity contracts 54 2,304 – 79,818 82,176
Total ¥54,065 ¥ 16,278 ¥ 1,384 ¥ 97,647 ¥ 169,374Other financial assets (current) 66,550Other financial assets (non-current) 91,937
Total ¥ 158,487[Derivative liabilities]
Interest rate contracts ¥ (510) ¥ (5,142) ¥ – ¥ (157) ¥(5,809)Foreign exchange contracts (25) (6,611) (2,552) (11,027) (20,215)Commodity contracts (61) (1,056) – (74,294) (75,411)
Total ¥ (596) ¥(12,809) ¥(2,552) ¥(85,478) ¥(101,435)Other financial liabilities (current) (53,264)Other financial liabilities (non-current) (40,599)
Total ¥ (93,863)
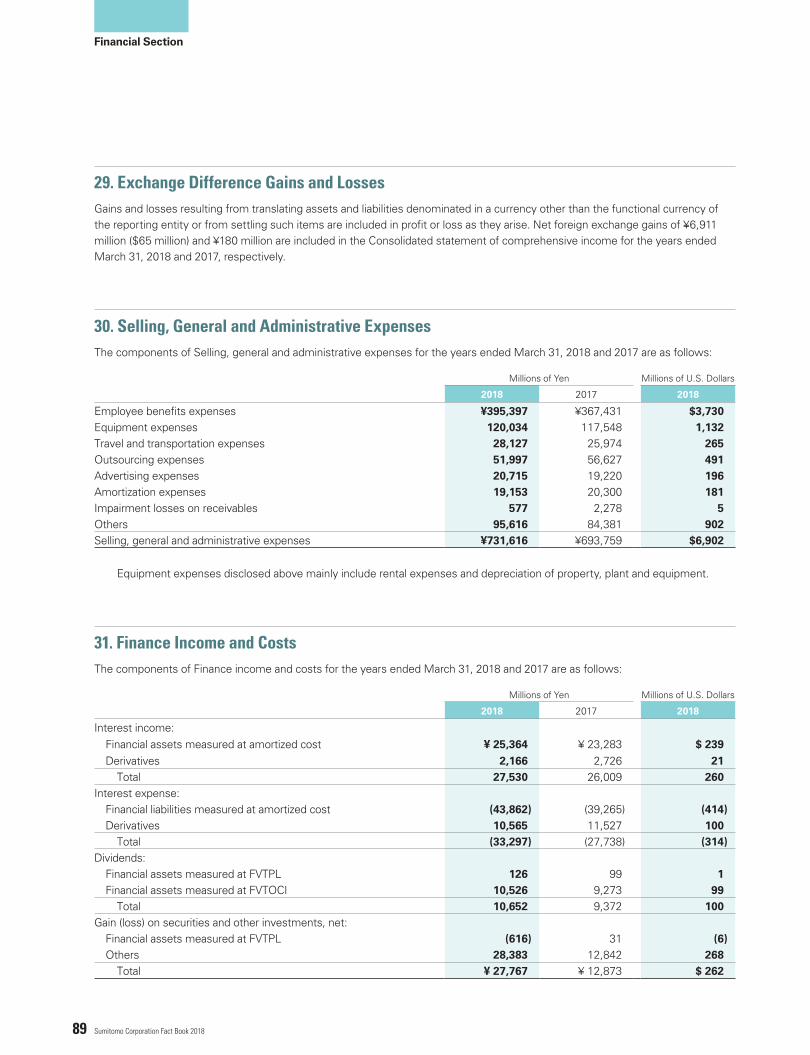
89 Sumitomo Corporation Fact Book 2018
Financial Section
29. Exchange Difference Gains and Losses
30. Selling, General and Administrative Expenses
Gains and losses resulting from translating assets and liabilities denominated in a currency other than the functional currency of the reporting entity or from settling such items are included in profit or loss as they arise. Net foreign exchange gains of ¥6,911 million ($65 million) and ¥180 million are included in the Consolidated statement of comprehensive income for the years ended March 31, 2018 and 2017, respectively.
The components of Selling, general and administrative expenses for the years ended March 31, 2018 and 2017 are as follows:
Millions of Yen Millions of U.S. Dollars
2018 2017 2018
Employee benefits expenses ¥395,397 ¥367,431 $3,730Equipment expenses 120,034 117,548 1,132Travel and transportation expenses 28,127 25,974 265Outsourcing expenses 51,997 56,627 491Advertising expenses 20,715 19,220 196Amortization expenses 19,153 20,300 181Impairment losses on receivables 577 2,278 5Others 95,616 84,381 902Selling, general and administrative expenses ¥731,616 ¥693,759 $6,902
31. Finance Income and CostsThe components of Finance income and costs for the years ended March 31, 2018 and 2017 are as follows:
Equipment expenses disclosed above mainly include rental expenses and depreciation of property, plant and equipment.
Millions of Yen Millions of U.S. Dollars
2018 2017 2018
Interest income:Financial assets measured at amortized cost ¥ 25,364 ¥ 23,283 $ 239Derivatives 2,166 2,726 21
Total 27,530 26,009 260Interest expense:
Financial liabilities measured at amortized cost (43,862) (39,265) (414)Derivatives 10,565 11,527 100
Total (33,297) (27,738) (314)Dividends:
Financial assets measured at FVTPL 126 99 1Financial assets measured at FVTOCI 10,526 9,273 99
Total 10,652 9,372 100Gain (loss) on securities and other investments, net:
Financial assets measured at FVTPL (616) 31 (6)Others 28,383 12,842 268
Total ¥ 27,767 ¥ 12,873 $ 262
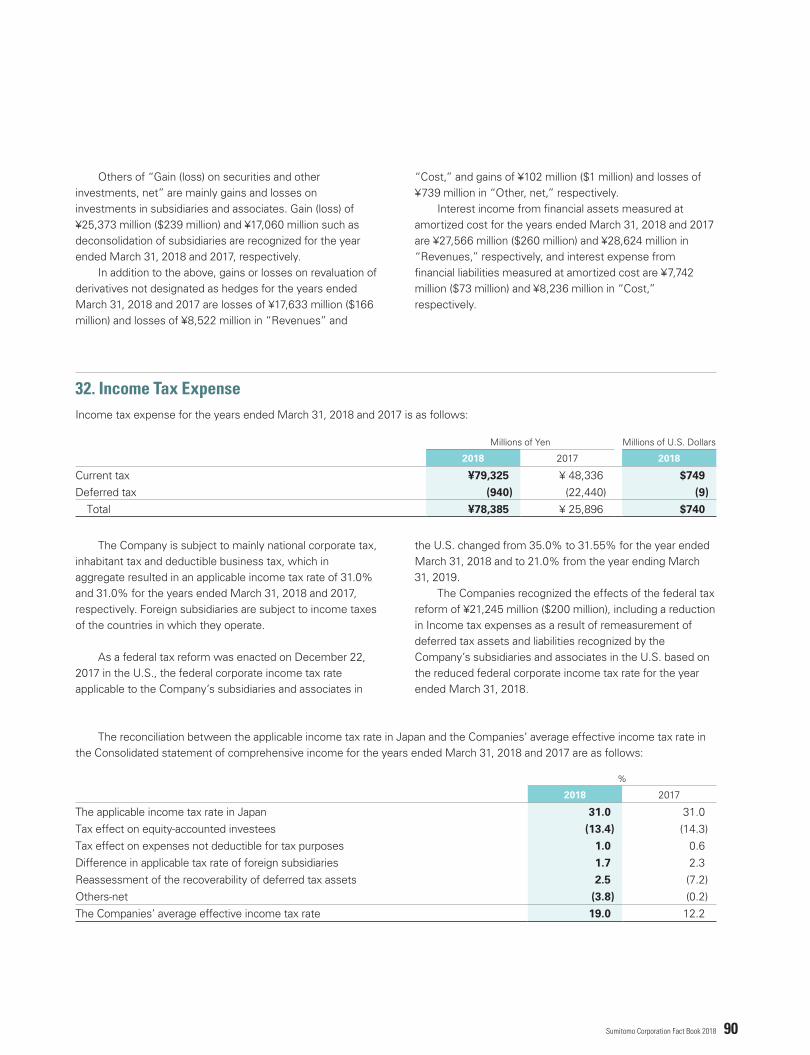
90Sumitomo Corporation Fact Book 2018
Others of “Gain (loss) on securities and other investments, net” are mainly gains and losses on investments in subsidiaries and associates. Gain (loss) of ¥25,373 million ($239 million) and ¥17,060 million such as deconsolidation of subsidiaries are recognized for the year ended March 31, 2018 and 2017, respectively. In addition to the above, gains or losses on revaluation of derivatives not designated as hedges for the years ended March 31, 2018 and 2017 are losses of ¥17,633 million ($166 million) and losses of ¥8,522 million in “Revenues” and
“Cost,” and gains of ¥102 million ($1 million) and losses of ¥739 million in “Other, net,” respectively. Interest income from financial assets measured at amortized cost for the years ended March 31, 2018 and 2017 are ¥27,566 million ($260 million) and ¥28,624 million in “Revenues,” respectively, and interest expense from financial liabilities measured at amortized cost are ¥7,742 million ($73 million) and ¥8,236 million in “Cost,” respectively.
Millions of Yen Millions of U.S. Dollars
2018 2017 2018
Current tax ¥79,325 ¥ 48,336 $749
Deferred tax (940) (22,440) (9)
Total ¥78,385 ¥ 25,896 $740
32. Income Tax ExpenseIncome tax expense for the years ended March 31, 2018 and 2017 is as follows:
The Company is subject to mainly national corporate tax, inhabitant tax and deductible business tax, which in aggregate resulted in an applicable income tax rate of 31.0% and 31.0% for the years ended March 31, 2018 and 2017, respectively. Foreign subsidiaries are subject to income taxes of the countries in which they operate.
As a federal tax reform was enacted on December 22, 2017 in the U.S., the federal corporate income tax rate applicable to the Company’s subsidiaries and associates in
the U.S. changed from 35.0% to 31.55% for the year ended March 31, 2018 and to 21.0% from the year ending March 31, 2019. The Companies recognized the effects of the federal tax reform of ¥21,245 million ($200 million), including a reduction in Income tax expenses as a result of remeasurement of deferred tax assets and liabilities recognized by the Company’s subsidiaries and associates in the U.S. based on the reduced federal corporate income tax rate for the year ended March 31, 2018.
%
2018 2017
The applicable income tax rate in Japan 31.0 31.0Tax effect on equity-accounted investees (13.4) (14.3)Tax effect on expenses not deductible for tax purposes 1.0 0.6Difference in applicable tax rate of foreign subsidiaries 1.7 2.3Reassessment of the recoverability of deferred tax assets 2.5 (7.2)Others-net (3.8) (0.2)The Companies’ average effective income tax rate 19.0 12.2
The reconciliation between the applicable income tax rate in Japan and the Companies’ average effective income tax rate in the Consolidated statement of comprehensive income for the years ended March 31, 2018 and 2017 are as follows:

91 Sumitomo Corporation Fact Book 2018
Financial Section
33. Earnings per shareA calculation of the basic and diluted earnings per share (attributable to owners of the parent) for the years ended March 31, 2018 and 2017 is as follows:
Millions of Yen Millions of U.S. Dollars
2018 2017 2018
Profit for the year attributable to owners of the parent ¥308,521 ¥170,889 $2,911
Yen U.S. Dollars
2018 2017 2018
Earnings per share (attributable to owners of the parent) :Basic ¥247.13 ¥136.91 $2.33Diluted 246.91 136.81 2.33
Number of shares
2018 2017
Weighted-average shares-basic 1,248,398,130 1,248,188,266Dilutive effect of: Stock options 1,110,943 948,307Weighted-average shares-diluted 1,249,509,073 1,249,136,573
Millions of Yen Millions of U.S. Dollars
Cash and cash equivalents ¥ 46,823 $ 442Trade and other receivables 39,830 376Property, plant and equipment 5,038 48Intangible assets 980 9Other assets 93,840 885Current liabilities (154,691) (1,459)Non-current liabilities (1,674) (16)
34. Cash Flow Information Supplemental disclosure of cash flow information for the years ended March 31, 2018 and 2017 is as follows:
Refer to Note 5 for fair value of assets and liabilities as of the acquisition date.
The total consideration received in respect of sales of subsidiaries for the year ended March 31, 2018 is ¥49,859 million ($470 million). Each major class of assets and liabilities at the point of sale is as follows:
Millions of Yen Millions of U.S. Dollars
2018 2017 2018
Non-cash investing and financing activities:Finance lease obligations incurred ¥ 6,018 ¥ 9,237 $ 57
Acquisition of securities through exchange of loan receivables for securities 52,502 – 495
Acquisition of subsidiaries:Total consideration paid (24,989) (91,391) (236)
Cash and cash equivalents included in assets acquired 4,328 7,911 41
Acquisition of subsidiaries, net of cash and cash equivalents acquired ¥(20,661) ¥(83,480) $(195)

92Sumitomo Corporation Fact Book 2018
One of the major subsidiaries disposed of during the year ended March 31, 2018 is QUO CARD Co., Ltd. In December 2017, SCSK Corporation, which is a consolidated subsidiary of the Company, transferred all the shares of QUO CARD Co., Ltd. to T-Gaia Corporation.
The total consideration received in respect of sales of subsidiaries for the year ended March 31, 2017 was ¥16,497 million. Each major class of assets and liabilities at the point of sale was as follows:
Millions of Yen
Cash and cash equivalents ¥ 44,255Trade and other receivables 3,790Property, plant and equipment 2,693Intangible assets 3,905Other assets 5,742Current liabilities (53,354)Non-current liabilities (1,985)
Millions of Yen Millions of U.S. Dollars
2018 2017 2018
1. Monthly remuneration ¥571 ¥714 $5
2. Bonuses resolved at the 150th ordinary general meeting of shareholders 174 – 2
3. Bonuses resolved at the 149th ordinary general meeting of shareholders – 149 –
4. Expenses recognized for the grant of the 16th of stock option issued on July 31, 2017 6 – 0
5. Expenses recognized for the grant of the 15th of stock option issued on August 2, 2016 – 5 –
6. Expenses recognized for the grant of the 12th of stock option (stock-linked compensation plan) issued on July 31, 2017 41 – 1
7. Expenses recognized for the grant of the 11th of stock option (stock-linked compensation plan) issued on August 2, 2016 17 55 0
8. Expenses recognized for the grant of the 10th of stock option (stock-linked compensation plan) issued on July 31, 2015 – 19 –
Total ¥809 ¥942 $8
35. Related Party Transactions
The remuneration for directors for the years ended March 31, 2018 and 2017 is as follows:Compensation for directors

93 Sumitomo Corporation Fact Book 2018
Financial Section
36. SubsidiariesThe Companies’ subsidiaries as of March 31, 2018 are as follows:
Business segment Name of subsidiaryPlace of incorporation and
operation
Proportion of voting power held by the Companies
(%)
Metal Products Sumisho Metalex Corporation Chiyoda-ku, Tokyo 100.00SC Pipe Solutions Co., Ltd. Chiyoda-ku, Tokyo 100.00Sumitomo Corporation Global Metals Co., Ltd. Chuo-ku, Tokyo 100.00SC Metal Pty. Ltd. Melbourne, Australia 100.00
(10.00)Sumisho Steel Corporation (Hong Kong) Limited Hong Kong, China 100.00
(10.00)ERYNGIUM Ltd. Glasgow, England 100.00
(40.00)K + S GmbH Sachsenheim, Germany 100.00 SC Steel Investment, LLC Wilmington, U.S. 100.00Servilamina Summit Mexicana S.A. de C.V. Queretaro, Mexico 100.00Tianjin Hua Zhu Metal Products Co., Ltd. Tianjin, China 68.11
(6.81)OMS Holdings Pte., Ltd. Gul Circle, Singapore 100.00Sumiputeh Steel Centre Sdn Bhd Selangor, Malaysia 100.00Sumisho Metal (Thailand) Co., Ltd. Bangkok, Thailand 100.00
(25.00)Others (82 Companies)
Transportation & Construction Systems
KIRIU Corporation Ashikaga, Tochigi 100.00SMS Construction and Mining Systems Inc. Acheson, Canada 100.00
(35.14)Tecnologia Para La Construccion Y Mineria S.L. Madrid, Spain 100.00
(60.00)Triton Navigation B.V. Amsterdam, Netherlands 100.00
(100.00)Toyota Ukraine Kiev, Ukraine 100.00Sumitec International, Ltd. Moscow, Russia 100.00
(100.00)SC Construction Machinery (Shanghai) Corporation Shanghai, China 100.00
(10.00)P.T. Summit Auto Group Jakarta, Indonesia 100.00Sumisho Aero Engine Lease B.V. Amsterdam, Netherlands 90.00Summit Motors Vladivostok Vladivostok, Russia 100.00
(100.00)Summit Capital Leasing Co., Ltd. Bangkok, Thailand 99.65
(50.65)Moto-Pfohe EOOD Sofia, Bulgaria 100.00Others (42 Companies)

94Sumitomo Corporation Fact Book 2018
Business segment Name of subsidiaryPlace of incorporation and
operation
Proportion of voting power held by the Companies
(%)
Environment & Infrastructure
Summit Energy Corporation Chiyoda-ku, Tokyo 100.00Sumitomo Shoji Machinex Co., Ltd. Chuo-ku, Tokyo 100.00Sumisho Global Logistics Co., Ltd. Chuo-ku, Tokyo 100.00P.T. Central Java Power Jakarta, Indonesia 100.00
(25.00)Summit Southern Cross Power Holdings Pty. Ltd. Sydney, Australia 100.00Summit Water Limited London, England 100.00Summit Renewable Energy Europe Limited London, England 100.00Others (68 Companies)
Media, ICT, Lifestyle Related Goods & Services
SCSK Corporation Koto-ku, Tokyo 51.06Summit, Inc. Suginami-ku, Tokyo 100.00Sumisho Brand Management Corporation Chiyoda-ku, Tokyo 100.00
(0.92)IG Kogyo Co., Ltd. Higashine, Yamagata 65.68S.C. Cement Co., Ltd. Chiyoda-ku, Tokyo 100.00Tomod's Bunkyo-ku, Tokyo 100.00SC Foods Co., Ltd. Chiyoda-ku, Tokyo 100.00Summit Grain Investment (Australia) Pty Ltd Sydney, Australia 100.00
(30.00)Emerald Grain Pty Ltd Melbourne, Australia 100.00
(100.00)Summit Forests New Zealand Limited Auckland, New Zealand 100.00Sumitomo Corporation Equity Asia Limited Hong Kong, China 100.00
(20.00)Fyffes PLC Dublin, Ireland 100.00
(100.00)Others (191 Companies)
Mineral Resources, Energy, Chemical & Electronics
Sumitomo Shoji Chemicals Co., Ltd. Chuo-ku, Tokyo 100.00Sumitronics Corporation Chuo-ku, Tokyo 100.00Serra Azul Iron Ore, LLC Chuo-ku, Tokyo 100.00Summit Agri-Business Corporation Chiyoda-ku, Tokyo 100.00Sumi Agro Europe Limited London, England 100.00
(15.00)Interacid Trading S.A. Lausanne, Switzerland 100.00
(30.00)Minera San Cristobal S.A. La Paz, Bolivia 100.00
(100.00)Sumisho Coal Australia Pty. Ltd. Sydney, Australia 100.00SC Minerals America, Inc. Denver, U.S. 100.00
(15.25)Petro Summit Pte. Ltd. Singapore 100.00Summit Oil and Gas USA Corporation New York, U.S. 100.00
Summit Discovery Resources ⅡLLC Houston, U.S. 100.00(100.00)

95 Sumitomo Corporation Fact Book 2018
Financial Section
Business segment Name of subsidiaryPlace of incorporation and
operation
Proportion of voting power held by the Companies
(%)
Mineral Resources, Energy, Chemical & Electronics
Inversiones SC Sierra Gorda Limitada Santiago, Chile 100.00(0.03)
Comercial Metales Blancos AB Goeteborg, Sweden 100.00Summit Rural Western Australia Pty. Ltd. Kwinana, Australia 100.00
(20.00)SC Sierra Gorda Finance B.V. Amsterdam, Netherlands 100.00Sumitomo Corporation Global Commodities Limited London, England 100.00
(10.00)SCAP C Pty Ltd Sydney, Australia 100.00Summit Exploration and Production Limited London, England 100.00Summit Ambatovy Mineral Resources Investment
B.V.Amsterdam, Netherlands
100.00
Summit Minerals GmbH Zug, Switzerland 100.00(100.00)
Sumisho Coal Australia Holdings Pty. Ltd. Sydney, Australia 100.00Others (77 Companies)
Overseas Subsidiaries and Branches
Sumitomo Corporation of Americas New York, U.S. 100.00Sumitomo Corporation Europe Holding Limited London, England 100.00
(100.00)Sumitomo Corporation (China) Holding Ltd. Beijing, China 100.00Sumitomo Corporation Asia & Oceania Pte. Ltd. Singapore 100.00
(100.00)Sumitomo Corporation Do Brasil S.A. Sao Paulo, Brazil 100.00
(8.63)Sumitomo Corporation Taiwan Ltd. Taipei, Taiwan 100.00
(100.00)Sumitomo Corporation (Central Eurasia) LLC Moscow, Russia 100.00Sumitomo Corporation Korea Ltd. Seoul, Korea 100.00Sumitomo Corporation Middle East FZE Dubai, U.A.E. 100.00
(100.00)Edgen Group Inc. Baton Rouge, U.S. 100.00
(100.00)SMS International Corporation Plant City, U.S. 100.00
(100.00)TBC Corporation Palm Beach Gardens,
U.S.100.00
(100.00)
Perennial Power Holdings Inc. New York, U.S. 100.00(100.00)
Presidio Ventures, Inc. Santa Clara, U.S. 100.00(100.00)
Pacific Summit Energy LLC Irvine, U.S. 100.00(100.00)
Others (105 Companies)Others Sumitomo Shoji Financial Management Co., Ltd. Chuo-ku, Tokyo 100.00
Yasato Kosan Co., Ltd. Chuo-ku, Tokyo 100.00Others (6 Companies)
The percentage in the parenthesis under “Proportion of voting power held by the Companies” indicates the indirect ownership out of the total ownership noted above.

96Sumitomo Corporation Fact Book 2018
37. Commitments and Contingent liabilities
The Companies customarily enter into long-term purchase commitments for certain items, principally ocean transport vessels and industry materials, either at fixed prices or at variable prices adjustable to market. Such purchase commitments are in most instances matched with counter-party sales contracts. Long-term purchase contracts with equity-accounted investees at fixed prices or at variable prices adjustable to market amounted to ¥494,377 million ($4,664 million) as of March 31, 2018. Scheduled deliveries are at various dates through 2024. The Companies also had financing commitments in connection with loan, investments in equity capital and had contracts for the use of equipment,
The following table provides the undiscounted maximum amount of potential future payments for each major group of guarantees as of March 31, 2018:
the aggregate amount of ¥1,162,128 million ($10,963 million), ¥168,068 million ($1,586 million) out of this aggregate amount with equity-accounted investees, as of March 31, 2018. For finance and operating lease commitments to which the Companies are the lessees, refer to Note 9.
The Companies enter into various guarantee agreements. These agreements arise in transactions related to enhancing the credit standings of equity-accounted investees, suppliers, and buyers.
(1) Commitments
(2) Guarantees
The Companies provide guarantees on certain equity-accounted investees’ borrowings from banks, payables to suppliers and other indebtedness. These guarantees mature through 2032. Guarantees with third party guarantee aggregated to ¥3,923 million ($37 million) as of March 31, 2018. The Companies would be obliged to reimburse the banks for losses, if any, if an equity-accounted investee defaults on a guaranteed loan.
The Companies also provide guarantees for indebtedness of third parties. These guarantees are arranged mainly with suppliers and customers and mature through 2043. The Companies must pay if a guaranteed party defaults on a guaranteed indebtedness. Some of these guarantees are also collateralized by borrower assets. Management does not expect to incur losses on the above commitments and guarantees in excess of established allowances.
The Companies are involved in certain legal actions and claims incidental to its business. In the opinion of management, none of these actions or claims will have a material adverse effect on the financial position or results of operations of the Companies.
1. Guarantees for Indebtedness of Equity- accounted investees
2. Guarantees for Indebtedness of Third Parties
(3) Litigation and others
Millions of Yen Millions of U.S. Dollars
2018 2018
Guarantees of indebtedness to :Equity-accounted investees ¥ 82,892 $ 782
Third parties 47,449 448
Total ¥130,341 $1,230

97 Sumitomo Corporation Fact Book 2018
Financial Section
38. Subsequent EventsThere are no subsequent events to be disclosed as of June 22, 2018, the date the consolidated financial statements were approved.
39. Approval of Consolidated Financial StatementsThe consolidated financial statements were approved by Masayuki Hyodo, Representative Director, President and Chief Executive Officer, and Koichi Takahata, CFO, on June 22, 2018.
98Sumitomo Corporation Fact Book 2018

99 Sumitomo Corporation Fact Book 2018
Reference Information [Risk factors]
Reference Information [Risk factors]
deemed appropriate at the time of such target-setting. However, since we may not be able to always gather all the necessary information, we may revise the targets or may not be able to achieve the targets due to changes in the operating environment and other factors. In our business plan, we use two key management measures that we call “risk-adjusted assets” and “risk-adjusted return ratio,” which are targets set for each of our industry-based business units and for our company as a whole. These targets involve a certain statistical confidence level, estimates and assumptions. Since they are different from return on assets or any other measure of performance calculated based on the financial statements, they may not be useful to all investors in making investment decisions.
We undertake operations through our offices in over 60 countries, including Japan. Since we are engaged in business activities and other transactions in a broad range of industrial sectors in Japan and abroad, we are affected by not only general Japanese economic conditions but also the economic conditions of the relevant countries in which we operate and the world economy as a whole. In some countries in which we operate, we confront deflation, currency depreciation, liquidity crises, or have some concerns that such conditions would occur in the future. Moreover, key countries for our operations are under the threat of possible terrorist attacks and political instability. If such case occurs, economic conditions surrounding our operations in those countries may be adversely impacted. These changes in economic conditions in key countries for our operations may adversely affect our results of operations and financial condition.
The markets for many of the industries in which we are involved are intensely competitive. For many of our businesses, we are involved at all levels of the supply chain and compete with companies that are engaged in certain of the same businesses as we are, but that are more concentrated in individual business segments. We also compete with other integrated trading companies in Japan which often establish and pursue similar strategic business plans as ours. Our competitors may have stronger relationships and associations with our current or potential customers, suppliers, counterparties and business partners. Our competitors may also have greater financial, technical, marketing, distribution, information, human and other resources than we do and may be stronger in certain of the market segments in which we operate.
The factors described below may conceivably materially affect investors’ decisions as risks relating to us. Unless otherwise specified, information concerning the future presented herein are forecasts based on our decisions, targets, certain premises or assumptions as of the last day (March 31, 2018) of the consolidated fiscal year and may differ materially from the actual results.
Our results of operations for any quarter, half year or year are not necessarily indicative of results to be expected in future periods. Our operating results have historically been, and we expect they will continue to be, subject to quarterly, half yearly and yearly fluctuations as a result of a number of factors, including:
changes in prevailing economic and other conditions relating to our businesses;
variations in costs, sales prices and volume of our products and services, and the mix of products and services we offer;
changes in customer demand and/or our supply chains, which in turn will often depend upon market conditions for the relevant products, the success of our customers’ or suppliers’ businesses, industry trends, and other factors;
changes in the level of performance of our strategic investments, which in turn will affect our gains and losses on sales of such investments or may result in the write-off or impairment of such investments;
changes in our asset prices, including equity, real estate and other assets, which in turn will affect our gains and losses on sales of such assets or may result in the write-off or impairment of such assets;
changes in the financial and commodity markets; and changes in the credit quality of our customers.
As such, you should not rely on comparisons of our historical results of operations as an indication of our future performance.
As part of our efforts to strengthen our position as a leading global business enterprise, we intend to increase our profitability and our earnings base and to improve our financial strength and the efficiency and effectiveness of our operations. As part of these continuing efforts, we set and implement a medium-term business plan. In the medium-term business plan, we set certain quantitative and qualitative targets and undertake efforts to achieve such targets while monitoring the status of progress. The targets are set based on the gathering and analysis of information
RISKS RELATED TO OUR BUSINESSThe risk of our revenues and profitability fluctuating from period to period unexpectedly
The risk that we may not be able to achieve the managerial targets set forth in our medium-term business plans
The risk that economic conditions may change adversely for our business
Risks associated with intense competition
Sumitomo Corporation and Subsidiaries

100Sumitomo Corporation Fact Book 2018
invest. As our business investments sometimes require the commitment of substantial capital resources, in some instances, we may be required to contribute additional funds. We may not be able to achieve the benefits we expect from such investments. In addition, since a substantial portion of our business investments is illiquid, we may not be able to exit from such investments at the time or in the manner we would like. We sometimes enter into partnerships, joint ventures or strategic business alliances with various third parties. In some cases, we cannot control the operations and assets of the companies in which we invest nor can we make major decisions in relation to such investments without the consent of other shareholders or participants, or cannot do the same at all. Our business could be adversely affected in such cases, or if we are unable to continue with one or more of our partnerships, joint ventures or strategic business alliances. In order to mitigate these risks, we in principle invest only in projects that meet our investment criteria which reflect the specific business risks associated to each case. At the same time, for the large and/or the important projects that could have a major impact on the entire company, the Business Unit Investment Committee and Company Investment Committee that includes Corporate Group members would be held at the investment targeting stage and at the decision-making stage to analyze the project risks including the specialist’s view point prior to implementation of the investment. Also, there is a procedure for post-closing monitoring of the investment, which is a fundamental part of investment risk control, through tracking of results of investments in comparison to initial business plans.
Our business in mineral resources, oil and gas development projects involve the following risks. Any occurrence of these events could have an adverse effect on our operating results and financial conditions.
development of projects may face schedule delays or cost overruns compared to original plans;
we appoint an expert to estimate the reserves before participating the project, but it may significantly differ after operating;
production may be lower than originally planned or production cost may increase due to difficulties in technical conditions; and
the plan may not be able to perform due to governmental regulations such as delay of acquiring/renewal of approval, tax reform, takeover of business property, infringement.
In this intensely competitive environment, our results of operations will be adversely affected if we are unable to:
anticipate and meet market trends to timely satisfy our customers’ changing needs;
maintain relationships with our customers and suppliers; maintain our global and regional network of associated companies and business partners;
obtain financing to carry out our business plans on reasonable terms or at all; and
adapt our cost structure to constantly changing market conditions so as to maintain our cost competitiveness.
Our business is exposed to credit risks as we extend credit to our customers in the forms of accounts receivable, advances, loans, guarantees and other instruments. Our customers include companies in which we hold equity interest. For such customers, we are exposed to both credit risk as well as investment risk. We also enter into various swaps and other derivative transactions primarily for hedging purposes and have counterparty risk in relation to such contracts. Our business, results of operations and financial conditions may be adversely affected if our customers or counterparties fail to meet their financial or contractual obligations to us. We undertake efforts to manage credit risk by carrying out credit checks on customers based on our internal credit rating system, obtaining collateral or guarantees, and having a diversified customer base. We make allowances for doubtful receivables based on certain assumptions, estimates and assessments about the credit worthiness of our customers, the value of collateral we hold and other items. However, such efforts may not be sufficient to avoid loss that may arise from credit risk. Furthermore, these assumptions, estimates and assessments might not be correct. In addition, if general economic conditions deteriorate, if other factors which were the basis for our assumptions, estimates and assessments change, or if we are adversely affected by other factors to an extent worse than anticipated, our actual losses could materially exceed our allowances.
In connection with our corporate strategy and the development of our business opportunities, we have acquired or made investments in newly established or existing companies and intend to continue to do so in the future. We sometimes extend credit, through such as credit sales, loans, and guaranties, to the companies in which we
Credit risk arising from customers and counterparties
Risks related to investment activities and our strategic business alliances
Risk related to mineral resources, oil and gas development projects

101 Sumitomo Corporation Fact Book 2018
A significant portion of our investments consists of marketable equity securities, particularly those of Japanese issuers. Our results of operation and financial conditions may be adversely affected if the Japanese equity market declines in the future because we would incur impairment losses for equity securities.
Declines in the global stock and other markets would reduce the value of our plan assets, and could necessitate additional funding of the plan by us. This could adversely affect our results of operations and financial condition.
Some parts of our operations and businesses are concentrated in a few particular markets, entities, and regions. As a result, if these operations and businesses do not perform as we expect or if the economic conditions in these markets and regions deteriorate unexpectedly, it could have a disproportionately negative effect on our businesses and results of operations. For example, we are involved in a large power plant project, the automobile lease and finance business, liquefied natural gas projects and other business activities in Indonesia. As such, risk exposure is concentrated there.
We rely on debt financing in the form of loans from financial institutions or the issuance of corporate bonds and commercial paper etc. to finance our operations. If financial markets are in turmoil and financial institutions reduce their lendings to us and there is a significant downgrade of our credit ratings by one or more credit rating agencies, we may not be able to access funds when we need them on acceptable terms, our access to debt capital markets may become more restricted or the cost of financing our operations through indebtedness may increase. This could adversely affect our results of operations and financial condition.
Our operations are subject to extensive laws and regulations covering a wide range of fields in Japan and many other countries. These laws and regulations govern, among other things, tariffs and other taxation, business and investment approvals, import and export activities (including restrictions based on national security interests), antitrust and
We rely on debt financing in the form of loans from financial institutions or the issuance of corporate bonds and commercial paper to finance our operations. We also often extend credit to our customers and suppliers in the form of loans, guarantees, advances and other financing means. For example, through several subsidiaries, we are engaged in motor vehicle financing and leasing businesses in Japan and other countries. Revenues and expenses and the fair price of our assets and liabilities arising from such business transactions, in some cases, are affected by interest rate fluctuations. Foreign currency exchange rate fluctuations can affect the yen value of our investments denominated in foreign currencies as well as revenues and expenses and our foreign currency-denominated assets and liabilities arising from business transactions and investments denominated in foreign currencies. Exchange rate fluctuations can also affect the yen value of the foreign currency financial statements of our foreign subsidiaries. Although we attempt to reduce such interest rate fluctuations and foreign currency exchange risks, primarily by using various derivative instruments, we are not able to fully insulate ourselves from the effects of interest rate fluctuations and exchange rate fluctuations. As a participant in the global commodities markets, we trade in a variety of commodities, including mineral, metal, chemical, energy and agricultural products. As such, we may be adversely affected by the fluctuations in the prices of the relevant commodities. Although we attempt to reduce our exposure to price volatility by hedge-selling commodities, matching the quantity and timing of buying and selling, and utilizing derivative instruments for hedging purposes, we are not able to fully insulate ourselves from the effects of commodity price movements.
Our real estate business involves developing, renting and managing of and providing services to office buildings and commercial and residential properties in Japan and abroad. If the real estate market deteriorates, our results of operations and financial condition could be materially adversely affected. Also, if land prices and rental values decline, we may be forced to write down the value of our properties as well as the value of land and buildings held for lease and land held for development. Not only real estate but also our property holdings are exposed to impairment risk. As such, our business, operating results and financial condition could be adversely affected.
Risks related to declines in real estate market or impairment loss on fixed assets, etc.
Fluctuations of interest rates, foreign currency exchange rates, and commodity prices
Risks related to continued volatility of equity markets in Japan and elsewhere
Risks regarding uncertainty about retirement benefit obligation
Concentration of risk exposure in specific fields
Risks regarding laws and regulations
Risks stemming from restrictions on access to liquidity and capital
Reference Information [Risk factors]

102Sumitomo Corporation Fact Book 2018
operations are largely reliant on them. However, there is a possibility that our business operations are severely disrupted due to unexpected external cyber attacks, fraudulent access to the information systems, computer virus infection or information systems malfunction, and may result in the system stoppage, or unapproved disclosure, loss or impairment of our information.
Our extensive and diverse businesses expose us to various types of risks. We conduct our business through industry-based business units and regional operations, domestic and overseas. At the same time, we are expanding our business activities into new areas. Accordingly, in addition to the risks and uncertainties that we face as a whole as an integrated trading company, each of our industry-based business units and regional operations may be subject to risks inherent in or relating to each industry, market and/or geographic focus. Our existing risk management systems, which consist of various elements from risk measurement methodology and information system to internal rule and organization structure, may not work satisfactorily with respect to various risks. Furthermore, we may have no experience or only limited experience with the risks relating to our new business activities, products and services. In such cases, our new business activities, products and services may require the introduction of more complex management systems and additional management resources, such as human resources. Moreover, a shortage of management resources, such as human resources, may lead to a restriction of business operation.
Natural disasters, such as an earthquake, tsunami, heavy rain or flood, or infectious diseases, such as the new influenza occur in the region or the countries where we operate may adversely affect our operations and results. We have implemented measures such as developing disaster contingency manual, creating Business Continuity Plan (BCP), introducing a safety confirmation system of employees, stocking necessary goods in case of disaster, conducting emergency drills, reinforcing earthquake resistance of buildings and systems, and making a back-up of data. However, despite of these measures, there is no assurance that damage from disasters can be completely avoided.
competition, unfair trade practices, currency exchange, distributor protection, consumer protection and environmental protection. In some of the countries in which we operate, our operations may subject us to additional or future relevant laws and regulations. Also particularly in developing countries with relatively nascent legal systems, our burden of compliance may further increase due to factors such as the lack of laws and regulations, unexpected interpretations of existing laws and regulations and changing practices of regulatory, judicial and administrative bodies. Failure to comply with current or future laws and regulations could lead to penalties and fines against us and restrictions in our operations or damage to our reputation. If that occurs, our business, results of operations and financial condition could be materially adversely affected.
We are party to a number of lawsuits and other disputes in Japan and abroad. In performing our business, lawsuits and other disputes arising incidentally or claims that do not develop into lawsuits may be brought against us.Due to the inherent uncertainty of lawsuits and other disputes, it is not possible to predict the ultimate outcome of the lawsuits and other disputes in which we are involved at this time. There is no assurance that we will prevail in any action or that we will not be materially adversely affected by such action in the future.
Due to our size, as well as the diversity and geographic breadth of our activities, our day-to-day operations are necessarily decentralized. The nature of our operations requires extensive internal controls and management oversight to ensure compliance by our employees with applicable laws and regulations and our internal policies. There can be no assurance that we will succeed in preventing misconduct by our employees through our internal control and compliance systems. Employee misconduct could have a material adverse effect on our results of operations, expose us to legal and financial risks and compromise our reputation. We acknowledge the importance of ensuring information security, and maintain appropriate measures including, but not limited to, the establishment and maintenance of relevant rules, awareness education or the implementation of technology so as to manage information assets. We also take reasonable precautions to the maintenance of information systems since our business
Risks related to legal actions, etc.
Risks regarding noncompliance by officers and employees with applicable laws and regulations and internal policies and regarding management of our information and communications systems
There is no assurance that our risk management systems will effectively minimize various types of risks in our operations to appropriate levels.
Natural Disasters and other risks

103 Sumitomo Corporation Fact Book 2018
Summary of Key Financial Indicators
Summary of Key Financial IndicatorsFor the years ended March 31We have prepared consolidated financial statements in accordance with U.S. GAAP for 2009 and earlier and International Financial Reporting Standards (IFRS) for 2010 and later.
Billions of yenMillions of
U.S. dollars*4
GG Plan FOCUS' 10 BBBO2014 BBBO2017 BBBO2017
Financial Data 2007 2008 2009 2010 2011 2012 2013 2014 2015 2016 2017 2017
Results of operations:
Gross profit ¥ 934.5 ¥ 935.2 ¥ 779.5 ¥ 864.0 ¥ 918.8 ¥ 827.0 ¥ 894.4 ¥ 952.9 ¥ 894.1 ¥ 842.7 ¥ 956.5 $ 9,023
Selling, general and administrative expenses (669.4) (654.4) (639.2) (660.7) (686.4) (657.1) (706.4) (755.2) (762.7) (693.8) (731.6) (6,902)
Interest expense, net (42.8) (36.1) (24.1) (18.1) (15.1) (15.8) (17.4) (13.0) (2.6) (1.7) (5.8) (54)
Dividends 15.3 14.6 11.3 10.0 11.2 13.4 14.9 17.2 10.6 9.4 10.7 100
Share of profit (loss) of investments accounted for using the equity method* 56.9 90.0 76.1 95.6 110.6 107.4 126.2 49.1 (53.8) 83.5 149.7 1,413
Profit (loss) for the year attributable to owners of the parent* 238.9 215.1 155.2 200.2 250.7 232.5 223.1 (73.2) 74.5 170.9 308.5 2,911
Financial position at year end:
Total assets 7,571.4 7,018.2 7,137.8 7,230.5 7,226.8 7,832.8 8,668.7 9,021.4 7,817.8 7,761.8 7,770.6 73,308
Equity attributable to owners of the parent* 1,492.7 1,353.1 1,583.7 1,570.5 1,689.1 2,052.8 2,404.7 2,481.4 2,251.5 2,366.5 2,558.2 24,134
Interest-bearing liabilities (net)*1 3,247.6 3,186.8 2,781.8 3,056.3 2,786.7 2,930.3 3,123.5 3,517.5 2,770.3 2,627.9 2,521.5 23,789
Cash flows:
Net cash provided by (used in) operating activities 323.7 348.8 510.4 219.5 190.4 280.3 278.2 243.7 599.7 345.8 295.3 2,786
Net cash used in investing activities (298.0) (261.5) (59.4) (469.4) (35.7) (186.2) (249.9) (399.6) (85.4) (180.7) (155.8) (1,469)
Free cash flows 25.6 87.3 451.0 (249.9) 154.7 94.1 28.4 (155.9) 514.3 165.1 139.5 1,317
Net cash provided by (used in) financing activities 7.9 (5.8) (150.1) 155.9 (33.3) (24.7) 145.9 (74.8) (507.2) (254.4) (229.6) (2,166)
Yen U.S. dollars*4
Amounts per share:
Profit (loss) for the year attributable to owners of the parent*:Basic ¥ 192.51 ¥ 172.06 ¥ 124.15 ¥ 160.17 ¥ 200.52 ¥ 185.92 ¥ 178.59 ¥ (58.64) ¥ 59.73 ¥ 136.91 ¥ 247.13 $ 2.33
Diluted 192.47 172.03 124.12 160.09 200.39 185.79 178.46 (58.64) 59.69 136.81 246.91 2.33
Equity attributable to owners of the parent* 1,194.20 1,082.47 1,266.93 1,256.31 1,351.10 1,641.60 1,927.37 1,988.62 1,803.95 1,895.81 2,048.93 19.33
Cash dividends declared for the year*2 38.00 34.00 24.00 36.00 50.00 46.00 47.00 50.00 50.00 50.00 62.00 0.58
%, Times
Ratios:
Equity attributable to owners of the parent ratio (%)* 19.7 19.3 22.2 21.7 23.4 26.2 27.7 27.5 28.8 30.5 32.9
ROE (%) 16.1 15.1 10.6 12.9 15.4 12.4 10.0 (3.0) 3.2 7.4 12.5
ROA (%) 3.0 2.9 2.2 2.8 3.5 3.1 2.7 (0.8) 0.9 2.2 4.0
Debt-equity ratio (net) (times) 2.2 2.4 1.8 1.9 1.6 1.4 1.3 1.4 1.2 1.1 1.0
For reference: Billions of yen Millions ofU.S. dollars*4
Basic profit*3 ¥ 197.1 ¥ 243.0 ¥ 151.4 ¥ 220.5 ¥ 251.5 ¥ 216.5 ¥ 245.0 ¥ 184.0 ¥ 46.5 ¥ 193.1 ¥ 308.7 $ 2,912
* Under U.S. GAAP, “Share of profit (loss) of investments accounted for using the equity method” corresponds to “Equity in earnings of associated companies, net”; “Profit (loss) for the year attributable to owners of the parent” corresponds to “Net income (loss) attributable to Sumitomo Corporation”; “Equity attributable to owners of the parent” corresponds to “Sumitomo Corporation shareholders’ equity”; and “Equity attributable to owners of the parent ratio” corresponds to “Sumitomo Corporation shareholders’ equity ratio.”
*1 Interest-bearing liabilities (net) excludes cash and cash equivalents and time deposits from interest-bearing liabilities.*2 Cash dividends per share represents the cash dividends declared applicable to each respective year, including dividends paid after the year-end.*3 Basic profit = (Gross profit + Selling, general and administrative expenses [excluding provision for doubtful receivables] + Interest expense, net +
Dividends) x (1 – Tax rate) + Share of profit (loss) of investments accounted for using the equity method [The tax rate was 41% for 2007 through 2011, 38% for 2012 and 2013, 36% for 2014, 33% for 2015,and 31% for 2016 and 2017.]*4 The U.S. dollar amounts represent transactions of Japanese yen amounts at the rate of ¥106 = U.S.$1.

104Sumitomo Corporation Fact Book 2018
Billions of yenMillions of
U.S. dollars*4
GG Plan FOCUS' 10 BBBO2014 BBBO2017 BBBO2017
Financial Data 2007 2008 2009 2010 2011 2012 2013 2014 2015 2016 2017 2017
Results of operations:
Gross profit ¥ 934.5 ¥ 935.2 ¥ 779.5 ¥ 864.0 ¥ 918.8 ¥ 827.0 ¥ 894.4 ¥ 952.9 ¥ 894.1 ¥ 842.7 ¥ 956.5 $ 9,023
Selling, general and administrative expenses (669.4) (654.4) (639.2) (660.7) (686.4) (657.1) (706.4) (755.2) (762.7) (693.8) (731.6) (6,902)
Interest expense, net (42.8) (36.1) (24.1) (18.1) (15.1) (15.8) (17.4) (13.0) (2.6) (1.7) (5.8) (54)
Dividends 15.3 14.6 11.3 10.0 11.2 13.4 14.9 17.2 10.6 9.4 10.7 100
Share of profit (loss) of investments accounted for using the equity method* 56.9 90.0 76.1 95.6 110.6 107.4 126.2 49.1 (53.8) 83.5 149.7 1,413
Profit (loss) for the year attributable to owners of the parent* 238.9 215.1 155.2 200.2 250.7 232.5 223.1 (73.2) 74.5 170.9 308.5 2,911
Financial position at year end:
Total assets 7,571.4 7,018.2 7,137.8 7,230.5 7,226.8 7,832.8 8,668.7 9,021.4 7,817.8 7,761.8 7,770.6 73,308
Equity attributable to owners of the parent* 1,492.7 1,353.1 1,583.7 1,570.5 1,689.1 2,052.8 2,404.7 2,481.4 2,251.5 2,366.5 2,558.2 24,134
Interest-bearing liabilities (net)*1 3,247.6 3,186.8 2,781.8 3,056.3 2,786.7 2,930.3 3,123.5 3,517.5 2,770.3 2,627.9 2,521.5 23,789
Cash flows:
Net cash provided by (used in) operating activities 323.7 348.8 510.4 219.5 190.4 280.3 278.2 243.7 599.7 345.8 295.3 2,786
Net cash used in investing activities (298.0) (261.5) (59.4) (469.4) (35.7) (186.2) (249.9) (399.6) (85.4) (180.7) (155.8) (1,469)
Free cash flows 25.6 87.3 451.0 (249.9) 154.7 94.1 28.4 (155.9) 514.3 165.1 139.5 1,317
Net cash provided by (used in) financing activities 7.9 (5.8) (150.1) 155.9 (33.3) (24.7) 145.9 (74.8) (507.2) (254.4) (229.6) (2,166)
Yen U.S. dollars*4
Amounts per share:
Profit (loss) for the year attributable to owners of the parent*:Basic ¥ 192.51 ¥ 172.06 ¥ 124.15 ¥ 160.17 ¥ 200.52 ¥ 185.92 ¥ 178.59 ¥ (58.64) ¥ 59.73 ¥ 136.91 ¥ 247.13 $ 2.33
Diluted 192.47 172.03 124.12 160.09 200.39 185.79 178.46 (58.64) 59.69 136.81 246.91 2.33
Equity attributable to owners of the parent* 1,194.20 1,082.47 1,266.93 1,256.31 1,351.10 1,641.60 1,927.37 1,988.62 1,803.95 1,895.81 2,048.93 19.33
Cash dividends declared for the year*2 38.00 34.00 24.00 36.00 50.00 46.00 47.00 50.00 50.00 50.00 62.00 0.58
%, Times
Ratios:
Equity attributable to owners of the parent ratio (%)* 19.7 19.3 22.2 21.7 23.4 26.2 27.7 27.5 28.8 30.5 32.9
ROE (%) 16.1 15.1 10.6 12.9 15.4 12.4 10.0 (3.0) 3.2 7.4 12.5
ROA (%) 3.0 2.9 2.2 2.8 3.5 3.1 2.7 (0.8) 0.9 2.2 4.0
Debt-equity ratio (net) (times) 2.2 2.4 1.8 1.9 1.6 1.4 1.3 1.4 1.2 1.1 1.0
For reference: Billions of yen Millions ofU.S. dollars*4
Basic profit*3 ¥ 197.1 ¥ 243.0 ¥ 151.4 ¥ 220.5 ¥ 251.5 ¥ 216.5 ¥ 245.0 ¥ 184.0 ¥ 46.5 ¥ 193.1 ¥ 308.7 $ 2,912

105 Sumitomo Corporation Fact Book 2018
Financial/ESG Highlights
Interest-Bearing Liabilities (Net) and DER (Net) Earnings per Share* (Diluted) / Equity per ShareAttributable to Owners of the Parent
0
1.0
2.0
3.0
4.0
20170
1.0
2.0
3.0
4.0
2.52.5
1.0
2008 2009 2010 2011 2012 2013 2014 2015 2016
3.23.2
2.82.83.13.1
2.82.8 2.92.93.13.1
3.53.5
2.82.82.62.6
2.4
1.8
1.1
1.91.6
1.4 1.3 1.41.2
Interest-bearing liabilities (net) (left scale)Debt-equity ratio (net) (right scale)
(FY)
Trillions of yen Times
0
-1,000
1,000
2,000
3,000
2017
0
100
-100
200
300
2008 2009 2010 2011 2012 2013 2014 2015 2016
172.03172.03124.12124.12
160.09160.09200.39200.39 185.79185.79
178.46178.46
-58.64-58.64
59.6959.69
136.81136.811,082.47
1,266.93
1,895.81
1,256.31 1,351.101,641.60
1,927.37 1,988.62
1,803.95
Earnings per share* (diluted) (left scale)Equity per share attributable to owners of the parent (right scale)
(FY)
Yen Yen
* Profit (Loss) for the year attributable to owners of the parent
247.13247.13
2,048.93
Profit (Loss) for the Year* and Basic Profit
2008 2009 2010 2011 2012 2013 2014 2015 2016 2017-100
0
100
200
300
215.1215.1243.0
155.2155.2151.4
200.2200.2220.5
250.7250.7251.5232.5232.5
216.5 223.1223.1245.0
-73.2-73.2
184.0
74.574.546.5
170.9170.9193.1
Profit (Loss) for the year*Basic profit
(FY)
* Profit (Loss) for the year attributable to owners of the parent
Billions of Yen 308.5308.5 308.7
Total Assets and ROA Equity Attributable to Owners of the Parent and ROE
0
-1.0-2.5
1.0
2.0
3.0
4.0
2017
0
2.5
5.0
7.5
10.0
2008 2009 2010 2011 2012 2013 2014 2015 2016
7.0 7.1
7.27.2 7.27.27.87.8
8.78.7 9.09.0
7.87.8 7.87.82.9
2.2
2.22.8
3.5
3.12.7
-0.8
0.9
Trillions of yen %
Total assets (left scale)ROA (right scale)
(FY)
7.87.8
4.0
0
-8.0
8.0
16.0
24.0
32.0
2017
0
0.8
-0.8
1.6
2.4
3.2
2008 2009 2010 2011 2012 2013 2014 2015 2016
1.4
1.61.6 1.61.6 1.71.7
2.12.12.42.4 2.52.5
2.32.3 2.42.4
10.67.412.9
15.412.4
10.0
-3.0
3.2
Trillions of yen %
(FY)Equity attributable to owners of the parent (left scale)ROE (right scale)
2.62.6
12.515.1
Financial HighlightsWe have prepared consolidated financial statements in accordance with U.S. GAAP for fiscal 2009 and earlier andInternational Financial Reporting Standards (IFRS) for fiscal 2010 and later.

106Sumitomo Corporation Fact Book 2018
Environmental Data (Total Amount for Each Fiscal Year)Scope: Head Office and domestic offices and branches for which data can be collected
2014 2015 2016*6 2017*6,7
Electricity Consumption (1,000kWh)*1 7,547 7,490 7,278 6,797CO2 Emissions (at offices)*2 (t-CO2) 5,252 5,145 4,610 4,310CO2 Emissions (from logistics)*3 (t-CO2) 6,877 8,971 7,420 7,803General Waste Emissions*4 (t) 378 342 324 170Water Consumption*4 (m3) 27,734 24,732 22,054 19,415Paper Consumption (1,000 sheets)*5 29,832 28,975 25,681 22,280
*1 Sumitomo Corporation has set a target of reducing electricity consumption per square meter in exclusive area by an average of at least 1% annually. We will seek to reduce electricity consumption by more than 20% in fiscal 2035 compared to fiscal 2013 (the base year). (25% reduction in electricity consumption)
*2 If Sumitomo Corporation achieves its target for electricity consumption reduction, this achievement will effectively reduce the Company’s CO2 emissions by 45% in fiscal 2035 compared to fiscal 2013 (the base year). As for the breakdown of CO2 emissions in fiscal 2017, Scope 1 emissions were 94 t-CO2 and Scope 2 emissions were 4,215 t-CO2. The above figures indicate total amounts of CO2 emissions stemming from use of electricity, utility gas, and district heat (cooling/heating water).
*3 CO2 emissions from logistics include the transport of cargo within Japan for which Sumitomo Corporation is the cargo owner, as stipulated in the Act on the Rational Use of Energy. Sumitomo Corporation has set a target of improving efficiency in the use of energy due to domestic transportation by 1% annually.
*4 Sumitomo Corporation has set a target of reducing general waste emissions per employee by an average of at least 1% annually from the base year of fiscal 2010.*5 Calculated based on the purchase cost of office paper and the unit price of A4-size paper*6 From fiscal 2016, Sumitomo Corporation will use the actual, pre-adjustment emission coefficients of individual power companies for its CO2 emissions coefficients.*7 Figures for fiscal 2017 are preliminary figures that have yet to be submitted for third-party verification.
Corporate Governance Data (As of March 31 of Each Fiscal Year)
2014 2015 2016 2017*12
Number of Directors 12 13 14 9Number of Internal Directors 10 10 10 6Number of Outside Directors 2 3 4 3
*12 We have 11 Directors (including 5 Outside Directors), as resolved at the 150th Ordinary General Meeting of Shareholders held on June 22, 2018.
ESG Highlights
*8 Figures include employees at overseas offices of the Company.*9 Figures are as of June 1 of each fiscal year. The calculation method has been changed since fiscal 2017, and the past year has also been reclassified.*10 The calculation method has been changed since fiscal 2015, but the past year has not been reclassified.*11 It is a training hosted by the head office targeted at locally recruited employees of overseas bases and business companies.
Employee Data (As of March 31 of Each Fiscal Year)
2014 2015 2016 2017
EmployeeData
Number of Employees (Consolidated Basis) 75,448 66,860 70,900 73,016Number of Employees (Non-Consolidated Basis)*8 5,371 5,389 5,342 5,261Number of New Employees 148 155 153 157
Men/Women 125/23 108/47 102/51 107/50Number of Mid-career Employees 5 7 8 7Ratio of Differently Abled Employees to Total Employees*9 (%) 2.07 2.14 2.11 2.21Number of Female Managers 78 107 143 153Ratio of Female Managers to Total Managers (%) 2.88 3.87 5.05 5.55Average age 42.8 42.9 42.8 42.7Average years of service (years/months) 18/5 18/5 18/4 18/4
Men 19/4 19/4 19/1 19/0Women 15/5 15/7 15/10 16/1
Working Styles
Average Monthly Overtime Hours*10 13.02 12.41 11.50 9.12Average Annual Days of Paid Vacation Acquired*10 10.4 12.7 15.1 16.8Spouse maternity leave 86 80 76 74Leave to look after a sick child 135 161 200 215Number of individuals acquiring childcare leave 40 51 54 68
Men/Women 0/40 2/49 5/49 2/66Number of individuals using shortened work hour system 101 99 121 129
HumanResourceDevelopment
Number of Employees Dispatched Overseas 1,087 1,099 1,112 1,101Number of Employees Undergoing Training Overseas 93 97 82 94Number of Employees Participating in Training 12,283 12,351 11,868 11,818Total Number of Lectures 311 320 321 326Number of Employees from Overseas Participating in Global Training Program*11 236 239 234 259Cost for Training (millions of yen) 3,029 2,767 2,678 2,416