BE -- CALIFORNIA VOTERelections.cdn.sos.ca.gov/sov/1993-special/sov-complete.pdfMonterey 231,911...
23
SCAC€M€NC OF VOC€ and SU PPL€M€N C November 2. 1993 General Election BE -- CALIFORNIA VOTER Compil ed by March Fong €u Secretarv of Slale
-
Upload
nguyenngoc -
Category
Documents
-
view
216 -
download
2
Transcript of BE -- CALIFORNIA VOTERelections.cdn.sos.ca.gov/sov/1993-special/sov-complete.pdfMonterey 231,911...

SCAC€M€NC OF VOC€
and
SUPPL€M€N C
November 2. 1993 General Election
BE --CALIFORNIA
VOTER Compil ed by
March Fong €u Secretarv of Slale
•
The cover artwork was developed by Nicholas Chim of Piedmont for my 1989 ·YOU'VE GOT TIlE POWER" high school voter registration logo contest.
The logo emphasizes the fundamental right of people in a free and democratic nation to choose the men and women who will represent our interests at all levels of government. By registering and voting, we exercise our 'power of choice."
March Fong Eu Secretary of State •
- . S'CA'C€M€N'C OF VO'C€
and
SUPPL€M€N'C
November 2, 1993 General election
Compiled by
March Fong Eu secretory of Stote

Preface
This Statement of Vote IS prepared and issued pursuant to Elections Code section 17121.
I thank those who assisted in compiling, editing, proofing, and printing this document with its detailed information.
March Fong Eu Secretary of State

Table of Contents
Preface
Table of Contents . . . . . . . . . . . . . . . . . . . . . . . . . . . . . . . . . . . . . . . . . . . . .. III
Voter Registration Statistics by County . . . . . . . . . . . . . . . . . . . . . . . . . . . . . . . IV
Voter Participation Statistics by County ........... ...... .. . ....... . .. . V
Comparative Voter Registration and Participation Statistics for Statewide Elections - 1910 through 1993 ... .. .................. . . VI
Signature Requirements for Initiative and Referendum Petitions, New Political Party Qualifications, and List of Voting Systems Used in this General Election ........... . .... .. . VII
Declaration of State Ballot Measures Adopted and Defeated by Electors and Statewide Summary of Votes Cast For and Against State Ballot Measures ... VIII
CERTIFIED STATEMENT of the VOTE
Statewide Measures Submitted to a Vote of the Voters ... .. . . . .. .. ... .... 1
Certificate of the Secretary of State . .. ... . . . ..... .. ............... . . 13
iii
t
Voter Registration Statistics by County October 4, 1993
Voting Age Registered American Peace and Declined County Population to Vote Democratic Republican Independent Green Libertarian Frecdorn Miscellaneous to State
Alameda 933.206 693,174 427,339 158.312 9,305 11,596 2,247 4,132 3.603 76,640 Alpine 812 715 267 306 20 3 5 8 0 106 ". Amador 22,327 17,740 8.269 7,386 390 68 84 52 () 1.491 llune 148.717 107.783 48.109 44, 187 2,342 587 631 508 265 11.154
Calaveras 27.597 20.693 9.1 86 8.971 392 114 194 66 32 1.738 Colusa 11533 7.013 3.208 3.074 132 8 19 19 63 490 Contra Costa 64513 494.669 251577 175.133 7,783 3.844 1.635 1.801 10.32 1 42,575 Del Norte 17.01 5 11.636 5.432 4.196 324 50 36 43 2 1553
EI Dorado 103.655 79,589 32.787 36.167 1.649 366 369 228 291 7.732 Fresno 467.758 305.312 159,211 113.999 5,180 1,533 1.851 1,143 202 22.193 Glenn 17,484 10,820 4,804 4,718 223 17 38 17 71 932 Humboldt 90.600 73.231 38,614 22,607 1,396 2,754 295 395 14 7.156
Imperial 69,239 39.165 20.906 13.479 679 18 114 193 31 3.745 Inyo 13.839 10,086 4.006 4,914 198 34 35 32 40 827 Kern 382,307 251.146 110,132 112,748 5,443 517 958 887 273 20.188 Kings 62.143 36.056 18,125 13545 83 1 28 73 135 7 3,3 12
I..lke 41.003 28,817 15, 157 10.016 556 167 134 88 () 2.699 I.c1.<;sen 17.327 12,050 5.812 4,487 343 17 42 27 81 1.241 Los Angeles 5,687.228 3.603,562 1.977,043 1,161.835 50.231 12.386 14,683 19,450 11 ,746 356.188 Madera 65.028 43.063 21,637 16.832 874 78 85 183 71 3,303
Ma rin 177.085 14M26 77.5 24 45,2OJ 2,152 2.582 755 697 2 19.111 Ma riposa 11.932 9.805 4.191 4.090 229 111 44 37 56 1.047 Mendocino 59. 110 45,550 24,747 13,400 827 906 229 370 63 5.008 Merced 116.)1 8 69,512 36.789 24,081 1.388 155 2 18 287 23 6.571
Modoc 7,111 5.782 2,55 6 2519 136 7 22 17 9 516 Mono 8.303 5,379 1.895 2,423 137 41 38 30 0 815 Monterey 231,911 148,274 73,459 50,792 2,963 782 571 641 862 18.204 Napa 86.553 64,484 32,746 23.639 1,144 447 264 193 273 5,778
Nevada 67,179 53.136 19,792 24,788 842 1,276 430 2 11 23 19 3.478 ~ Orange 1,768.954 1,173.570 404.684 613.520 19.822 3.064 6.816 3.491 1.283 120.890 Placer 145.105 109.2SS 44.247 50.960 1,971 637 482 322 29 10.640 Plumas 15.139 12,050 5,720 4,651 266 51 42 37 13 1,270
Riverside 976.885 579,1 81 24S,714 260.643 10,418 935 4.708 1,687 3,024 49.052 Sacramento &'19,243 607.747 318.926 218.060 9,535 3,815 2.091 2.411 489 52.420 San Renito 27 ,4 83 16,610 8.160 6.122 321 40 54 60 39 1.814 San Bernardino 1.108.356 675,396 302,064 293,279 13.158 948 2.508 2362 2,435 58.642
San Diego 1.955,557 1.142,494 504.694 606.516 29.632 6,007 9,281 6.492 1.3!'4 178,4~S.
Sa n Francisco 477.633 425,034 269.968 71.774 5,385 10,."47 2.038 3,682 ?-76 61 .264 San Joaquin 342.899 230.159 11 8.567 &<.910 3,554 951 623 767 2302 14.485 San IlJis Obispo 176274 126.368 50,704 55..;83 2,786 869 693 502 1.030 14,201
S..m Mateo 479.902 343.765 180 O;:6Q 109.620 5.564 2,379 1.415 1 .. ';39 132 42556 Santa B.'trbara 2SO.5J 4 201,613 85.953 81,406 4,105 2.298 923 906 1,102 24,920 Santa Clara 1.065.892 787.264 387.353 273.721 12,845 4.913 4305 3,364 1566 99. 197 Santa Cruz 176.853 140.007 77.958 36,543 2.140 5,036 1.118 1.207 128 15,877
r
Shasta 11 5.585 83.685 35,853 36,409 2.116 99 353 274 40 8541 Sierra 2,497 2.322 1,055 892 42 17 16 6 25 269 Siskiyou 32 .720 24.917 12.249 9,24 1 629 82 88 85 12 2.53 1 Solano 251.n2 168,071 93,224 51.708 2.821 662 471 537 71 18.577
Sonoma 313 .054 239,975 134,534 73.907 3,1 10 2.415 1,012 1.258 1,098 22 .64\ Stanislaus 277.052 174.20 1 92,526 63,100 3,353 446 464 643 846 12.S-23 Sutter 45.025 34.001 13,166 16,796 709 67 106 147 11 2.999 Tehama 38.668 26,453 12.663 10.2.59 775 22 159 65 24 1 2.269
Trinity 9.67 1 8.092 3,768 2.965 247 58 54 54 155 791 Tulare 210.643 122,992 57,358 5 1.128 2.542 411 418 472 53 10.610 Tuolumne 37 .597 29,380 14.192 11 .762 543 139 118 86 55 :.4~5 Ve ntura 496.517 342.591 141.791 149.361 6.615 2,656 1.464 1,408 2.282 :n.OI4
Yolo 112.699 77.322 43.150 23,169 1,128 i20i 26g 247 368 7.785 Yuba 38.708 23,807 11,021 9,461 614 79 98 98 4 2.432
Stale Totals 20.797.290 14,524,623 7.110.142 5,389,313 244.855 91.34~ 68.285 66JJ99 51 31 3 1503.274 Percent 68.01 48.95 37.10 1.69 .63 .47 .46 J5 10.35 •
IV

Voter Participation Statistics by County
Number ~md Percent of Votes Cast Numher of Voting Age Registered Precinct Absent 1'Ot31 Percent of Percent or
County Precincts Population to Vote Voters Voters Voters Registered YAP '
Alameda 895 933.206 693.174 215.196 35.256 250.452 36.13 2fl.H4 Alpine 5 812 715 0 394 .194 55 .10 48.52 Amador 37 22.327 17.740 7,637 1.743 9,380 52.87 42.01 Butte 158 148.717 107.783 37,255 12. 158 49.413 45.84 13.23 Calavera s 33 27.597 20,693 7,609 2.553 10.162 49.11 36.82
C(\!usa 17 11.533 7,013 3,192 725 3,IJ17 55 .85 33.90 Cnnlra Costa 546 624.513 494.669 164,629 4:\817 210,446 42.54 33.70 Del Norte 10 17,015 11,636 3,045 \.654 4,699 40.38 27 .62 El J)orado 145 103,655 79,589 27,116 9.616 36.732 46.15 35.44 Fresno 439 467,758 305,312 87, \67 \9.907 107,074 35.07 22.89
Glenn 22 17,4R4 10.820 4.3 51\ 995 5.353 49.47 30.62 IIumboldt 108 90.600 73,231 30,030 1,457 J 1,4H 7 43.00 34.75 Imperial 74 69,239 39,165 13,529 I,no 15,309 39.09 22.11 Inyo 35 13.839 10.086 4,437 1,013 5.450 54.04 39.38 K,m 396 382.)07 251.146 83.015 15.413 9R.42R .~9 . 19 25.75
Kings 97 62,143 36.056 9,658 2.001 11 ,659 .12.34 IR. 76 Lake 5R 41.003 28,817 10.666 3,424 14,090 48.89 .1436 Lassen 32 17.327 12.050 5,191 LORO 6.271 52.04 36.19 Los Angeles 3.786 5.687,228 3,603,562 927.155 214,636 1.141.791 .11.69 20.08 Madera 57 65,028 43,063 12,524 3,857 16.3R1 3R.04 25.19
Marin 195 177,085 148.026 57,022 13,348 70,370 47.54 39.74 Mariposa 23 11.932 9.805 3,934 1.008 4,942 .'i0.40 41.42 Mendocino 62 59.11 0 45.550 16,940 3.007 19,947 43.79 33.75 Merced 57 116,518 69,512 21.691 5,015 26,706 .'8.42 22.92 Modoc 19 7,111 5.182 2.640 350 2.990 51.7 1 42.05
Mono 13 8.303 5,379 1.759 355 2,1 14 39.30 25.46 Monterey 93 231.911 148,274 36.933 23,634 60.567 40.85 26.12 N,pa 99 86,553 64,484 23,411 6.223 29,634 45.96 34.24 Nevada 51 67,179 53,136 18,422 6.453 24,875 46.81 37.03 Orange 921 1.768,954 1.173,570 339,770 85.064 424.834 36.20 24.02
Placer 168 145,105 109.288 37,592 13.212 50.804 46.49 35.01 Plumas 29 15.139 12.050 4,78R 1,404 6.192 5 1.39 40.90 Riverside 1,081 976,885 579.181 154,220 43,355 197.575 34.11 20.23 Sacramento 606 809.243 607,747 187.798 36,572 224,370 36.92 27.n San Benito 40 27,483 16.610 5,487 1.593 7,080 42.62 25.76
San Bernardino 631 1,108.356 675,396 161,630 36.915 198.54 5 29.40 17.91 San Diego 2.675 1.955,557 \,342,494 355.458 124,981 480,439 35.79 24.57 San Francisco 542 477,633 425,034 113,377 44.769 158.146 37.21 33.11 San Joaquin 428 342,899 230,159 67.410 15.628 83,038 .'6.08 24.22 San Luis Obispo 124 176,274 126.368 38,112 is,125 56,237 44.50 31.90
San Mateo 524 479,902 343.765 102.343 31.799 134,142 W.02 27.95 Santa Barbara I7J 280.514 201,613 64,816 18.350 83,166 41.25 29.65 Santa Clara R7I 1.065.892 787,264 236,671 40,464 277 ,135 .15.20 26.00 Santa Cruz 149 176.853 140,007 4\,752 24.304 66.056 47.18 37.35 Shasta 83 115,585 83.685 31.882 9.125 41,007 49.00 35.48
Sierra 12 2,497 2.322 785 284 1.069 46.04 42.81 Siskiyoll 78 32.720 24,917 9.491 3.030 12.521 50.25 38.27 Solano 272 251,132 168,071 56.083 11.856 67,939 40.42 27.05 Sonoma 264 3 13.054 239.975 72,312 29.121 101.433 42.27 32.40 Stanislaus 161 277,052 174,20 I 0 77.146 77.146 44.29 27.85
Sutter 57 45,025 34,001 10.038 4,034 14.072 41.39 31.25 Tehama 45 38.668 26,453 11,210 2,4B 13,643 5 1.57 35.28 Trinity 17 9.671 8.092 2,476 1.694 4,170 51.53 43.12 Tulare 162 210,643 122.992 39,028 5,768 44,796 :16.42 21.27 Tuolumne 75 37,597 29,380 1 t,15 8 2.276 13.434 45.72 35.73
Ventura 370 496.517 342.591 102,629 30.780 133,409 38.94 26.87 Yolo 114 112.699 770322 24,607 5,R84 30,491 .w.43 27.06 Yuba 22 38.708 23.807 7.145 1.376 8.521 35.79 22.01
State Totals 18.256 21.357.290 14.524.623 4.126.229 1,156.214 5,282.443 36.37 24.73 Percent 68.01 78 . 11 21.89
• VAP '" Voting Ag.e Population
v

out of Turnout of *
Comparative Voter Registration and Participation Statistics for Statewide General Elections--1910 through 1993
Registration V 0 t e s Cas 1 Voting Age VAP Total Turn
Genera l Dale POl2uiation Democratic RCQublican Other Total Percent Votes Registered YAP •Nov. 8. 1910 725,000 393,893 54.33 Nov. 5,1912 P 1.569,000 987.368 707,776 71.68 45.11 Nov. 3. 19 14 1.726.1XXl 1.219.345 961.868 78.88 55 .73 Nov. 7, 1916 P 1.806.1XXl 1.314.446 1.045,858 79 ..17 57.91 Nov. 5, 1918 1,918,lXXl 1.203,898 714525 59.35 37.25
Nov. 2, 1920 P 2,090,000 !.374,184 987,632 71.87 47.26 Nov. 7, 1922 2.420,000 319,107 968.429 244,848 1532.384 63.32 1'c)(Xl,997 65.32 41.36 Nov. 4, 1924 P 2,754,000 397,962 1.183,672 240,723 1.822.357 66.17 1,336..\98 73.34 48.53 Nov. 2, 1926 2,989.100 410,290 q98,062 204,510 1.912.862 64.00 1.212.452 63.38 405 6 Nov. 6, 1928 P 3,240,000 592,161 1.535,751 185,904 2,313,816 71.41 1,846,077 79.78 56.98
Nov. 4, 1930 3.463,000 456,096 1,638575 150557 2,245,228 64,83 1,444,872 64.35 41.72 Nov. 8, 1932 P 3.573,000 1.161.482 1.565,264 162,267 2,889,013 80.86 2.330,132 80.65 65.22 Nov. 6. 1934 3,674,000 1555,705 1.430,198 154,211 3.140,114 85.47 2,360,916 75,19 64 .26 Nov. 3, 1936 P 3,844,000 1.R82,014 1.244507 127.300 3,253,821 84.65 2,712,342 83.36 7056 Nov. 8. 1938 4,035,000 2.144.360 1.293,929 173,127 3,611,416 89,50 2,695,904 74.65 66.81
Nov. 5, 1940 P 4,214,000 2.419,628 1.458.373 174.394 4,052,395 96, 17 3,300.410 81.44 78.32 Nov. 3, 1942 4.693,000 2.300,206 1.370,069 150.491 3,820,776 81.41 2,264,288 59.26 48.25 Nov. 7, 1944 P 5.427,000 2.418,965 1.548,395 173,971 4,14!.331 76.31 3,566,734 86.13 65.72 Nov. 5. 1946 5,8oo,Om 2.541.720 1,637,246 204,997 4,383,963 75.59 2,759,641 62.95 4758 Nov. 2, 1948 P 6,1 06,000 2,892,222 1,908,170 261.605 5,061,997 82.90 4.076.981 80.54 66.77
Nov. 7, 1950 6.458.000 3.062.205 1.944,812 237,820 5.244,837 81.21 3,845.757 73.32 59.55 Nov. 4. 1952 P 7,033,000 3,312,668 2,455,713 229,919 5,998,300 85.29 5,209,692 86.85 74.07 Nov. 2, 1954 7.565.()(Xl 3.266.831 2.415,249 203,157 5.885,237 77.80 4,101.692 69.69 54.22 Nov. 6. 1956 P 8,208,000 3575,635 2,646.249 186,937 6.408,821 78.08 5,547,621 8656 67.59 Nov. 4, 1958 8.909.000 3.875.630 2,676..';65 200,226 6.752.421 75 .79 5.366,053 79.47 60.23
Nov. 8, 1960 P 9..';87.000 4,295,330 2,926,408 242,888 7.464,626 77.86 6.592591 88.32 68.77 Nov. 6, 1962 10305.000 4,289.997 3,002,038 239,176 7,531.211 73.08 5.929.602 78.73 57.54 Nov. 3. 1964 P 10,959,000 4.737.886 3.181.272 264,985 8.184,143 74.68 7,233.067 88.38 66.m Nov. 8, 1906 11.448.0<Xl 4,720.597 3,350,990 269.281 8.340,868 72.86 6.605 .866 79.20 57.70 Nov. 5. 1968 P 11.813.000 4,682,661 3,462.131 442.881 8,587.673 72.70 7.363,711 85.75 62.34
Nov. 3. 1970 12.182.000 4.781.282 3.469.046 456,019 8,706,347 71.47 6.633.400 76.19 54.45 Nov. 7, 1972 P 13.322.0fXl 5.864.745 3,840,620 760,850 10.466,215 7856 8.595,950 82.13 6452 N,lV. 6, 1973 S 13512.000 5,049.959 3.422.291 617..)69 9,089,819 67.07 4.329.017 47.62 32.04 Nov. 5. 1974 13.703,000 5,623.831 3"\74.624 729.909 9.928,364 72.45 6.364,597 64.\1 46.45 Nov. 2, 1976 P 14,196,000 5,725,718 3.468.439 786.331 9,980,488 70.30 8,137.202 81.53 57.32 Nov. 7, 1978 14,78 1.000 5,729,959 3.465.384 934.643 10,129.986 68.53 7,132.210 70.41 48,25 Nov. 6. 1979 S 15.083JXlO 5594,018 3.406.854 1.006.085 10,006,957 66.35 3.740,800 37.38 24.80
Nov. 4. 1980 I' 15.384.000 6,043,262 3,942,768 1.375593 11.361.623 73.85 8,775.459 77.24 57.04 Nov. 2. 1982 15.984.000 6.15 0.716 4.029.684 1.378,699 11559,099 72.32 8.064.314 69.78 50.45 Nov. 6. 1984 I' 16582.000 6,804.263 4,769.129 1.5<Xl,238 13,073.630 78.84 9,796.375 74.93 59.08 Nov. 4, 1986 17.561.000 6.524.496 4.912.581 1.396.843 12,833.920 73.08 7,6\7,142 59.35 43.38 Nov. 8. 1988 P 19.052.000 7.052.368 5.406.127 1.546.378 14,004,873 73.51 10,194539 72.81 53.51
Nov. 6. 1990 19.245,0fXl 6,671.747 5,290,202 1,516.078 13.478,027 70.03 7.899.131 58.61 41.05 Nov. 3. 1992 P 20.864.000 7,4 10,914 5593.555 2.097.004 15,101.473 72.38 11,374565 75.32 54.52 Nov. 2. 1993 S 21,357.0fXl 7.11 0.142 5.389.313 2,043,168 14.524.623 68.01 5,282.443 36.37 24.73
Note 1: P indicates a presidential election year.
Note 2: In 1911 women were given the franch ise.
Note 3: 1972 was the first year that 18- to 21-ycar-olds were eligible to register and vote in a general election. The registration period was also extended that year by reducing the 54-day pre-election cut-off period to 30 days .
Note 4: In 1975. the cut-off period for registering to vote was reduced by the Legislature to 29 days prior to the election.
• VAP ~ Voting Age Population • VI

Signature Requirements for Qualifying Initiative and
• Referendum Petitions in 1993 and 1994
(Based on the Numher of Persons who Voted for the Office of Governor at the 1990 General EJection)
Initiative Constitutional Measure 615.958 (8 percent of 7.699.467 (Art. II. § 8(b). Constitution»
Initiative Statutory Measure 384.974 (5 percent of 7.699.467 (Art. II. § 8(b). Constitution»
Referendum Measure 384.974 (5 percent of 7.699.467 (Art. II. § 9(b). Constitution))
New Political Party Qualification Requirements for the 1994 Primary Election (Based on the Numher of Persons who Voted at the 1990 General Election)
New Political Party Qualification by Registration 78.992
(1 percent of 7.899.131 (§ 6430(b). Elections Code))
New Political Party Qualification by Petition Si{.,'flatures 789.914 (10 percent of 7.899.131 (§ 6430(e), Elections Code»
Voting Systems Used by the Counties in the November 2. 1993 General Election
1. Ballot Card Systems
A. Mark Sense Card Systems
1. A.I.S.315: Nevada
2. Mark·a·Vote: Contra Costa, Lake, Madera, Mariposa, Orange, Riverside, San Joaquin, Santa Barhara, Sonoma, Sutter, and T ulare
3. Opteeh 3P Eagle: Amador, San Mateo and Tuolumne
B. Punch Card Systems
1. Datavote
Alpine, Butte, Calaveras, Colusa, Del Norte, El Dorado, Fresno, Glenn, Imperial, Inyo, Kern, Kings, Lassen, Merced, Modoc, Mono, Monterey, Napa, Placer, Plumas, San Ben ito, San Luis Obispo, Santa Cruz, Sierra, Siskiyou, Stanislaus, Tehama, Ventura, Yolo, and Yuba
2. Votomotie
Format 228: Shasta
Format 312: Alameda, Humboldt, Los Angeles, Marin, Mendocino, San Bernardino, San Diego, San Francisco, and Solano
Poll Star: Sacramento and Santa Clara
2. Voting Machines
Automatic: Merced
vii

Official Declaration of the Results of the General Election Held on Tuesday, November 2, 1993 throughout the State of California
on Statewide Measures Submitted to Voters
The following laws were adopted by vote of electors:
Ballot Measure Numher Ballot Title
•171. Property Taxation. Transfer of Base Year Value.
Legislative Constitutional Amendment. (Assemhly Constitutional Amendment 41. Statutes of 1992. Resolution Chapter 136)
172. Local Puhlic Safety Protection and Improvement Act of 1993. Legislative Constitutional Amendment (Senate Constitutional Amendment 1. Sta tutes of 1993. Resolution Chapter 41)
The following proposed laws were defeated by vote of electors:
BallOl Measure Number Ballot Title
168. Low Rent Housing Projects. Legislative Constitutio nal Amendment (Senate Constitutional Amendment 17. Statutes of 1992. Resolu tion Chapter 109)
169. Budget Implementation. Legislative Constitutional Amendment (Senate Constitutional Amendment 32, Statutes of 1992. Resolution Chapter 114)
170. Property Taxes. Schools. Majority Vote. Developrnent·Fee Limits. Legisla tive Constitutio nal Amendment (Assembly Constitutional Amendment 6. Statutes of 1992, Resolution Chapter 135)
173. California Housing and Jobs Investment Bond Act. $185 Million Legislative Bond Act (Assembly Bill 215. Statutes of 1993. Chapter 116)
174. Educa tion. Vo uchers. lniti:ttive Constitutional Amendment
Votes Cast For and Against November 2, 1993 Statewide Ballot Measures
Ballot Measure Yes No Numher Vote s Cast Percent Votes Cast Percent
168. l.ow Rent Housing Projects 1,946,559 40.1 8 2,898,211 59.82 169. Budget Implemen tation 1,811,118 38.70 2,868,591 61.30 170. Property Taxes. Schools 1,512,163 30.65 3,421 ,342 69.35
171. Property Taxation 2,449,504 51.70 2,288,046 48.30 172. Local Public Safety Protection 2,893.680 57.80 2,113,094 42.20
173. Califomia Housing and Johs 2,037,804 42.20 2,791,573 57.80 174. Education. Vouchers 1")61,5 14 30.44 3,567,834 69.56
Effective Date
"A proposed [legislative] amendment or revision shall be submitted to the electors and if approved hy a majority of votes thereon takes effect the day after the election unless the measure provides otherwise."
See Cal. Const., Art. XVIII , Sec. 4.
viii
•

State Ballot Measures
Prop. 168 Prop. 169
Low Rent Housing Budget Projects. Votes not Implementation Voles nol
Yes No ('.ast in Race Yes No Ca!;' in Race
Alameda 118.033 110,189 22,230 109,174 110,340 30,938
~roent ;<;1.72% 48.28% 8.SS% 49.73% .~.27% IDS'"
Alpine 131 251 12 114 254 26
~rttnt 34.29% 6.''.71% 3.05% 30.98% 69.02% 6.~
Amad o r 2.679 6,133 568 2,375 6,230 775 ~roenl 30.40% 69.60% 6.(Xi% 27.60% 72.40% 8.26%
Bulle 14,960 31.856 2,597 13.820 31 ,413 4,1 80
~rccnl 31.95% 68.0-"% -".26% 3055% 69.45% 8.46,,"¢
('.alaveras 3,004 6,649 509 2,618 6 ,802 742
~roent 31.12% 68.88% 5.01% 27.79% 72.21% 7.301:"0
Colusa 773 2,891 253 750 2,786 381
~roenl 21.10% 78.900/0 6.46% 21.21% 78.79% 9.73"'"0
Contra Costa 83,571 107,315 19,560 80,714 103,290 26,442
~roenl 43.18% 56.22% 9.29% 43.87% 56.13% 12.56%
Del None 1,109 3,428 162 1,013 3,480 ~roenl 24.44% 7556% 3.45% 2255% 77.45%
EI Dorado 10,889 23,938 1,905 10,030 23,851 2 ,851
~roenl 31.21% 68.73% -". 19% 29.60% 70.40% 7.7(,%
Fresno 34,529 60,203 12,342 35,006 56,354 15,714
~roenl 36.45% 6355% 1153% 38.32% 61.68% 14.6S%
Glenn 978 4,118 257 1,075 3,898 380
~roenl 19.19% 80.81% 4.80% 21 .62% 7838% 7. 10%
Humboldt 8,977 20,203 2,307 8,032 20,255 3,200 Rerccnl 30.76% 69.24% 7.33% 2839% 71.61 % 10.\6%
Imperial 5,016 9,121 1,172 3,655 10.061 1,593
~roenl 3;<;.48% 64.52% 7.66% 26.65% 7335% 10.41%
Inyo 1,312 3,878 260 1,356 3,701 393 ~rccnl 2.'";. 28% 74.72% 4.77% 26.81 % 73. 19% 7.21%
Kern 21.381 72,741 4,306 19,157 73,122 6.149
f':oroenl 22.72% TI.28% 4.37% 20.76% 79.24%
Kings 3,101 7,889 669 2,598 8 ,154 907 ~roenl 28.22% 71.78% 5.74% 24.16% 75.1W% 7.78%
Lake 4,460 8,922 708 3,789 9 ,282 1,019
~rttnl 33.33% 66.67% 5.02% 28.99% 71.01 % 7.23%
Lassen 1,403 4,536 332 1,361 476
~roenl 23.62% 76.38% 5.29% 23.49% 759%
Los Angeles 450,95 1 587,204 103 ,636 420,006 579,193 142,592 ~roenl 43.44% 5656% 9.05% 42.03% $7.97% 11..49%
Madera 3,724 11 ,536 1,121 3,620 11,224 1,537
~n:rnl 24.400/(1 75.~ 6.84% 24.39% 75.61% 9.3.'1 %

State Ballot Measures
Prop. 168 Prop . 169
Low Rent Housing Budget Projects. Voles no t Implementation VOles nO I
Yes No Casl in Ra ce Yes No ('.a sl in Race
Marin 30.829 30,944 8,597 28,546 29,600 12,224
~roent 49.91% 50.09% 12.22% 49.09% 50.91% 17.37% •
Mariposa 1,378 3,359 207 1,252 3,396 296
}treent 29.09% 70.91% 4.19% 26.94% 73.06% 5.99%
Mendoc ino 6,887 11,265 1,795 5,964 11,394 2,589 ~reent 37.94% 62.06% 9.00% 34.36% 65.64% 12.98%
Merced 8,536 15,295 2,875 7,695 15,290 3,721
Fement 35.82% 64.18% 10.77% 33.48% 6652% 13.93%
Modoc 572 2,243 175 497 2,246 247 }treent 2032% 79.68% 5.85% 18.12% 81.88% 8.26%
Mono 588 1,431 95 557 1,420 137
~roent 29.12% 70.88% 4.49% 28. 17% 71.83% 6.48%
Montcrcy 24.408 31 ,867 4,292 22,207 32,102 6,258 ~roent 4337% ~.63% 7.09% 40.89% 59.11% to.33%
Napa 11 .821 15,594 2,219 10,507 16,147 2,980 ~rcent 43.12% 56.88% 7.49% 39.42% 6058% 10.06%
Nevada 7,478 15,919 1,478 6,546 16,248 2,081
~rcenl 31.96% 68.04% 5.94% 28.72% 7118% 8.37%
Orange 131 ,850 265,567 27,417 126,514 262,772 35,548
R!rcenl 33.18% 66.82% 6.4~% 32..'iO% 6750% 8.37%
Placer 14,939 32 ,659 3,226 14.431 31,787 4,586
ltraonT 31.40% 68.60% 6.35% 31.22% 68.78% 9.03%
Plumas 1.410 4,510 272 1.454 4,305 433 f\o:nrnt 23.82% 76.18% 4.39% 2.'i..!.'i% 74.75% 6.99%
Ri verside 69,252 117,271 11,052 65,428 116,832 15,315
~raont 37.13% 62.37% 5.59% 35.90% 64.10% 7.75%
Sacramento 78.708 128,108 17,554 77,844 122,932 23,594
Rement 38.06% 61.94% 7.82% 38.77% 61.23% 10.52%
San Benito 2,247 4,468 365 2,042 4,517 521
Rettenl 33.46% 6654% 5.16% 31.13% 68.87% 7.36%
San Bernardino 54,331 123,779 20,485 57.496 115,500 25,599
~roent 3050% 6950% 10.31% 33.24% 66.76% 12.89%
San Diego 176,084 263,299 41 ,056 149,206 274,504 56,729
~ment 40.08% 59.92% 8.55% 35..21% 64.79% 11.81%
San Fra nc i~o 89,473 48,064 20,609 77,360 51,937 28,849 Iereent 65.05% 34.95% 13.03% 59.83% 40.17% 18.24%
San Joaquin 29,109 50,146 3,783 26,272 51,405 5,361
~rcrnl 36.73% 63.27% 4.56% 33.82% 66.18% 6.46%
San I.ui s O bispo 18,891 34,780 2,566 18,033 34, 195 4,009
~n::enl 35.20% 64,80% 456% 14_li3% 6:U7% 7.13% •2

State Ballot Measures
Prop, 168 Prop. 169
Low Rent Housing Budgel Projects. Votes not Implementation Voles no t Yes No Cast in Race Yes No Cast in Race
San Mateo 54.587 64.318 15,237 52.668 60.719 20.755 ~roent 4~,91% ~.09% 11.36% 46,45% 53.55% 15.47%
Santa Barbara 31.483 46.675 5,008 29,591 45.417 8 ,158 ~roenl 40.28% 59.72% 6.02% 39,45% 60.55% 9.81%
Santa Clara 111.435 137.593 28,097 109.196 129.701 38,228 ~roenl 44,75% 55.2.'i% 10.14% 45.71% 5429% 13.79%
Santa Cruz 27.816 32,718 5.522 25,236 32.120 8.700 ~roent 4,5,95% 54.Q'i% 8.36% 44.00% 56.00% 13.17%
Shasta 9.555 28.533 2.919 8 .290 28.640 4.077 ~roenl 20:;:,09% 74.91% 7.12% 22.45% 77..'i5% 9.94%
Sierra 284 741 44 227 781 61 ~roent 27,71% 72.29% 4.12% 22..'i2% 77.48% 5.71 %
Siskiyou 2.832 9 ,085 604 2.916 8.767 838 ~roent 23,76% 76.24% 4.82% 24.96% 75.04% 6.69%
Solano 24 .677 37.537 6 .325 22.809 37.316 8.412 ~roenl 39JJ6% 60.34% 9.23% 37.93% 62.07% 12.27%
Sonoma 43.040 51.705 6.688 40.813 50.648 9 .772 ~roenl 45,43% 54.57% 659% 44.53% .'i.'i.47% 9.63%
Stanislaus 26.897 43.460 6.789 23.225 44.592 9,329 ~lttnt 38.23% 61.77% 8.80% 34.2.'1% 65.75% 12.09%
Suller 3.412 10.105 555 2,996 10.293 783 ~rcrnt 2-1t.24% 74.76% 3.94% 2254% 77.46% 556%
Tehama 2 .650 10,350 643 2,306 10.453 884 ~rcrnl 20..38% 79.62% 4.71% 18.07% 81.93% 6.48%
Trinity 1.0gg 2.898 173 895 3.022 253 ~roenl 2750% 72.50'1"0 4.15% 22.85% 77.1.'i% 6.07""C
Tulare 12.762 29,608 2.426 10,355 31 .002 3.439 ~rcent 30.12% 69.88% 5,42% 25.04% 74.96% 7.68%
Tuolumne 4,736 7.471 1.227 3.884 7.687 1 ,863 ~rcent 38.80% 61.20% 9.13% 33.57% 66.43% 13.87%
Ventura 45.537 79,588 8.284 43,194 77.968 12,247 ~roent 36.39% 63.61% 6.21 % 35.65% 64.35% 9.18%
Yolo 11.763 16,278 2.450 10.727 16.210 3,554 ~roent 41.95% 58.05% 8.04% 39.82% 60.18% 11.66%
Yuba 2.222 5.9gg 300 1 ,676 6.400 445 ~roent 27.03% 72.97% 3-'2% 20.7.5% 79.25% 5.22%
State Totals 1.946.559 2.898.211 438.315 1.811.1 18 2.868.591 603,376 ~roenl 40.18% 59.82% 8.30% 38.70% 61.30% 11,42%
3

State Ballot Measures
Prop . 170 Prop . 171 Property Taxes. Schools. Majority Vote. Property Taxation. Transfer of Development - Fee Limits. Votes not Base Year Value, Votes not
Ves No C..aSI in Race Ves No Cast in Race
Alameda 97,949 133,262 19,241 131,615 90,549 28,288 Fement 4236% 57.64% 7.68% 59.24% 40.76% 11.29%
• Alpine 113 272 9 166 205 23
A!roent 2935% 70.65% 2.28% 44.74% 55.26% 5.84%
Amador 1,884 6,957 539 3,623 5,057 700 ~roenl 21.31% 78.69% 5.75% 41.74% 58.26% 7.46%
Butte 12,688 34,810 1,915 18,959 27,144 3,310 ~~nt 26.71% 73.29% 3.88% 41.12% 58.88% 6.70%
Calaveras 2,106 7,601 455 3,838 671 ~roent 21.70% 78.30% 4.48% 40.44% 6.60%
Colusa 655 3 ,026 236 1,084 2,511 322 Femenl 17.79% 82.21% 6.03% 30.15% 69.85% 822%
Contra Costa 62,934 134,090 13,422 106,926 82,123 21,397 re~nt 31.94% 68.06% 638% 5656% 43.44% 10.17%
Del Norte 763 3,803 133 1,358 3,154 187 lement 16.71% 83.29% 2.83% 30.10% 69.90% 3.98%
EI Dorado 9,190 26,122 1,420 14,970 19,189 2,573
Fe~nt 26.03% 73.97% 3.87% 43.82% 56.18% 7.00%
Fresno 34,762 63,012 9,300 41.108 51,678 14,288 Feroent 35_'i5% 64.45% 8.69% 44.30% 55.70% 1334%
Glenn 855 4,302 196 1,404 3,607 342
~roent 16_'i8% 83.42% 3.66% 28.02% 71.98% 6.39% • c
P
Humboldt 5,763 23,483 2,241 10,123 18,276 3,088 PI Feroenl 19.71% 80.29% 7.12% 35.65% 6435% 9.81%
Imperial 3,410 10,n9 1,120 4,849 8,964 1,496 R ft:roent 24.03% 75.97% 732% 35.10% 64.90% 9.17%
Inyo 1,130 4,111 209 1,906 3,198 346 5, ~roenl 2156% 78.44% 3.83% 37.34% 62.66% 6.35%
Kern 18.783 76,190 3,455 27,089 65,600 5,739
ft:roent 19.78% 80.22% 3.51% 29.23% 70.77% 5.83%
Kings 2.731 8 ,344 584 3 ,858 6,952 849 5, ft:rcrnl 24.66% 7534% 5.01% 35.69% 64.31% 7.28%
Lake 2.588 10,793 709 5,121 8,017 952
R:roenl 19..34% 80.66% 5.03% 38.98% 61.02% 6.76%
Lassen 1,103 4,886 282 1,816 3,999 456 5, ~rrenl 18.42% 8158% 450% 31.23% 68.77% 7.27% I
Los Angeles 331,244 726,627 83,920 548,873 458,252 134,666 5, R:roenl 3131% 68.69% 735% 5450% 4550% 11 .79%
Madera 3,103 12,473 805 5,712 9,201 1,468 5, R:roent 19.92% 80.1)3.% 4.91% 38.30% 61.70% 8.96%
4

State Ballot Measures
• Prop. 170 Prop. 17 1
Property Taxes. Schools. Majority Vote. Property Taxation. Transfer of Development-Fee Limits. VOles nOI Base Year Value, V oles nOI
Yes No Cast in Race Y es No C'-l. SI in Ra ce
Marin 23.446 40 .149 6 ,775 38,082 21 .554 10.734 ~ra'nl 36.87% 63.13% 9.6]% 63.S6% 36.14% ts'z$OO
Mariposa 984 3,817 143 1,875 2,772 297 ~l'Ct'nl 2050% 79.~ 2.89% 40.35% 59.65% 6.01 %
Mendocino 4,558 13,833 1,558 7,426 10.218 2,303 ~roent 24.78% 75.22% 7.80% 42.09% 57.91 % 1U5%
Merced 7.477 16,635 2,594 9,636 13,568 3,502
~l'Ct'nl 31.01 % 68.99% 9.71% 41.53% 58.47% 13.11 %
Modoc 346 2,453 191 612 1,921 257 ~roenl 1236% 87.64% 6.39% 29.7\% 70.290/0 8.600/0
Mono 467 1,573 74 638 1.155 121
Ael'Ct'nl n.89% 77.11 % 350% 42.05% 57.95%
Monterey 17,997 38,955 3,615 27,361 27.736 5,470 Aeroent 31.60% 68.40% 5.97% 49.66% 5034% 9.03%
Napa 8,617 19,275 1,742 13,273 13,737 2,624 Aeroenl 30.89% 69.11% 5.88% 49.14% 50.86% 8.85%
Nevada 5,251 18,601 1,023 9,937 12,636 2,100
~l'Ct'nl 22.01% 77.99% 4.11% 43.63% 56.37% 8.44%
Orange 98,118 309,131 17,585 215,655 179,909 29,270
Ael'Ct'nt 24.09% 75.91% 4.14% 54.52% 45.48% 6.89%
Placer 11,776 36,497 2,531 20,856 25,942 4,004
Aeroent 24.390/0 75.61% 4.98% 4457% 55.43% 7.88%
Plumas 1,115 4,875 202 1.985 3,656 351 Ael'Ct'nt 18.61 % 8139% 3.26% 33.98% 66.02% 5.67%
Riverside 51,698 137,986 7,891 91.297 93,276 13,002
~ra'nt 27.2.'i% 72.75% 3.99% 49.46% 505 4% 6_'i8%
Sacramento 66,182 141 ,115 17,073 98,967 102,369 23,014 Aerunt 31.93% 68.07% 7.61% 49.15% 50.8..';% 10,26%
San Benito 1,706 5,117 257 2,676 3,931 473
Aeroenl 2.'iJJO% 75.00% 3.63% 4050% 59.50% 6.68%
San Bernardino 47,747 134,153 16,695 64,779 90,239 23,577
Herttnt 26.2..<:;% 73.75% 8.41% 48.44% 5156% 11.87%
San Diego 128,744 317,168 34,527 225,111 201 ,017 54,311
Aeroenl 28.87% 71.13% 7.19% 52.83% 47. 17% 11.30%
San Francisco 71,805 67,958 18,383 89,459 42.916 25,771
Ael'Ct'nl 51.38% 48.62% 11.62% 6758% 32 42% 16.30%
• San Joaquin 23.495 55,923 3,620 32,552 45,368 5,116
Aercenl 2958% 7D.42% 4.36% 41.78% 58.22% 6,16%
San Luis Obispo 14,845 39,586 1,806 26,288 26,633 3,316
Ael'Ct'nt 27.27% 7273% 3.21% 49.67% 50.33% $.90%
5
State Ballot Measures
Prop . 170 Prop . I7 ! Property Taxes. Schools. Majority Vote. Property Taxation. Transfer of Development-Fee Limits. VOles not Base Year Value. Votes no t
Yes No Cas! in Race Yes No Cast in Ra ce
AI, San Mateo 45.006 79.727 9,409 70,412 48,315 15,415
I\'roenl 36.08% 63.92% 7.01 % 59.31 % 40.69% 11.-19% '" Al l Santa Barhara 26,215 53,299 3,652 41,276 35,105 6,785
Ibttnl 32.97% 67.03% 439% 54.04% 45.%% 8.16% '" An
Santa Clara 88,695 166,105 22,325 135,317 107.364 34,444 R.-rccnl 34.81% 65.19% 8.06% 55.76% 44.24% 12.43% '"
Bu Santa Cruz 21 .597 40.026 4 ,433 30,189 28.259 7 ,608 ~roenl 35.05% 64.95% 6.71 % 51.65% 4835% 11.51% '"
Shasta 8 ,359 30.190 2.458 11,909 25,305 3.793 Itrttnl 21.68% 78.32% 5.99% 32.00% 68.00% 9.2.'i%
Co Sierra 193 838 38 361 647 61 ~roent 18.72% 8U8% 355% 35.81% 64.19% 5.71 %
.. Co
Siskiyou 2,647 9,398 476 4,105 7.682 734 ~roenl 21.98% 78Jr-% 3.8<l% 34.83% 65.17% 5.86% '"
De Sola no 17,900 45,089 5,550 27,464 33,036 8,039
I\-roenl 28.42% 71 58% 8.10% 45.40% 54.60% 11.73% ..
EI Sonoma 34,357 62.391 4,685 49,742 42 ,829 8,862
ltroenl 35.51% 64.49% 4.62% 53.73% 46.27% 8.74% ..
Frt Stan is laus 19.598 51 .654 5 ,894 30.429 38.244 8.473
R-rccnt 27.51 % 72.49% 7.64% 4431 % 55.69% 10.98% ) '" Gi<
Sutter 3,217 10.43'4 421 4.996 8.324 752 R>roent 76.43% 2.99% 37.51% 62.49% 534%
.. Hu
Tehama 1,932 11 ,095 616 3.269 9.553 821 ~roe n l 14.83% 85.17% 452% 2.'i50% 7450% 6.02% '"
1m; Trinity 692 3.317 161 1.261 2,673 236
R.-rcellt 17.26% 82.74% 3.86% 32.05% 67.95% 5.66% '" Iny
Tulare 11,494 31 .382 1.920 17.724 23.828 3,244 , Ihttnt 26.81% 73.19% 4.29% 42.65% 51-15% 7.24%
..Tuolumne 3,056 9.267 1.111 5.584 6.293 1.557
!treen! 24.80% 7:'i.2ook 8.27% 47.0'2% 52.98% 1159%
KinVentura 35.320 92.393 5.696 67.037 56.214 10,158 Itrcent 27.66% 72.34% 4.27% 54.39% 45.61 % 7.61% "',
Yolo 10.278 18.224 1,989 12.367 14.775 3 .349 , R!rccnl 36.06% 63.94% 6_'i2% 45.56% 54.44% 10.98%
..La,
Yuha 1.479 6,770 272 2.797 5.296 428 R:rcenl 17.93% 82.07% 3.19% 3456% 65.44% 5.02% "',
Los State Totals 1.512,163 3,421 .342 349,580 2,449.504 2.288.046 545.535 !troent 3O.6.'i% 69.35% 6.62% 51.70% 48.30% 10.33% ""
) Ma
"',
6
State Ballot Measures
Prop . 172 Prop . 17:;
• Local Public Safety Protection and California Housing and JoOO Improvement Act of 1993 Vo tes not Investment Bond Act. VOles nOI
" Yes No Cast in Ra ce Yes No Cas t in Ra ce cc
Alameda 153.865 83,785 12,802 121,242 106.225 22,985 5 ~rctnl 64.74% 35.26% .'U J% 53.3()<'!0 46.ioeQ 9.18%
Alpine 193 191 10 123 244 27 15
{\ornenl 50.26% 49.74% 2.54% 66.49%
Amador 4.561 4,404 415 2.691 6,067 622 4
I\!rctnt 50.88% 49.12% 4.42% 30.73% 69.27% 0.63%
Butte 27,835 19,808 1,770 15,387 30,887 3,139 18
~rcent 58.42% 41.58% 33.25% M.75% 6.35%
c.., la vc ras 5.223 4,622 317 3,158 6,529 477 '3
~f'CI!nl 53.05% 46.95% 3.12% 32.59% 67.41% 4.69%
Colusa 1,884 1,847 186 777 2,804
~ta'nl 5050% 49~"iO% 4.75% 21.70% 78..30%
Con I ra Costa 120,359 79,700 10,387 89,360 103.45 1 17,635 4
~rcenl 60.16% 39.84% 4.94% 46.35% 53.65% 8.J8/lQ
Del Norte 1.818 2.785 96 1.305 3,192 202 ~n::t'nl 39.50% 60.50% 2.04% 29.02% 70.98% 4.30%
EI Dorado 17,856 17,658 1,218 11.964 22.497 2.271
i:ercenl 50.28% 49.72% 3.32% 34.72% 65.28% 6.18%
Fresno 56,559 42,242 8,273 35,501 58,986 12,587 3
I\!n:cnl 57.25% 42.75% 7.73% 3757% 62.43% 11.76%
Glenn 2,238 2 ,932 183 908 4,145 300 2
~rctnl 43.29% 56.71% 3.42% 17.97% 82.03% 5.60%
Humholdl 13,018 16,695 1.774 9, 152 19,919 2,416 Ftrcrn l 43.81% 56.19% 5.63% 31.48OQ 7.67%
Imper ial 7,81 1 6,631 867 5.011 8,808 1.490 6
R:rcenl 54.09% 45.91% 5.66% 36.26% 63.74% 9.73%
., Inyo 2,598 2 ,665 187 t ,431 3, 721 298
4 Ftrcent 4936% 50.64% 3.43% 27.71\% 72.22% 5.47%
Kern 47,040 49.452 1,936 24.194 68,899 5,335 7
Ftrcent 48.75% t.97% 25.99% 74.01 % 5.42%
Kings 5,775 5.402 482 3,531 7,454 674 8
R:rcent 51.67% 48.33% 4.13% 32.14% 67.86% 5.78%
Lake 6,821 6,790 479 4.497 8.757 836
R:rcenl 50.11% 49.89% 3.40% 33.93% 66.07% 5.93%
Lassen 2 ,563 3.412 296 1,348 4.314 609 3
Ftrctnl 42.900/0 57.10% 4.72% 23.81% 76. 19% 9.71%
, Los Ang.c!es 670, 159 402 ,291 69,34 1 464,809 568.733 108,249 5
• R:rctnt 62.49% 3751% 6.07% 44.97% 55.03""0 9.48%
Madera 6,865 8 ,609 907 4,133 10,874 1,374
Ibrent 44.36% 55.64% 554% 27.54%
7
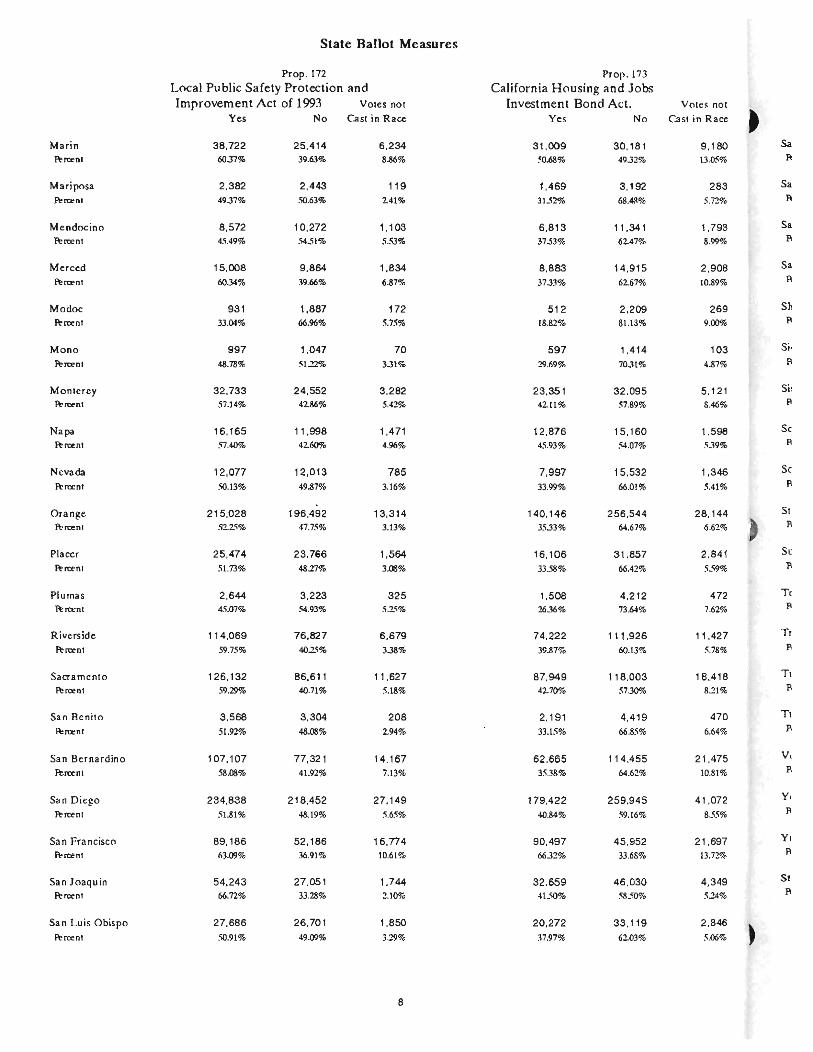
Slale Ballol Measures
Prop. 172 Prop . 173 Local Public Safety Protection and California Housing and Jobs Improvement Act of 1993 Voles nOl Investment Bond Act. VOle s not
Yes No Cast in Race Yes No ('.aS I in Race
Marin 38.722 25.414 6.234 31.009 30.18 1 9 .180 Sa
~roenl 6037% 39.63% 8.86% 50.68% 49.32% 13.05% I'
Mariposa 2.382 2.443 119 1.469 3 .192 283 Sa
~rccnl 4937% 50.63% 2.41% 3U 2% 68.48% 5.72% I'
Mendocino 8.572 1.103 6.813 11 .341 1.793 Sa 10.272 ~rocnl 45.49% 54~'il% 5.53% 3753% 62.47% 8.99% I'
Sa Merced 15.008 9.864 1.834 8.883 14.915 2.908 ~roenl 60.34% 39.66% 6.87% 3733% 62..67% 10.89% I'
Modoc 931 1.887 172 512 2 .209 269 Sh
~rocnl 33.04% 66.96% 5.75% 18.82% 81.18% 9.00% I'
5i , Mo no 997 1.047 70 597 1.414 103 ~rocnl 48.78% 51.22% 331% 29.69% 70.31% 4.87% I'
Monterey 32.733 24.552 3.282 23.351 32 .095 5. I 21 5i:
42.86% 5.42% 42.11% 57.89% R ~rccnl 57.14% 8.46%
Napa I I .998 Sc 16.165 1.471 12.876 15.160 1.598 ftorccnl 57.40% 42.60% 4.96% 45.93% 54.07% 539% I'
Nevada Sr 12.077 12.013 785 7 .997 15.532 1.346 I\!rttnl % % 1\ 50.13% 49.87% 3.16 33.99% 66.01% 5.41
5. Orang.e 215.028 196.492 13.314 140.146 256.544 28.144 3.13% 35.33% 64.67% 6.62% R ~rttnl 52.2..'i% 47.75%
Placer Sr 25.474 23.766 1.564 16.106 31.857 2.841 ~roent 51.73% 48.21% 3.08% 66.42 R 3358% % 5~'i9%
T, Plumas 2.644 3.223 325 1.508 4.21 2 472 R R:-rttnt 45.07% 54.93% 5.2..'i% 2636% 73.64% 7.62%
Riverside 114.069 76.827 6.679 74.222 I I I .926 I I ,427 ~roent 59.75% 40.25% 338% 39.87% 60.13% 5.78%
TI Sacramento 126.132 86.61 I I I .627 87.949 I I 8 .003 18,418 R ftorccnl 59.29% 40.71% 5.18% 42.70% 57.30% 8.21%
T I San BenilO 3.568 3.304 208 2.191 4. 419 470 R ftorccnl 51.92% 48.08% 2.94% 33.l5% 66.85% 6.64%
V, Sa n Bernardino 107.107 77.321 14.167 62.665 I I 4,455 21.475 58.08% R Fbttnl 41.92% 7.13% 35.38% 64.62% 10.81%
Y, San Diego 234.838 218,452 27.1 49 179,422 259.945 41.072 R
~I'ttnt 51.81% 48.19% 5.65% 40.84% 59.16% 855%
Y, San Fra nc isco 89.186 52.186 16.774 90.497 45.952 21.697 R
~rccnl 63.09% 36.91% 10.61% 6632% 33.68% 13.72%
St San Joaq uin 54.243 27.051 1.744 32.659 46.030 4 .349 I' Fhct:nt 66.72% 33.28% 2.10% ·U.SOo/Q 5850% 5.24%
San Luis Obispo 27.686 26.701 1.8SC 20.272 33.119 2.846 ftorttnt 50.91% 49.09% 329% 37.97% 62.03% 5.06%
8
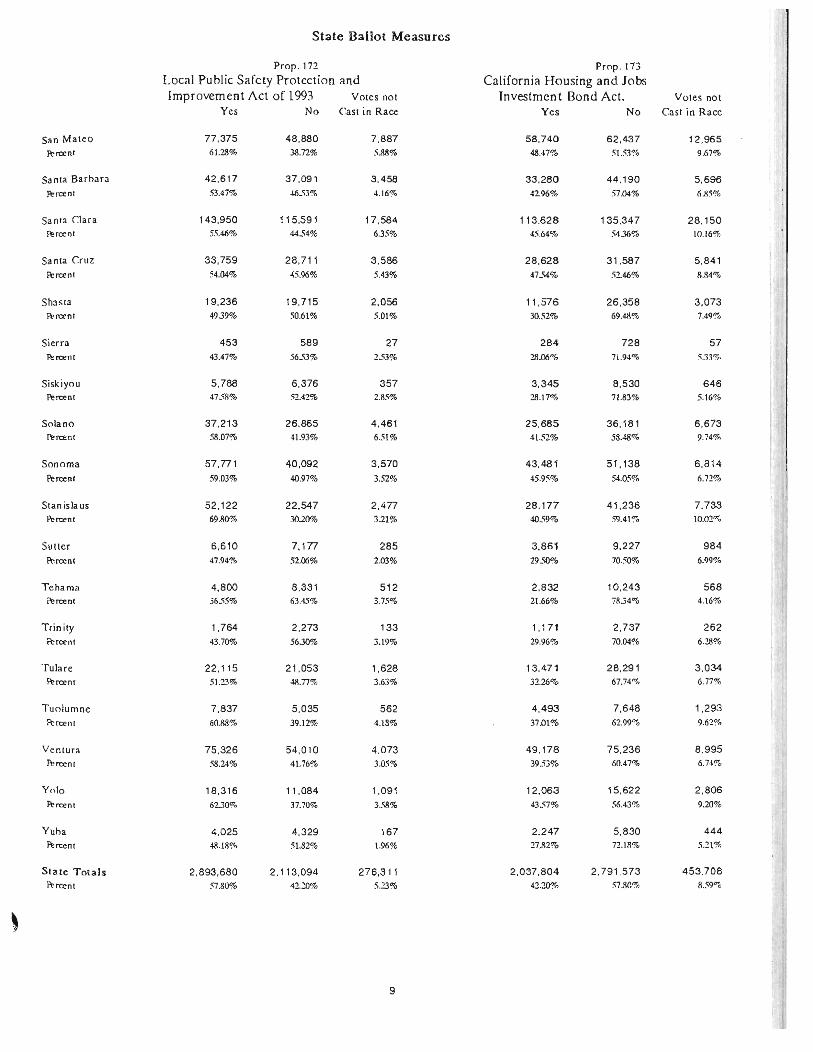
State Ballot Measures
Prop. 172 Prop . 173 Local Puhlie Safety Protection and California Housing and Johs Improvement Act of 1993 Volcs not Investmcn t Bond Act. Votcs not
Yes No Cast in Race Yes No Cast in Race
San Maten 77,375 48,880 7.887 58.740 62.437 12,965 R!n:enf 61.28% 38.72% 5.88% 48.47% 5153% 9.67%
Sanm Barbara 42.617 37.091 3.458 33,280 44 .190 5,696
~rcenl 53.47% 4653% 4.t6% 42.96% 57.()4% 6J15%
Santa Clara 143,950 115,591 17,584 113.628 135.347 28.150 !~n:enf 55.46% 4454% 635% 45.64% 54.36% 10.16%
Santa Cruz 33,759 28,711 3,586 28,628 31,587 5,841
Fen:ent 54.04% 45.96% 5.43% 4754% 52.46% 8.84%
Shasta 19,236 19,715 2,056 11. 576 26,358 3,073
f\' rct"nl 4939% 50.61% 5.01 % 30.52% 69.4&% 7.49%
Sierra 453 589 27 284 728 57 F\::rcrn l 43.47% 5653% 28.06% 71.94% .".33%
Siskiyou 5,788 6,376 357 3,345 8,530 646 R!l'CC'nl 475&% 52.42% 2.85% 28.17% 71.83% .".\6%
Solano 37,213 26,865 4,461 25,685 36.181 6,673 Ibttnt 58.07% 41.93% 6.51% 4152% 58.48% 9.74%
Sonoma 57,771 40,092 3,570 43,481 51,138 6.814
Fercenl 59.03% 40.97% 3.52% 45.95% 54.05% 6.72%
Stanislaus 52,122 22,547 2 ,477 28.177 41,236 7.733 Ferccnl 69.80% 30.20% 3.21% 4059% 59.41 % 10.02%
Sutter 6,610 7,177 285 3,861 9,227 984
I\.orcen t 47.94% 52.06% 2.03% 29..'iO'?"o 7050% 6.99%
Tehama 4,800 8,331 512 2,832 10,243 568 ~n:cnt 3655% 63.45% 3.75% 21.66% 78.34% 4.16%
Trin ity 1,764 2,273 133 1.171 2,737 262
I\.orcrn l 43.70% 56.30% 3.19% 29.%% 70.04% 6.28%
Tulare 22, 115 2 1,053 1,628 13.471 28,291 3,034
Fen::enl 51.23% 48.77% 3.63% 32.26% 67.74~ 6.77%
Tuolumne 7,837 5,035 562 4,493 7,648 1,293
~n:cnl 60..s8% 39.12% 4.18% 37.01% 62.99"b 9 .62%
VCnlura 75,326 54,010 4.073 49. 178 75,236 8.995 F\!rccnt 58.24% 41.76% 3.05% 39.53% 60.47% 6.74%
Yolo 18.316 11,084 1.091 12,063 15.622 2.806
R.-l'CI2'nt 62.30% 37.70% 3.58% 43.57% 56.43% 9.20%
Yuhn 4,025 4,329 167 2,247 5,830 444
~rcent 48.JH% 51.32% 1.96% "!.7B2% 72.1&% 5.21%
Stale Totals 2,893,680 2,113,094 276,311 2,037,804 2,791 .573 453,708
l~rccnt 57.800/0 42.:0% 5.23% 42.20?"" 57.30% 859"(,
9

State Ballot Measures
Prop. 174
Edu cation. Vouchers. VOles nol
Yes No Cast in Race
Alameda 55.560 188.924 5.968 f\'rcenl 22.73% i7.'!7,?" 2.38%
Alp ine 103 284 7 Perc:t'nt 26.61% 73.39% 1.78%
Amador 2.516 6 .560 304 I\- rce nt 27.72% 72.28% 3.24%
Bu ll e 16.611 31.934 868
~l"CX'nl 34.22% 6~.71!% l.76%
Calave ras 3.004 7.034 124 Itrttnl 29.93% 70.07% 1.22%
Col usa 1.231 2 ,573 113
H.'rcc.-nl 32.36% 67.64eo 2.88%
Con t ra Costa 50.806 155,574 4,066 ft>l'tt' n l 24.62?'c. 75.3..~% 1.93%
Del Nort e 1,428 3 .1 94 77 J\.·rcenl 30.90% 69.10% 1.64%
EI Dorado 11,298 24,598 836
I\-ra-nl 31.47% 68.53% 2.28%
Fresno 27.711 73,983 5 ,38C f""!1X-nl 2i.25% n.75~< 5.02%
Glenn 1,796 3,421 136
I\.>rct'n' 3..H3% 65579f 254%
lfulllho ld t 7,871 22 ,784 832 I1'n:t'nl ~'i .68% 74.32% 2.64%
Impe r i,d 3.934 10.763 612
f\'!U'nt 26.77% 73. 23% 4.~,
In yn 1, 472 3 .932 46 J\>m:nl ~7.:W?(, 72.76% U.S.V'"
K er n 32,224 64,827 1,377
It- ret n! 33.200/. 66.80% 1.4()C(.
K ings 3,458 8 .023 178 r1:'Tet: nl 30.12'>; 69.&'1"( 1..'i3%
J ..ake 3,598 10.131 361
Pt-ra:nl 2().21"F 73.7CJ", 256"0
Lasst'n , .488 4, 403 380 11-T'(X: nl 2<:;.Y,~ 7-'.7-" '( 6.(J6'1
Los J\n~eJ c s 335.953 7 46 ,£l1~ 58,914 f\>m'nl 31.0:>", 5.<:.9iC; .f.16C,
Ma dera 5 .849 9,946 566 Ft'rct> n; 3;.0:\" 6::,97~ 35~,(
10

State Ba llot Measures
Prop. 174 Education. Vouchers.
p Votes not
Yes No Cast in Race
Marin 15.926 53.063 1.381 ~roenl 23J~% 76.92% 1.96%
Mari posa 1,493 3.359 92 ~l'Ct"n( 30.77% 69.23% 1.86%
Mendocino 4.866 14.485 596 J\>rcent 25.15% 74.85% 2.99%
Merced 7.692 18.016 998 f\'lU.'nt 29.92% 70.08% 3.74%
Modoc 721 2.11 9 150 J\>ra>nl 2.<;.39% 74.6 1% 5.02%
Mono 569 1,517 28 ~roenl 27.28% 72.72% 1.32%
Monterey 17.898 40.963 1.706 ~roent 30.41% 6959% 2.82%
N,pa 8.068 21.244 322 J\>lttnt 27.52% 72.48% 1.09%
Nevada 7.645 16.832 398 J\>rcrnl 31.23% 68.77% 1.60%
Orange 162 ,360 256.566 5.908 f\'ra>nl 38.76% 61.24% 1.39%
Placer 15.903 34.354 547 J\>rcent 31.64% 68.36% 1.08%
Plumas 1.573 4.370 249 I\-rrenl 26.47% 7353% 4.02%
Riverside 63.240 130.880 3.455 ~rc:ent 3258% 67.42% 1.75%
Sacra mento 62.115 153.992 8.263 ~roe nt 28.74% 71.26% 3.68%
San Ben ito 2.158 4.780 142 J\>roent 31.10% 68.90% 2.0l %
San Bernardino 65.600 124.88 1 8.114 ~n::ent 34.44% 6556% 4.09%
San Diego 165,400 303.326 11,713 J\>rcent 35.29% 64.71% 2.44%
San Francisco 30.750 119.759 7.637 J\>rcent 20.43% 79.57% ~.83%
Sa n Joaquin 24.078 57.346 1.614 F\oroent 29.57% 70.43% 1.94%
San Luis Ol:lispo ~
17.800 37.740 697 F\oroent 32.05% 67.95% 1.24%
11

State Ballot Measures
Pr op. 174
Education. Vouchers. Votes not
Yes No Cast in Race
San Mateo 34.264 97.727 2 ,151 Ft-J"C%"nl 25.96% 74.04% 1.60%
Sa nla Ba rba ra 26,900 54,516 , .750 I~lttnl 33.04% 66.96% 2.10%
Santa Clara 74,746 192.580 9,799 Pl"ttrnl 27.96% 72.04% 354%
Santa Cruz 18.372 46.570 1,1 14
Jt.rttnl 28.29% 71.71% 1.69%
Shasta 13.033 26.816 1,158
f(orcenl 32.71% 67.29% 2.82%
Sierra 262 782 25 ~rtt'nl 2.'i.1O'r., 74.900/... 234%
Siskiyou 3.445 8 .954 122 R:rccnt 27.78% n .22% 0.97%
Solano 19.286 47,310 1.943 ~roent 28.96% 71.04% 2..83%
Sonoma 25.347 74.866 1.220 Reroent 2.'\.29% 74.71% 1.20%
Stanislaus 20.499 54.425 2.222 ~lttnt 27.36% 72.64% 2.88%
Sutter 4.965 8,594 513 R:lttnt 36.62% 63.38% 3.65%
Tehama 3.924 9,492 227 'bUnt 29.2.'i% 70.75% 1.66%
Trinity 1.087 2,955 128 R:n:ent 26.89% 73.11% 3.07%
Tulare 13.408 30,202 1, 186
R:rcent 30.75% 69.2.'i% 2.65%
Tuolumne 3.771 9.407 256 (treen! 28.62% 71.38% 1.91%
Ventura 44,099 87.381 1.929 ~rcenl 3354% 66.46% 1.45%
Yolo 7.315 22.54 1 635 R:lttnl 24.50% 75.50% 2-')8%
Yuba 3 ,01 5 5.322 184 R:nrnl 36.16% 63.84% 2.16%
Sta te Totals 1.561.514 3,559.834 161 .737 ~rcenl 30.49% 69~'iI % 3.06%
12

Certificate of the Secretary of State
I, MARCH FONG Eu, Secretary of State of the State of California, hereby certify:
That the foregoing is a full, true and correct statement of the results of the official canvass of the returns for the November 3, 1992 General Election.
IN W ITNESS W HEREOF, I hereunto set my hand and affix the Great Seal of the State of California, at Sacramento, this 12th day of December, 1993.
MARCH FONG Eu Secretary of State
13