BDCP Financing Paper 3-7
43
Bay Delta Conservation Plan Economic Benefits and Financing Strategies March 2012 “California’s investment need is relatively modest compared to the size of the economy. California is the 8th largest economy in the world with an annual Gross Domestic Product of $1.9 trillion. Investments for Ecosystem Restoration and Water Supply Reliability are also relatively small compared to current annual expenditures. Approximately $20 to $30 billion is spent annually for water services and water related programs. Water rates are lower than other household utility costs. Average monthly household water and wastewater rates are less than average costs for other utilities such as electricity, cable/satellite, cell phone… California’s investment need is substantial, but well within the capacity of California.” -Delta Vision Foundation
-
Upload
patrick-atwater -
Category
Documents
-
view
538 -
download
9
Transcript of BDCP Financing Paper 3-7

Bay Delta Conservation
PlanEconomic Benefits and
Financing Strategies
March 2012
“California’s investment need is relatively modest compared to the size of the economy. California is the 8th largest economy in the world with an annual Gross Domestic Product of $1.9 trillion. Investments for Ecosystem Restoration and Water Supply Reliability are also relatively small compared to current annual expenditures. Approximately $20 to $30 billion is spent annually for water services and water related programs. Water rates are lower than other household utility costs. Average monthly household water and wastewater rates are less than average costs for other utilities such as electricity, cable/satellite, cell phone… California’s investment need is substantial, but well within the capacity of California.” -Delta Vision Foundation

Page 2 | SCWC / PFM
BDCP Economic Benefits and Financing Strategies
“I claim no magic for the solution of the problems of our state. Government is no place for magicians. The need is for common honesty, independence, governmental experience, hard work, determination to make progress, and a belief that ‘where there is no vision, the people perish.” -California Governor Earl Warren
Table of Contents
Executive Summary
I. Introduction and Background
II. Economic Benefits of BDCP Implementation
III. Financing the BDCP
IV. Financial Cost Comparisons to Other California Water Infrastructure Projects
V. Conclusion
VI. Appendices

Page 3 | SCWC / PFM
BDCP Economic Benefits and Financing Strategies
List of Tables
1. Loss of Supply from Regulatory Actions2. Revenue Bond Debt Issues3. Project Construction Cash Flow Schedules4. Debt Service as a Percent of Assessed Valuation for Selected SWP Contractors5. Unit Costs for SWP Contractors Under Baseline Construction Estimate6. Unit Costs for SWP Contractors Under Low Construction Estimate7. Unit Costs for SWP Contractors Under High Construction Estimate8. Federal Contractors’ Debt Service9. Infrastructure Project Costs on a Per Capita Basis
1. BDCP Water Conveyance Facility2. BDCP Implementation Schedule3. Water Supply Cost Comparison in Southern California4. Probability of Flooding Due to 6.5 or Greater Earthquake5. Benefits of Salinity Decrease 6. Drinking Water Quality Issues7. BDCP Capital and Operating Costs by Program Function8. Existing State and Federal Funding Sources9. Aggregate BDCP Debt Service10. Baseline Costs with Operations and Maintenance Expenses11. Baseline Construction Unit Costs12. Low Construction Unit Costs13. High Construction Unit Costs14. Comparable Water Infrastructure Projects Per Capita Costs
1. Water Delivery Assumptions2. Financial Sensitivity Analysis3. Revenue Bond Interest Rate Scale4. Historical Comparisons5. Comparison of Contemporary Water Infrastructure Investment Costs
List of Figures
Appendices

Page 4 | SCWC / PFM
BDCP Economic Benefits and Financing Strategies
Executive Summary
The primary purpose of the Bay Delta Conservation Plan (BDCP) Economic Benefits and Finan-cial Strategies paper is to document the current economic and financial information available about the BDCP program in an understandable format that can be used by policy makers, local elected officials, business organizations, labor leaders and other key stakeholders to evaluate the “financial feasibility” of the BDCP. The Economic Benefits and Financing Strategies paper is one element of a comprehensive public education and outreach program being undertaken by the Southern California Water Committee (SCWC), in collaboration with the State Water Contrac-tors, Inc. with funding by five Southern California State Water Project contractors.
As part of the public education and outreach activity, SCWC plans to disseminate information on the BDCP program throughout Southern California and to other key policy makers statewide. This public education and outreach program is closely coordinated with the ongoing efforts of the State of California, the U.S. Department of the Interior and other organizations to provide accu-rate and factual material in an understandable format for the public.
Beginning in the 1930s California and the federal government have jointly invested billions in the development and operation of the Central Valley Project (CVP) and the State Water Project (SWP). The water supplies from the CVP and SWP serve about two-thirds of the residents and provide irrigation supplies to over 40 percent of irrigated farmland in California. The BDCP plan-ning effort began about five years ago. The BDCP planning and environmental analysis budget is approximately $250 million and is funded almost exclusively by the CVP and the SWP water contractors. The goal is to develop a comprehensive plan to meet the historic California legisla-tive co-equal goals to restore and protect both the ecosystem health and the water supplies in the Sacramento-San Joaquin River Delta (Delta). A major component of the BDCP is the Delta water conveyance project to move water from the Sacramento River through, around or under the Delta to achieve these co-equal goals. The estimated cost for the largest water conveyance proposed alternative is about $13 billion in 2011 dollars and it would take 10 to 12 years to construct.
The broad economic benefits of the water conveyance project are:
• Increasedwatersupplyreliabilitybyreducingtherisksofcatastrophiccollapseofthe Delta levees and seawater intrusion of the estuary that would dramatically affect the environment and potentially shut off water supplies to over 25 million Californians and millions of acres of farm land, resulting in significant economic impacts on the California economy similar to other global natural disasters (e.g., Katrina flooding, earthquakes in New Zealand, Chile and Japan).
• Improveddrinkingwaterqualitybyconveyinglowersalinitywaterwithlessurban,indus- trial and agricultural pollutants for 25 million Californians.
Page 5 | SCWC / PFM
BDCP Economic Benefits and Financing Strategies
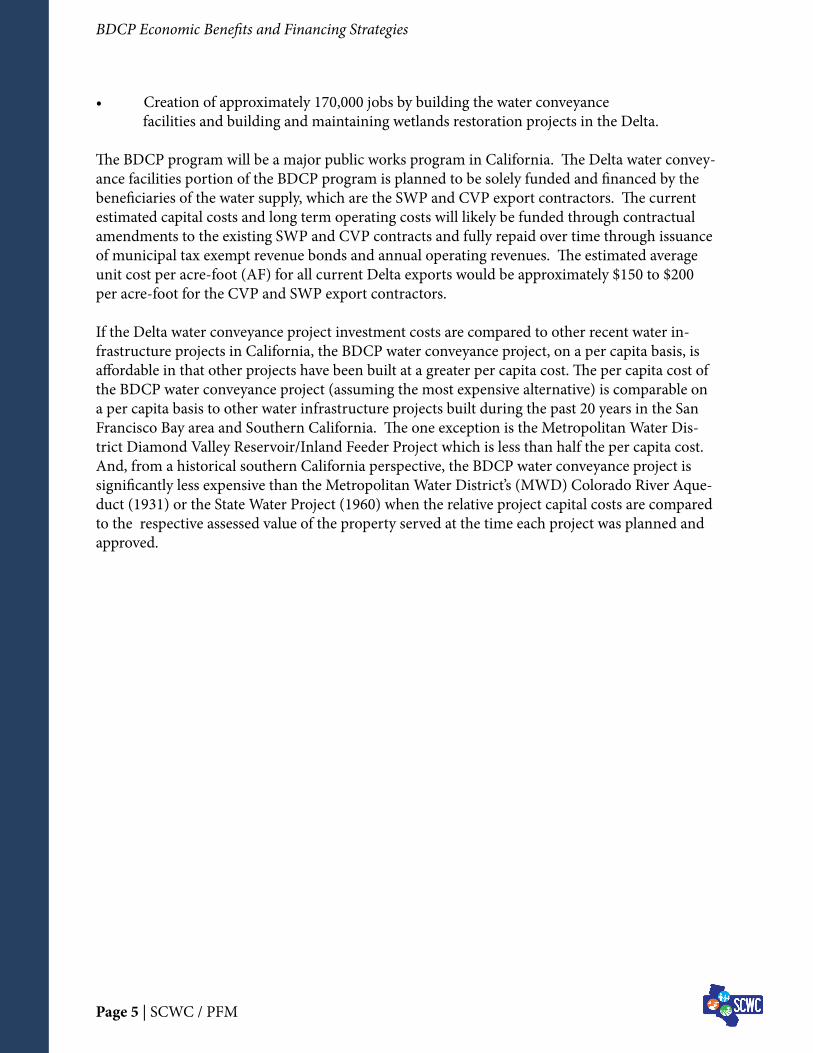
• Creationofapproximately170,000jobsbybuildingthewaterconveyance facilities and building and maintaining wetlands restoration projects in the Delta.
The BDCP program will be a major public works program in California. The Delta water convey-ance facilities portion of the BDCP program is planned to be solely funded and financed by the beneficiaries of the water supply, which are the SWP and CVP export contractors. The current estimated capital costs and long term operating costs will likely be funded through contractual amendments to the existing SWP and CVP contracts and fully repaid over time through issuance of municipal tax exempt revenue bonds and annual operating revenues. The estimated average unit cost per acre-foot (AF) for all current Delta exports would be approximately $150 to $200 per acre-foot for the CVP and SWP export contractors.
If the Delta water conveyance project investment costs are compared to other recent water in-frastructure projects in California, the BDCP water conveyance project, on a per capita basis, is affordable in that other projects have been built at a greater per capita cost. The per capita cost of the BDCP water conveyance project (assuming the most expensive alternative) is comparable on a per capita basis to other water infrastructure projects built during the past 20 years in the San Francisco Bay area and Southern California. The one exception is the Metropolitan Water Dis-trict Diamond Valley Reservoir/Inland Feeder Project which is less than half the per capita cost. And, from a historical southern California perspective, the BDCP water conveyance project is significantly less expensive than the Metropolitan Water District’s (MWD) Colorado River Aque-duct (1931) or the State Water Project (1960) when the relative project capital costs are compared to the respective assessed value of the property served at the time each project was planned and approved.

Page 6 | SCWC / PFM
BDCP Economic Benefits and Financing Strategies
In November 2009, the historic water legislation package was signed by Governor Arnold Schwarzenegger providing the framework to move forward on a comprehensive plan to restore and preserve the Sacramento-San Joaquin River Delta (Delta) while improving the reliability of water supplies for the state. This legislation created the co-equal goals of water reliability and environmental restoration/preservation. A major component of the Bay Delta Conservation Plan (BDCP) is the water conveyance project (Project) to move water through, around or under the sensitive Delta ecosystem. The current total estimate of the most expensive alternative convey-ance project is $13 billion in 2011 dollars. This paper summarizes some of the economic benefits associated with this investment and compares this investment to similar recent and historic proj-ects. Finally, the paper describes the financing and cash flows associated with such a construction project, along with an estimate of the impacts of these costs on water suppliers that will be re-sponsible for funding the annual debt service and operating and maintenance costs of the Project.
There are several motivating factors cited by the proponents of the Project, including improved water supply reliability, water quality and direct economic benefits associated with jobs that are created as a result of the Project construction and operations. In addition to these benefits, the Project provides important protections against sustained supply interruptions due to failure of the Delta levee system as a result of earthquakes or other natural disasters. Finally, the Bay Delta Conservation Plan is a comprehensive strategy to restore the environment of the Delta and to ad-dress the impacts of water diversions on endangered Delta fish species (e.g., Delta smelt). Overall, these economic benefits would result in lower water treatment costs, lower salinity impacts and more jobs, as well as a healthier Delta environment.
For purposes of this paper, we have analyzed the financing costs associated with the largest con-templated Delta water conveyance project – a 15,000 cubic feet per second (cfs) capacity tunnel under the Delta. As shown in Figure 1, the water conveyance facility consists of two tunnels that would divert Sacramento River water near Hood and transport the supply to the Clifton Court Forebay. Water would then be pumped by the Harvey O. Banks Pumping Plant on the State Water Project (SWP) and the Jones Pumping Plant on the Central Valley Project (CVP). This part of the Project is currently estimated to cost $12.7 billion. In addition, another $300 million is expected to be expended in environmental mitigation costs for the Project, bringing the total cost to $13 billion.
A fundamental assumption is that the cost of the water conveyance project would be fully paid by the SWP and CVP contractors. Further, as part of the analyses used in this paper, it is assumed that all users would pay the same approximate unit cost per acre-foot for water moved through the Project. It should be noted that the other costs associated with the comprehensive environ-mental restoration of the Delta would be funded through a combination of other revenues which all beneficiaries would bear some responsibility for funding. This “beneficiaries pay” allocation of the Delta Ecological Restoration Program is currently being developed.
I. Introduction and Background

Page 7 | SCWC / PFM
BDCP Economic Benefits and Financing Strategies
Funding responsibilities for the Delta water conveyance facility will be apportioned between ur-ban and agricultural water users from the San Francisco Bay Area, the Central Valley and South-ern California, all of whom would benefit from improved water quality and supply reliability under their contracts for SWP and/or CVP water supplies. The SWP and CVP Delta export water contractors are expected to pay for and finance the construction, operation and long term main-tenance of any new Delta BDCP facilities, as well as the environmental mitigation for the Project. Other portions of the habitat restoration and other actions, such as water quality improvement and invasive species removal, may be financed and paid for by other sources such as state and federal agencies (e.g., proposed 2012 Water Bond). These restoration costs are estimated to range between $2.5 and $3.5 billion. The schedule for BDCP implementation is shown in Figure 2.
Figure 1. BDCP Water Conveyance Facility

Page 8 | SCWC / PFM
BDCP Economic Benefits and Financing Strategies
BDCP costs and funding sources are still preliminary and the Department of Water Resources (DWR) has initiated a BDCP Financing Working Group. Final costs and funding are dependent upon final engineering design and actual construction of BDCP facilities, adopted actions, and implementation of conservation measures ultimately included in the final BDCP. In addition, costs and funding will be dependent on multiple inter-agency cost sharing agreements with both public and non-profit/private cost sharing partners for the conservation measures. It is also anticipated that other sources of the BDCP environmental restoration funding will be developed over the next five years (2012-2017) as part of the 50-year financing plan for the implementation of the BDCP.
Water supply, reliability and quality improvements require significant capital expenditures. Over California’s history, investment in water infrastructure has occurred after great debate and on various scales. This paper summarizes some recent projects in terms of their capital cost and the financial cost borne by the respective service areas to provide some perspective on the magnitude of the capital investment associated with the Project. In addition, historical comparisons with the Metropolitan Water District’s 1931 voter-approved Colorado River Aqueduct and the 1960 voter approved State Water Project provide a context for the Project’s relative costs and financial burden to its customers.
Finally, this paper provides a financial analysis of the capital construction using revenue bonds, estimating future annual debt service payments, and the relative unit cost for the combined SWP and CVP export contractors. The financial analysis also estimates the Project debt service and includes sensitivity analyses based on different cost-sharing scenarios and assumptions.
Figure 2. BDCP Implementation Schedule
2010 2011 2012 2013 2014 2015 2016 2017 2018 2019 2020 2021 2022 2023
Conservation Plan
EIR/EIS
Permits
Restoration
Engineering
Procurement
Construction
Near‐Term Habitat Restoration Implementation
Preliminary Final Design
Procure Equipment
Land Acquisition & Construction
WorkingDraft
Public Draft Final
Public Draft
Final
Bio Op
Operational

Page 9 | SCWC / PFM
BDCP Economic Benefits and Financing Strategies
II. Economic Benefits of BDCP Implementation
The Delta is a vitally important ecosystem and home to hundreds of aquatic and terrestrial spe-cies, many of which are unique to the Delta habitat. It is also a critical part of California’s water conveyance system. The Sacramento and San Joaquin River watersheds provide the freshwater supplies for the CVP and SWP export facilities in the Delta. The two projects combined provide water supplies for 25 million Californians in the San Francisco Bay Area, the Central Valley, cen-tral coastal communities and Southern California. In addition, these water supplies support very diverse agricultural products, including over half of the domestically grown fresh produce in the U.S.. The Delta and its waterways also provide transportation corridors for ships and boats and is a popular recreational destination.
Historically, the Delta was a vast tidal marsh and floodplain with meandering channels and sloughs. But today it is a dramatically altered environment with man-made levees and dredged channels constructed to support the urban and agricultural economies of the region and the State.
The State of California initiated the BDCP planning process over five years ago in collaboration with the federal government, conservation organizations, water agencies, local governments and many other public and private organizations to improve the Delta environment to meet the co-equal goals:
• RestoreandprotecttheecologicalhealthoftheDelta• Restoreandprotectwatersupplies
The BDCP includes a 50-year plan to ensure compliance with the federal Endangered Species Act (ESA), the California Endangered Species Act (CESA) and the California Natural Community Conservation Planning Act (NCCPA). The BDCP “conservation plan” is also subject to environ-mental review under the National Environmental Policy Act and the California Environmental Quality Act. The BDCP draft plan includes alternatives for water flow and conveyance, habitat restoration and protection. The BDCP is a comprehensive, complex and very challenging plan-ning effort to develop and implement.
The economic benefits of the BDCP are numerous and significant, and can be categorized into four areas:
• Increasedwatersupplyreliability• RestorationoftheDeltaecosystem• Improvedwaterquality• ProtectionofwatersuppliesfromapotentialcatastrophiccollapseoftheDeltalevees from a combination of earthquakes, flooding and sea level rise
The water conveyance facility is expected to improve the reliability of deliveries from both the
Page 10 | SCWC / PFM
BDCP Economic Benefits and Financing Strategies
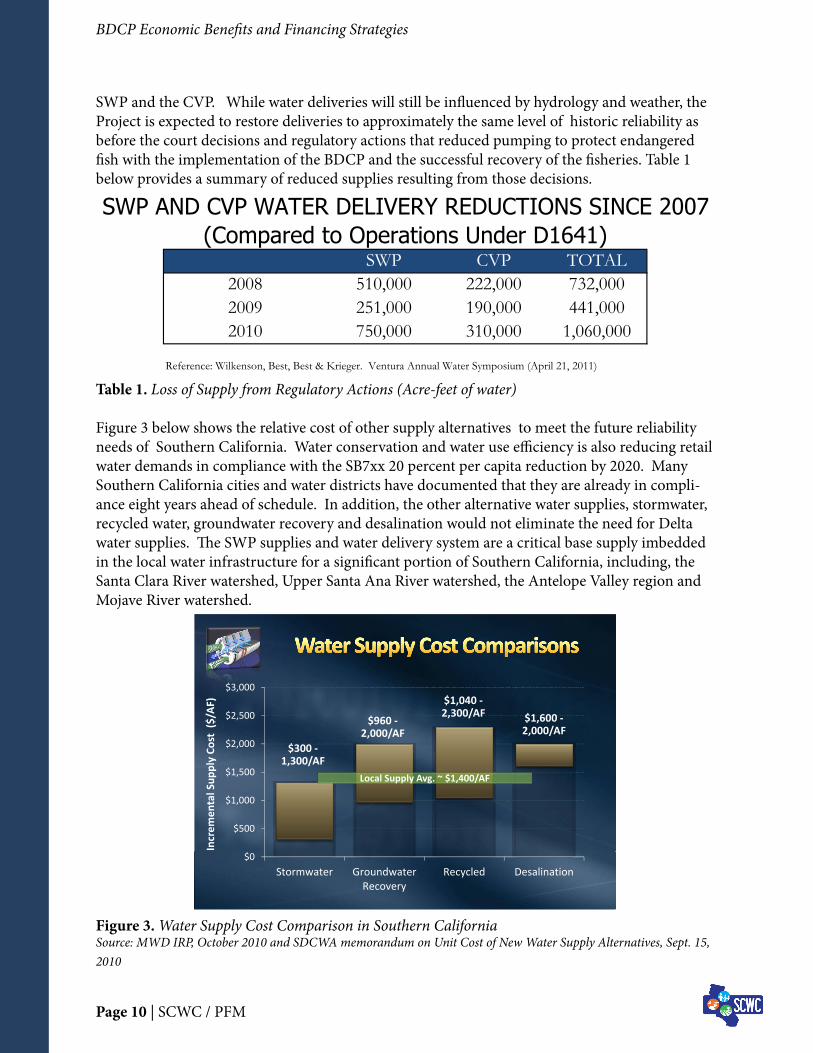
SWP and the CVP. While water deliveries will still be influenced by hydrology and weather, the Project is expected to restore deliveries to approximately the same level of historic reliability as before the court decisions and regulatory actions that reduced pumping to protect endangered fish with the implementation of the BDCP and the successful recovery of the fisheries. Table 1 below provides a summary of reduced supplies resulting from those decisions.
Table 1. Loss of Supply from Regulatory Actions (Acre-feet of water)
Figure 3 below shows the relative cost of other supply alternatives to meet the future reliability needs of Southern California. Water conservation and water use efficiency is also reducing retail water demands in compliance with the SB7xx 20 percent per capita reduction by 2020. Many Southern California cities and water districts have documented that they are already in compli-ance eight years ahead of schedule. In addition, the other alternative water supplies, stormwater, recycled water, groundwater recovery and desalination would not eliminate the need for Delta water supplies. The SWP supplies and water delivery system are a critical base supply imbedded in the local water infrastructure for a significant portion of Southern California, including, the Santa Clara River watershed, Upper Santa Ana River watershed, the Antelope Valley region and Mojave River watershed.
Figure 3. Water Supply Cost Comparison in Southern California Source: MWD IRP, October 2010 and SDCWA memorandum on Unit Cost of New Water Supply Alternatives, Sept. 15, 2010
$0
$500
$1,000
$1,500
$2,000
$2,500
$3,000
Stormwater GroundwaterRecovery
Recycled Desalination
Increm
ental Sup
ply Co
st ($/AF
)
$300 ‐1,300/AF
$960 ‐2,000/AF
$1,040 ‐2,300/AF $1,600 ‐
2,000/AF
7• MWD estimates
Local Supply Avg. ~ $1,400/AF
SWP AND CVP WATER DELIVERY REDUCTIONS SINCE 2007(Compared to Operations Under D1641)
SWP CVP TOTAL2008 510,000 222,000 732,0002009 251,000 190,000 441,0002010 750,000 310,000 1,060,000
Reference: Wilkenson, Best, Best & Krieger. Ventura Annual Water Symposium (April 21, 2011)

Page 11 | SCWC / PFM
BDCP Economic Benefits and Financing Strategies
The risks of relying long-term on the existing Delta levee system have been poorly understood until a series of geotechnical studies were completed, beginning in 2005, to quantify the risks of levee failure. Numerous Delta islands are at risk of inundation because decades-long agricultural practices have caused peat soils to oxidize and then cause the island soil elevations to subside to below the Delta water line. Many Delta islands have long-term risk of inundation due to levee failures caused by seismic events or floods with a greater risk of faiure if sea level increase in the future.
In a New York Times magazine article dated July 2011, UC Berkeley engineering Professor Robert Bea warned about the potential risks of failure of the Delta levees.1 Below, we explore the costs of catastrophic levee failure and the risks to Delta levee integrity associated with earthquakes, floods and sea level rise induced by climate change.
Levee failure in the Central Delta, the area that the DWR predicts is most vulnerable, would have several negative impacts, with immediate consequences and far reaching effects. Flooding of Delta islands would act as a vacuum, hydrologically drawing saltwater from the San Francisco Bay were the flooding to occur in the summer or fall months. Besides saltwater intrusion, the depth of the islands may create a sink for water contaminants from the San Joaquin and Sacra-mento Rivers, with significant impact on water quality. If multiple levee collapses would occur during low freshwater inflow into the Delta may result in the cessation of SWP/CVP pumping in the South Delta, as the higher saline water would not meet water quality standards. In addition, upstream SWP and CVP project supplies would be needed to repel the saltwater, further impact-ing freshwater supplies.
Multiple levee failures may also have profound ecological impacts, turning a saltwater and fresh-water estuarine system potentially into a saline inland sea. In addition, Delta agriculture would suffer profoundly, as inundated islands would be unsuitable for growing. Even if the levees were subsequently restored, the island soil would have been inundated with saltwater, which may be difficult to reverse. As a result, the long term impacts on the Delta ecology could be significant. Figure 4 shows the probability of a 6.5 magnitude earthquake in the Delta. As shown in the graphic, there is a 66% probability that a 6.5 magnitude quake will hit the Delta region by 2032 - or within the next 20 years (USGS Delta Seismic Risk Report, 2005).
1 Bea, Robert, California’s Next Nightmare, New York Magazine, Times July 2011

Page 12 | SCWC / PFM
BDCP Economic Benefits and Financing Strategies
Figure 4. Probability of Flooding Due to 6.5 or Greater Earthquake (USGS, 2005)
Further, other infrastructure improvements crossing the Delta would be damaged. Power lines, natural gas pipelines, railroads and state highways would be put at risk. The economic impacts of a 6.5 magnitude earthquake are large and have been estimated as follows:
• Deltaleveerepairsestimatedat$2billion• Residentialandbusinessimpactsifoutagelasts30monthsof$8to14billion• Economicoutputlossesof$12.8to36billion• Joblossesof65,000to230,0002
These risks are compounded by the impact of climate change. Climate change could result in sea level rise from two to six feet over the next century, increasing the probability of levee failure under flooding and normal tidal actions.
In addition, according to the Public Policy Institute of California (Managing California’s Water, February 2011), climate change models project up to 80% loss of Sierra snowpack by 2050. There has already been a trend toward less snow and greater runoff, increasing the frequency of floods and heightening the risk of levee failure. Less snowpack also increases the need for water supply reliability because of the loss of “nature’s reservoirs.”
2 Dave Sunding, Urban Losses from Earthquake-Induced Water Supply Disruption in the San Francisco Bay / Sacramento - San Joaquin Delta Estuary, Berkeley Economics Consulting, September 2011.

Page 13 | SCWC / PFM
BDCP Economic Benefits and Financing Strategies
Water Quality Benefits
The BDCP conveyance system would also provide improved water quality and economic benefits. Reducing salinity in Delta exports from approximately 250 mg/L to 100 mg/L has substantial eco-nomic benefits to Southern California.3 As shown in Figure 5, reducing salinity from 250 mg/L to 100 mg/L provides an economic benefit of approximately $200 million annually in 2011 dollars.
Figure 5: Benefits of Salinity Decrease
3 Metropolitan Water District /Bureau of Reclamation Salinity Management Study, Final Report June 1999; dollars escalated to 2011 using the Bureau of Labor Statistics inflation calculator.
Residential, $73
Commercial, $21Industrial, $10
Agricultural, $29
Utilities, $17
Groundwater, $31
Recycled Water, $10
Annual Benefits of 150 mg/L Salinity Decrease in Imported Water Supplies (in $ millions)

Page 14 | SCWC / PFM
BDCP Economic Benefits and Financing Strategies
These costs are expected to increase in the future because of the State Water Resources Control Board (SWRCB) Recycled Water Policy (March 2009) for maintaining long term salt balance. Groundwater replenishment with low salinity SWP supplies is preferred by groundwater basin agencies over the much saltier Colorado River supplies that range from 500 to 700 mg/L.
Improved drinking water quality is also a significant cost savings to the urban water utilities. Over the past 20 years urban water utilities from the San Francisco Bay Area and Southern Cali-fornia have collaborated through the California Urban Water Agencies (CUWA) to analyze the Delta source water supplies from a drinking water perspective. CUWA has published numerous technical reports and engaged nationally recognized experts to evaluate the Delta water quality and drinking water treatment technologies to meet drinking water regulations.
The most recent report, Drinking Water Treatment Evaluation, was published in April 2011 and is the basis for the cost estimates to comply with future drinking water regulations if Delta water quality is at various levels of bromide, trihalomethane (THM) and total organic carbon. Im-proved drinking water quality benefits would result primarily from reducing the bromide/THM formation potential in the Delta supplies, which has public health benefits and significant lower water filtration/treatment costs to all SWP/CVP urban contractors south of the Delta. According to the CUWA report the savings in operation and maintenance costs at water treatment plants could be in the range of $115 to $325 million a year.4 1 In addition, CUWA estimated that absent improvement in source water quality, it is projected that $3 to $8 billion worth of new capital improvements would need to be constructed to treat lower quality supplies. Figure 6 describes these drinking water quality issues including TDS, bromide, and THMs, as well as the impacts on treatment.
Figure 6: Drinking Water Quality Issues
4 California Urban Water Agencies Drinking Water Treatment Evaluation, April 2011 and further studies will evaluate the treatment requirements and cost impacts of future drinking water regulations.

Page 15 | SCWC / PFM
BDCP Economic Benefits and Financing Strategies
Direct Economic Benefits
In addition to the broader economic, ecological and societal benefits of improved conveyance, construction of the conveyance facility would in and of itself produce a positive economic im-pact, particularly given California’s currently depressed construction sector. The Brattle Group, an economic consulting firm, recently completed an analysis of the jobs that would be created by various BDCP conveyance alternatives. The paper, authored by Mark Berkman, David Sunding and Michelle Tran, employs conservative assumptions, looking at jobs created by the construction and operation of the Project. Analytically, the paper uses IMPLAN, an input-output model used by California Department of Finance, California Department of Transportation, DWR, SWRCB, Army Corps of Engineers, the Bureau of Economic Analysis, the Bureau of Land Management and the Bureau of Reclamation.
The model estimates that the larger 15,000 cfs tunnel creates 129,193 jobs, of which 13,938 jobs are direct, 75,689 jobs are indirect and 39,566 jobs are induced. The model estimates that the smaller tunnel option, 3,000 cfs, creates 78,875 jobs, of which 8,130 jobs are direct, 43,109 jobs are indirect and 22,636 jobs are induced. In addition, the model estimates 40,500 jobs would be cre-ated from the BDCP wetland mitigation and restoration program implementation activities.
The direct economic benefits described are a sampling of job gains from the BDCP Project imple-mentation as opposed to a more comprehensive review that would include an analysis of the broader economic factors affecting overall employment in the Delta. A recent report by the Pub-lic Policy Institute of California (“Transitions for the Delta Economy” January 2012) exemplifies a broader look at future economic shifts in the region. The PPIC report found a net gain of jobs for the Delta region long-term even though agricultural jobs are forecasted to decline. The increase in jobs is primarily from a forecasted increase in water related recreation activities. The long-term economic impacts of the Delta region from implementing the BDCP and the other actions (e.g., Delta Stewardship Council, Delta Protection Commission plans and policies) will require ad-ditional analyses and modeling studies. But future changes in the Delta economy and ecosystem over the next 50 years are inevitable.

Page 16 | SCWC / PFM
BDCP Economic Benefits and Financing Strategies
III. Financing the BDCP
The capital costs of the BDCP Project conveyance facilities are approximately $15 billion (DWR BDCP Technical Memorandum November 2010) with construction financing. This $15 billion cash flow estimate is used to forecast the revenue bond debt service and to include the impact of inflation on the current estimate of $13 billion for the most expensive Project alternative under evaluation. As shown in Figure 7, most of the capital costs are for the BDCP conveyance facilities. The annual operating costs for the 50-year period include all the four primary BDCP functions - habitat restoration, management of stressors, program oversight and water conveyance.
Figure 7. BDCP Capital and Operating Costs by Program Function (DWR, Nov. 2010) Funding for BDCP program implementation is anticipated to come from the following sources:
• Waterusers:thewaterconveyanceandassociatedenvironmentalmitigationwouldbeentirely paid by SWP and CVP contractors
• Othersources:fundingforecosystemhabitatrestoration,otherstressorsand program management have been discussed, but a definitive financing plan has not yet been finalized
Existing state and federal programs and voter-approved water bonds have significant funds avail-able to finance the early years of the ecosystem habitat restoration, other stressors and possibly the program management costs. Figure 8 on the next page is a summary of these existing funding sources.
$0$5,000
$10,000$15,000$20,000$25,000
$ M, m
idpo
int c
ost e
stim
ate
BDCP Capital and Operating Costs by Program Function
Operating Costs
Capital Costs

Page 17 | SCWC / PFM
BDCP Economic Benefits and Financing Strategies
Figure 8. Existing State and Federal Funding Sources
While this funding is uncertain given the long time horizon of a 50 year financing plan, the Water Bond of 2012 would cover most of the unfunded need for BDCP habitat restoration and stressor programs for the initial 10 to 20 years. The OCAP Biological Opinions already require ongoing monitoring and studies for predator control, non-physical fish barriers and floodplain habitat creation. DWR estimates about $700 million is thus already committed to these activities that overlap with BDCP. Even without the Water Bond, other funding sources, including annual fed-eral appropriations under the CALFED program (current annual appropriations of approximately $60 million), can be utilized for the initial BDCP restoration projects in the near term (5-7 years).
While the contracts described below and financing plan for the Project are still to be developed and negotiated, the following structure is utilized in the analyses of capital costs and subsequent cash flows associated with any debt financing. It is important to note that the assumptions re-garding ownership and operations are provided for completeness, and it is acknowledged that other ownership and operating structures are possible. But, with the exception of the very impor-tant consideration that the federal government will not own any of the Project, the remainder of the ownership and operating assumptions would not alter the financing impacts in any material way. In certain instances we include an acknowledgment of certain alternatives which, while cur-rently under consideration, are not part of the analyses.
The base case assumptions include the following:
a. A variety of different ownership structures are under consideration. These include one in which the DWR would own the share of the Project for the State Water Project Contractors and the federal contractors (through the San Luis & Delta-Mendota Water Authority or other public agency) would own their share of the Project. Direct Bureau ownership could raise significant control issues for the federal contractors, as well as issues with respect to tax exemption of both the state contractor and federal contractor debt. Other ownership structures include ownership by a joint powers agency or by another state department. As noted above, the important consideration for
$0
$100
$200
$300
$400
$500
$600
$700
$800
OCAP Biological Opinions Water Bonds (Prop 50, 84, 1E) Federal CALFED (annualappropriations)
$ M
Existing State and Federal Funding Sources

Page 18 | SCWC / PFM
BDCP Economic Benefits and Financing Strategies
financing analysis is that there is no federal ownership.
b. DWR has the legal authority to construct the Project; such construction would be in ac-cordance with an appropriate agreement with federal and state contractors to help ensure DWR’s performance would be on budget and on schedule. While alternative delivery methods (e.g., joint powers agency construction and financing) may be considered to take advantage of potential cost or schedule advantages, such an arrangement is not currently the base case being reviewed. Additional arrangements can be considered in the future.
c. For purposes of this financial analysis capital costs and operating costs (including power costs) of the Project would be paid by both the state and the federal contrac tors. The actual allocation of costs between the SWP and CVP is subject to future negotiations but the assumptions for this financial analysis are summarized below:
• 60percentofannualcost(debtservice,operatingcostsandpowercosts)ofthe Project would be paid by the state contractors on a budget basis.
• 40percentoftheannualcostoftheProjectwouldbepaidbythefederal contractors on a budget basis.
• Whileannualcostswouldbeinitiallyallocatedasdescribedonabudgetbasis,there would be a “true-up” at the end of each year based on actual deliveries. For purposes of this initial analysis, debt service would be allocated to the contrac-tors on the basis of the 60%/40% assumption. This true-up is consistent with the objective that all users pay the same unit cost on a dollar per acre-foot basis for the Project.
d. For cost allocation purposes, deliveries would include all deliveries south of the Delta, including exports that may not use the new Project conveyance facilities but are required under existing SWP and CVP legal agreements.
e. The state and federal contractors are currently exploring ways to minimize fluctuations of annual costs caused by variations in water deliveries between the state and federal systems as well as variations of deliveries among contractors within the state system and federal systems. The working assumption is that appropriate reserves or other policies would be put in place prior to commencement of operation to smooth such fluctuations.
f. SWP contracts would be extended on a long term basis (50+ years) prior to any construction financing to ensure that debt can be paid over a 40 or 50 year period, and state contractors have the ability to pass through debt service costs as they do today.
g. To the extent that financing would be done by two or more entities (e.g., DWR and a federal contractors joint powers agency), financing between the state and federal contractors would be coordinated to assure comparable financing schedules, amortization schedules, etc. This coordination would be done through development of a common
Page 19 | SCWC / PFM
BDCP Economic Benefits and Financing Strategies
“financing plan” or through the use of a joint powers agency to coordinate issuance of the state contractor and federal contractor debt. But, for purposes of the base case, it is assumed that there would be a coordinated plan of finance, with separate issues for the state contractors (e.g., through DWR) and the federal contractors (e.g., through a joint powers agency such as the San Luis Delta-Mendota Water Agency).
Debt Financing
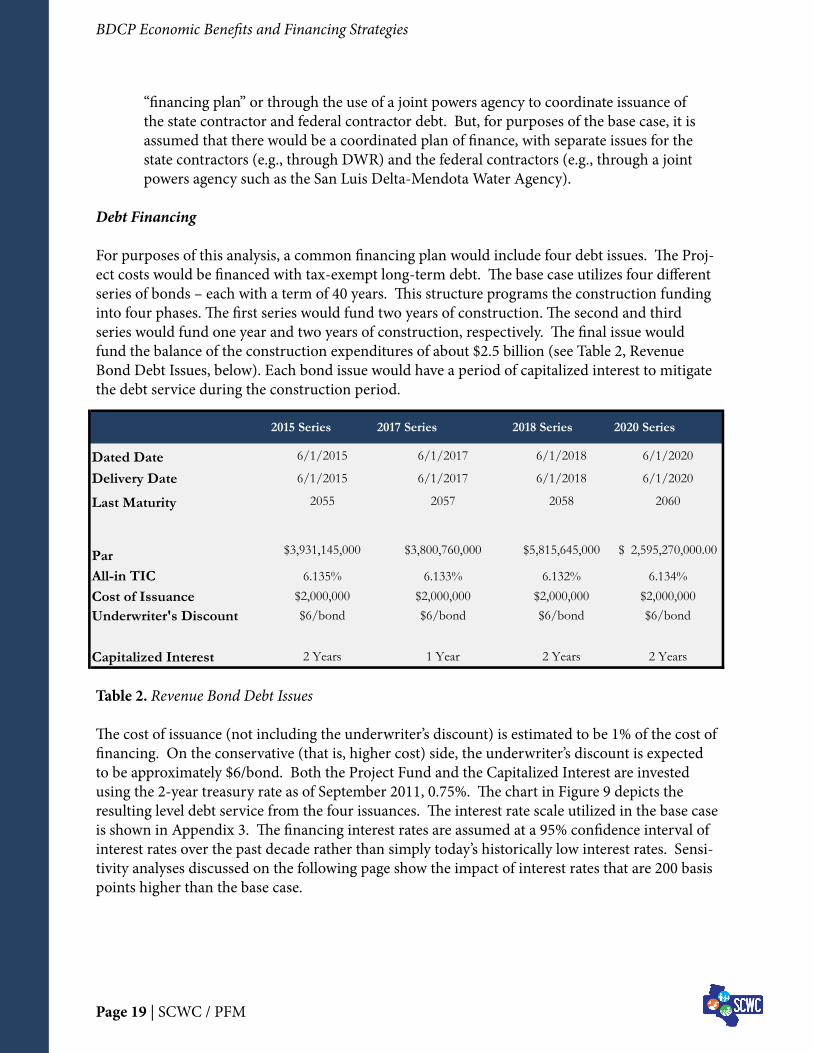
For purposes of this analysis, a common financing plan would include four debt issues. The Proj-ect costs would be financed with tax-exempt long-term debt. The base case utilizes four different series of bonds – each with a term of 40 years. This structure programs the construction funding into four phases. The first series would fund two years of construction. The second and third series would fund one year and two years of construction, respectively. The final issue would fund the balance of the construction expenditures of about $2.5 billion (see Table 2, Revenue Bond Debt Issues, below). Each bond issue would have a period of capitalized interest to mitigate the debt service during the construction period.
Table 2. Revenue Bond Debt Issues
The cost of issuance (not including the underwriter’s discount) is estimated to be 1% of the cost of financing. On the conservative (that is, higher cost) side, the underwriter’s discount is expected to be approximately $6/bond. Both the Project Fund and the Capitalized Interest are invested using the 2-year treasury rate as of September 2011, 0.75%. The chart in Figure 9 depicts the resulting level debt service from the four issuances. The interest rate scale utilized in the base case is shown in Appendix 3. The financing interest rates are assumed at a 95% confidence interval of interest rates over the past decade rather than simply today’s historically low interest rates. Sensi-tivity analyses discussed on the following page show the impact of interest rates that are 200 basis points higher than the base case.
2015 Series 2017 Series 2018 Series 2020 Series
Dated Date 6/1/2015 6/1/2017 6/1/2018 6/1/2020
Delivery Date 6/1/2015 6/1/2017 6/1/2018 6/1/2020
Last Maturity 2055 2057 2058 2060
Par $3,931,145,000 $3,800,760,000 $5,815,645,000 2,595,270,000.00$
All-in TIC 6.135% 6.133% 6.132% 6.134%Cost of Issuance $2,000,000 $2,000,000 $2,000,000 $2,000,000Underwriter's Discount $6/bond $6/bond $6/bond $6/bond
Capitalized Interest 2 Years 1 Year 2 Years 2 Years

Page 20 | SCWC / PFM
BDCP Economic Benefits and Financing Strategies
Table 3. Project Construction Cash Flow Schedules (based on BDCP Schedule in Figure 2, dollars in millions)
Table 3 below details construction cash flows used in this paper’s low construction cost, baseline and high construction cost scenarios. These characterizations are based on the American Society of Civil Engineers classification criteria for project definition. The low cost scenario is 20% below the baseline and the high cost scenario is 30% above baseline.
Note all scenarios assume costs inflate at 2% per year and that construction begins in 2015. For escalation purposes, 2011 is used as the base year. Construction is broken down into four phases to correspond with the four debt issues in our model.
Cashflows (2011 $)Phase I Phase II Phase III Phase IV Total
2015 2016 2017 2018 2019 2020 2021
Allocation 10% 15% 25% 25% 10% 10% 5% 100%Low (-20%) 1,016$ 1,524$ 2,540$ 2,540$ 1,016$ 1,016$ 508$ 10,160$Baseline 1,270$ 1,905$ 3,175$ 3,175$ 1,270$ 1,270$ 635$ 12,700$High (+30%) 1,651$ 2,477$ 4,128$ 4,128$ 1,651$ 1,651$ 826$ 16,512$
Low Inflated 1,100$ 1,683$ 2,860$ 2,918$ 1,190$ 1,214$ 619$ 11,584$Baseline Inflated 1,375$ 2,103$ 3,576$ 3,647$ 1,488$ 1,518$ 774$ 14,481$High Inflated 1,787$ 2,734$ 4,648$ 4,741$ 1,934$ 1,973$ 1,006$ 18,823$

Page 21 | SCWC / PFM
BDCP Economic Benefits and Financing Strategies
Figure 9. Aggregate BDCP Debt Service
As shown in Figure 9, using the financing assumptions detailed above, the annual debt service would average approximately $1.1 billion from 2021 through 2055. These annual debt service costs would be collected over deliveries that are expected to be equal to the median delivery of 5.9 million acre-feet per year. As a result, the cost of debt service would be about $186 per acre-foot (AF).
In order to assess the financial burden of these projects on the contractors, the costs on a per acre-foot, per capita and per acre basis are summarized in Table 5. Of the 29 State Water Project contractors, the Metropolitan Water District of Southern California, Kern County Water Agency, Antelope Valley-East Kern Water Authority, Coachella Valley Water Agency, Tulare Lake Basin Water District, San Bernardino Municipal Water District, Mojave Water Agency, Castaic Lake Water Agency, Alameda County Water District, Zone 7 Water Agency, Palmdale Water District, Desert Water Agency and Central Coast Water Authority are examined. These agencies account for approximately 91.2% of the State Water Project Table A contract amounts.
$0
$200
$400
$600
$800
$1,000
$1,200
2016 2021 2026 2031 2036 2041 2046 2051 2056
$ in Millions Total Debt Service
Level Debt: $1.1 Billion
2015 Series 2017 Series 2018 Series 2020 Series

Page 22 | SCWC / PFM
BDCP Economic Benefits and Financing Strategies
Figure 10. Baseline Costs with Operations and Maintenance Expenses
As previously noted, the cost of debt service on the project is estimated to be about $186/AF. However, this is only one way to evaluate the cost, as many agencies pass on the cost to landown-ers via property taxes. As seen in Table 4, the resulting debt service costs for the major state con-tractors would range from 0.0052 % of assessed valuation in Santa Clara Valley Water District’s service area to about 0.20% in Kern County.
Table 4. Debt Service as a Percent of Assessed Valuation for Selected State Water Project Contractors
Tables 5, 6 and 7 detail debt service payments under the three construction scenarios. As men-tioned above, we have used capital cost estimation guidelines developed by the American Society of Civil Engineers to develop the three construction scenarios.
2025 MidpointDebt Service
PMTAssessed Valuation Ratio
Metropolitan Water District of Southern California $303,687,956 $2,049,000,000,000 0.0148%
Kern County Water Agency $156,130,403 $78,441,000,000 0.1990%
Coachella Valley Water District $21,980,240 $54,433,000,000 0.0404%
Castaic Lake Water Agency $15,124,820 $33,339,000,000 0.0454%
SBVMWD $16,300,489 $25,584,000,000 0.0637%Mojave Water Agency $13,154,780 $35,211,000,000 0.0374%Santa Clara Valley Water District $15,887,416 $303,346,820,000 0.0052%
$‐
$50.00
$100.00
$150.00
$200.00
$250.00
2016 2020 2024 2028 2032 2036 2040 2044 2048 2052
$/Acre‐Fo
otBaseline Costs with O&M Expenses
Baseline Construction Estimate
Baseline Construction + O&M
Page 23 | SCWC / PFM
BDCP Economic Benefits and Financing Strategies
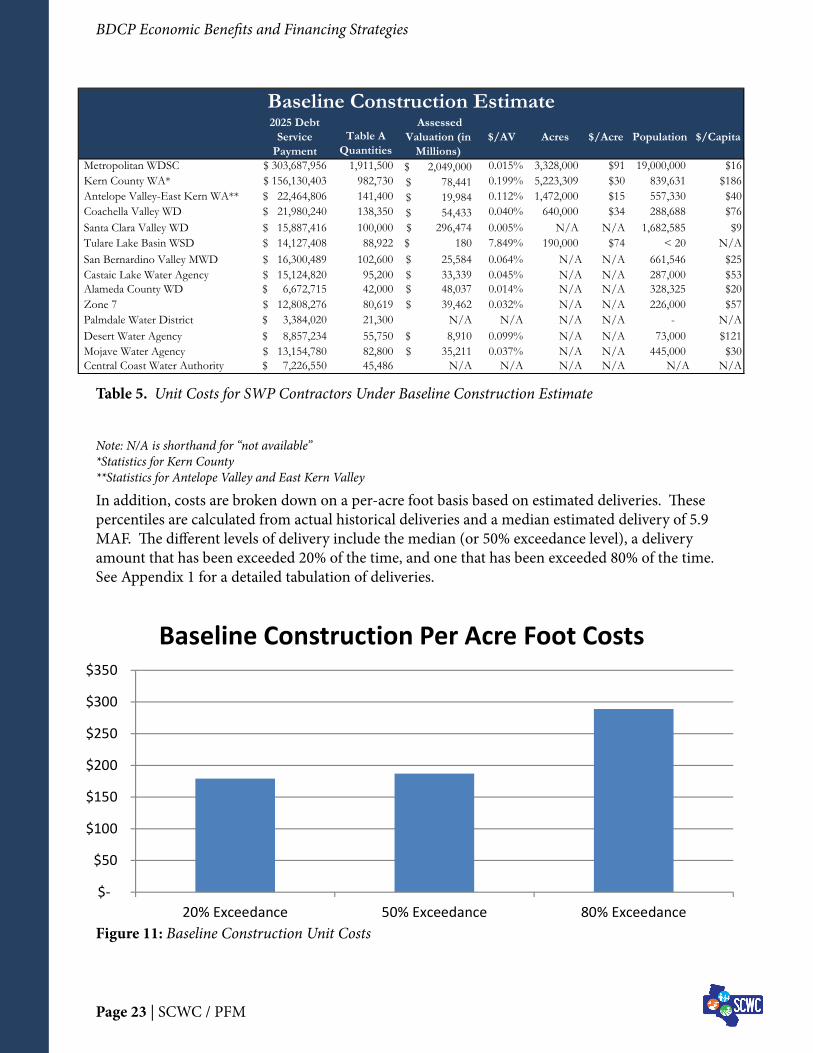
In addition, costs are broken down on a per-acre foot basis based on estimated deliveries. These percentiles are calculated from actual historical deliveries and a median estimated delivery of 5.9 MAF. The different levels of delivery include the median (or 50% exceedance level), a delivery amount that has been exceeded 20% of the time, and one that has been exceeded 80% of the time. See Appendix 1 for a detailed tabulation of deliveries.
Note: N/A is shorthand for “not available”*Statistics for Kern County**Statistics for Antelope Valley and East Kern Valley
$‐
$50
$100
$150
$200
$250
$300
$350
20% Exceedance 50% Exceedance 80% Exceedance
Baseline Construction Per Acre Foot Costs
Table 5. Unit Costs for SWP Contractors Under Baseline Construction Estimate
Figure 11: Baseline Construction Unit Costs
Baseline Construction Estimate2025 Debt
Service Payment
Table A Quantities
Assessed Valuation (in
Millions) $/AV Acres $/Acre Population $/Capita
Metropolitan WDSC 303,687,956$ 1,911,500 2,049,000$ 0.015% 3,328,000 $91 19,000,000 $16Kern County WA* 156,130,403$ 982,730 78,441$ 0.199% 5,223,309 $30 839,631 $186Antelope Valley-East Kern WA** 22,464,806$ 141,400 19,984$ 0.112% 1,472,000 $15 557,330 $40Coachella Valley WD 21,980,240$ 138,350 54,433$ 0.040% 640,000 $34 288,688 $76Santa Clara Valley WD 15,887,416$ 100,000 296,474$ 0.005% N/A N/A 1,682,585 $9Tulare Lake Basin WSD 14,127,408$ 88,922 180$ 7.849% 190,000 $74 < 20 N/ASan Bernardino Valley MWD 16,300,489$ 102,600 25,584$ 0.064% N/A N/A 661,546 $25Castaic Lake Water Agency 15,124,820$ 95,200 33,339$ 0.045% N/A N/A 287,000 $53Alameda County WD 6,672,715$ 42,000 48,037$ 0.014% N/A N/A 328,325 $20Zone 7 12,808,276$ 80,619 39,462$ 0.032% N/A N/A 226,000 $57Palmdale Water District 3,384,020$ 21,300 N/A N/A N/A N/A - N/ADesert Water Agency 8,857,234$ 55,750 8,910$ 0.099% N/A N/A 73,000 $121Mojave Water Agency 13,154,780$ 82,800 35,211$ 0.037% N/A N/A 445,000 $30Central Coast Water Authority 7,226,550$ 45,486 N/A N/A N/A N/A N/A N/A
Page 24 | SCWC / PFM
BDCP Economic Benefits and Financing Strategies
*Statistics for Kern County**Statistics for Antelope Valley and East Kern Valley
$‐
$50
$100
$150
$200
$250
20% Exceedance 50% Exceedance 80% Exceedance
Low Construction Per Acre Foot Costs
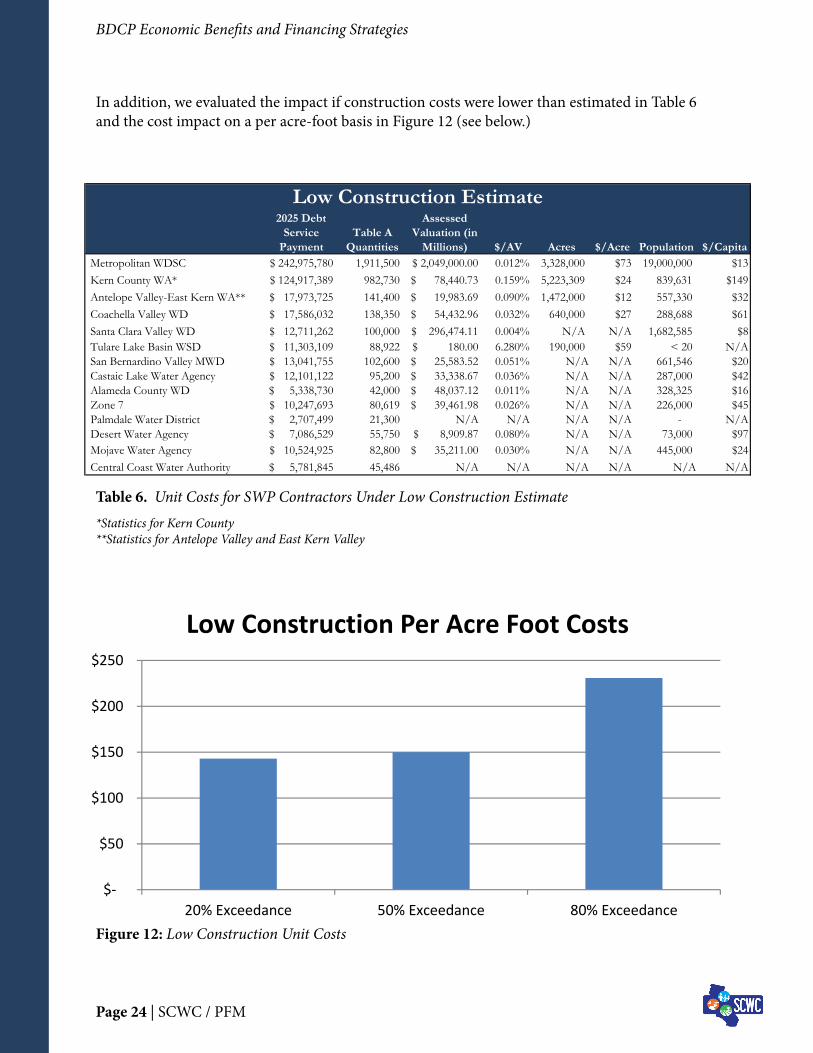
Table 6. Unit Costs for SWP Contractors Under Low Construction Estimate
Figure 12: Low Construction Unit Costs
In addition, we evaluated the impact if construction costs were lower than estimated in Table 6 and the cost impact on a per acre-foot basis in Figure 12 (see below.)
Low Construction Estimate2025 Debt
Service Payment
Table A Quantities
Assessed Valuation (in
Millions) $/AV Acres $/Acre Population $/CapitaMetropolitan WDSC 242,975,780$ 1,911,500 2,049,000.00$ 0.012% 3,328,000 $73 19,000,000 $13Kern County WA* 124,917,389$ 982,730 78,440.73$ 0.159% 5,223,309 $24 839,631 $149Antelope Valley-East Kern WA** 17,973,725$ 141,400 19,983.69$ 0.090% 1,472,000 $12 557,330 $32Coachella Valley WD 17,586,032$ 138,350 54,432.96$ 0.032% 640,000 $27 288,688 $61Santa Clara Valley WD 12,711,262$ 100,000 296,474.11$ 0.004% N/A N/A 1,682,585 $8Tulare Lake Basin WSD 11,303,109$ 88,922 180.00$ 6.280% 190,000 $59 < 20 N/ASan Bernardino Valley MWD 13,041,755$ 102,600 25,583.52$ 0.051% N/A N/A 661,546 $20Castaic Lake Water Agency 12,101,122$ 95,200 33,338.67$ 0.036% N/A N/A 287,000 $42Alameda County WD 5,338,730$ 42,000 48,037.12$ 0.011% N/A N/A 328,325 $16Zone 7 10,247,693$ 80,619 39,461.98$ 0.026% N/A N/A 226,000 $45Palmdale Water District 2,707,499$ 21,300 N/A N/A N/A N/A - N/ADesert Water Agency 7,086,529$ 55,750 8,909.87$ 0.080% N/A N/A 73,000 $97Mojave Water Agency 10,524,925$ 82,800 35,211.00$ 0.030% N/A N/A 445,000 $24Central Coast Water Authority 5,781,845$ 45,486 N/A N/A N/A N/A N/A N/A

Page 25 | SCWC / PFM
BDCP Economic Benefits and Financing Strategies
$‐
$50
$100
$150
$200
$250
$300
$350
$400
20% Exceedance 50% Exceedance 80% Exceedance
High Construction Per Acre Foot Costs
Table 7. Unit Costs for SWP Contractors Under High Construction Estimate
Figure 13: High Construction Unit Costs
Finally, we looked at the high construction cost estimates to see the impact on unit costs. As shown in Table 7, the unit cost rises for each SWP contractor and Figure 13 indicates that the unit cost rises to just over $350/AF under this “worst case” scenario.
*Statistics for Kern County**Statistics for Antelope Valley and East Kern Valley
High Construction Estimate2025 Debt
Service Payment
Table A Quantities
Assessed Valuation (in
Millions) $/AV Acres $/Acre Population $/Capita
Metropolitan WDSC 394,756,419$ 1,911,500 2,049,000$ 0.019% 3,328,000 $119 19,000,000 $21Kern County WA* 202,950,026$ 982,730 78,441$ 0.259% 5,223,309 $39 839,631 $242Antelope Valley-East Kern WA** 29,201,443$ 141,400 19,984$ 0.146% 1,472,000 $20 557,330 $52Coachella Valley WD 28,571,567$ 138,350 54,433$ 0.052% 640,000 $45 288,688 $99Santa Clara Valley WD 20,651,657$ 100,000 296,474$ 0.007% N/A N/A 1,682,585 $9Tulare Lake Basin WSD 18,363,866$ 88,922 180$ 10.202% 190,000 $74 < 20 N/ASan Bernardino Valley MWD 21,188,600$ 102,600 25,584$ 0.083% N/A N/A 661,546 $25Castaic Lake Water Agency 19,660,377$ 95,200 33,339$ 0.059% N/A N/A 287,000 $69Alameda County WD 8,673,696$ 42,000 48,037$ 0.018% N/A N/A 328,325 $26Zone 7 16,649,159$ 80,619 39,462$ 0.042% N/A N/A 226,000 $74Palmdale Water District 4,398,803$ 21,300 N/A N/A N/A N/A - N/ADesert Water Agency 11,513,299$ 55,750 8,910$ 0.129% N/A N/A 73,000 $158Mojave Water Agency 17,099,572$ 82,800 35,211$ 0.049% N/A N/A 445,000 $38Central Coast Water Authority 9,393,613$ 45,486 N/A N/A N/A N/A N/A N/A
Page 26 | SCWC / PFM
BDCP Economic Benefits and Financing Strategies
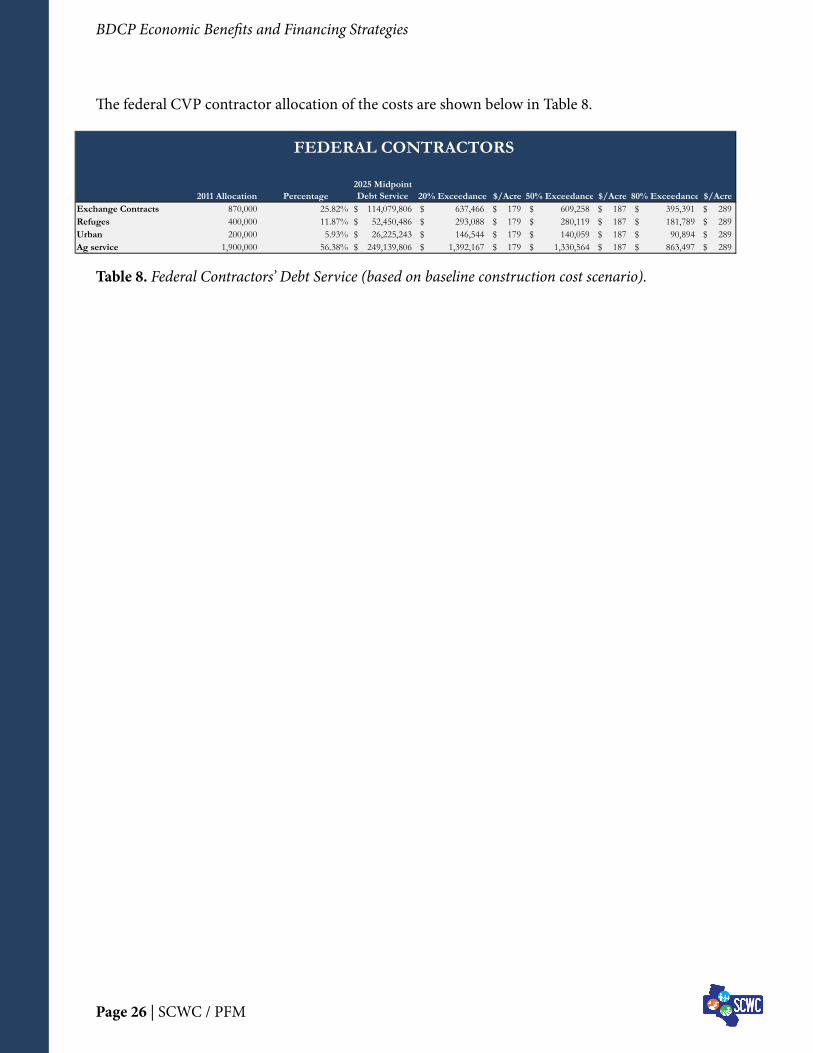
The federal CVP contractor allocation of the costs are shown below in Table 8.
Table 8. Federal Contractors’ Debt Service (based on baseline construction cost scenario).
FEDERAL CONTRACTORS
2011 Allocation Percentage2025 Midpoint Debt Service 20% Exceedance $/Acre 50% Exceedance $/Acre 80% Exceedance $/Acre
Exchange Contracts 870,000 25.82% 114,079,806$ 637,466$ 179$ 609,258$ 187$ 395,391$ 289$ Refuges 400,000 11.87% 52,450,486$ 293,088$ 179$ 280,119$ 187$ 181,789$ 289$ Urban 200,000 5.93% 26,225,243$ 146,544$ 179$ 140,059$ 187$ 90,894$ 289$ Ag service 1,900,000 56.38% 249,139,806$ 1,392,167$ 179$ 1,330,564$ 187$ 863,497$ 289$
Page 27 | SCWC / PFM
BDCP Economic Benefits and Financing Strategies
IV. Financial Cost Comparison to Other California Water Infrastructure Projects
The BDCP capital costs have been suggested by some critics as very expensive and possibly unaf-fordable. During the past 20 years, comparable water infrastructure projects have been completed throughout California, primarily for urban areas. These water infrastructure projects were devel-oped for the following key purposes:
• Upgradeagingwaterinfrastructurebasedonseismicgeotechnicalandstructural engineering needs (earthquake risks)• Emergencystorage• Droughtstorageandsupplementalsupplies
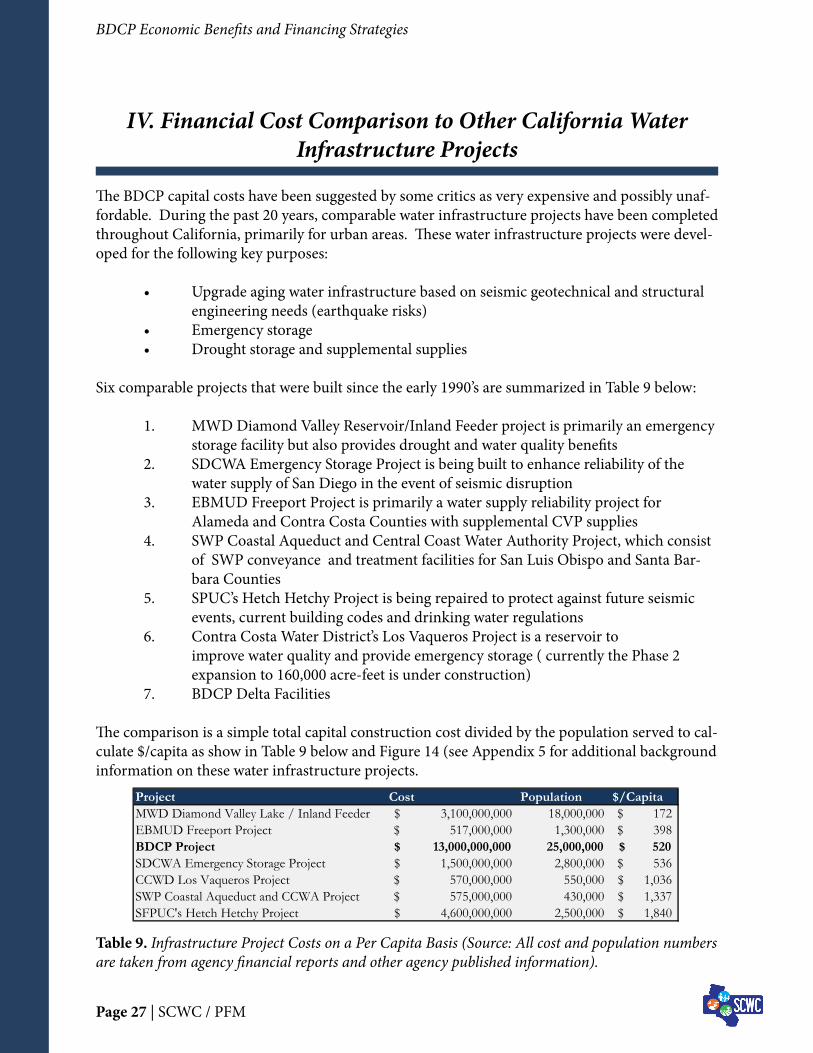
Six comparable projects that were built since the early 1990’s are summarized in Table 9 below:
1. MWD Diamond Valley Reservoir/Inland Feeder project is primarily an emergency storage facility but also provides drought and water quality benefits2. SDCWA Emergency Storage Project is being built to enhance reliability of the water supply of San Diego in the event of seismic disruption3. EBMUD Freeport Project is primarily a water supply reliability project for Alameda and Contra Costa Counties with supplemental CVP supplies4. SWP Coastal Aqueduct and Central Coast Water Authority Project, which consist
of SWP conveyance and treatment facilities for San Luis Obispo and Santa Bar-bara Counties
5. SPUC’s Hetch Hetchy Project is being repaired to protect against future seismic events, current building codes and drinking water regulations6. Contra Costa Water District’s Los Vaqueros Project is a reservoir to improve water quality and provide emergency storage ( currently the Phase 2 expansion to 160,000 acre-feet is under construction)7. BDCP Delta Facilities
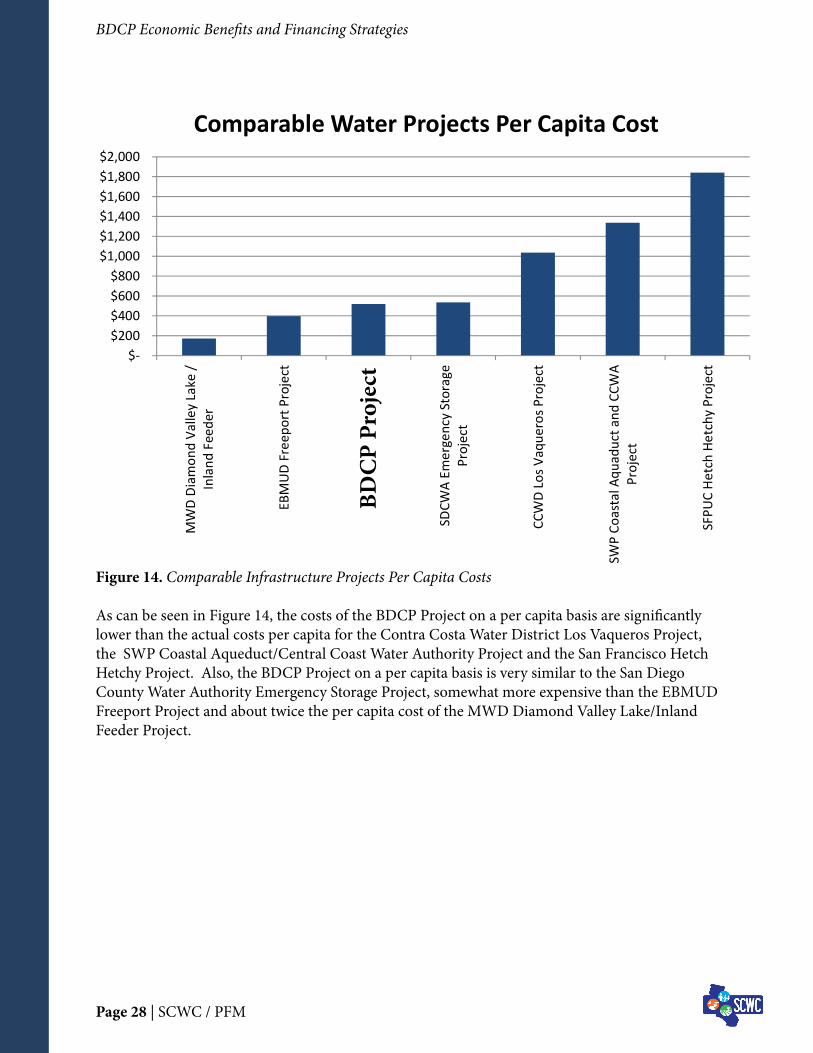
The comparison is a simple total capital construction cost divided by the population served to cal-culate $/capita as show in Table 9 below and Figure 14 (see Appendix 5 for additional background information on these water infrastructure projects.
Table 9. Infrastructure Project Costs on a Per Capita Basis (Source: All cost and population numbers are taken from agency financial reports and other agency published information).
Project Cost Population $/CapitaMWD Diamond Valley Lake / Inland Feeder 3,100,000,000$ 18,000,000 172$ EBMUD Freeport Project 517,000,000$ 1,300,000 398$ BDCP Project 13,000,000,000$ 25,000,000 520$ SDCWA Emergency Storage Project 1,500,000,000$ 2,800,000 536$ CCWD Los Vaqueros Project 570,000,000$ 550,000 1,036$ SWP Coastal Aqueduct and CCWA Project 575,000,000$ 430,000 1,337$ SFPUC's Hetch Hetchy Project 4,600,000,000$ 2,500,000 1,840$
Page 28 | SCWC / PFM
BDCP Economic Benefits and Financing Strategies
$‐ $200 $400 $600 $800
$1,000 $1,200 $1,400 $1,600 $1,800 $2,000
MWD Diam
ond Va
lley Lake /
Inland
Feede
r
EBMUD Freepo
rt Project
SDCW
A Em
ergency Storage
Project
CCWD Los V
aque
ros P
roject
SWP Co
astal A
quaduct a
nd CCW
AProject
SFPU
C He
tch He
tchy
Project
Comparable Water Projects Per Capita Cost
Figure 14. Comparable Infrastructure Projects Per Capita Costs
As can be seen in Figure 14, the costs of the BDCP Project on a per capita basis are significantly lower than the actual costs per capita for the Contra Costa Water District Los Vaqueros Project, the SWP Coastal Aqueduct/Central Coast Water Authority Project and the San Francisco Hetch Hetchy Project. Also, the BDCP Project on a per capita basis is very similar to the San Diego County Water Authority Emergency Storage Project, somewhat more expensive than the EBMUD Freeport Project and about twice the per capita cost of the MWD Diamond Valley Lake/Inland Feeder Project.
BDC
P Pr
ojec
t

Page 29 | SCWC / PFM
BDCP Economic Benefits and Financing Strategies
V. Conclusion
“It was a fundamental concept of the 1933 Central Valley Project Act (California Legislature) and the Burns-Porter Act that the areas which benefit from the water supplies made available and the power generated by system facilities should repay the full allocated costs, including interest, incurred in providing those services.”51
—The Burns-Porter Act: A California High Water Mark
The BDCP facility construction and implementation is a very large undertaking. Construction will take a decade or more and is projected to cost about $13 billion (2011 dollars). This would be a very large public works project. But is it too big or too expensive? By historical standards the original Central Valley Project as proposed and adopted by the State of California and the Colo-rado River Aqueduct during the Great Depression and the State Water Project (voter approval in 1960) were financially more challenging projects to implement based on the financial burden to their customers. In addition, the Burns-Porter Act passage in 1960 demonstrated that one of the largest revenue supported bonds globally could be approved by the voters and be repaid by the SWP contractors.
The questions of affordability and financial feasibility were common concerns throughout the development of the SWP during the 1950’s and the 1960’s. Furthermore, in the early 1970’s the construction of certain SWP facilities, including the planned Delta facility, were deferred and delayed because of budget and revenue shortfalls during Governor Ronald Reagan’s tenure.
During the past 20 years, many urban water supply reliability and emergency storage type proj-ects have been built that on a per capita basis were significantly more expensive to the customers. Therefore, based on this comparison of the relative urban per capita cost, the BDCP financing primarily through water supply beneficiaries (the SWP and the CVP water customers) is finan-cially feasible.
As the PPIC report “Managing California’s Water” (February 2011) documented, we have a water crisis facing the State with threats of:
• Extinctionanddeclineofnativespecies• Catastrophicfloods• Waterscarcity• Deterioratingwaterquality• DeclineoftheSacramento-SanJoaquinDeltaenvironment
As a result, the PPIC team highlighted in its conclusion of Managing California’s Water that “...without bold action, California will be subjected to a succession of protracted water crises.”
5 The Burns-Porter Act: A California High Water Mark, by Harvey O. Banks and Jean O. Williams, 1984.

Page 30 | SCWC / PFM
BDCP Economic Benefits and Financing Strategies
The economic benefits of the BDCP project implementation are significant:
• Restored water supply reliability through achievement of co-equal goals by implementing the BDCP, which would avoid potential loss of Delta supplies from environmental regula-tions. From 2008 to 2010, regulatory actions and court orders reduced SWP and CVP supplies by over two million acre-feet.
• Drinking water quality improvements, including a significant reduction in salinity con-centrations, and cost savings in drinking water treatments costs from reduced levels of bromides from seawater intrusion and lower total organic carbon (TOC) from in Delta watershed sources.
• Protecting against natural disasters. The future probability of earthquakes, flooding and sea level rise all have the likelihood of causing a catastrophic collapse of some of the Delta levees and flooding of the islands with seawater. Saltwater intrusion could cause an interruption of SWP/CVP exports from one to three years which would have significant impact on the California economy.
• Economic stimulus and job creation. Building public works projects is a long-standing policy of the federal government and a testament to the legacy of Californian investments in water infrastructure.
“Another huge issue we must tackle is water. Last week, Secretary of the Interior, Ken Salazar - met here in Sacramento with those in my administration who are working to complete the Bay Delta Conservation Plan. Together we agreed that by this summer we should have the basic elements of the project we need to build. This is something my father worked on and then I worked on-decades ago. We know more now and are committed to the dual goals of restoring the Delta ecosystem and ensur-ing a reliable water supply.
This is an enormous project. It will ensure water for 25 million Californians and for millions of acres of farmland as well a hundred thousand acres of new habitat for spawning fish and other wildlife. To get it done will require time, political will and countless permits from state and federal agencies. I invite your collaboration and constructive engagement.”62 —Governor Edmund G. Brown Jr.
Funding for the preparation of this paper provided by: Castaic Lake Water Agency, Coachella Valley Water District, Mojave Water Agency, The Metropolitan Water District of Southern Califor-nia, and San Bernardino Valley Municipal Water District.
6 2012 State of the State Address January 18, 2012

Page 31 | SCWC / PFM
BDCP Economic Benefits and Financing Strategies
Appendix 1-BDCP Water Delivery Assumptions
SWP exceedance allocations provide a range of probabilities based on historic hydrology (1922 to current) of the amount of SWP deliveries with the new BDCP facilities and assumptions on permit conditions.
In the event that MWD is hypothetically responsible for half the total project cost, MWD’s per capita debt service burden would be $29.07. In this scenario, MWD would be responsible for
$‐
$5
$10
$15
$20
$25
$30
$35
Baseline BDCP Project Share 50% Project Cost
MWD Per Capita Debt Service Cost
Table A Quantities Total Share of State Contractor Cost
20% Exceedance (Acre-Feet)
50% Exceedance (Acre-Feet)
80% Exceedance (Acre-Feet)
Metropolitan WDSC 1,911,500 45.82% 1,696,977 1,621,885 1,052,556 Kern County WA 982,730 23.55% 872,440 833,835 541,134 Antelope Valley-East Kern WA 141,400 3.39% 125,531 119,976 77,861 Coachella Valley WD 138,350 3.32% 122,823 117,388 76,182 Santa Clara Valley WD 100,000 2.40% 88,777 84,849 55,064 Tulare Lake Basin WSD 88,922 2.13% 78,942 75,449 48,964 San Bernardino Valley MWD 102,600 2.46% 91,085 87,055 56,496 Castaic Lake Water Agency 95,200 2.28% 84,503 80,763 52,413 Alameda County WD 42,000 1.01% 37,281 35,631 23,123 Zone 7 80,619 1.93% 71,560 68,393 44,385 Palmdale Water District 21,300 0.51% 18,907 18,070 11,727 Desert Water Agency 55,750 1.34% 49,485 47,296 30,694
Mojave Water Agency 82,800 1.98% 73,496 70,244 45,586 Central Coast Water Authority 45,486 1.09% 40,375 38,588 25,043

Page 32 | SCWC / PFM
BDCP Economic Benefits and Financing Strategies
To evaluate the sensitivity of this model, we looked at how a 200 basis point increase, a three year construction delay and omitting capitalized interest would impact our model.
A 200 basis point (i.e., 2%) increase would raise level debt service to $1.44 billion, an increase of 31% over the baseline scenario. The unit cost would increase to $245/AF.
Appendix 2-BDCP Financial Sensitivity Analysis
$0
$50
$100
$150
$200
$250
$300
2016 2021 2026 2031 2036 2041 2046 2051
$/Acre‐Fo
ot
200 BP Increase raises baseline $/Acre‐Foot costs to $245
$0
$500
$1,000
$1,500
2016 2021 2026 2031 2036 2041 2046 2051 2056
$ in Millions Total Debt Service (200 bp increase)
Level Debt: $1.44 Billion
2015 Series 2017 Series 2018 Series 2020 Series

Page 33 | SCWC / PFM
BDCP Economic Benefits and Financing Strategies
Omitting capitalized interest from this paper’s financing model would lower debt service pay-ments by roughly 12 percent. The unit cost decreases to $167 per AF.
A three year construction delay would increase the level debt service to $1.27 billion, an increase of 15 percent. Note this increase is driven by construction cost inflation. Cash flows for this sce-nario are detailed on the next page:
$0$20$40$60$80$100$120$140$160$180
2016 2020 2024 2028 2032 2036 2040 2044 2048 2052
$/AF
Debt Service falls to $167/AF without Capitalized Interest
$0$200$400$600$800$1,000$1,200$1,400
2016 2021 2026 2031 2036 2041 2046 2051 2056 2061
$ in Millions Scenario: 3 Year Delay
Level Debt: $1.27 Billion
2015 Series 2017 Series 2019 Series 2022 Series

Page 34 | SCWC / PFM
BDCP Economic Benefits and Financing Strategies
Thre
e Ye
ar D
elay
Cas
hflo
ws
(201
1 $)
Phas
e I
Phas
e II
Phas
e III
Phas
e IV
Tota
l20
1520
1620
1720
1820
1920
2020
2120
2220
2320
24
Allo
catio
n10
%15
%15
%15
%10
%10
%10
%10
%5%
5%10
0%Lo
w (-
20%
) 1,
016
$
1,52
4$
1,
524
$
1,52
4$
1,
016
$
1,01
6$
1,
016
$
1,01
6$
50
8$
508
$
10
,668
$M
idpo
int
1,27
0$
1,
905
$
1,90
5$
1,
905
$
1,27
0$
1,
270
$
1,27
0$
1,
270
$
635
$
63
5$
13,3
35$
Hig
h (+
30%
)1,
651
$
2,47
7$
2,
477
$
2,47
7$
1,
651
$
1,65
1$
1,
651
$
1,65
1$
82
6$
826
$
17
,336
$
Low
Infla
ted
1,10
0$
1,
683
$
1,71
6$
1,
751
$
1,19
0$
1,
214
$
1,23
9$
1,
263
$
644
$
65
7$
12,4
57$
Mid
Infla
ted
1,37
5$
2,
103
$
2,14
5$
2,
188
$
1,48
8$
1,
518
$
1,54
8$
1,
579
$
805
$
82
1$
15,5
71$
Hig
h In
flate
d1,
787
$
2,73
4$
2,
789
$
2,84
5$
1,
934
$
1,97
3$
2,
013
$
2,05
3$
1,
047
$
1,06
8$
20
,243
$

Page 35 | SCWC / PFM
BDCP Economic Benefits and Financing Strategies
Interest Rate: 1.96 standard deviations above historical average since 1997 (95% confidence inter-val)
Appendix 3-Revenue Bond Interest Rate Scale

Page 36 | SCWC / PFM
BDCP Economic Benefits and Financing Strategies
Appendix 4-Historical Comparisons
The Colorado River Aqueduct
On September 29, 1931, the citizens of the MWD service area voted by a 5:1 margin to issue $220 million of bonds for the purpose of financing the construction of the Colorado River Aqueduct (CRA). As a comparison, Hoover Dam, which was built concurrently by the famous “Six Com-panies” and funded by the federal government, cost roughly $80 million.
The federal government played an interesting role in both the CRA and Hoover Dam projects. California Senator Hiram Johnson and Representative Phil Swing repeatedly introduced legisla-tion to authorize what would become Hoover Dam, but other legislators argued the huge expense was not justified considering most of the benefit would flow to California. After the 1927 Missis-sippi flood, Southern and Midwestern representatives were more sympathetic and on December 21, 1928, President Calvin Coolidge signed legislation authorizing the dam.
These projects were built during the Great Depression just two years after Black Friday in 1929 when the stock market crashed. At the time of the election, it was understood that the bonds would need to be financed through the federal government. The municipal bond market had totally collapsed by early 1932, and MWD could not issue bonds in the public market.
The State of California also wanted to build the Central Valley Project (CVP) planned by State Engineer Edward Hyatt and endorsed by the California Legislature in 1933 at a cost of $170 mil-lion. Water revenues were supposed to pay for the CVP bonds, but with the Great Depression getting progressively worse in 1933, California leaders did not even attempt to issue municipal bonds and instead sought federal assistance. Ultimately, Congress authorized the Bureau of Rec-lamation and the Army Corps of Engineers to build the original California Central Valley Project planned facilities. The actual costs of completing these initial phases of the Central Valley Project exceeded $500 million (early 1950s).
The Hoover Administration agreed to have the Reconstruction Finance Administration purchase MWD bonds initially at an interest rate of 5% and then lowered it to 4.16% in 1938. Later, follow-ing the Congressional termination of the Reconstruction Finance Administration, a new federal agency called the Public Works Administration funded the MWD bonds.
Key Statistics• LosAngeles+OrangeCounties=~2millionpeople• MWD:13citiesweretheoriginalmemberagencies• CRAconstructionfinancedbya$220millionbondbythefederalgovernment• Assessedvalueofserviceareain1931:$1.827billion• CRAProject=~12percentoftotalpropertyassessedvalueofservicearea(13cities)
References: 1939 MWD Annual Report and The Great Thirst by Norris Hundley, 1992

Page 37 | SCWC / PFM
BDCP Economic Benefits and Financing Strategies
State Water Project
After the Second World War, the California economy experienced a second “Gold Rush” and mil-lions flocked to the Golden State, lured by the promise of a better climate and plentiful jobs. In 1945, the state authorized an investigation into statewide water resources to ascertain how to best meet this increased demand.
After intense negotiations in the late 1950’s, the Burns-Porter Act passed in 1960 by the slim mar-gin of 173,944 votes out of 5.9 million cast. This authorized the state to issue bonds to finance the construction of the SWP.
About 78 percent of the costs of constructing the SWP have been financed by the sale of general obligation and revenue bonds. These bonds are repaid in full by SWP beneficiaries, rather than the general taxpayer.
The State Water Project contractors are responsible for all water supply related costs, including operating and maintaining SWP facilities. Each of the 29 contractors pays the same per acre-foot rate for the cost of constructing and operating facilities that store and convey the SWP water sup-ply. Supplementary to that amount, each contractor pays a transportation charge to cover the cost of facilities needed to convey water to its service area. Contractors more distant from the Delta pay more than those close to the Delta because of the capital cost of the Aqueduct and increased pumping costs.
Key Statistics• PopulationServed:25,000,000(1960)• Scope:34storagefacilities,reservoirsandlakes;20pumpingplants;4pumping-generating plants; 5 hydroelectric power plants; and about 701 miles of open canals and pipelines.• Assessedvalueofserviceareain1960:$6billion• $1.75billionbond,whichwasoneofthelargest(worldwide)waterrevenuesupported bond financings in the early 1960’s• MWDshare(approximatelyhalf)=$875million• SWPshare=~15percentoftheassessedvalueofMWDserviceareain1960

Page 38 | SCWC / PFM
BDCP Economic Benefits and Financing Strategies
Appendix 5-A Comparison of Contemporary Water Infrastruc-ture Investment Costs
San Diego County Water Authority Emergency Storage Project
Background
The Emergency Storage Project is being built to enhance water supply reliability for the San Diego region from potential seismic disruptions to the imported water delivery system by increasing the amount of water stored locally within San Diego County Water Authority’s service area. Histori-cally, 80 to 90 percent of San Diego County Water Authority’s water supplies are imported deliv-eries from Northern California or the Colorado River.
Once fully completed, the Emergency Storage Project will add 90,100 acre-feet of water stor-age for emergency use. The last phase, scheduled to be completed in 2014, is the raising of San Vicente Dam to increase local surface storage and connect Lake Hodges to the SDCWA imported water delivery system.
The project consists of four main facilities: the Olivenhain Dam/Reservoir, Lake Hodges Pipeline and Pump Station, San Vicente Pipeline and Pump Station and the San Vicente Dam Raise. In addition, SDCWA is addressing the environmental impacts of constructing the Emergency Stor-age Project by creating new wetlands, restoring habitat at project sites and preserving sensitive habitat at other locations.
The project capital costs are approximately $1.5 billion.
Key Statistics
• 318-foot-talldamadding18,100acre-feetofemergencywaterstorageatthe Olivenhain Reservoir (completed 2003) and an additional 117 feet added to San Vicente Dam providing 52,000 acre-feet of water stored for emergency use• VariouspipelinesandpumpstationsconnectingOlivenhainReservoir,LakeHodgesand San Vicente Reservoir to the Authority’s imported distribution system

Page 39 | SCWC / PFM
BDCP Economic Benefits and Financing Strategies
State Water Project (SWP) Coastal Aqueduct and Central Coast Water Authority (CCWA) Project
Background
The Coastal Aqueduct extension conveys the SWP water to San Luis Obispo and Santa Barbara Counties, which have a combined 47,816 AF of project capacity (although their combined SWP contracts amounts are 70,486 AF). The CCWA facilities consist of a pipeline extension through Santa Barbara County and a regional water treatment plant.
When the CCWA Board of Directors approved construction of the 42-mile CCWA pipeline, it included a number of conditions. One condition was to require each of the CCWA project participants in Santa Barbara County to commit that its SWP contract amount allotment will be used first to offset its proportionate share of groundwater overdraft, and then to improve water quality for its consumers, before utilizing the supplies for new development.
Key Statistics
• PhaseI,anabovegroundaqueducttotaling15milesfromwhereitbranchesfrom the California Aqueduct, was completed in 1968• Constructedfrom1994to1997,PhaseIIconsistsof101milesofa42–57inchdiameter
buried pipeline extending from the Devils Den Pump Plant to Tank 5 on Vandenberg Air Force Base in Santa Barbara County
• TheCentralCoastWaterAuthority(CCWA)extension,completedin1997,isa 30–39 inch diameter pipeline that travels 42 miles from Vandenberg Air Force Base to Lake Cachuma in the Los Padres National Forest
Page 40 | SCWC / PFM
BDCP Economic Benefits and Financing Strategies
East Bay Municipal Utility District (EBMUD) Freeport Regional Water Project
Background
EBMUD serves 1.3 million customers in Alameda and Contra Costa Counties. Originally the Bu-reau of Reclamation had started the Folsom South Canal from Folsom Reservoir on the American River to deliver CVP supplies under its contract with EBMUD. With the Sacramento County/EB-MUD agreement, the Freeport Regional Water Project diverts the CVP supplies on the American River just upstream of the confluence with the Sacramento River.
Construction was completed in 2010, and the facility began operations in February 2011. EB-MUD’s existing Mokelumne River water supply is adequate to meet the needs of its 1.3 million customers during wet and normal years, but during droughts its customers may have cutbacks up to 50 percent. The Freeport Regional Water Project can deliver up to 10 million gallons per day during droughts to avoid theses customer cutbacks.
The Freeport Regional Project is projected to provide a supplemental water supply of up to 85 million gallons of water a day for Sacramento, and provide reliability far into the future. By using surface water from the Freeport Project, the Sacramento County Water Agency will protect its fragile groundwater basin from depletion. The Freeport Regional Water Project is projected to ultimately serve more than 300,000 customers in central Sacramento County.
The SCWA’s share of the costs are approximately $386 million and EBMUD’s share of the costs are approximately $517 million.
Key Statistics
• A185mgdwaterintakestructureandpumpingplantontheSacramentoRivernorth of Freeport• Alargediameterpipelinetotransportwatereastwardfromtheintaketoanew SCWA water treatment plant and to the existing Folsom South Canal• AwatertreatmentplantincentralSacramentoCountytotreatthewaterfor municipal use by SCWA customers• Twopumpingplantsandalargediameterpipelinetotransportwaterfromthe southern end of the Folsom South Canal to EBMUD’s Mokelumne Aqueducts

Page 41 | SCWC / PFM
BDCP Economic Benefits and Financing Strategies
San Francisco Public Utilities Commission (SFPUC) Hetch Hetchy Seismic Upgrade Project
Background
San Francisco’s Hetch Hetchy water system, completed in 1934, is a 167-mile, gravity-driven net-work of dams, reservoirs, tunnels, pump stations, aqueducts and pipelines that collects Tuolumne River runoff on federal land near the Yosemite Valley and conveys it to the San Francisco Bay Area. The SFPUC manages and operates the Hetch Hetchy system. The SFPUC on average deliv-ers about 260 million gallons of water per day (mgd) to retail customers in San Francisco, and to 29 wholesale buyers – cities, water districts, a public utility and other institutions – that supply communities in San Mateo, Santa Clara and Alameda Counties. In all, SFPUC delivers water to a customer base of some 2.4 million people in the region. The system also generates about 1.6 bil-lion kilowatt hours of clean, hydroelectric power annually for the City and County of San Fran-cisco’s municipal tenants and retail customers.
Hetch Hetchy’s major dam, reservoir, pipeline, tunnel and pump station components are all at least nearly 50 years old, and many are 60 to 80 years old. Key structural assessments, mainte-nance and upgrades have been deferred for decades. Major components have no bypass capabil-ity in the event of failure. Hetch Hetchy crosses at least five active earthquake faults. Facilities located near these points of intersection are at risk of failure in the event of a major earthquake, an event considered likely in the next 30 years.
In 2002, San Francisco voters approved a $1.6 billion bond measure to pay for their share of re-pairs to the aging system. It will be paid back over time with increases in water rates. Proposition A was approved by San Francisco voters 54% to 46%.
Key Statistics
• HetchHetchyRegionalWaterSystemservesapproximately2.5millionresidentsinsouth-ern Alameda, Santa Clara, San Mateo and San Francisco Counties.
• SanFranciscoownstheHetchHetchyfacilitiesbutabouttwo-thirdsofthesupplyisdeliv-ered annually to the other residents outside of San Francisco.
• Annualdeliveriesareapproximately260milliongallonsperdaythrough280milesofpipelines, over 60 tunnels, 5 pump stations, 11 reservoirs and two water treatment plants.
• UpgradeoftheHetchHetchyRegionalWaterSystemwastomeetcurrentseismic,build-ing and health code requirements.

Page 42 | SCWC / PFM
BDCP Economic Benefits and Financing Strategies
Metropolitan Water District (MWD) Diamond Valley Lake/Inland Feeder
Background
Built to expand storage capacity, Diamond Valley Lake almost doubles Southern California’s surface storage. The facility helps secure six months emergency water supply southwest of the San Andreas fault. In addition, it reduces the threat of water shortages during droughts and periods of peak summer use. The project cost roughly $1.9 billion to construct.
The Inland Feeder consists of nearly 44 miles of tunnels and pipeline designed to improve water quality and reliability for Southern Californians. The water project will store large volumes of water when available from Northern California and the Colorado River (indirectly) and local groundwater basins for use during dry periods and emergencies. The project also will improve the quality of the Southland’s drinking water by allowing more uniform blending of better quality water with Colorado River supplies, which have a higher mineral content. The project cost $1.2 billion to construct.
Together, the projects have helped minimize the environmental impact of water exports on the Bay Delta by smoothing deliveries. In addition, as part of environmental mitigation for the con-struction of the Inland Feeder, MWD added more than 875 acres to existing holdings of mitiga-tion habitat in the San Bernardino Mountains.
Key Statistics
• 810,000acre-feetornearly264billiongallonscapacity• Area:4,500surfaceacres;4.5mileslong,morethan2mileswide;150to250feetdeep• DamconstructionbeganSeptember1995andwascompletedDecember1999• DonOwenDam:Earth/rock-fill-construction,280feethigh,1.9mileslong• EastDam:Earth/rock-fill-construction,180feethigh,2.2mileslong• BeganpumpingwaterintoDiamondValleyLakeonNovember8,1999

Page 43 | SCWC / PFM
BDCP Economic Benefits and Financing Strategies
Contra Costa Water District (CCWD) Los Vaqueros Reservoir
Though Contra Costa County is adjacent to the Sacramento/San Joaquin Delta, the quality of that water has been a concern since the area was first settled in the 1870’s because of the influence of seawater intrusion into the Delta from the San Francisco Bay. Concerns about rising salinity from the San Francisco Bay is one of the reasons the Contra Costa Water District was formed in 1936.
Though the District pumped most of its water from Delta locations upstream near Oakley, salin-ity continued to be a problem. During the drought in 1977 – the driest year on record in Cali-fornia – salinity levels exceeded public health limits and water was rationed by CCWD and other Northern California water districts.
CCWD considered a number of alternative solutions, and in 1988 voters approved funding of the $450 million Los Vaqueros Reservoir project. The measure passed with 68 percent of the vote. After years of design, construction began in 1994.
In addition to building the $61 million 192 foot tall dam, the District:• Built12.8milesofVascoRoadaroundthewatershedatacostof$27million• Relocated20electricaltowersand12milesofgasline• Builtanew$20million,10,000horsepowerpumpingplantonOldRivernearDiscovery Bay• Constructedanew$12milliontransferstationwith8,000horsepowerpumps• Built20milesofsixtoeightfootdiameterburiedpipelineconnectingallthenewfacilities
with CCWD’s existing canal system in Antioch• Securednearly20,000acresoflandforthedamandthewatershed
CCWD also made a commitment to preserving the environment and respecting Native American and other historical sites in the watershed.
In 1997, most of the major construction was completed. The dam is made of 3 million cubic yards of tightly compacted fill.
CCVD began to fill the reservoir in February of 1998. Because of the very wet water year and the availability of high quality water, it was filled by January 1999, a year ahead of schedule.CCWD began construction of the expansion of Los Vaqueros in early 2001. The expanded proj-ect increases the reservoir capacity from 100,000 acre-feet to 160,000 acre-feet at a cost of ap-proximately $120 million.