BD5303: Monitoring the effects of Environmental...
38
BD5303: Monitoring the effects of Environmental Stewardship on Landscape Character and Quality Developing a method for reporting and monitoring the direct and cumulative impacts of Environmental Stewardship on the maintenance and enhancement of Landscape Character and Quality 4. Report of Findings: Counterfactuals Prepared by LUC and Fabis Consulting June 2013
Transcript of BD5303: Monitoring the effects of Environmental...

BD5303: Monitoring the effects of Environmental Stewardship on Landscape Character and Quality
Developing a method for reporting and monitoring the direct and cumulative impacts of Environmental Stewardship on the maintenance and enhancement of Landscape Character and Quality
4. Report of Findings: Counterfactuals
Prepared by LUC and Fabis Consulting
June 2013

BD5303: Monitoring the effects of Environmental Stewardship on Landscape Character and Quality: Report 4
Project Title: BD5303: Monitoring the Effects of Environmental Stewardship on Landscape Character and Quality
Client: Defra. Managed by Natural England
Acknowledgements
The study (BD5303) was commissioned and funded by Defra and overseen by Natural England. We are particularly grateful to the Officers that have guided us through this study: From Defra: Richard Brand-Hardy ERG-WAC, Mark Baylis ELM, and David Devaney ERG-SOIL; and from Natural England the Project Officers: Gill Travis, Victoria Hunns, Sarah Manning and Andrew Baker who have provided detailed advice and guidance over the three years of the study. We are also very grateful to our Steering Group for their helpful advice made up of representatives from Defra and Natural England (as above) and officers of English Heritage: Jeremy Lake, Vince Holyoake and Amanda Chadburn.
This study has been led and managed by Lyndis Cole Principal of LUC with Robert Deane, Sally Parker, Helen Cooper, Diana Manson, and Will Cookson of LUC; Julie Martin of Julie Martin Associates; Jonathan Porter, Jemma Brookes and Laura Jagota of Countryscape; Roy Haines-Young of Fabis Consulting; and Professor Carys Swanwick of Sheffield University.
Version Date Version Details Prepared by Checked by Approved by
Principal
0.1 20.4.2013 First draft of meta analysis
findings
Roy Haines-
Young
LC LC
V1 5.6.2013 First full draft R H-Y, Lyndis
Cole
LC LC
V1.1 29.6.2013 Incorporating comments
received
LC LC LC
V2 30.6.2013 Final Report Roy Haines-
Young and
Lyndis Cole
Maria Grant Lyndis Cole

BD5303: Monitoring the effects of Environmental Stewardship on Landscape Character and Quality: Report 4
BD5303: Monitoring the effects of Environmental
Stewardship on Landscape Character and Quality
Developing a method for reporting and monitoring the direct and cumulative
impacts of Environmental Stewardship on the maintenance and enhancement
of Landscape Character and Quality
4. Report of Findings: Counterfactuals
Prepared by LUC and Fabis Consulting
June 2013
Planning & EIA Design Landscape Planning Landscape Management Ecology Mapping & Visualisation
LUC BRISTOL 14 Great George Street Bristol BS1 5RH Tel:0117 929 1997 Fax:0117 929 1998 [email protected]
Offices also in: London Glasgow Edinburgh
FS 566056
EMS 566057
Land Use Consultants Ltd Registered in England Registered number: 2549296 Registered Office: 43 Chalton Street London NW1 1JD
LUC uses 100% recycled paper

BD5303: Monitoring the effects of Environmental Stewardship on Landscape Character and Quality: Report 4
Contents
1 Introduction 1 BD5303 Research Study 1 This report 1 Structure of this report 2
2 Collection of base data to inform the counterfactuals 3
3 The Counterfactual Analysis and its Outcomes 6
4 Supplementary commentary on counterfactual results based on field work observations 18 Conclusions 20
Appendix 1: Assessing the Impact of Landscape Interventions: The Role of Counterfactuals 24
BD5303: Monitoring the effects of Environmental Stewardship on Landscape Character and Quality: Report 4
BD5303: Monitoring the Effects of Environmental Stewardship on Landscape Character and Quality
Full set of Final Reports
1 Methodology Report
Appendix 1: Updating the NCA key characteristics
Appendix 2: Spreadsheet of ES options
Appendix 3: Selection criteria for the choice of sample NCAs
Appendix 4: Evolution of field survey method
Appendix 5: Field Survey pro-formas
Appendix 6: Description of features
Appendix 7: Condition monitoring
(Separate report) Appendix 8: Review of Alternative Monitoring Approaches
2. Report of Findings: Landscape Effects of Environmental Stewardship at the Study Area Level Appendix 1: Summary of the landscape effects of all ES options surveyed
(Separate report) Appendix 2: Contribution of ES to Landscape Maintenance and
Enhancement:
3. Report of Findings: Landscape Effects of Environmental Stewardship at the
National Character Area and Agricultural Landscape Type Levels
Appendix 1: Assessment of the 18 NCAs
Appendix 2: Master table of objectives
Appendix 3: Selection of ES options relating to each objective and linked indicator
Appendix 4: ES Hedgerow management and restoration uptake per NCA
Appendix 5: ES low input grassland option uptake per NCA
Appendix 6: Total number of trees under ES in-field tree protection options per NCA
Appendix 7: ES historic environment options uptake per NCA
Appendix 8: The assessment of the six ALTs
Appendix 9: ES Area Options: Top 20 options by area of uptake
Appendix 10: ES Linear Options: Top 10 options by length of uptake
Appendix 11: ES Area Options: Top 20 option bundles by area of uptake
Appendix 12: ES Linear Options: Top 10 option bundles by length of uptake
4. Report of Findings: Counterfactuals Appendix 1: Alternative methodologies considered
5. Report of Findings: Public Engagement Report
6. Synthesis Overview: Summary of Findings and Conclusions Appendix 1: Rapid field survey approach
Appendix 2: Assessing Environmental Stewardship effects at Strategic Level
Appendix 3: Bespoke approach to assessing ES landscape effects.
Appendix 4: Methodology for public engagement to inform ES monitoring
7. Executive Summary: Briefing Paper

BD5303: Monitoring the effects of Environmental Stewardship on Landscape Character and Quality: Report 4
Environmental Stewardship
Environmental Stewardship is an agri-environment scheme that provides funding to farmers and other land managers in England to deliver effective environmental management on your land.
There are four elements to Environmental Stewardship:
Entry Level Stewardship (ELS) is open to all farmers and provides a straightforward approach to supporting the good stewardship of the countryside. This is done through simple land management that goes beyond the Single Payment Scheme requirement to maintain land in good agricultural and environmental condition. It is open to all farmers and landowners. ELS Agreements last for five years.
Organic Entry Level Stewardship (OELS) is the organic strand of ELS. It is geared to organic and organic/conventional mixed farming systems and is open to all farmers not receiving Organic Farming Scheme aid.
Uplands Entry Level Stewardship (Uplands ELS) was launched in February 2010 to support hill farmers with payments for environmental management. This strand of Environmental Stewardship succeeds the Hill Farm Allowance. It is open to all farmers with land in Severely Disadvantaged Areas, regardless of the size of the holding. UELS Agreements last for five years.
Higher Level Stewardship (HLS) Negotiated with farmers in target areas or, outside of those areas, using target themes. These agreements involve more complex types of management and agreements are tailored to local circumstances. HLS applications will be assessed against specific local targets and agreements will be offered where they meet these targets and represent good value for money. HLS Agreements last for 10 years (or longer for some options).
Relationship between ELS and HLS agreements There is an expectation that HLS applicants will already be in an (Upland) ELS or (Upland) OELS agreement or that they will join (Upland) ELS/OELS at the time of making an HLS application. This is because ELS, OELS and HLS have been designed to complement each other. In the cases where an HLS applicant already has an (Upland) ELS or OELS agreement, they are required to re-apply for these options when they make their HLS application. This is to ensure that the different elements of ES are combined in the most effective way. Natural England then provides a joint ELS/HLS, Uplands ELS/HLS, OELS/HLS or Uplands OELS/HLS agreement. Very occasionally there will be sites for which (Uplands) ELS or (Uplands) OELS options are not available, such as coastal and inter-tidal habitats and lowland heathland. In these cases an HLS-only agreement may be appropriate.

BD5303: Monitoring the effects of Environmental Stewardship on Landscape Character and Quality: Report 4
BD5303: Monitoring the effects of Environmental Stewardship on Landscape Character and Quality 1
1 Introduction
BD5303 Research Study
1.1 This three year Research and Development Study (reviewed after the first year) has been funded by Defra and run by Natural England. It responds to a long term concern that monitoring of agri-environment schemes has frequently failed to capture fully the landscape effects of these schemes, both positive and negative, and has failed to capture their cumulative effects on the landscape over time.
1.2 The stated aim of this study has been “to develop and test a robust, repeatable and comprehensive evaluation framework for reporting and monitoring the direct and cumulative impacts of Environmental Stewardship ((O)ELS & (O)HLS) on the maintenance and enhancement of landscape character and quality at a variety of scales”. This has used a series of quantitative and qualitative techniques that taken together:
Measure the impact of ES on the maintenance and enhancement of landscape character and quality/condition, allowing judgement to be made on the degree to which the ES landscape objective has been met;
Assess counterfactuals that compare landscape effects with and without ES (the net effect of ES) and the landscape effects of ES compared to the Classic agri-environment schemes;’
Evaluate the cumulative impact of ES (and the options within it) on landscape character and quality/condition;
Define lessons learned from the targeting and operation of ES that can be applied to landscape character and quality in the next agri-environment programme;
Be able to report at a range of appropriate scales and link in with existing landscape monitoring and research projects;
Be consistent with the European Landscape Convention.”
This report
1.3 This report describes the approach developed for assessing Counterfactuals and is the fourth in a series of Reports of Findings that bring together the different aspects of the BD5303 Research and Development Study. The full set of reports is itemised at the front of this report.
1.4 The counterfactual modelling has been undertaken by Professor Roy Haines-Young of Fabis Consulting, with LUC supplying the digital analysis of field survey data on which the modelling has been based.
1.5 The specific aspect of the brief being addressed by this work is the stated aim to:
‘Assess counterfactuals that compare landscape effects with and without ES (the net effect of ES) and the landscape effects of ES compared to the Classic agri-environment schemes;’

BD5303: Monitoring the effects of Environmental Stewardship on Landscape Character and Quality: Report 4
BD5303: Monitoring the effects of Environmental Stewardship on Landscape Character and Quality 2
1.6 This has been expanded in the brief by Objective 4 that requires:
The evaluation of counterfactual scenarios that can identify: the effect of ES on landscape
character and condition; and the effect of large scale coverage versus scattered locations,
through a comparison of:
areas which are under (O)ELS management only
areas which are under (O)ELS & (O)HLS management
areas which are under (O)HLS management only
areas which have never had any management under AES
areas which have been under Classic schemes (ESA and CSS).
1.7 As the study has evolved these comparisons have been captured in four hypotheses that reflected the nature of the data that has been collected in the field and requirements identified by the Steering Group. These hypotheses are:
Hypothesis 1: Features covered by agri-environment scheme options (ES options or
past and current classic scheme options) are in better condition than those that are not.
Hypothesis 2: Features under current agri-environment scheme options (ES and
current classic scheme options that were still running at the time of survey) are in better
condition than those that are not.
Hypothesis 3: There is a difference between land covered by one of the classic
schemes (ESAs and the Countryside Stewardship Scheme – still active at the time of
survey) and land under ES option.
Hypothesis 4: Features under continuous management (under an agri-environment
scheme) are in better condition than those more recently included in the (ES) scheme.
1.8 The issue of large scale coverage versus scattered locations has been considered both as part of the field survey work and the assessment at the National Character Area level and Agricultural landscape Types level.
1.9 At the start of this element of work a series of Counterfactual approaches were reviewed and their suitability for assessing issues posed by agri-environment schemes was considered in terms of their applicability to the issues posed by the brief and the nature of data that was being collected through the study. This review of counterfactual approaches is provided in Appendix 1.
Structure of this report
1.10 This report describes the approach developed to assess the counterfactual hypotheses and other field survey findings that inform these findings. It:
Describes the approach to collecting the data that has formed the basis of the Counterfactual modelling.
Describes the method and results of the Counterfactual meta-analysis.
Provides supplementary commentary on these results based on separate (qualitative) field work observations.
BD5303: Monitoring the effects of Environmental Stewardship on Landscape Character and Quality: Report 4
BD5303: Monitoring the effects of Environmental Stewardship on Landscape Character and Quality 3
2 Collection of base data to inform the counterfactuals
Using data form the BD5303 field survey
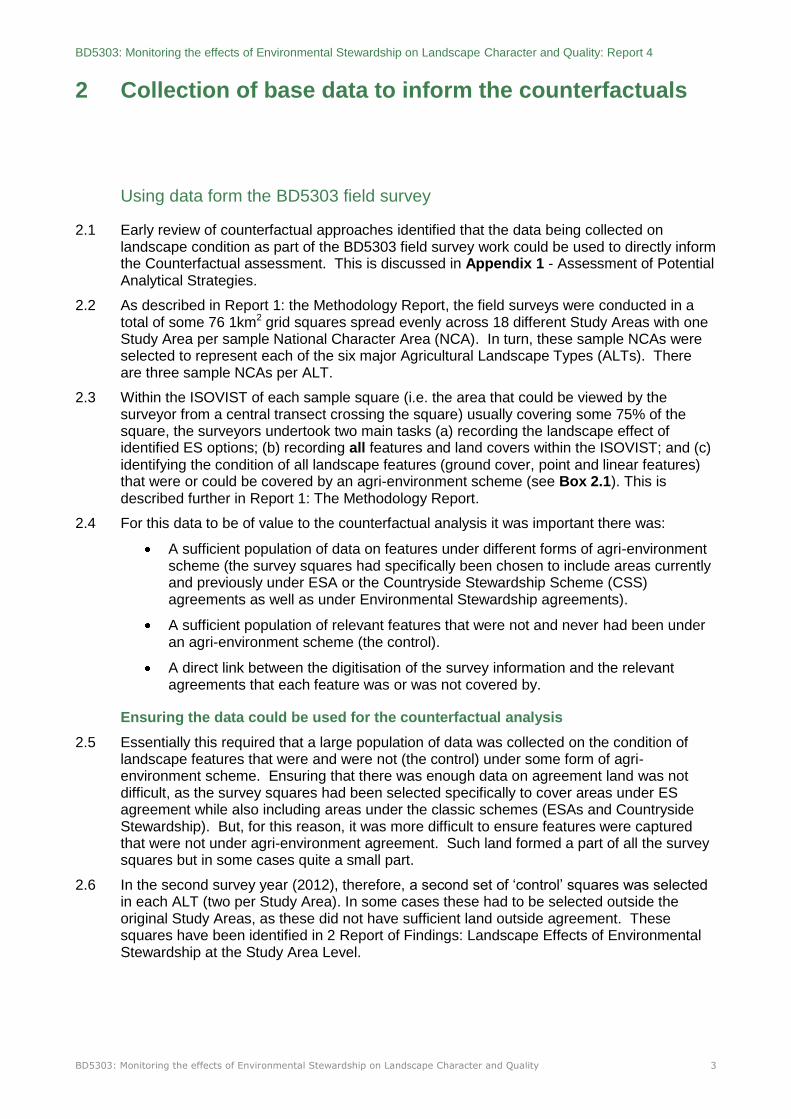
2.1 Early review of counterfactual approaches identified that the data being collected on landscape condition as part of the BD5303 field survey work could be used to directly inform the Counterfactual assessment. This is discussed in Appendix 1 - Assessment of Potential Analytical Strategies.
2.2 As described in Report 1: the Methodology Report, the field surveys were conducted in a total of some 76 1km2 grid squares spread evenly across 18 different Study Areas with one Study Area per sample National Character Area (NCA). In turn, these sample NCAs were selected to represent each of the six major Agricultural Landscape Types (ALTs). There are three sample NCAs per ALT.
2.3 Within the ISOVIST of each sample square (i.e. the area that could be viewed by the surveyor from a central transect crossing the square) usually covering some 75% of the square, the surveyors undertook two main tasks (a) recording the landscape effect of identified ES options; (b) recording all features and land covers within the ISOVIST; and (c) identifying the condition of all landscape features (ground cover, point and linear features) that were or could be covered by an agri-environment scheme (see Box 2.1). This is described further in Report 1: The Methodology Report.
2.4 For this data to be of value to the counterfactual analysis it was important there was:
A sufficient population of data on features under different forms of agri-environment scheme (the survey squares had specifically been chosen to include areas currently and previously under ESA or the Countryside Stewardship Scheme (CSS) agreements as well as under Environmental Stewardship agreements).
A sufficient population of relevant features that were not and never had been under an agri-environment scheme (the control).
A direct link between the digitisation of the survey information and the relevant agreements that each feature was or was not covered by.
Ensuring the data could be used for the counterfactual analysis
2.5 Essentially this required that a large population of data was collected on the condition of landscape features that were and were not (the control) under some form of agri-environment scheme. Ensuring that there was enough data on agreement land was not difficult, as the survey squares had been selected specifically to cover areas under ES agreement while also including areas under the classic schemes (ESAs and Countryside Stewardship). But, for this reason, it was more difficult to ensure features were captured that were not under agri-environment agreement. Such land formed a part of all the survey squares but in some cases quite a small part.
2.6 In the second survey year (2012), therefore, a second set of ‘control’ squares was selected in each ALT (two per Study Area). In some cases these had to be selected outside the original Study Areas, as these did not have sufficient land outside agreement. These squares have been identified in 2 Report of Findings: Landscape Effects of Environmental Stewardship at the Study Area Level.

BD5303: Monitoring the effects of Environmental Stewardship on Landscape Character and Quality: Report 4
BD5303: Monitoring the effects of Environmental Stewardship on Landscape Character and Quality 4
2.7 These control squares were surveyed as described in Box 2.1 but, in addition, the surveyor walked along the transect of each control square to make observations to answer two questions specific to these control squares:
Is the landscape condition of the sample square generally of better, worse or the same condition as other squares [under agreement] within the Study Area? (providing an explanation with reference to key characteristics of the Study Area where possible)
Is the condition of landscape features within the sample square generally of better, worse or the same as the condition of the same features under ES options elsewhere in the Study Area? (providing an explanation with reference to key characteristics of the Study Area where possible)
2.8 Linking all data collected to the right agreement type (or control): National digital data on the boundary of all ES agreements had been supplied by Natural England. For the 2011 survey, polygon ES option uptake data was obtained from Natural England in order to map ES option uptake in the Study Areas. Option codes were shown on the survey maps to aid the surveyors. For the 2012 survey, this polygon data was now out of date as many classic scheme agreements had now come to an end, with many updating to an ES agreement. Therefore, prior to the surveyors going into the field, the relevant options were digitised in GIS from the relevant paper FER/FEP maps provided by Natural England i.e. for the identified holdings within the survey square.
2.9 In order to capture the field survey work digitally in GIS so that the data could be analysed, a geodatabase was set up in ArcMap GIS with point, line and polygon layers to capture the full variety of feature types surveyed. The annotated field survey maps were brought into GIS and georeferenced. All features were digitised on an OS MasterMap base and edges were aligned with MasterMap as far as possible.
2.10 For each feature/land cover, the following attributes were captured:
ALT
Study Area
Grid square name
Field Survey of Landscape Condition Box 2.1
As part of the field survey the location and extent of all landcover types and landscape features that could be viewed within the ISOVIST and which were listed in a field pro-forma (Pro-forma 3) were plotted and given the unique feature code identified in Pro-forma 3. If they had the potential to be, or were, covered by an agri-environment scheme their condition was also recorded.
The steps involved:
Annotating a Map to show the location and extent of all landcovers and features visible within the ISOVIST and using the unique codes identified in Pro-forma 3 to identify each feature / land cover. The field map showed the OS grid, contours and Mastermap boundaries overlain over an aerial photograph to guide the surveyor.
Recording the condition of those landcovers/features that had the potential, or were, covered by an agri-environment scheme, using the Categories ‘1’ (good), ‘2’ (fair) or ‘3’ (poor). These scores were clearly defined for all the features to which a condition score could be applied. These are described in the Methodology Report.
Clearly marking the boundary of the ISOVIST on the Map.
BD5303: Monitoring the effects of Environmental Stewardship on Landscape Character and Quality: Report 4
BD5303: Monitoring the effects of Environmental Stewardship on Landscape Character and Quality 5
Grid square number
Feature code
Condition (as taken from the hand written pro-formas)
Whether the feature was co-located or not
2.11 Additionally, a length or area was calculated for each feature automatically in GIS.
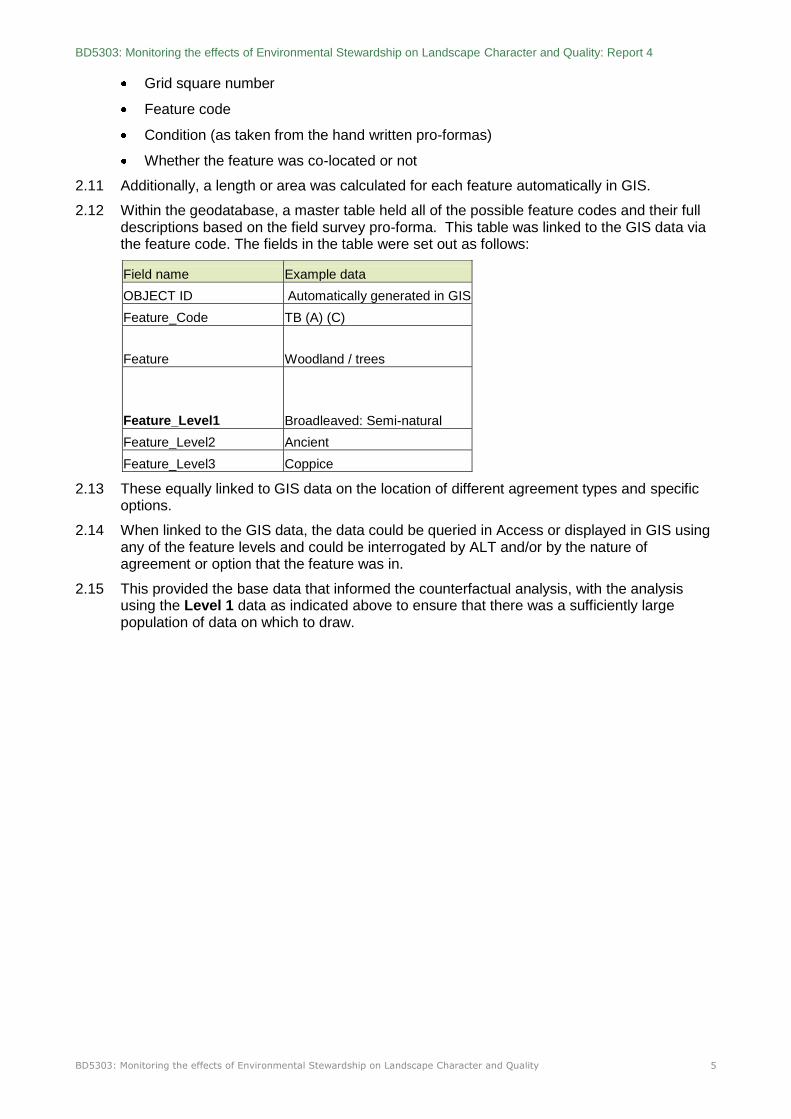
2.12 Within the geodatabase, a master table held all of the possible feature codes and their full descriptions based on the field survey pro-forma. This table was linked to the GIS data via the feature code. The fields in the table were set out as follows:
Field name Example data
OBJECT ID Automatically generated in GIS
Feature_Code TB (A) (C)
Feature Woodland / trees
Feature_Level1 Broadleaved: Semi-natural
Feature_Level2 Ancient
Feature_Level3 Coppice
2.13 These equally linked to GIS data on the location of different agreement types and specific options.
2.14 When linked to the GIS data, the data could be queried in Access or displayed in GIS using any of the feature levels and could be interrogated by ALT and/or by the nature of agreement or option that the feature was in.
2.15 This provided the base data that informed the counterfactual analysis, with the analysis using the Level 1 data as indicated above to ensure that there was a sufficiently large population of data on which to draw.

BD5303: Monitoring the effects of Environmental Stewardship on Landscape Character and Quality: Report 4
BD5303: Monitoring the effects of Environmental Stewardship on Landscape Character and Quality 6
3 The Counterfactual Analysis and its Outcomes
Aim of the counterfactual analysis and its development
3.1 The aim of the counterfactual analysis was to examine field survey data collected on the condition of landscape features in the 18 Study Areas and to use these to test hypotheses about the effectiveness of past and present agri-environment schemes. The approach adopted is based on the principle of constructing a ‘counterfactual’ that provides a baseline to allow the condition of features that are not included in a management regime (the control) to be compared with the condition of those that are.
Counterfactuals and the problem of dead-weight
3.2 The rationale for the approach is set out in Appendix 1. Essentially, ‘counterfactuals’ are used in policy evaluation to determine the effectiveness of policy interventions. That is, to determine if there is any evidence to suggest that the policy has really made a difference – in this case agri-environment scheme interventions. The idea is conceptually simple, in that analyses generally attempt to follow the scientific model in which the magnitude of some ‘treatment’ is assessed against a ‘control’. In practice, however, such analyses are often complex. A number of different effects need to be considered in order to determine whether changes that could be attributed to an intervention would have happened anyway – the so-called ‘dead-weight’ effect. Equally, there is a need to consider ‘additionality’ i.e. that part of the effect that can be attributed to the intervention measure.
3.3 If we consider the case of landscape features covered by agri-environment schemes in England, for example, the condition of those in a scheme may be no different to those outside it because the management interventions may be used to maintain the condition of existing features or will take time to have a discernible effect. However, it could also be that the condition of all features might have changed for the better or worse because of other drivers, and that the policy intervention had little impact on these overriding trends. Further complexity can be introduced to the analysis by the fact that features may have been in a scheme in the past but are not now, and so there is a legacy effect that masks any real difference in condition. Alternatively, since land managers can choose which features are included in any scheme, they may select preferentially some subset because of a specific management strategy; thus a land manager may include a feature already in good condition in a scheme, because less effort would be needed to make a difference, or land managers might decide to include poor condition features if they thought that an improvement would be easier to achieve.
3.4 Complexities such as these do not undermine attempts to carry out a counterfactual analysis, but they do serve to demonstrate that the outcomes may need to be interpreted with caution before it can be concluded that a policy has made a difference. At the outset, it must be recognised that the analysis presented here can only form one part of a much wider investigation if any final judgement about the effectiveness of a policy intervention can be made. This, therefore, is only one strand of the evidence that has been pulled together under BD5303 on the landscape effects of Environmental Stewardship (and other agri-environment schemes) as described in the other BD5303 Reports of Findings.
Hypotheses about the effectiveness of agri-environment schemes
3.5 The field survey protocol used to collect information on landscape features from the 18 Study Areas and the analysis of this digitised data in an Access database (para 2.14) has

BD5303: Monitoring the effects of Environmental Stewardship on Landscape Character and Quality: Report 4
BD5303: Monitoring the effects of Environmental Stewardship on Landscape Character and Quality 7
enabled features to be assigned to one of seven categories that define different ‘policy or agri-environment regimes’ (Table 3.1).
3.6 The classification in Table 3.1 takes account of the fact that features may never have been in an agri-environment scheme, but also recognises that some may in the past have been in one of the classic schemes (i.e. Countryside Stewardship or an ESA). These situations make any counter-factual analysis complex, because if currently within Environmental Stewardship then their condition may be much better than expected because of a longer period of positive management. Alternatively, if now not covered by an agreement, then their status as a control may be undermined because of any beneficial legacy effect.
3.7 In order to disentangle such effects four different hypotheses about the possible effects of agri-environmental schemes have been constructed (Table 3.2):
Table 3.2: Hypotheses used to test the effectiveness of agri-environment schemes on condition of landscape features
Hypotheses Comparisons of agri-environment regimes
Hypothesis 1: Features under agri-environment
scheme options (ES options or past and current
classic scheme options) are in better condition
than those that are not.
Features not under option (the control) (1,2,4)
compared to features that are (3,5,6,7) (the
treatment). Although 6 is strictly not now under a
classic scheme option there may be a residual
effect as it is on ES agreement land.
Hypothesis 2: Features under current agri-
environment scheme options (ES and current
classic scheme options that were still running at
the time of survey) are in better condition than
those that are not.
This is the same as Hypothesis 1 but removes
the residual effects of past classic scheme
options that are no longer running, by removing 4
& 6 from the analysis.
Hypothesis 3: There is a difference between
land covered by one of the classic scheme
options (ESAs and the Countryside Stewardship
Scheme) and land under ES option.
Features covered by an ES option (3) (the
control) compared to those covered by a classic
scheme (5) (the treatment)
Table 3.1: Classification of agri-environment regimes identified from the database of field survey results
1. Not under any current or previous ES scheme
2. On ES Agreement land, but not under Option
3. On ES Agreement land and under ES Option
4. On land that was previously under a classic scheme (but not in either ES or classic now)
5. On land that was and still is under a classic scheme
6. Was under a classic scheme but now forms part of ES Agreement land
7. Was under a classic scheme and now is under an ES Option.
BD5303: Monitoring the effects of Environmental Stewardship on Landscape Character and Quality: Report 4
BD5303: Monitoring the effects of Environmental Stewardship on Landscape Character and Quality 8
Hypothesis 4: Features under continuous
management (under an agri-environment
scheme) are in better condition than those more
recently included in the (ES) scheme.
Features under an ES option (3) (the control)
compared to those that are under an ES option
and also previously have been under a classic
scheme option (7) (the treatment).
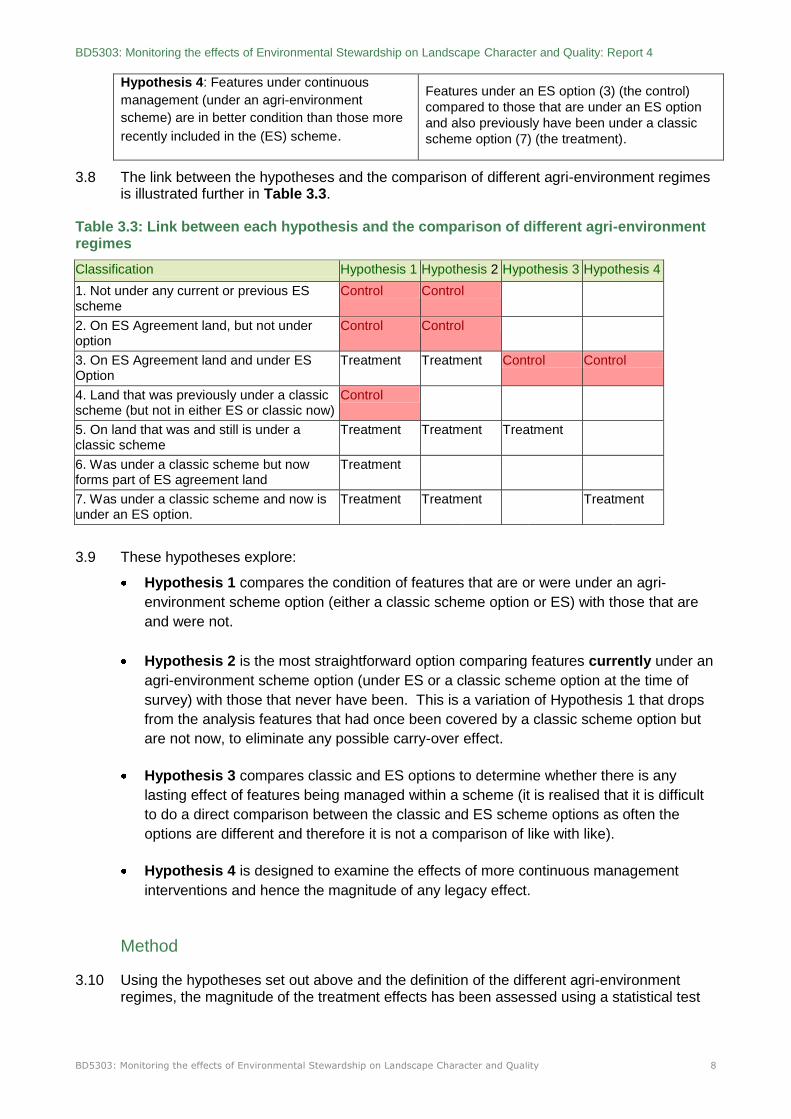
3.8 The link between the hypotheses and the comparison of different agri-environment regimes is illustrated further in Table 3.3.
Table 3.3: Link between each hypothesis and the comparison of different agri-environment regimes
Classification Hypothesis 1 Hypothesis 2 Hypothesis 3 Hypothesis 4
1. Not under any current or previous ES scheme
Control Control
2. On ES Agreement land, but not under option
Control Control
3. On ES Agreement land and under ES Option
Treatment Treatment Control Control
4. Land that was previously under a classic scheme (but not in either ES or classic now)
Control
5. On land that was and still is under a classic scheme
Treatment Treatment Treatment
6. Was under a classic scheme but now forms part of ES agreement land
Treatment
7. Was under a classic scheme and now is under an ES option.
Treatment Treatment Treatment
3.9 These hypotheses explore:
Hypothesis 1 compares the condition of features that are or were under an agri-
environment scheme option (either a classic scheme option or ES) with those that are
and were not.
Hypothesis 2 is the most straightforward option comparing features currently under an
agri-environment scheme option (under ES or a classic scheme option at the time of
survey) with those that never have been. This is a variation of Hypothesis 1 that drops
from the analysis features that had once been covered by a classic scheme option but
are not now, to eliminate any possible carry-over effect.
Hypothesis 3 compares classic and ES options to determine whether there is any
lasting effect of features being managed within a scheme (it is realised that it is difficult
to do a direct comparison between the classic and ES scheme options as often the
options are different and therefore it is not a comparison of like with like).
Hypothesis 4 is designed to examine the effects of more continuous management
interventions and hence the magnitude of any legacy effect.
Method
3.10 Using the hypotheses set out above and the definition of the different agri-environment regimes, the magnitude of the treatment effects has been assessed using a statistical test

BD5303: Monitoring the effects of Environmental Stewardship on Landscape Character and Quality: Report 4
BD5303: Monitoring the effects of Environmental Stewardship on Landscape Character and Quality 9
based on the ‘log-odds ratio’. During the field survey the areas, lengths or numbers of features in ‘good’, ‘fair’ and ‘poor’ condition were recorded.
3.11 The null hypothesis tested in each case was that the proportion of features recorded as being in ‘good’ condition within the control set should be no different to those assigned to ‘good’ in the treatment group. Preliminary inspection of the data suggested that to ensure there was sufficient data for the analysis to be carried out for most features, the ‘fair’ and ‘poor’ condition categories needed to be aggregated.
3.12 A comparison of proportions between control and treatment groups is a standard method used in meta-analysis (Hillebrand, 2008). The synthesis of information across studies and ecosystems is an increasingly important area of ecological research, and meta-analyses provide a set of statistical tools that enables quantitative summaries to be made of the results of a set of empirical studies or data collections. Within meta-analysis, proportional data can be used to calculate an ‘odds ratio’ that allows a statistical test of the null hypothesis of ‘no difference’ to be made. Conventionally the log of this ratio is used to summarise the data because it is simpler to interpret. Using the log-odds ratio to compare the proportions having the supposed benefit in the treatment and control groups, values greater than zero indicate that the treatment is having an effect (in other words the proportion of features under specific treatments are in better condition than those that are not), while values less than zero suggest the reverse (in other words that the proportion of features under specific treatments are not in as good condition as the control).
3.13 The field data from the 18 Study Areas were organised in a spreadsheet, and then extracted using a Pivot Table for input into the Comprehensive Meta-Analysis Program, which was used to calculate the log-odds ratios. As a result of discussions in the project team, the analysis was targeted on the following features:
Boundary features
Woodland (deciduous)
Permanent grassland
Rough grassland
Semi-natural grassland habitats
Lowland heathland
Moorland
3.14 From analysis of ES uptake at the NCA / ALT levels these features had proved some of the most important ES option sets, in terms of supporting key landscape characteristics, and / or being some of the features most commonly brought under ES option. See: 3. Report of Findings: Landscape Effects of Environmental Stewardship at the National Character Area and Agricultural Landscape Type Levels.
Results
Linear features
3.15 The field survey data coded as ‘Field Boundaries’ were extracted and tabulated using EXCEL. Four features at Level 1 were analysed: hedgebanks, hedgerows, lines of trees and stone walls. The results of the meta-analysis are summarised in Table 3.4 in two blocks: first, for the outcomes for the four hypotheses, tested by aggregating all the data in all the Study Areas; second, by splitting the data for each feature by the Study Areas in each ALT and retesting the four hypotheses1. In general, for the linear features, the volume of data available to test the hypotheses was largest for Hypothesis 2 (Figure 3.1) that looks
1 Note: the results of the aggregated data for each of the four hypotheses may be different to the sum of the results for
each ALT. This is the result of how the data aggregates within each ALT which may iron-out or exaggerate trends noted in the aggregation of data as a whole

BD5303: Monitoring the effects of Environmental Stewardship on Landscape Character and Quality: Report 4
BD5303: Monitoring the effects of Environmental Stewardship on Landscape Character and Quality 10
at the difference between land under current agri-environment options and land that has never been under agri-environment option.
Figure 3.1: Data volumes for linear features by hypothesis: HI = Hypothesis 1 and so on
0.0
20000.0
40000.0
60000.0
80000.0
100000.0
120000.0
140000.0
160000.0
Hedgebank Hedgerow Line of trees Wall: Stone
Me
ters
H1
H2
H3
H4
Table 3.4: Results of meta-analysis for linear features
Feature Overall Breakdown by ALT
H1 H2 H3 H4 H1 H2 H3 H4
Hedgebank - - + - NS NS Only data
for ALT 6
= +
Only data for ALT 6 =NS
Hedgerow + - NS +
Data for ALTs 3 & 5
= +
NS overall
Data for ALTs 2, 3 & 5
= + + overall
Data for ALTs 2, 4, & 6
= +
ALT 5
= - NS overall
Data for ALTs 1, 2, 5 & 6
= +
NS overall
Line of trees + - + + NS NS ND ND
Stone walls + + ND + Data for ALTs 5 & 6 NS overall
As for H1 ND Data for ALT 6
= - Key: H1 = Hypothesis 1 and so on
+ = Significant positive effect of treatment
- = Significant negative effect of treatment i.e. features under treatment are not in as good
condition as the control NS = Not significant ND = Insufficient data The null hypothesis of no effects of the treatment can be rejected at the 95% level for the cells indicated.
Key to ALTs: 1 = Chalk and Limestone Mixed; 2 = Eastern Arable; 3 = South East Mixed (Wooded); 4 = Western Mixed; 5 = Upland Fringe; 6 = Uplands

BD5303: Monitoring the effects of Environmental Stewardship on Landscape Character and Quality: Report 4
BD5303: Monitoring the effects of Environmental Stewardship on Landscape Character and Quality 11
3.16 The results shown in Table 3.4 suggest that there is evidence to support the hypotheses that features within an agri-environment scheme are in better condition than those that are not, for hedgerows and especially stone walls.
3.17 When the data are aggregated across all ALTs:
Hypothesis 1: both types of boundary feature (hedgerows and stone walls) that were in some kind of scheme showed a significantly greater proportion of the surveyed lengths in good condition in the treatment group (under options) than in the control group (that were not under option).
Hypothesis 2: For walls the finding was the same as Hypothesis I, in other words, walls that were currently under an agri-environment scheme option were in better condition than those that were not under option.
The next two hypotheses consider the legacy effect of being in an agri-environment scheme for longer than under an ES scheme alone.
Hypothesis 3: Hypothesis 3 was designed to examine whether there is any evidence that features that were in a classic scheme were in better condition than those under Environmental Stewardship option. The field data suggests that the condition of hedgebanks and lines of trees was better under a current classic scheme than ES option. There was no significant difference for hedgerows and insufficient data for walls.
Hypothesis 4: This compares those linear features that have only been under ES option with those that were under a classic scheme and are now under ES. The results in Table 3.4 suggest that in this case, hedgerows, lines of trees and walls that have been under continuous management (under a classic scheme and then under ES option) are in better condition than those that have only been covered by Environmental Stewardship. In other words, the evidence is consistent with the hypothesis that there might be a legacy effect for these features.
3.18 As might be expected, when the data are broken down by the ALTs, hedgerows appear to show the greatest positive effect from being under agri-environment options in the lowlands (especially ALT 3, South East Mixed) but also in the Upland Fringe (ALT 5) and Uplands (ALT 6) (Table 3.4). Table 3.4 also suggests that in half of the ALTs hedgerow management may be better under the classic schemes compared to ES (Hypothesis 3) and in four of the ALTs may benefit from the legacy effect of having been under a classic scheme before going into ES option (Hypothesis 4). As identified from the NCA and ALT uptake data, uptake of hedgerow options is high, being the top linear option in terms of uptake across all ALTs, with the single exception of the Uplands where it is in second place after options for walls. The potentially positive effects of hedgerows being under agri-environment option in the South East Mixed ALT is interesting to the extent that it has been noted as part of this overall study that uptake of hedgerow options in this ALT is proportionally lower than in the other lowland ALTs and yet this is the ALT with the highest hedgerow density.
3.19 Walls show evidence of a positive effect of ES agreements for Hypothesis 4 in the Uplands, with walls that are under ES option only, potentially being in better condition than those that were under a classic scheme and are now under ES. This result has to be questioned though, as it contradicts the findings from the aggregated data (para 3.18) which are drawn from a larger dataset and that indicate that walls that have been under a classic scheme and are now under ES benefit from a legacy effect, being in better condition than those that have only been under ES.
Area features
3.20 The data for the area features were also extracted and tabulated using EXCEL. Ten features at Level 1 were analysed: broadleaved woodlands; wood pasture and parkland, improved grassland, unimproved and semi-improved grassland; purple moor grass and rush

BD5303: Monitoring the effects of Environmental Stewardship on Landscape Character and Quality: Report 4
BD5303: Monitoring the effects of Environmental Stewardship on Landscape Character and Quality 12
pasture; upland grass moorland and rough grazing; reed beds; bogs / mires; upland heath; and coastal heath.
3.21 The results of the meta-analysis are summarised in Table 3.5, again in two blocks: first, for the outcomes for the four hypotheses in turn, tested by aggregating all the data across all ALTs; second, by splitting the data for each feature by ALT and retesting the hypotheses on a feature by feature basis. In general, for the area features, the volume of data available to test the hypotheses was largest for Hypothesis 1, and declined moving from 2 through to 4 (Figure 3.2).

BD5303: Monitoring the effects of Environmental Stewardship on Landscape Character and Quality: Report 4
BD5303: Monitoring the effects of Environmental Stewardship on Landscape Character and Quality 13
Table 3.5: Results of meta-analysis for area features
Overall Breakdown by ALT
H1 H2 H3 H4 H1 H2 H3 H4
Broadleaved:
Semi-natural + + - -
Data for ALTs 2-6
= +, except
ALT 6.
+ overall
Data for ALTs 2-6
= + for ALTs
2-5.
- for ALT 6
+ overall
Only data for ALT 4
= -
Data for ALTs 2, 3, 4 & 6. Only ALT 3 = +.
Rest = -. NS overall
Wood
pasture and
parkland - - ND ND ND ND ND ND
Improved
grassland + + - +
Data for ALTs 1-3 &5-6. = +, except ALT 3 + overall
Data for ALTs 1,3,5,6
all +, except ALT3 + overall
Only data for ALT 3
= -
Only data for ALTS 1,3,6
= + for ALTs
1 & 6 NS overall
Unimproved /
semi-
improved
grassland
(including
rough
grassland)
+ + + -
Data for all ALTs
= strong +
ALT2
= + ALTs 3 -
6
= - ALT 1
+ overall
As for H1
+ overall
Data for ALT 4 & 6
= + ALT 4
- overall
Data for all ALTs
= + ALTs 2,
3 & 5
+ overall
Purple moor
grass / rush
pasture
- - - -
Data for ALTs 4 & 6
= both - - overall
Data for ALTs 4 & 6
= both - - overall
Data for ALT 4 & 6 = + ALT 6
- overall
Data for ALT 1 & 4
= both – - overall
Upland grass
moorland
and rough
grazing
- - - +
Data for ALT6
= -
Data for ALT6
= -
ND Data for ALT4
= +
Reed beds ND ND ND ND ND ND ND ND
Bog / mire ND ND ND ND ND ND ND ND
Upland heath ND ND ND ND ND ND ND ND
Coastal
heath ND ND ND ND ND ND ND ND
Key: H1 = Hypothesis 1 and so on
+ = Significant positive effect of scheme
- = Features under scheme are not in as good condition as the control NS = Not significant ND = Insufficient data The null hypothesis of no effects of the treatment can be rejected at the 95% level for the cells indicated.
Key to ALTs: 1 = Chalk and Limestone Mixed; 2 = Eastern Arable; 3 = South East Mixed (Wooded); 4 = Western Mixed; 5 = Upland Fringe; 6 = Uplands

BD5303: Monitoring the effects of Environmental Stewardship on Landscape Character and Quality: Report 4
BD5303: Monitoring the effects of Environmental Stewardship on Landscape Character and Quality 14
3.22 The results shown in Table 3.5 suggest that there is evidence to support the hypotheses that inclusion of broadleaved woodland, improved grassland and unimproved grassland in an agri-environment scheme (under ES option and / or one of the classic scheme options) has a beneficial effect compared to the controls where land is not under an agri-environment option (Hypotheses 1 & 2). Conversely, it is interesting to note that areas of purple moor grass and upland grassland in a scheme, according to these hypotheses, were in poorer condition compared to the controls.
3.23 There was insufficient data to test these two hypotheses (Hypotheses 1 and 2) for bogs, coastal heath, reed beds and upland heath.
3.24 Only unimproved and semi-improved grasslands showed a positive effect of a classic scheme over Environmental Stewardship (Hypothesis 3 which examines whether there is any evidence that features in a classic scheme are in better condition than those in Environmental Stewardship). However, for improved grassland and upland grassland there was evidence that land that had previously been under a classic scheme and was now under ES, was in better condition than that which had only been under ES option. This suggests that in these cases more continuous management (Hypothesis 4) had a beneficial effect. This was not evident in the results for the other habitats.
Results by ALT
3.25 Results were also examined by ALT (Table 3.6). It should be stressed that the figures given here do not reflect the proportional area of these features by ALT. Rather they simply reflect the areas that were surveyed within the survey squares within the relevant Study Areas. As argued in Report 3, the field survey results are a poor reflection of both the area and balance between the uptake of different options (and of the stock of these features) by NCA and ALT. Much greater data on landscape condition would be needed to be representative of each NCA and ALT.
Figure 3.2: Data volumes for area features by hypothesis
0.0
2000000.0
4000000.0
6000000.0
8000000.0
10000000.0
12000000.0
14000000.0sq
uar
e m
ete
rs
H1
H2
H3
H4

BD5303: Monitoring the effects of Environmental Stewardship on Landscape Character and Quality: Report 4
BD5303: Monitoring the effects of Environmental Stewardship on Landscape Character and Quality 15
Table 3.6: Results of meta-analysis for area features by ALT
Level 1 Feature Hypothesis ALT1 ALT2 ALT3 ALT4 ALT5 ALT6
Broadleaved Semi-natural woodland H1 ND + + + + NS
H2 ND + + + + -
H3 ND ND ND - ND ND
H4 ND - + - ND -
Improved grassland H1 + + NS ND + +
H2 + + NS ND + +
H3 ND ND - ND ND ND
H4 + ND NS ND ND +
Unimproved / semi-improved
grassland
H1 - ++ + + + +
H2 - + + + + +
H3 ND ND ND + ND -
H4 NS + + NS + NS
Purple moor grass / rush pasture H1 ND ND ND - ND -
H2 ND ND ND - ND NS
H3 ND ND ND NS ND +
H4 - ND ND - ND ND
Upland grass moorland and rough
grazing
H1 H1 ND ND ND ND -
H2 H2 ND ND ND ND -
H3 H3 ND ND ND ND ND
H4 H4 ND ND + ND ND
3.26 As indicated in Table 3.6, when the data were broken down by Agricultural Landscape Type, broadleaved woodland and improved grassland appeared to show positive effects in terms of condition from being under agri-environment option across most ALTs (Hypotheses 1 & 2).
3.27 This pattern of the positive effect of ES and the classic schemes is also particularly evident across all ALTs for unimproved and semi-improved grassland (Hypothesis 1), except in
BD5303: Monitoring the effects of Environmental Stewardship on Landscape Character and Quality: Report 4
BD5303: Monitoring the effects of Environmental Stewardship on Landscape Character and Quality 16
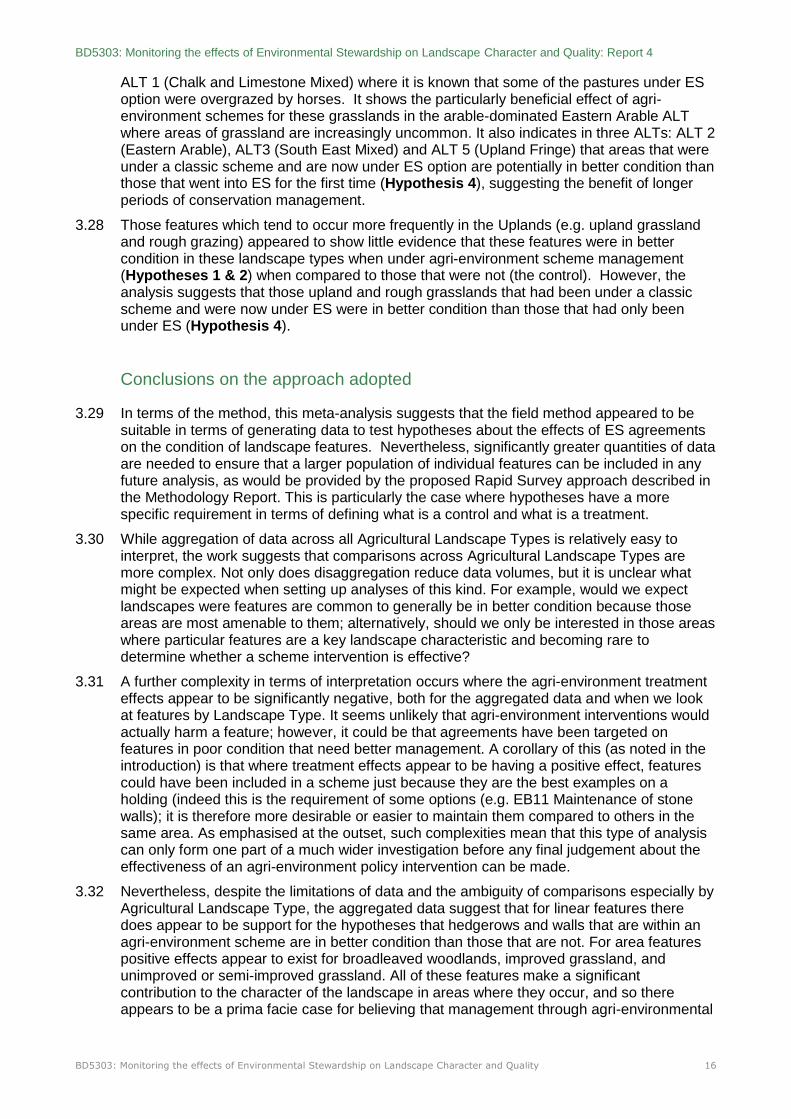
ALT 1 (Chalk and Limestone Mixed) where it is known that some of the pastures under ES option were overgrazed by horses. It shows the particularly beneficial effect of agri-environment schemes for these grasslands in the arable-dominated Eastern Arable ALT where areas of grassland are increasingly uncommon. It also indicates in three ALTs: ALT 2 (Eastern Arable), ALT3 (South East Mixed) and ALT 5 (Upland Fringe) that areas that were under a classic scheme and are now under ES option are potentially in better condition than those that went into ES for the first time (Hypothesis 4), suggesting the benefit of longer periods of conservation management.
3.28 Those features which tend to occur more frequently in the Uplands (e.g. upland grassland and rough grazing) appeared to show little evidence that these features were in better condition in these landscape types when under agri-environment scheme management (Hypotheses 1 & 2) when compared to those that were not (the control). However, the analysis suggests that those upland and rough grasslands that had been under a classic scheme and were now under ES were in better condition than those that had only been under ES (Hypothesis 4).
Conclusions on the approach adopted
3.29 In terms of the method, this meta-analysis suggests that the field method appeared to be suitable in terms of generating data to test hypotheses about the effects of ES agreements on the condition of landscape features. Nevertheless, significantly greater quantities of data are needed to ensure that a larger population of individual features can be included in any future analysis, as would be provided by the proposed Rapid Survey approach described in the Methodology Report. This is particularly the case where hypotheses have a more specific requirement in terms of defining what is a control and what is a treatment.
3.30 While aggregation of data across all Agricultural Landscape Types is relatively easy to interpret, the work suggests that comparisons across Agricultural Landscape Types are more complex. Not only does disaggregation reduce data volumes, but it is unclear what might be expected when setting up analyses of this kind. For example, would we expect landscapes were features are common to generally be in better condition because those areas are most amenable to them; alternatively, should we only be interested in those areas where particular features are a key landscape characteristic and becoming rare to determine whether a scheme intervention is effective?
3.31 A further complexity in terms of interpretation occurs where the agri-environment treatment effects appear to be significantly negative, both for the aggregated data and when we look at features by Landscape Type. It seems unlikely that agri-environment interventions would actually harm a feature; however, it could be that agreements have been targeted on features in poor condition that need better management. A corollary of this (as noted in the introduction) is that where treatment effects appear to be having a positive effect, features could have been included in a scheme just because they are the best examples on a holding (indeed this is the requirement of some options (e.g. EB11 Maintenance of stone walls); it is therefore more desirable or easier to maintain them compared to others in the same area. As emphasised at the outset, such complexities mean that this type of analysis can only form one part of a much wider investigation before any final judgement about the effectiveness of an agri-environment policy intervention can be made.
3.32 Nevertheless, despite the limitations of data and the ambiguity of comparisons especially by Agricultural Landscape Type, the aggregated data suggest that for linear features there does appear to be support for the hypotheses that hedgerows and walls that are within an agri-environment scheme are in better condition than those that are not. For area features positive effects appear to exist for broadleaved woodlands, improved grassland, and unimproved or semi-improved grassland. All of these features make a significant contribution to the character of the landscape in areas where they occur, and so there appears to be a prima facie case for believing that management through agri-environmental

BD5303: Monitoring the effects of Environmental Stewardship on Landscape Character and Quality: Report 4
BD5303: Monitoring the effects of Environmental Stewardship on Landscape Character and Quality 17
agreements may be having a beneficial impact upon their condition. A possible exception to this is those features which tend to occur more frequently in the Uplands (e.g. upland grassland and rough grazing) where there was little evidence that these features were in better condition in these landscape types when under agri-environment scheme management when compared to those that were not. As noted in para 3.22, areas of purple moor grass and upland grassland in a scheme, according to these hypotheses, were in poorer condition compared to the controls i.e. areas not under agreement
3.33 When looking at the comparison between the effect of the classic schemes and ES, the following emerges:
hedgerow management may have been better under the classic schemes compared to ES (Hypothesis 3) and may benefit from the legacy effect of having been under a classic scheme before going into ES option (Hypothesis 4).
walls may be in better condition where they were under a classic scheme before entry into ES, compared to those that have only been under ES (Hypothesis 4).
hedgebanks and lines of trees were potentially in better condition under a current classic scheme than under ES option (Hypothesis 3).
unimproved and semi-improved grassland may be better under the classic schemes compared to ES (Hypothesis 3) but there is no evidence of a legacy effect where areas have been under a classic scheme before entry into ES (Hypothesis 4).
on the other hand, for the Eastern Arable, South East Mixed and Upland Fringe ALTs areas of unimproved and semi-improved grassland that were under a classic scheme and are now under ES option were identified as potentially in better condition than those that went into ES for the first time (Hypothesis 4).
likewise for Improved grasslands and upland grasslands there was evidence that land that had previously been under a classic scheme and was now under ES, was in better condition than that which had only been under ES option (Hypothesis 4).
upland and rough grasslands that had been under a classic scheme and were now under ES were in better condition than those that had only been under ES (Hypothesis 4).
References
Haines-Young, R.H (2011) Assessing the Impact of Landscape Interventions: The Role of Counter-Factuals (Updated January, 2011) Internal Report, Fabis Consulting
Hillebrand, H (2008) Meta-analysis in Ecology. In, Encyclopaedia of Life Sciences (ELS). John Wiley & Sons, Ltd: Chichester. DOI: 10.1002/9780470015902.a0003272

BD5303: Monitoring the effects of Environmental Stewardship on Landscape Character and Quality: Report 4
BD5303: Monitoring the effects of Environmental Stewardship on Landscape Character and Quality 18
4 Supplementary commentary on counterfactual results
based on field work observations
4.1 In the light of the counterfactual analysis in the previous Chapter, this Chapter looks at the field data in a qualitative sense. It picks up on the commentary in the field survey pro-formas, that consider (a) whether the condition of the landscape as a whole within the survey squares under ES were the same or noticeably different from areas that were not under ES; and, commenting on particular ES options, (b) whether features under option were in the same condition or noticeably different, compared to features that were not under option. The observations on individual features under option particularly relate to field boundaries (hedgerows/ walls) and low input grasslands (options EK2/EK3).
Landscape condition
4.2 The following are qualitative observations made by the field surveyors having completed the field survey work within a Study Area. In total, four of the 18 Study Areas, were judged as little different in terms of the condition of features under option compared to those in surrounding areas not under option. These were:
Crewkerne Study Area (NAL) Chalk and Limestone ALT: where much of option uptake focusses on low input grassland (applied to improved pasture) and hedgerow management options that appear no different to the surrounding areas not under option.
Prickwillow Study Area (NAL) Eastern Arable ALT: where it was observed that the landscape of the Study Area included buffer strips and a consistent level of ditch management whether under ES management or not. These were the primary features under ES option in this open low-lying intensive arable Fenland landscape.
Preston on Wye Study Area (NAL) Western Mixed Study ALT: where it was observed that overall, the parts of the Study Area under ES agreement were in no better condition than areas outside agreement other than the presence of buffer strips. Within the survey squares areas under EK2 were grazed by ponies
Orton Fells Study Area, Upland Fringe ALT: where it was observed that features under option were not discernibly different or in better condition than those that were not. This is a landscape where the main option uptake relates to low input grasslands (EK2/3, EL2/3)) and mixed stocking (EK5) – applied almost entirely to improved grassland (some horse grazed), and to maintenance of boundary features, both walls and hedgerows, where their condition was often gappy and outgrown (in the case of hedgerows).
Condition of specific features under option
4.3 Clearly many ES options are concerned with maintaining traditional landscape features, such as trees, drystone walls and areas of semi-improved and unimproved grasslands. The key issue here is if there is any noticeable difference in how they are managed and, as a consequence, if there is any difference in condition, between those under option and those that are not:
Hedgerows (primarily EB1, EB2, EB3)
4.4 Hedgerows, as in the case of other field boundaries, are important because they are a key landscape characteristic of many landscapes, being important features in their own right and helping define the scale of individual landscapes. In a considerable number of Study

BD5303: Monitoring the effects of Environmental Stewardship on Landscape Character and Quality: Report 4
BD5303: Monitoring the effects of Environmental Stewardship on Landscape Character and Quality 19
Areas surveyed, it was observed that there was little difference in the management of hedgerows that are and are not under ES option on the same holding, as follows:
Chalk and Limestone ALT
Royston Scarp Study Area (East Anglian Chalk NCA): An area where relatively few hedgerows remain. Some under option were noted as gappy and tightly flailed (EB10), similar to those not under option
Crewkerne Study Area (Yeovil Scarplands NCA): Thick bushy often species-rich hedgerows are under option but these are often no different to those not under option, either in structure or species diversity.
Eastern Arable ALT
Myton-on-Swale Study Area (Vale off York NCA): Hedgerows under option may by flail cut, and in places gappy with no layering/coppicing resulting in tall and straggly hedgerows, the same as other hedgerows not under management.
Leighton Bromswold Study Area (Bedfordshire and Cambridgeshire Claylands NCA): Hedgerows both in and outside option are often gappy, reducing their impact on the landscape. The Study Area was observed to include other hedgerow lengths not under option that are thick, with frequent hedgerow trees.
South East Mixed ALT:
Mayfield Study Area (High Weald NCA): Hedgerows both under and outside ES option were bushy, species-rich and generally of the same management condition.
Western Mixed ALT:
Preston on Wye (Herefordshire Lowlands NCA): Hedgerows both under and outside ES option are thick and bushy and in the same condition whether under option or not. Many hedgerow verges have dense high nettle and thistle growth.
Upland Fringe ALT
North Orton Fells (Orton Fells NCA): Within the survey squares all hedges appeared to be in similar condition whether or not they were under option. Some lengths under option were overgrown and progressing towards becoming a line of trees, with no evidence of recent hedgerow management.
Ditch management (EB6)
4.5 Ditches are a particular feature of the Eastern Arable ALT landscapes and again, where present, show commonality of management between those that are and those that are not under option. This was noted for example in the Prickwillow Study Area where there was no visible difference between ditches in ES, and others outside agreement, with ditches dry and overgrown.
Dry stone walls (EB11)
4.6 Again, in the Upland Fringe and Uplands, dry stone walls are a critical key characteristic of the landscape and were observed as being in the same condition whether inside or out of option in the West Allendale and North Orton Fells Study Areas. In the North Orton Fells some wall lengths under option were obscured by hedgerow planting / regeneration which was gapping up collapsed sections, while others had some collapsed sections gapped up with fencing. In contrast, in the Oldham Fringe Study Area, there was a notable improvement in the condition of dry stone walls where under option, being well-maintained and stock-proof whereas those outside option tended to be relict and replaced by fencing.
4.7 These similarities in boundary treatments between those under option and those outside agreement might suggest: (a) that the feature had always been managed in the way observed and therefore ES was not providing any additional landscape benefit (although in

BD5303: Monitoring the effects of Environmental Stewardship on Landscape Character and Quality: Report 4
BD5303: Monitoring the effects of Environmental Stewardship on Landscape Character and Quality 20
some cases it was clearly encouraging the continuation of positive management – an important objective of ELS); or (b) management had changed for those areas / features under an ELS option and because this aspect of farm management was contracted out or indeed because it was easier to be consistent across the farm, this standard of management was now being practiced across the holding. In this latter case, therefore, ELS would be bringing benefits greater than that achieved through the ELS options alone. Which of these is correct, or indeed if there is another explanation, could only be discovered by interviewing the farm manager / owner. In cases where poor sections have been brought under ES option this could be with the objective of improving their management or just poor selection in the first place.
Low input grasslands (EK2/EK3, EL2/EL3) and mixed stocking (EK5)
4.8 Where these low input and mixed grazing ES options have been applied to semi-improved or unimproved grassland they were identified as part of the field survey as conserving landscape character (helping conserve increasingly rare grasslands). Where applied to improved permanent pasture though, such grasslands under option were identified during the field surveys as appearing no different to other areas of improved grassland. Application of these options to improved grassland was noted in a number of very different landscape types, including the Crewkerne, and Grandborough Study Areas, as well as the Piddlehinton, Chagford and Orton Fells Study Areas where some improved grassland fields under option are tightly grazed by horses – often in fields where EK2 or EK3 is co-located with EK5 for mixed stocking.
4.9 This differs from areas such as the Oldham Fringe where EK2 and EK3 were observed as helping maintain a rich grassland sward helping conserve the area’s characteristic meadows and upland pastures.
Buffer strips
4.10 it was also observed that in some intensive arable areas such as the Prickwillow, Leighton Bromswold and Myton on Swale Study Areas that buffer strips had been introduced into the landscape whether under option or not, perhaps suggesting that the influence if ES was spreading beyond just option land but the exact reasons for this cannot be certain.
Conclusions
4.11 Taken together, the results of the counterfactual meta-analysis and the field survey observations paint a confused although not necessarily contradictory picture.
4.12 From the meta-analysis it was concluded that for linear features there does appear to be support for the hypotheses that hedgerows and walls within an agri-environment scheme are in better condition than those that are not. Again from the counterfactual analysis, for area features, there equally appears to be a positive effect arising from inclusion in an agri-environment scheme for broadleaved woodlands, improved grassland, and unimproved or semi-improved grassland (and potentially for other features as well but there was insufficient data). Conversely field observations suggested that in a number of the Study Areas, hedgerows, ditches and walls were of the same condition whether in or out of option. Equally it was observed that low input grassland options, and mixed grazing options had sometimes been applied to improved pastures, some of which were grazed by horses with a result that these options where not delivering anything better than that observed on non- agreement land.
4.13 However, what these results appear to be revealing is that:
Linear features
4.14 On balance, according to the counterfactual analysis, linear features will usually benefit from being under option but there are clearly situations where there has been no
BD5303: Monitoring the effects of Environmental Stewardship on Landscape Character and Quality: Report 4
BD5303: Monitoring the effects of Environmental Stewardship on Landscape Character and Quality 21
improvement in condition of the boundary feature as a result of coming under ES option - in some cases the wrong boundary lengths may have been selected for inclusion in the first place, in others the correct management regime may not have been implemented.
4.15 Hedgerows: In the case of hedgerows the field work suggested that there were some gappy hedgerow lengths under EB1 / EB2 which would have benefitted from the New ELS option introduced in 2013 for Hedgerow Restoration (EB14) which was not available at the time of the field surveys. This will be a very important addition to the ELS palette of options. It fills an obvious gap, having the aim of rejuvenating hedgerows to encourage the development of thick, dense, continuous hedges, which link other hedges and habitats, such as ponds and woodlands to strengthen landscape character. It is precisely these types of hedgerow that currently undermine the delivery of hedgerow condition under ES. Equally, as noted earlier, cases were observed in the field where the management regime for hedgerows within and outside an ES option was the same, potentially suggesting that the ELS standard of management was now being applied across the whole holding and not just those hedgerow lengths under option, thus ELS might be bringing benefits greater than that achieved through the ELS option lengths alone.
4.16 Ditches: Ditches were not covered in the counterfactual analysis but the field surveys suggested that some ditches under ELS option were the same as those outside option, with ditches dry and overgrown. In this case the wrong ditches have potentially been selected by applicants, with the ELS Handbook 2013 noting that eligible ditches must regularly contain standing or flowing water and vegetation typical of wet ditches, “for example, common reed, yellow flag, reed canary grass, water mint, fools watercress and marsh-marigold”, with the aim of the option being to create a varied bank-side and aquatic vegetation, and an undisturbed wildlife habitat adjacent to the ditch. Little of this was observed in the field.
4.17 Walls: Equally, in the case of walls, the ELS Handbook 2013 requires that these options (EB11 / UB11 Stone Wall Protection and Management) are only applied to wall lengths that are in good condition. It would be unrealistic, therefore, to anticipate that this option would necessarily result in improved management over those wall lengths that are not under option – this is an option for conserving the status quo rather than seeking an improvement in condition, with the condition of walls under option very much dependent on the nature of walls selected in the first place. As for hedgerows, the field work suggests that there are examples where the wrong wall lengths have been selected. Equally, the counterfactual analysis suggested that these are in the minority. In the case where walls are in poor condition, it would be better that they are under UELS option UB17 Stone Wall Restoration, available for walls that require major rebuilding, with an applicant able to enter 40m annually. Uptake of this option has been relatively low though, with a total of 7720m under option nationally in 2013, so this may be a missed opportunity. Also, as a UELS option, it is not available to walls outside SDAs. It is equally not available to lowland limestone walls, such as those of the Cotswolds and Mendips.
Low input grasslands (EK2/ EK3 and EL2 / EL3 and Mixed grazing options (EK5)
4.18 From the counterfactual analysis it was concluded that for area features, positive effects appear to exist for broadleaved woodlands, improved grassland, and unimproved and semi-improved grassland under agri-environment option. All of these features make a significant contribution to the character of the landscape in areas where they occur.
4.19 Of interest here are the conclusions reached on grasslands, and particularly the use of the low input grassland options and the mixed stocking option EK5. These two groups of option cover very significant areas of the total ES uptake by area, with at least two of these options consistently in the top three options, measured by area of uptake, across all four lowland ALTs and also in the Upland Fringe ALT.
4.20 Yet the field survey data suggested that these options are sometimes being applied to areas of improved grassland, potentially explaining the ‘good’ condition of areas of improved grassland under ES, as identified through the counterfactual analysis. More

BD5303: Monitoring the effects of Environmental Stewardship on Landscape Character and Quality: Report 4
BD5303: Monitoring the effects of Environmental Stewardship on Landscape Character and Quality 22
encouraging is the conclusion from the counterfactual analysis that areas of unimproved and semi-improved grassland appear to be in better condition under agri-environment option than areas that are not. These are likely to include not only areas of unimproved grassland under HLS options but also areas of semi-improved grasslands under the ELS options EK2 / 3, EL2 / 3 and EK5. Here these ELS options have the potential to ‘punch well above their weight’ in terms of landscape (and biodiversity) conservation.
4.21 So overall, the key issue to emerge from these analyses is that it is critical where ELS options are applied, if their landscape benefits are to be maximised. This clearly also relates to HLS but as these options are applied under the guidance of ES officers there is a much greater opportunity to ensure that they are located in the right place.
Choice of approach
4.22 Creating counterfactuals is a notoriously difficult area and so it has proved in this study. Any issues with the results of the counterfactual analysis described here, potentially relate not to the choice of the approach but to (a) the quantity of data collected (too little – although in total 86 1km2 squares were surveyed under BD5303 including the control squares); and (b) the reasons that can be given for the observed results, which potentially require a better understanding of the motivations of land managers.
4.23 The approach that has been adopted has had the advantage of fitting closely with the data collected for other aspects of the study. It has also been unambiguous to the extent that it has adopted a quantitative quasi-experimental approach that compares a control with the results of a treatment.

BD5303: Monitoring the effects of Environmental Stewardship on Landscape Character and Quality: Report 4
BD5303: Monitoring the effects of Environmental Stewardship on Landscape Character and Quality 23

BD5303: Monitoring the effects of Environmental Stewardship on Landscape Character and Quality: Report 4
BD5303: Monitoring the effects of Environmental Stewardship on Landscape Character and Quality 24
Appendix 1: Assessing the Impact of Landscape
Interventions: The Role of Counterfactuals
Roy Haines-Young, Fabis Consulting
Introduction
It is widely acknowledged that environmental, social and economic systems create significant methodological challenges when we need to measure and evaluate the effectiveness of polices or management interventions (Keen and Pullin, 2011). Although indicators are commonly used to track change in important environmental characteristics or qualities, as Ferraro (2009) points out, they cannot generally be used to judge matters of causality. Indeed, he suggests that much of what is called policy impact evaluation is ‘simply monitoring’, and argues that ‘counterfactual thinking is critical to building the evidence base in environmental policy about what types of interventions work and under what conditions’ (Ferraro, 2009, p76). Put simply, ‘counter-factual thinking’ merely consists of trying to establish what outcomes would have occurred in the absence of the intervention. The idea of trying to identify the effect of a policy or management intervention can be refined using two further complementary measures, namely of ‘additionality’ and ‘deadweight’. Additionality is that part of the effect that can be attributed to the policy measure, while deadweight refers to the part of the change that would have occurred anywhere.
As Figure 1 suggests, although simple in concept, in practice the goal of assessing the effect of a policy or intervention cannot often be accomplished easily because it is difficult to construct anything like an experimental control. Some of the change detected after the policy intervention may, for example, have occurred anyway (Figure 1a) while without the policy the resource might have declined and the policy has done no more than maintain the status quo (Figure 1b). Further difficulties are imposed by such factors as time lags between interventions and effects, and the fact that the outcome may not be measurable directly but via some surrogate. Despite such complexities, Ferraro (2009) and Margoluis et al. (2009) suggest that in general terms we can attempt to approach the construction of ‘counterfactuals’ and the task of assessing impacts using experimental and quasi-experimental designs. This concept note considers the applicability of these ideas to the assessment of the effect of different types of agri-environmental measure on landscape.
Figure 1: The complexities of identifying the magnitude of policy impacts.
a. An intervention the improves on current trends b. An intervention that maintains the status quo

BD5303: Monitoring the effects of Environmental Stewardship on Landscape Character and Quality: Report 4
BD5303: Monitoring the effects of Environmental Stewardship on Landscape Character and Quality 25
Approaches
The types of design that can be used to construct counter-factual comparisons identified by Margoluis et al. (2009) are summarised in Table 1. Quantitative, experimental designs come closest to establishing causality, in that the researcher has access to a formal, untreated control, and the randomness of sampling ensures the most robust statistical measures of change or difference. However, these kinds of design are the most difficult and expensive to establish and, as Margoluis et al. (2009) point out are often the most difficult to generalise from because of their artificiality. On the other hand, wholly qualitative designs may produce highly relevant information and be rich anecdotally, but be difficult to analyse and lead to subjective interpretations.
In the context of assessing the impact of interventions on different types of landscape feature, it seems that quantitative quasi-experimental and non-experimental designs are probably the most tractable and useful, in that background knowledge can be used more effectively to make comparisons. Thus holdings or features known to have been covered by particular schemes or interventions can be selected purposefully as the basis for making a judgement about the effectiveness of outcomes, providing some suitable/plausible baseline can be constructed. Table 2 summarises some potential approaches that follow the typology presented in Table 1.
Table 1: Types of Evaluation Design (after Margoluis et al., 2009)
Type Approach Design Landscape examples
Experimental Random assignment of subjects
to treated (experimental) and
untreated (control) groups
Random sample of a given type of
landscape feature (e.g. hedgerow) and
comparison of status or condition before
and after the intervention. The ‘before’
can act as a control, although more
rigorous designs include ‘non-treated’
controls over time to ensure no
background effects.
Quantitative
designs
Quasi-
experimental
Similar to experimental but
lacks random assignment
Purposive selection of features or land
holdings to make comparisons
according to whether they have been
the subject of particular schemes;
comparisons of targeted features with
the ‘average, where untreated controls
do not exist or cannot be identified.
Non-
experimental
Draws inferences about the
effect of a treatment on
subjects, where assignment of
subjects into a treated versus
control group is outside the
researcher’s control
Features measured before and after the
intervention, or time series or trend
assessed and used to infer policy
effectiveness, or features compared
according to the degree or time over
which they have been
targeted/managed (e.g. hedgerows only
in ELS and hedgerows in ELS plus CS).
Qualitative
designs
Qualitative
sampling
Qualitative evaluation design
options focus almost exclusively
on the sampling framework and
not statistical power or how
exposed and non-exposed
cases are compared. Individual
cases are weighted more
heavily because the evaluator is
not looking for population-based
trends.
Interviews with land managers to
determine what they would have done
in absence of policy or measure and
assessment of probably impact on
target features based on best
judgement.

BD5303: Monitoring the effects of Environmental Stewardship on Landscape Character and Quality: Report 4
BD5303: Monitoring the effects of Environmental Stewardship on Landscape Character and Quality 26
Table 2: Some Potential Approaches for Constructing Landscape Counter Factuals
Scale Hypothesis Approach Issues Resolution
1 Within holding
or sample
square
comparisons
based on FER
& FEP
mapping
Features
covered by
ELS/HLS on a
holding are in
better
condition than
those not
included
Use field survey to make comparisons between included and non-included features on single holdings or sample squares to control for environmental differences between farms and land managers
Approach could be extended by purposive selection of features likely to have landscape impact and comparison uptake and condition with residual stock.
Best examples may be included because they are ‘worth managing’ and so comparison is gives false positive effect.
Most easily managed features may be included in an agreement so that effects of management cannot be distinguished from underlying variability in resource.
All features on holding treated in the same way since the farmers would ‘do this anyway’
How many holdings should be selected and how representative are they?
Use land manager interviews to determine motive for selection.
Use land manager interviews to determine difference in treatment between features that are included in a scheme and those which have not.
For a set of selected holdings report number where condition of included features is better than those which have never been included in a scheme.
2 Within holding
or sample
square
comparisons
based on
ELS/HLS and
mapping (FER
/ FEP)
Features
subject to long
term
management
on a holding
are in better
condition than
those which
have more
intermittent
management
Comparison of landscapes features on holdings or sample squares included within various schemes and those not in an agreement – vis: o ELS/HLS+CSS/
ESA o ELS/HLS only o CSS/ESA only o Neither
ELS/HLS or CSS/ESA
Maintain within farm sampling to control for
Difficulty of reconstructing nature and location of CSS/ESA intervention
Differences in required treatment in CSS/ESA and ELS/HLS, and therefore difficulty of separating effectives of different schemes
Plus all of the above for ELS/HLS (1)
Use land manager interviews to determine continuity of management
Use CSS/ESA records and FER/FEP to determine continuity
For set of selected

BD5303: Monitoring the effects of Environmental Stewardship on Landscape Character and Quality: Report 4
BD5303: Monitoring the effects of Environmental Stewardship on Landscape Character and Quality 27
environmental differences between farms and land managers
Approach could be extended by purposive selection of features likely to have landscape impact and comparison uptake and condition with residual stock.
holdings and historical treatments report number of holdings where condition of included features is better than those never covered by a scheme.
3 Within and
between
holding or
sample square
comparisons
The condition
of the
population of
included
features is
better than
those not
included.
Repeat 2 & 3 above but apply an Analysis of Variance design to determine how variability between and within holdings is partitioned for included and not included features.
Larger number of holdings probably needed than in 1 & 2.
Same as in 1 & 2
Report magnitude of effect
4 Comparisons
between
selected
holdings and
local/regional
averages
Included
features are in
better
condition than
the average for
that
landscape/hold
ing type
Use Countryside Survey (or comparable Aerial photography) data to determine what the status and trend of selected features are and use this as the base-line to determine status of included/non-included features on selected holdings as in 1 & 2
CSS data (measured characteristics) are not directly comparable to characteristics measureable on included features.
Construct surrogates or equivalences to measure difference to local or regional averages
5 Scenario
comparisons to
determine
landscape
thresholds
N/A Use expert judgement to target landscape features for maximum landscape impact and make comparisons with present patterns to determine effectiveness based on simulated outcomes using GIS model of current landscape.
Subjective nature of scenarios and comparisons.
Assess variability between experts
Peer review of outcomes
Construct a random model in which similar proportions of stock are included as at present, but with no land-owner preferences

BD5303: Monitoring the effects of Environmental Stewardship on Landscape Character and Quality: Report 4
BD5303: Monitoring the effects of Environmental Stewardship on Landscape Character and Quality 28
.
6 Scenario
comparisons to
determine
alternative
policy impacts
N/A Use expert judgement to construct alternative policy trajectories and make comparisons with present status
Subjective nature of scenarios and comparisons.
Assess variability between experts
Peer review of outcomes
In all work of this kind, it is apparent that policy and management interventions take place in a complex setting, and it is extremely difficult to account for all factors. Thus if we consider the policy impacts of the Entry Level or Higher Level Schemes of Environmental Stewardship (ELS and HLS respectively) in approaches 1 & 2 summarised in Table 2, there is some attempt to control between holding variability (e.g. environmental location and land manager characteristics) by establishing sets of paired comparisons between included features and the residual stock on the same holding. As indicated, differences between the groupings is not straightforward, but may be resolved by additional interview material with land managers to determine how and why certain features have been included in a scheme2.
Like designs 1 and 2, design 3 in Table 2 is also quasi-experimental in its approach; it seeks to establish some kind of paired comparison, but this time also takes account of between holding variability. The hypothesis being tested here is that the within group variability for the included features is no different to that between the included and non-included groups, so that we can accept the hypothesis that we are dealing with two distinct populations. Again the interpretation of policy impact would have to be made by including some interview material in the assessment, to determine just how these ‘populations’ of features were constructed on the basis of land manager behaviour.
Of the three designs discussed so far, 3 is probably the most demanding in terms of time and resources, and so design 4 seeks to minimise research effort by using other sources of information to construct some kind of base-line. In so doing the rigour of the approach is probably reduced, however. It is suggested, for example, that if suitable measures could be derived from Countryside Survey data, for example, then this could be used to construct a picture of the regional average, of the mean condition for that type of landscape (land class) so that the hypothesis that included features on particular holdings are better than the average could then be tested. The projection of the average condition is essentially what Countryside Survey data allows when the survey square means are extrapolated across all squares of the same land class, or when projections are made for a heterogeneous area using the land class means weighted by the proportions of the different land class types present (e.g. within a given NCA). Clearly the average would reflect features whether they are included or not, and so the difference with the included/sampled set would be less than might be expected with a proper experimental control. However, while rejection of the null hypothesis of 'no difference' would not establish that the intervention relating to that feature type has a positive effect, it would be consistent with it. Thus the result might be used as evidence in favour of accepting that there is some additionality, providing that the issues relating to land owner behaviour can be resolved in a robust way.
Designs 5 and 6 in Table 2 are equivalent to the qualitative, approaches described by Margoluis et al. (2009), and as such do not allow any hypothesis to be tested in a formal way, as the earlier ones have done. Instead the intention is to use expert knowledge to help simulate different types of outcome that could be used to make comparison with present conditions and hence make a judgement about likely significance of agri-environmental measures. For design 5, the suggestion is that the current GIS base is used to elicit expert opinion about where agri-environmental interventions should be targeted to have maximum landscape effect in a given area; thus the same amount of stock as covered by a scheme at present would be redistributed according to the expert consulted. The assumption is that interventions have positive outcomes for features, and so this
2 Cf. Boatmen et al. (2008)

BD5303: Monitoring the effects of Environmental Stewardship on Landscape Character and Quality: Report 4
BD5303: Monitoring the effects of Environmental Stewardship on Landscape Character and Quality 29
work would have to be supported by the kinds of analysis summarised above (approaches 1-4). However, assuming this is accepted, these simulated maps could be used to make comparisons with existing patterns to make a judgement about whether the schemes are likely to have a significant landscape impact. The variability between experts could be used to determine levels of uncertainty around the issue. A variation of this approach would be to remove the constraint of distributing the same amount of included stock as the present, and asking experts to allocate the minimum necessary. Using these data, one might build up a picture of the levels of intervention needed to make a ‘real’ difference.
The other scenario exercise summarised in Table 2 (row 6) involves experts constructing alternative developmental pathways that would have different fates for the types of feature covered by schemes. The scenarios, for example, identified in the New Agricultural Landscapes (NAL) work might be used to suggest what a continuous ‘policy off’ future would have looked like for a set of study areas, and a companions made with present conditions to identify aspects of additionality and deadweight. This kind of approach is possibly most amenable to features that would not be present if the policy were not active (e.g. buffer strips), but it may be possible to extend it to aspects of the stock and change of features more generally.
Given that the aim of the present study is to focus on the overall landscape impacts of agri-environmental interventions, one may also consider variations on the approaches described above that look at the spatial pattern of uptake in more detail. A number of issues are important in this context, including whether the interventions are in an appropriate location, and whether they are of sufficient magnitude to make a difference. To some extent these questions go beyond the counter-factual issue which essentially is asking what would have happened without the policy intervention; analysis of concentration in relation to need and sufficiency are more to do with the effectiveness of the design of the intervention measures. However, clearly if there are underlying spatial variations in the amount and or condition of the stock of some feature, and spatial differences in the way they have changed over time, then a comparison of how the schemes have affected particular locations is relevant. Design options 5 & 6 in Table 2 attempt to do this by drawing on expert judgement to divide the existing stock into categories according to their location and therefore likely landscape impact (i.e. significance/contribution to landscape character). These groupings could then be used to make comparisons between the condition of features that had a high or low landscape significance that were not included in a scheme with the landscape significance of features that were covered. If it can be shown that the distribution of features with high and low landscape impact which were not included in a scheme was different to that of features that were included in the scheme, then it could be argued that the ‘policy-off’ world would have looked different to the one with Environmental Stewardship, and that the latter has or is making a difference.
Assessment of Potential Analytical Strategies
The discussion presented here clearly deals with features of landscape importance (e.g. hedges, walls, streams, ditches) that would be present whether the policy was applied or not and where issues of condition and amount are the main ones. For ‘new’ features like headlands and buffer strips, the main question here is how much and where these features are and what impact they are having as landscape elements in particular types of locality. Thus this review of analytical approaches focuses only on features that occur independently of whether an agri-environmental scheme exists or not. It also takes account of the kinds of data generated by the field work under BD5303.
The field data collected through BD5303 has been stratified to take account of local and broader, landscape influences. Thus fieldwork has been undertaken in 4 to 5, 1km x 1km sample squares selected from 18 Study Areas (one per sample NCA), which have in turn been selected to represent each of the six major agricultural landscape types; there are three sample NCAs per agricultural landscape type. Within the ISOVIST3 of each sample square the data on the landscape contribution of particular features under ES option have been recorded, together with their
3 ISOVIST = area that can be seen in each survey square
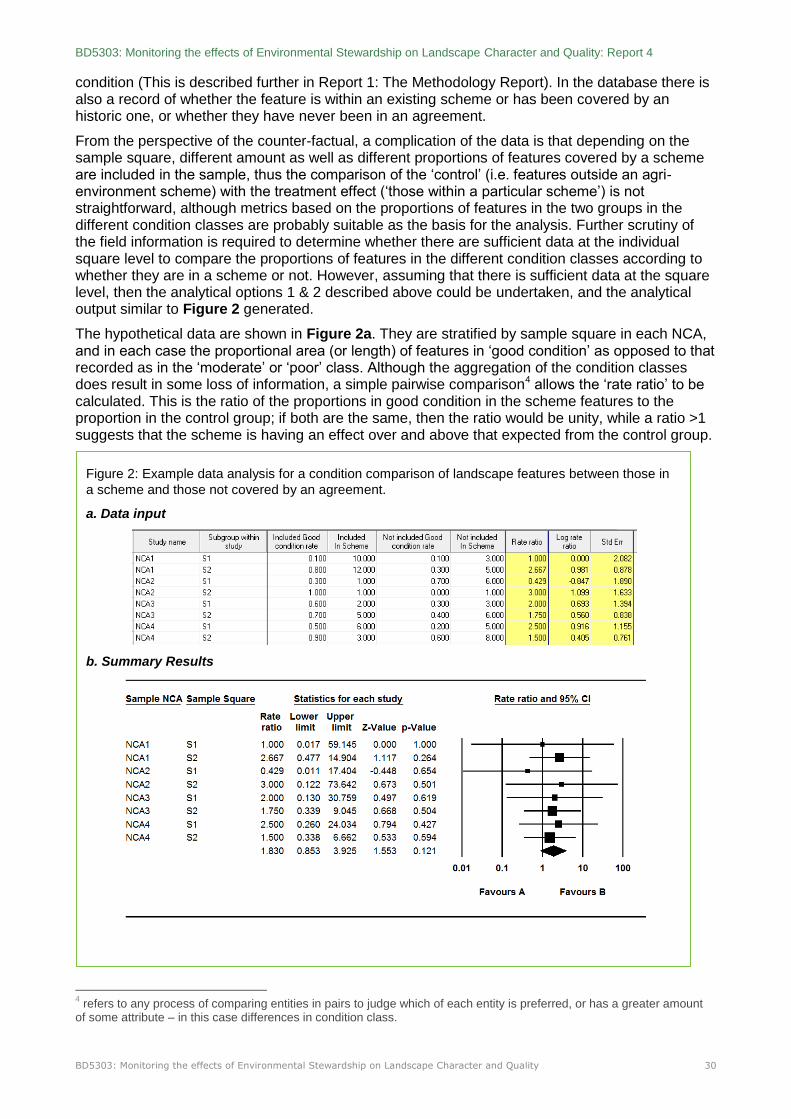
BD5303: Monitoring the effects of Environmental Stewardship on Landscape Character and Quality: Report 4
BD5303: Monitoring the effects of Environmental Stewardship on Landscape Character and Quality 30
condition (This is described further in Report 1: The Methodology Report). In the database there is also a record of whether the feature is within an existing scheme or has been covered by an historic one, or whether they have never been in an agreement.
From the perspective of the counter-factual, a complication of the data is that depending on the sample square, different amount as well as different proportions of features covered by a scheme are included in the sample, thus the comparison of the ‘control’ (i.e. features outside an agri-environment scheme) with the treatment effect (‘those within a particular scheme’) is not straightforward, although metrics based on the proportions of features in the two groups in the different condition classes are probably suitable as the basis for the analysis. Further scrutiny of the field information is required to determine whether there are sufficient data at the individual square level to compare the proportions of features in the different condition classes according to whether they are in a scheme or not. However, assuming that there is sufficient data at the square level, then the analytical options 1 & 2 described above could be undertaken, and the analytical output similar to Figure 2 generated.
The hypothetical data are shown in Figure 2a. They are stratified by sample square in each NCA, and in each case the proportional area (or length) of features in ‘good condition’ as opposed to that recorded as in the ‘moderate’ or ‘poor’ class. Although the aggregation of the condition classes does result in some loss of information, a simple pairwise comparison4 allows the ‘rate ratio’ to be calculated. This is the ratio of the proportions in good condition in the scheme features to the proportion in the control group; if both are the same, then the ratio would be unity, while a ratio >1 suggests that the scheme is having an effect over and above that expected from the control group.
4 refers to any process of comparing entities in pairs to judge which of each entity is preferred, or has a greater amount
of some attribute – in this case differences in condition class.
Figure 2: Example data analysis for a condition comparison of landscape features between those in
a scheme and those not covered by an agreement.
a. Data input
b. Summary Results

BD5303: Monitoring the effects of Environmental Stewardship on Landscape Character and Quality: Report 4
BD5303: Monitoring the effects of Environmental Stewardship on Landscape Character and Quality 31
The results are summarised in Figure 2b, which plots the ratio and the estimated confidence limits for each record. The weight of each record (based on the contribution of each sample square to the total amount of the feature surveyed) is shown by the proportional symbol which plots the ratio, together with the confidence its 95% confidence limits. Thus ratios to the right of ‘1’ indicate a positive effect of the scheme in a square. The diamond at the bottom of the plot indicates the overall assessment, which in this hypothetical example, suggests that there is a detectable difference between the features covered by the scheme and those not covered by an agreement.
The advantage of this approach is that it allows the effects to be seen square by square, and by implication by NCA and Landscape Type. In this way the contrasts between landscape types could be identified for different groups or types of feature. Moreover, while the example assumes that we have a simple dichotomous condition classes, a similar statistical analysis could be made for the landscape contribution of features if these were also collapsed into two classes.
The example also assumes that the analysis is made feature by feature. However, if there is insufficient data on particular features then either all the squares in an NCA could be aggregated and those proportions used. This would take us towards analytical design option 3, summarised in Table 2. Alternatively groups of features could be formed (e.g. all linear features) either at the square, NCA, or even Agricultural Landscape Type levels, if data resources were inadequate. A final possibility of the approach suggested is that the grouping of features that have been covered by an agreement or not, could be modified to include or exclude features covered by an historic scheme, or that are covered by HLS or ELS only, addressing specific points made in the brief. Depending on how the aggregation is done these arrangements of the data would also provide variations of strategy 1, 2 and 3.
In terms of the other analytical design options summarised in Table 2, it would appear that they would require considerable more data analysis that options 1, 2 and 3, and potentially a good deal of exploratory work to determine whether they are viable analytical options. Given the availability of the NAL data, then some qualitative analysis of differences between landscapes might be undertaken more rapidly, although the results would only be indicative, compared to the empirical outputs based on field survey data. Thus we suggest that analysis options 1, 2 and 3 are considered initially for the counter-factual analysis.
Conclusions
In order to make an assessment of the impact of Environmental Stewardship on landscape, we need to answer a number of questions. Not only do we need to determine whether appropriate options have been taken up in particular sorts of landscapes in sufficient amount to make a difference, but also that there is a clear improvement in the condition of features covered by an agreement compared to those outside a scheme. This latter issue is the main focus of the counterfactual analysis. Although more elaborate statistical designs might be implemented using the field data, this paper has suggested how a simple metric might be constructed to make a real and understandable comparison between features covered by an agreement and those outside a scheme. It has also shown how the analysis might usefully be extended to make an analysis across landscape types, and how contrasts between landscapes and types of feature might be identified. Further piloting of the approach to determine whether it can be implemented given the existing field data is required.
References
Boatman, N. et al (2008): A review of environmental benefits supplied by agri-environment schemes. Land Use Policy Group. FST20/79/041.
Ferraro, P. J. (2009): Counterfactual thinking and impact evaluation in environmental policy. In M. Birnbaum & P. Mickwitz (Eds.), Environmental program and policy evaluation. New Directions for Evaluation, 122, 75–84.

BD5303: Monitoring the effects of Environmental Stewardship on Landscape Character and Quality: Report 4
BD5303: Monitoring the effects of Environmental Stewardship on Landscape Character and Quality 32
Keene, M. and Pullin, A.S (2011): Realizing an effectiveness revolution in environmental management Journal of Environmental Management 92, 2130-2135.
Margoluis, R., Stem, C., Salafsky, N. and Brown, M. (2009): Design alternatives for evaluating the impact of conservation projects. In M. Birnbaum & P. Mickwitz (Eds.), Environmental program and policy evaluation: Addressing methodological challenges. New Directions for Evaluation, 122, 85–96.