BCRP Recreation and Aquatics Facility Analysis and Plan_FINAL_FINAL_2015_July 14
108
Recreation and Aquatics Facilities Analysis and Plan i Recreation and Aquatics Facility Analysis and Plan July 2015 Baltimor e City Recreation and Parks Department
-
Upload
katherine-brower -
Category
Documents
-
view
104 -
download
0
Transcript of BCRP Recreation and Aquatics Facility Analysis and Plan_FINAL_FINAL_2015_July 14
Recreation and Aquatics Facilities Analysis and Plan i
Recreation and Aquatics Facility Analysis and Plan July 2015
Baltimore City Recreation and Parks Department

ii Baltimore City Recreation & Parks Department

ACKNOWLEDGEMENTS
Office of the Mayor Mayor Stephanie Rawlings‐Blake Kaliope Parthemos, Chief of Staff¸ Mayor Stephanie Rawlings‐Blake Colin Tarbert, Deputy Mayor, Mayor’s Office of Neighborhood & Economic Development Leon Pinkett III, Assistant Deputy Mayor, Mayor’s Office of Neighborhood & Economic Development Baltimore City Recreation & Parks Project Leadership Team Tim Almaguer, Contract Compliance Manager Howard Aylesworth, President, Baltimore City Recreation Advisory Board Rashaan Brave, Division Chief, Youth & Adult Sports Kate Brower, Services Assessment Project Manager, Urban Planner, Capital Development Ernest W. Burkeen, Jr., Director Recreation and Parks Jacob Bustad, intern, Capital Development Yvonne Carter, Manager, Human Resources JoAnn Cason, Chief, Senior Division Sara Chaconas, Contracts Manager Gwen Chambers, Chief, Communications Stella Clanton, Recreation Programmer Robert Dallas, Chief, Security Erik Dihle, City Arborist Felecia Doucett, Southeast Recreation Area Manager Tracey Estep, Chief, Recreation Operations Molly Gallant, Outdoor Recreation Programmer Melissa Grim, Chief Horticulturist Mary Hardcastle, Volunteer Coordinator Tom Jeannetta, Chief of Parks Kenn King, Chief, Fiscal Services Victor Miranda, GIS Coordinator Jerilyn Saunders, Information Technology Director Gennady Schwartz, Chief, Capital Development Valerie Scott‐Oliver, Executive Assistant to the Director Francesca Spero, Chief, Permits, Special Events Scott Stanfill, Recreation Information Technology Darryl Sutton, Aquatics Director William Vondrasek, Deputy Director Robert Wall, Chief of Recreation Baltimore City Parks & Recreation Staff Project Consultant Team Chris Dropinski, Principal in Charge, GreenPlay, LLC Cindy Heath, Project Manager, GreenPlay, LLC Johnson, Mirmiran & Thompson/Albrecht Engineering, Inc., GIS Analysis
GreenPlay, LLC www.greenplayllc.com | 303‐439‐8369
Images: Baltimore City Recreation & Parks Department
Recreation and Aquatics Facilities Analysis and Plan iii

iv Baltimore City Recreation & Parks Department

TABLE OF CONTENTS I. Executive Summary ...........................................................................................................................1
A. Project Background .............................................................................................................................. 1 B. Project Methodology ............................................................................................................................ 5 C. Integration of Services Assessment Findings ....................................................................................... 7 D. Findings and Analysis ........................................................................................................................... 8 E. Recommendations .............................................................................................................................. 18 F. Conclusions and Next Steps ................................................................................................................ 19
II. Introduction ................................................................................................................................... 21
A. Overview ............................................................................................................................................ 21 B. Project Approach ................................................................................................................................ 21 C. Existing BCRP Recreation Centers and Aquatic Facilities Service Coverage ....................................... 22 D. Existing Aquatic Facility Scoring Results ............................................................................................ 32 E. Non‐BCRP Providers ........................................................................................................................... 34
III. Analysis Of Bcrp’s Existing Recreation Facilities Service Coverage .................................................. 41
A. Existing BCRP Service Area Gap Identification ................................................................................... 41 IV. Analysis Of BCRP’S Plan For Future Recreation Facilities Service Coverage ...................................... 49
A. Plan for Future Recreation Facilities .................................................................................................. 49 B. Planned School Community Spaces ................................................................................................... 54 C. Existing vs. Future Service Area Coverage .......................................................................................... 58 D. Unaddressed Gaps in Service Area Coverage .................................................................................... 59
V. A New Direction For Recreation Provision In Baltimore .................................................................. 63
A. Baltimore City Trends ......................................................................................................................... 63 B. Relevant National Trends – Facilities ................................................................................................. 64 C. Relevant National Trends – Programs ................................................................................................ 67 D. BCRP’s Services Assessment – Key Findings, Strategies, and Actions ................................................ 68 E. Integration of Recreation and Aquatics Facilities Analysis and Plan with Services Assessment ........ 70
VI. BCRP’S 2015 Recreation And Aquatic Facilities Plan ....................................................................... 73
A. Guiding Principles ............................................................................................................................... 73 B. Facility Types and Program Strategy .................................................................................................. 74 C. Recreation Program Strategy ............................................................................................................. 76 D. BCRP Recreation and Aquatics Facilities Plan 2015 ........................................................................... 76 E. Conclusions and Next Steps ................................................................................................................ 83
APPENDIX A: GIS DATASETS USED FOR ANALYSIS ................................................................................ 87 APPENDIX B: POTENTIAL FUTURE SERVICE PROVIDERS........................................................................ 91 APPENDIX C: LEVEL OF SERVICE MAPS AND TABLES ............................................................................ 93 APPENDIX D: MAYOR’S 2011 RECREATION CENTERS TASK FORCE REPORT (EXCERPT) ........................ 101
Recreation and Aquatics Facilities Analysis and Plan v
Table of Figures Figure 1: Existing v. Future Service Coverage for BCRP Facilities ............................................................................................................ 9 Figure 2: Existing vs. Future Service Area Coverage – BCRP & Non‐BCRP Providers ............................................................................. 10 Figure 3: Unaddressed Gaps in Service Area Coverage ......................................................................................................................... 11 Figure 4: BCRP Recreation and Aquatics Facilities Plan ......................................................................................................................... 16 Figure 5: BCRP Recreation and Aquatics Plan Coverage Area ............................................................................................................... 17 Figure 6: Existing BCRP Recreation Centers and Aquatic Facilities ........................................................................................................ 22 Figure 7: Existing BCRP Recreation Centers: Service Coverage and Amenity Scores ............................................................................. 32 Figure 8: Existing BCRP Aquatic Facilities Service Coverage and Amenity Scores ................................................................................. 33 Figure 9: Existing Non‐BCRP Provider Recreation Centers: Service Coverage ....................................................................................... 35 Figure 10: Existing BCRP and Non‐BCRP Provider Recreation Centers: Service Coverage ..................................................................... 37 Figure 11: Gaps in Existing BCRP Recreation Center Coverage.............................................................................................................. 42 Figure 12: Aggregated Scores for Gaps in Existing BCRP Recreation Center Coverage ......................................................................... 47 Figure 13: BCRP Recreation & Aquatics Facilities Plan .......................................................................................................................... 50 Figure 14: Plan for Future BCRP Recreation & Aquatics Facilities Service Area Coverage – Without Schools ...................................... 53 Figure 15: Plan for Future School Community Spaces with Service Area Coverage .............................................................................. 55 Figure 16: Plan for Future BCRP Operated Recreation Facilities Service Coverage ............................................................................... 56 Figure 17: Plan for All Future Recreation Service Coverage ‐ BCRP Operated, School‐Based Spaces and Non BCRP Providers............ 57 Figure 18: Existing vs. Future BCRP Recreation Facility Coverage ......................................................................................................... 58 Figure 19: Existing vs. Future Coverage by BCRP and Non BCRP Providers ……………….……..…………………………………………………………….. 59 Figure 20: Unaddressed Gaps in Service Area Coverage …………………………………………..……..…………………………………………………………….. 60 Figure 21: BCRP Recreation and Aquatics Facilities Plan 2015 ……………………………………………………………………………………………………….. 76 Figure 22: BCRP Recreation and Aquatics Facilities Plan Service Area Coverage 2015 ……..……………………………………………………………. 77 Figure 23: Citywide BCRP and Non BCRP Recreation Plan Service Area Coverage 2015…………………………………………………..……………… 78
Table of Tables Table 1: Existing Recreation Center Scoring Results ................................................................................................................................ 6 Table 2: Existing Aquatics Center Scoring Results ................................................................................................................................... 6 Table 3: Sample Scoring for BCRP Services Assessment .......................................................................................................................... 7 Table 4: Distribution of Baltimore City Recreation and Aquatic Facilities by Category ......................................................................... 24 Table 5: Assumed Access Type and Service Areas by Facility Category ................................................................................................. 24 Table 6: Summary of Service Area Definitions and Assumptions .......................................................................................................... 25 Table 7: Assumed Service Areas for Existing Recreation Facilities ........................................................................................................ 25 Table 8: Assumed Service Area Coverage for Existing Aquatic Facilities ............................................................................................... 26 Table 9: Recreation Center Amenities and Associated Scores .............................................................................................................. 27 Table 10: Aquatic Center Amenities and Associated Scores .................................................................................................................. 28 Table 11: Maximum Score for Existing Recreation and Aquatic Centers ............................................................................................... 28 Table 12: Summary of Existing Recreation Facilities by Score Category ................................................................................................ 30 Table 13: Summary of Existing Aquatic Facilities by Score Category ..................................................................................................... 33 Table 14: Non‐BCRP Providers by Type ................................................................................................................................................. 35 Table 15: Gap Scoring Criteria and Weighting ....................................................................................................................................... 43 Table 16: Proximity Criteria and Scoring ............................................................................................................................................... 44 Table 17: Coverage by Non‐BCRP Providers Criteria and Scoring .......................................................................................................... 44 Table 18: Planning and Development Initiatives Criteria and Scoring ................................................................................................... 45 Table 19: Population Criteria and Scores .............................................................................................................................................. 45 Table 20: Maximum Gap Scores and Weights ....................................................................................................................................... 45 Table 21: Future Center Types, Service Area Coverage, and Classification ........................................................................................... 52 Table 22: Planned School Community Spaces Service Area .................................................................................................................. 54 Table 23: Urban Community Center Comparisons ................................................................................................................................ 65 Table 24: Top 10 Worldwide Fitness Trends for 2007 and 2013 ........................................................................................................... 68 Table 25: BCRP Sample List of Services Indicated for Affirming Market Position .................................................................................. 71 Table 26: BCRP Sample List of Services Indicated for Advancing Market Position ................................................................................ 72 Table 27: BCRP Recreation and Aquatics Facilities Long Term Capital Plan .......................................................................................... 80 Table 28: New BCRP School Based Recreation Spaces .......................................................................................................................... 81 Table 29: BCRP Capital Projects With Identified Funding ...................................................................................................................... 82 Table 30: Capital Projects with Funding to be Identified ....................................................................................................................... 82 Table 31: Service Area User Base Statistics for Existing Recreation Centers ......................................................................................... 89 Table 32: Service Area User Base Statistics for Existing Aquatic Centers .............................................................................................. 90 vi Baltimore City Recreation & Parks Department

I. EXECUTIVE SUMMARY A. Project Background In 2011, Mayor Stephanie Rawlings‐Blake’s Task Force for Recreation Centers put forth the following vision for the City’s recreation centers in its final report: “To be a network of high‐quality facilities that offers diverse and accessible programs and services for personal growth, health, learning, and fun that enhances the quality of life in our communities.” Building on this vision, and considering existing plans for future recreation center and aquatic facilities, the Baltimore City Recreation and Parks Department (BCRP) undertook a data‐driven Recreation and Aquatics Facilities Analysis and Plan to determine the answers to the following questions:
• What facilities best meet Baltimore’s recreation center and aquatics needs in an equitable way? • What amenities are needed in future facilities? • How are the facilities located across the community? • How can new facilities support the use of active modes of travel? • What gaps in service exist throughout the community? • Where should future facilities be located?
Recreation and Aquatics Facilities Analysis and Plan 1
The level of service analysis conducted as part of the Recreation and Aquatics Facilities Analysis and Plan considered a variety of factors such as:
• Quality and Quantities of Amenities at Existing Facilities • Population • Proximity to Transit Stops • Proximity to Trails • Existing and Planned Development • Coverage by Non‐BCRP Providers
The Recreation and Aquatics Facilities Analysis and Plan provides an evaluation of the location and distribution of recreation centers and aquatics facilities as a network of public spaces to support BCRP’s programming needs as well as the Mayor’s city‐wide goals:
• Better Schools • Safer Streets • Stronger Neighborhoods • A Growing Economy • A Cleaner, Healthier City • Innovative Government
Concurrent with this analysis, a comprehensive Services Assessment was conducted to determine recommended market provision strategies for more than 170 programs and services currently being delivered by BCRP. Consideration was also given to planned community spaces identified in the Baltimore City Public School’s “21st Century Buildings Plan,” as well relationships with other providers of recreation services and potential operating partners.
2 Baltimore City Recreation & Parks Department

Recreation and Aquatics Facilities Analysis and Plan 3
The comprehensive Services Assessment informed BCRP’s direction and focus for programs and services moving forward for facilities, including existing recreation centers, and recommended amenities for future facilities. Both the Recreation and Aquatics Facilities Analysis and Plan and the Services Assessment were conducted in alignment with the existing BCRP Mission and Vision, as well as with information gathered in the citizen engagement process to identify future recreation needs. BCRP Mission The BCRP mission articulates the Department’s “reason for existence,” and encompasses selected values identified by the community:
BCRP Vision To build a stronger Baltimore one community at a time through: Conservation: Parks are critical in the role of preserving natural resources that have real economic benefits for communities. We are the leaders (often the only voice in communities) for protecting open space, connecting children to nature, and providing education and programming that helps communities engage in conservation practices. Health and Wellness: BCRP leads Baltimore in improving the overall health and wellness of communities. We are essential partners in combating some of the most complicated and expensive challenges our city faces – poor nutrition, obesity, and physical inactivity. Social Equity: Universal access to public parks and recreation is a right, not just a privilege. Every day, we are working hard to ensure that all members of our community have access to the resources and programming we offer.
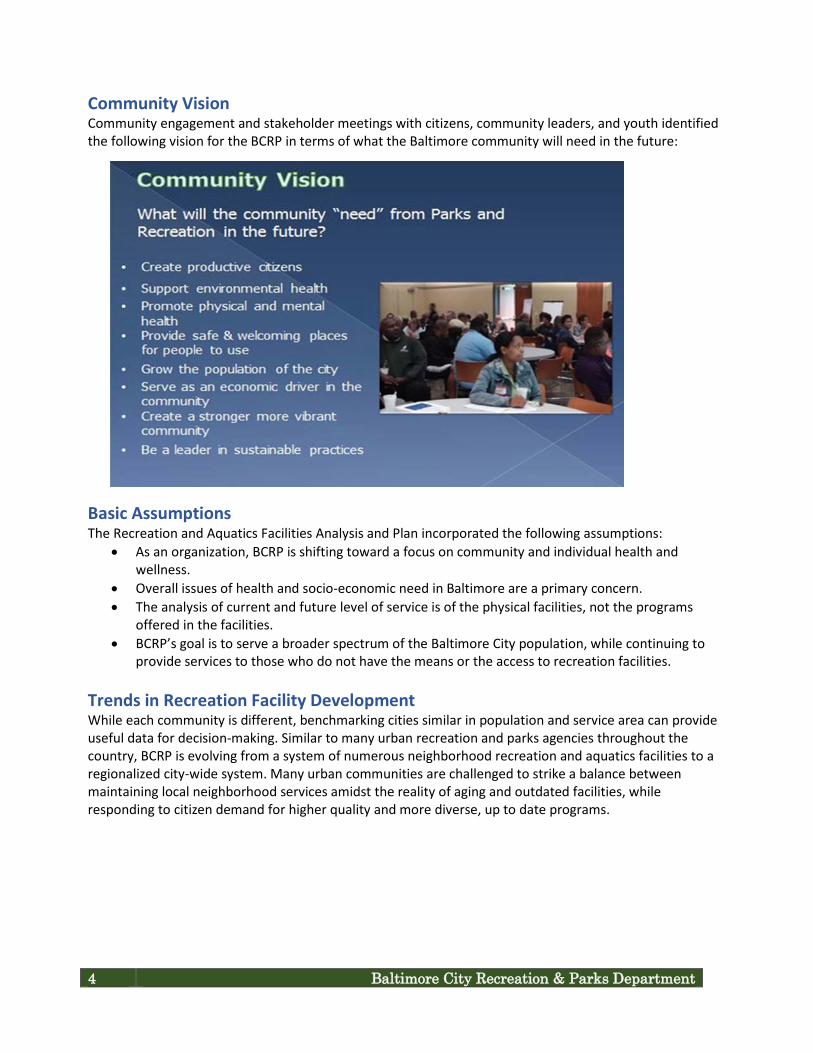
Community Vision Community engagement and stakeholder meetings with citizens, community leaders, and youth identified the following vision for the BCRP in terms of what the Baltimore community will need in the future:
Basic Assumptions The Recreation and Aquatics Facilities Analysis and Plan incorporated the following assumptions:
• As an organization, BCRP is shifting toward a focus on community and individual health and wellness.
• Overall issues of health and socio‐economic need in Baltimore are a primary concern. • The analysis of current and future level of service is of the physical facilities, not the programs
offered in the facilities. • BCRP’s goal is to serve a broader spectrum of the Baltimore City population, while continuing to
provide services to those who do not have the means or the access to recreation facilities. Trends in Recreation Facility Development While each community is different, benchmarking cities similar in population and service area can provide useful data for decision‐making. Similar to many urban recreation and parks agencies throughout the country, BCRP is evolving from a system of numerous neighborhood recreation and aquatics facilities to a regionalized city‐wide system. Many urban communities are challenged to strike a balance between maintaining local neighborhood services amidst the reality of aging and outdated facilities, while responding to citizen demand for higher quality and more diverse, up to date programs.
4 Baltimore City Recreation & Parks Department
B. Project Methodology To determine gaps in service delivery for recreation centers and aquatics facilities, existing facilities were inventoried, scored, and ranked based on existing amenities, and maps were generated to illustrate existing service area coverage. Gaps in coverage were identified as areas where there was no coverage at all by existing BCRP recreation centers, or coverage was provided by low scoring centers. The gaps were scored to illustrate desirability for placement of new facilities based on several factors:
• Proximity to multi‐use trails and public transit • Coverage by Non‐BCRP Providers • Existence of City Planning and Development Initiatives • Population
Service areas in the Department’s plan for future BCRP facilities and planned school community spaces were evaluated against these service gap scores, and unaddressed gaps were identified as areas for further review and consideration for new recreation centers. Areas identified with little or no recreational services (“unaddressed gaps”) were reviewed and subsequently addressed in the final plan. A total of 16 GIS data layers from various sources including Environmental Systems Research Institute (ESRI), 2010 U.S. Census, 2012 American Community Survey (ACS), Baltimore City Planning and Housing Departments, and BCRP were used in the compilation of service area summary statistics, scoring of existing centers, and scoring of service gaps to assist in the future site selection process. BCRP staff provided assistance in scoring existing facility amenities including multi‐purpose spaces, fitness, aquatic facilities, outdoor spaces, and outdoor athletic complexes, as well as proximity to transit services and trails. Existing Recreation Center Scoring The scoring analysis resulted in six recreation centers with a high score, 24 recreation centers with a medium score, and 10 recreation centers with a low score. Patterson Park scored the highest with a score of 33 (out of a maximum of 46 points), while James Mc Henry scored the lowest with a score of seven. A detailed scoring analysis is provided in Table 1. Recreation and Aquatics Facilities Analysis and Plan 5

Table 1: Existing Recreation Center Scoring Results Score Category Existing Recreation Centers
High (21 – 33) 6 Centers
C.C. Jackson Chick Webb Clifton Park (Rita Church) Ella Bailey Patterson Park (Virginia S. Baker) Roosevelt
Medium (13 – 20) 24 Centers
Bentalou Lakeland Cahill Lillian Jones Coldstream Locust Point Collington Square Madison Square Edgewood‐Lyndhurst Medfield Farring‐Baybrook Morrell Park Fort Washington Mora Crossman Fred B. Leidig Mount Royal Gardenville Northwood Greenmount Oliver Herring Run Robert C. Marshall John Eager Howard Woodhome
Low (7 – 12) 10 Centers
Carroll F. Cook James McHenry Cecil‐Kirk Mary E. Rodman Curtis Bay Patapsco DeWees Samuel F.B. Morse James D. Gross Solo Gibbs
Existing Aquatic Facility Scoring The scoring analysis resulted in nine aquatic centers with a high score, two aquatic centers with a medium score, and 12 aquatic centers with a low score. Callowhill and Cherry Hill Indoor Pools scored the highest with a score of 14 (out of a maximum of 22 points), while North Harford Spray Pad scored the lowest with a score of two. A detailed scoring analysis is provided in Table 2. Table 2: Existing Aquatics Center Scoring Results
Score Category Existing Aquatic Centers
High (8 – 14) 9 centers
Callowhill Cherry Hill Indoor Cherry Hill Splash Chick Webb
Clifton Druid Hill Patterson Riverside Roosevelt
Medium (6 – 7) 2 centers
Ambrose Kennedy William McAbee
Low (2 – 5) 12 centers
C.C. Jackson Central Rosemont City Springs Coldstream Farring‐Baybrook Greater Model
Liberty North Harford O'Donnell Heights Towanda Solo Gibbs Walter P. Carter
6 Baltimore City Recreation & Parks Department
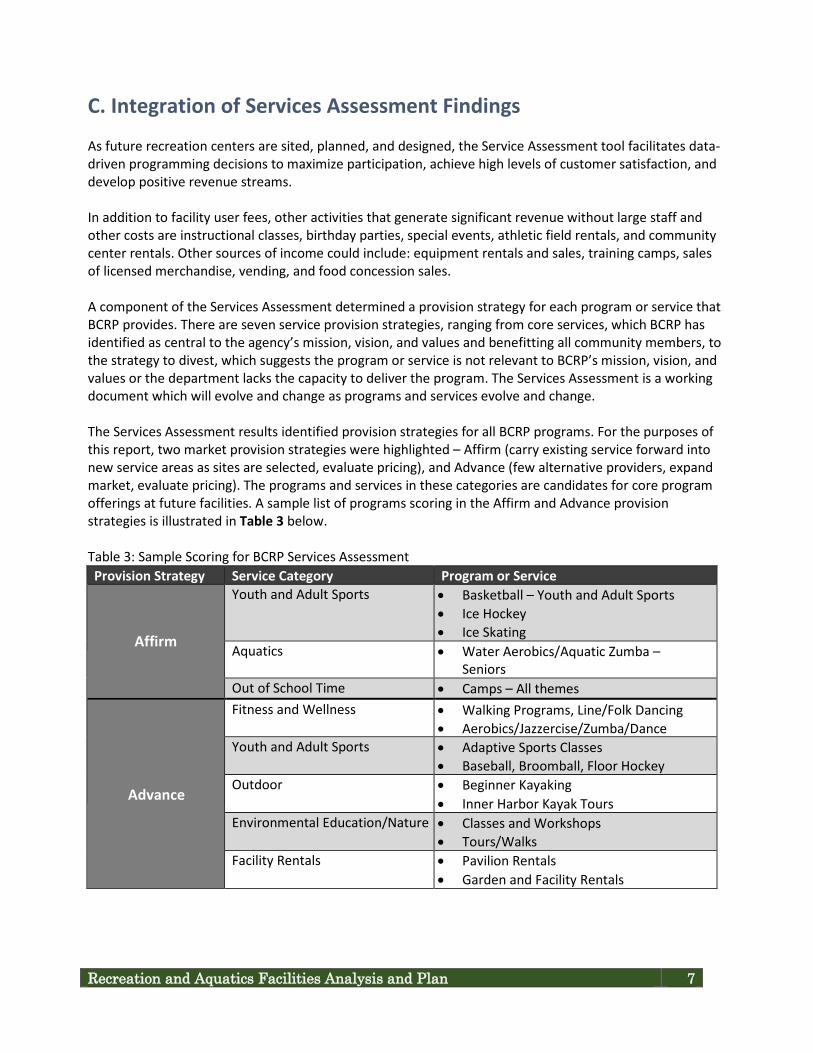
C. Integration of Services Assessment Findings As future recreation centers are sited, planned, and designed, the Service Assessment tool facilitates data‐driven programming decisions to maximize participation, achieve high levels of customer satisfaction, and develop positive revenue streams. In addition to facility user fees, other activities that generate significant revenue without large staff and other costs are instructional classes, birthday parties, special events, athletic field rentals, and community center rentals. Other sources of income could include: equipment rentals and sales, training camps, sales of licensed merchandise, vending, and food concession sales. A component of the Services Assessment determined a provision strategy for each program or service that BCRP provides. There are seven service provision strategies, ranging from core services, which BCRP has identified as central to the agency’s mission, vision, and values and benefitting all community members, to the strategy to divest, which suggests the program or service is not relevant to BCRP’s mission, vision, and values or the department lacks the capacity to deliver the program. The Services Assessment is a working document which will evolve and change as programs and services evolve and change. The Services Assessment results identified provision strategies for all BCRP programs. For the purposes of this report, two market provision strategies were highlighted – Affirm (carry existing service forward into new service areas as sites are selected, evaluate pricing), and Advance (few alternative providers, expand market, evaluate pricing). The programs and services in these categories are candidates for core program offerings at future facilities. A sample list of programs scoring in the Affirm and Advance provision strategies is illustrated in Table 3 below. Table 3: Sample Scoring for BCRP Services Assessment Provision Strategy Service Category Program or Service
Affirm
Youth and Adult Sports • Basketball – Youth and Adult Sports • Ice Hockey • Ice Skating
Aquatics • Water Aerobics/Aquatic Zumba – Seniors
Out of School Time • Camps – All themes
Advance
Fitness and Wellness • Walking Programs, Line/Folk Dancing • Aerobics/Jazzercise/Zumba/Dance
Youth and Adult Sports • Adaptive Sports Classes • Baseball, Broomball, Floor Hockey
Outdoor • Beginner Kayaking • Inner Harbor Kayak Tours
Environmental Education/Nature • Classes and Workshops • Tours/Walks
Facility Rentals • Pavilion Rentals • Garden and Facility Rentals
Recreation and Aquatics Facilities Analysis and Plan 7

D. Findings and Analysis Mapping the current and future service area coverage of the recreation and aquatic facilities revealed two areas of Baltimore considered to be unaddressed gaps in service needing further analysis relative to future BCRP facility siting opportunities. Aquatic facilities were analyzed for current service area coverage only, as most future recreation centers will include aquatic facilities. The graphic representation of the results is represented by the following symbology: MAP SYMBOLOGY Recreation Center Scores (as evaluated by BCRP staff)
• Green = High Level of Service • Orange = Medium Level of Service • Red = Low Level of Service
Gap Scores (as defined by the factors in the model) • Brown = More desirable for siting recreation center • Orange = Desirable for siting recreation center • Yellow = Less desirable for siting recreation center
= Future BCRP Recreation Center Round service areas
• ½ mile distance in any direction • Primary access = walking or bicycling
• Non‐Circular service areas • 1 mile driving distance along street network • Primary access = vehicle
Map symbology may also be found in Appendix C: Level of Service Maps and Tables. 8 Baltimore City Recreation & Parks Department
Recreation and Aquatics Facilities Analysis and Plan 9
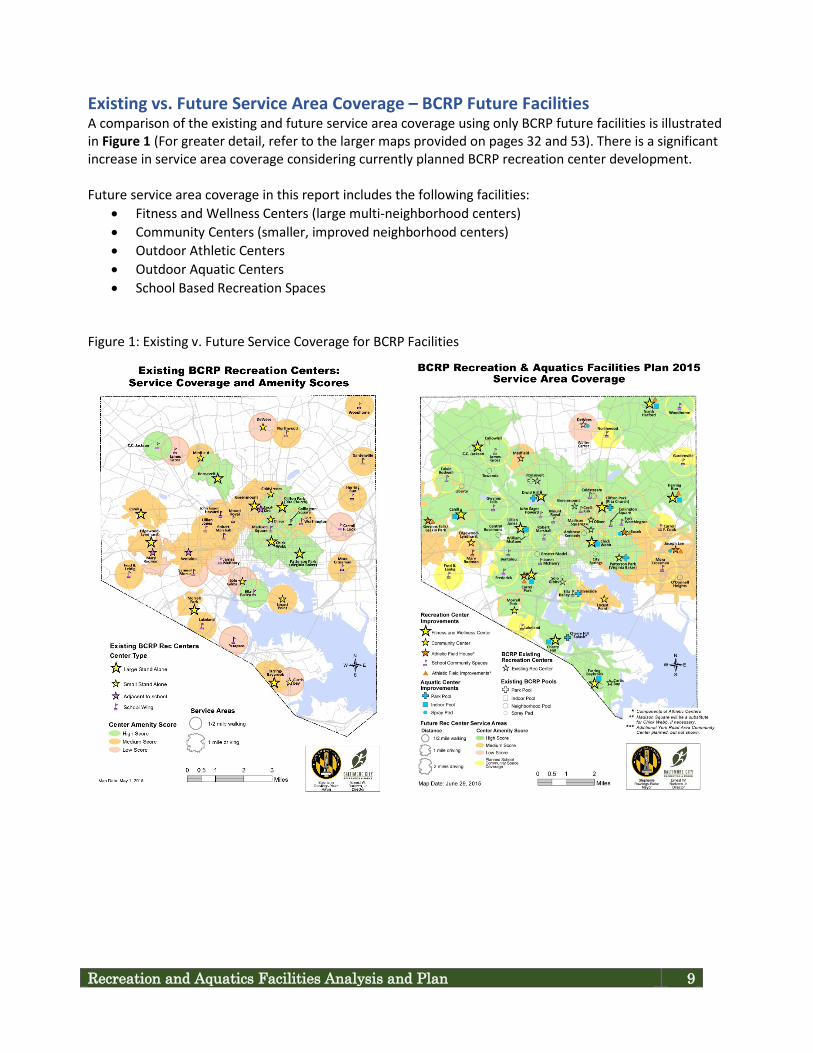
Existing vs. Future Service Area Coverage – BCRP Future Facilities A comparison of the existing and future service area coverage using only BCRP future facilities is illustrated in Figure 1 (For greater detail, refer to the larger maps provided on pages 32 and 53). There is a significant increase in service area coverage considering currently planned BCRP recreation center development. Future service area coverage in this report includes the following facilities:
• Fitness and Wellness Centers (large multi‐neighborhood centers) • Community Centers (smaller, improved neighborhood centers) • Outdoor Athletic Centers • Outdoor Aquatic Centers • School Based Recreation Spaces
Figure 1: Existing v. Future Service Coverage for BCRP Facilities

10 Baltimore City Recreation & Parks Department
Existing vs. Future Service Area Coverage – BCRP & Non‐BCRP Providers Considering Non‐BCRP Providers is an important step toward a holistic, collaborative approach to providing recreation and parks service delivery throughout Baltimore. For example, the Baltimore City “Public Schools 21st Century Building Plan” has been approved by the Board of School Commissioners, and a construction timeline has been established. A comparison of the existing and future plan for recreation service area coverage by BCRP and Non‐BCRP Providers is illustrated in Figure 2 (see larger maps on pages 37 and 57). Figure 2: Existing vs. Future Service Area Coverage – BCRP & Non‐BCRP Providers
Recreation and Aquatics Facilities Analysis and Plan 11
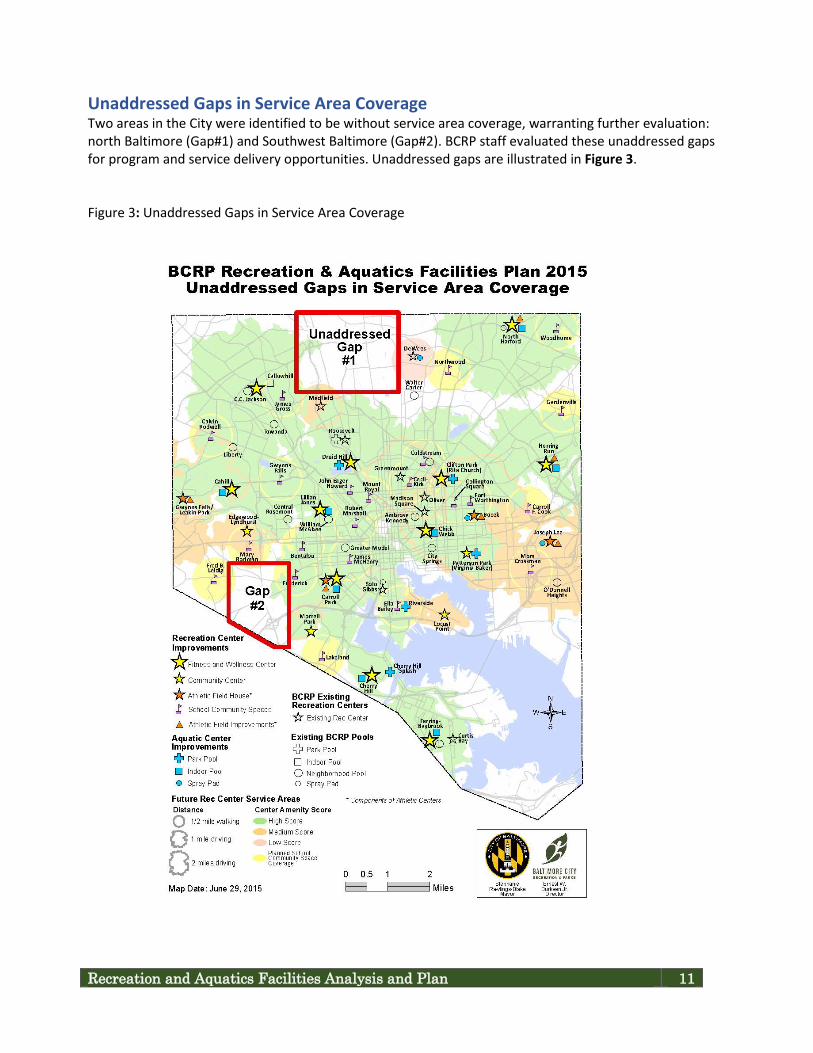
Unaddressed Gaps in Service Area Coverage Two areas in the City were identified to be without service area coverage, warranting further evaluation: north Baltimore (Gap#1) and Southwest Baltimore (Gap#2). BCRP staff evaluated these unaddressed gaps for program and service delivery opportunities. Unaddressed gaps are illustrated in Figure 3. Figure 3: Unaddressed Gaps in Service Area Coverage

While gaps in service were identified in this report, the specific siting of future community centers should consider the following strategies based on the findings and recommendations of the Services Assessment and Recreation and Aquatics Facilities Analysis and Plan:
• Consider the demographic makeup of identified unaddressed gap areas. • Determine if staffing for the plan should be modified to address gaps. • Determine criteria to address duplication of services at schools with non‐BCRP providers. • Explore policy issues regarding use of City resources that support non‐BCRP providers to ensure
adequate service provision. For Gap #1 this plan recommends a new community center be located along or to the east of the York Road Corridor to provide additional coverage to the east of Gap #1. At the time of this report, a specific site has not been identified. For Gap #2, there are current redevelopment plans for the former Cardinal Gibbons high school site, which include recreational amenities such as a multi‐purpose synthetic turf field and potential YMCA center. If the YMCA center does not materialize, BCRP will review the recreational needs for the area and implement programs to address recreational needs. After the new BCRP centers are opened, staff will evaluate the new landscape of recreation services, and if necessary, repurpose underutilized facilities and programs to meet local recreation and parks needs to be determined in consultation with the local communities. A holistic approach to planning and designing future BCRP community centers should consider program and service delivery, market position, and pricing strategies. School based program specifics will be coordinated with Baltimore City Public Schools and the individual schools, with a focus on active youth programs and recreation experiences.
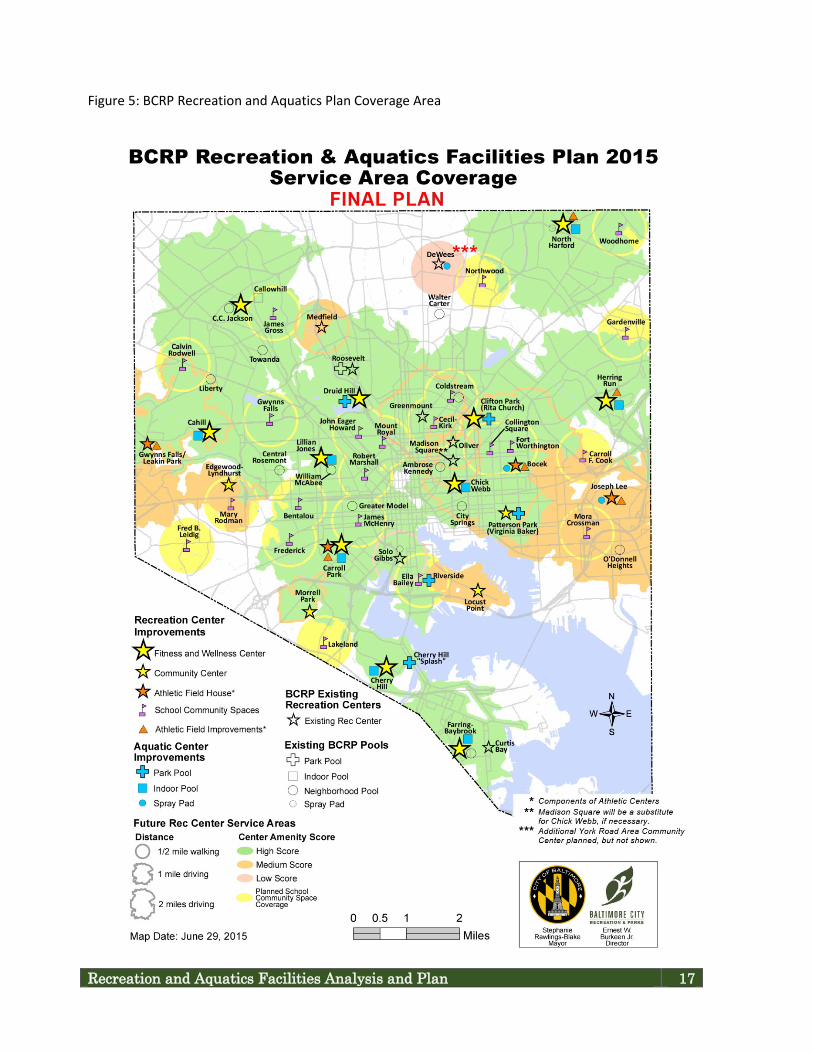
E. BCRP’s 2015 Recreation and Aquatic Facilities Plan The outcome of the gap analysis process has informed the development of a comprehensive, data driven plan for recreation center and aquatics facilities, as illustrated in Figure 4. The 2015 Recreation and Aquatic Facilities Plan addresses currently underserved areas in the city by ensuring that recreation services are provided by BCRP facilities and or private Non‐BCRP facilities to ensure a full coverage of recreational services citywide, as illustrated in Figure 5. Guiding Principles The recreation and aquatics facility and program plan builds on the recommendations outlined in the Mayor’s 2011 Recreation Center Task Force Report and the Department’s Implementation Plan. The plan is further guided by the following principals and priorities:
• Equitable Citywide Distribution. Locate facilities with equitable geographic distribution throughout the city to serve all residents.
• Address Gaps in Service. Create new facilities where needed to address existing lack of recreation opportunities.
• Focus on Quality over Quantity of Facilities. Maximize the use and improvement of recreation facilities for future programming and use.
• Locate Recreation and Aquatic Facilities in or next to Existing Parks, Athletic Fields, and Schools.
12 Baltimore City Recreation & Parks Department

Co‐locate facilities to integrate multi‐activity programming and operations and to maximize facility use.
• Program for all Age Groups and Socio‐Economic Levels. Expand recreation programs beyond after school programs to focus on all age groups, individuals, families, seniors, and communities.
• Access to Public Transportation. Locate facilities near existing bus, subway, and light rail services; park trails; and bicycle routes to ensure easy access with or without cars.
• Promote Recreation and Health. Promote recreation as part of an active, healthy lifestyle and as a method to address obesity. Align with the Mayor’s and Department of Health’s goals for Healthy Baltimore 2015.
• Support the Mayor’s Goal to Increase the City’s Population by 10,000 Families. Provide attractive, state‐of‐the‐art recreation facilities and programs to serve existing residents and attract new residents to Baltimore and to grow the City’s tax base.
• Collaborate with Non‐BCRP Recreation Providers. Work with Non‐BCRP recreation providers to expand recreation resources to Baltimore City residents.
• Locate Facilities to Support Areas Targeted For Public Investment. Locate recreation facilities in or near areas with current and future plans for public investment, including the Red Line light rail line, new mixed use and housing development, 21st Century Schools, and targeted economic investment.
Facility Types and Program Strategy The new facilities in the Recreation and Aquatics Facilities Plan are different from BCRP’s existing facilities. The plan will upgrade, expand, and restructure existing recreation center facilities to function as multi‐ activity and multi‐generational complexes, making use of existing BCRP components, including parks, outdoor athletic fields, field houses, outdoor pools, and splash pads. The new Fitness and Wellness Centers are larger in square footage, offer more programming with longer operating hours, and incorporate an indoor pool. The new facilities are also projected to generate revenue. They will be located in or adjacent to parks with access to outdoor athletic fields and recreational facilities (outdoor pool, skate park, park trails, etc.) depending upon the park. These locations will offer extended morning and evening operating hours and a full range of programs to attract and serve all age groups. The centers will serve as a hub for a range of recreational activities including fitness and wellness, aquatics, youth and adult sports, environmental education, and active outdoor programs. Outdoor Athletic Centers comprised of athletic fields and field houses will support BCRP core programs, relieve the overuse of many existing athletic fields, and provide additional opportunities for programming and revenue generation. Existing recreation centers will continue to provide programs at current levels. After the newer types of centers are opened, BCRP will re‐evaluate the programming offerings within the new landscape of recreation services, and if necessary, repurpose underutilized facilities and programs to serve other unmet local recreation and park needs. All plans for facility re‐use will be determined in consultation with the local community. An additional 22 school‐based community spaces are planned in conjunction with Baltimore City Public Schools’ (BCPSS) “21st Century Building Plan.” Nineteen (19) of these spaces are at locations with existing recreation centers, and three (3) will be new recreation program spaces. The 22 recreation spaces will be planned, reconfigured, and programmed together with BCPSS’s funded building plan.
Recreation and Aquatics Facilities Analysis and Plan 13

The capital plan identifies a combination of community center types and park locations for existing facility upgrades or new construction projects. Facilities are categorized into specific types: Fitness and Wellness Centers (11), Community Centers (5), Outdoor Athletic Centers (4), School‐Based Recreation Spaces (22), Outdoor Pools and Spray Pads (8) and Indoor Pools (8). Fitness and Wellness Centers Fitness and Wellness centers are recreation facilities that are located in or near parks, other recreational facilities, and athletic fields. These larger (30,000+ s.f.), full‐service centers will provide multiple programs and activities for all ages, extended hours of operation in the mornings and afternoons, and 6 ‐ 7 day operations. The centers will include spaces such as fitness areas, dance and multi‐purpose rooms, a gymnasium, and men’s and women’s locker rooms. Several of the new facilities will include indoor pools. The wide variety of programming will be designed for individuals, teens, youth, adults, active older adults, and families and will attract residents citywide. Community Centers Community centers are recreation facilities that located in or near parks, other aquatics facilities, and athletic fields. These smaller centers (less than 30,000 s.f.) will provide a range of programs and activities for all ages with extended hours of operation. The facilities will vary in size and programming depending upon location. Expanded spaces may include a fitness room, dance spaces, multi‐purpose rooms, lobby and circulation areas, and men’s/women’s changing rooms/bathrooms. Programming will likely serve more local residents. Outdoor Athletic Centers Outdoor athletic centers are focused around team field sports, playgrounds, and fitness facilities and are located in parks. Seasonal athletic centers will vary in facilities, size, and programming depending upon location. Facilities may include a field house, lighted athletic artificial turf fields, grass fields, a playground, outdoor spray pad, walking loop, and fitness stations and parking. Some of these facilities will operate on a seasonal basis with a strong focus on outdoor recreation programs and will support summer day camp activities. School‐Based Recreation Spaces School‐based recreation spaces will offer local recreation programs and activities operated in multi‐purpose spaces housed within Baltimore City Public Schools’ new 21st Century school buildings. BCRP will provide recreation programming at levels to be determined in conjunction with the local community and school needs. Outdoor Pools and Spray Pads The larger outdoor pools are located in major parks. These citywide facilities will be upgraded and renovated to improve bathhouse and pool facilities and provide new water park features. This will bring the facilities up to current industry standards. Several new stand‐alone water spray pads will be built to serve outdoor athletic centers and parks and expand access to outdoor water features during the warmer months. These facilities, with interactive water features and jet sprays, will be open to all and operate with part time aquatic staffing. The spray pads serve a wide range of ages, including adults. All existing outdoor neighborhood pools will remain open and continue to operate with current programming. As new facilities open in the future, these facilities will be reevaluated to determine how they can best serve community and area needs for parks and recreation.
14 Baltimore City Recreation & Parks Department

Indoor Pools Indoor Pools are a new component of the Recreation and Aquatics Plan. The Department currently has three facilities and plans to include several new indoor pool facilities as part of the Fitness and Wellness Centers. These new citywide facilities will be open year round and focus on learn to swim programming, leisure and active play areas for all ages, individuals and families.
Recreation Program Strategy Programming at the new community center complexes and facilities will build upon the Department’s vision to support active, healthy lifestyles. Communities will be encouraged to participate in the design and program development of the centers. Fitness and Wellness classes will be a new program component of the community centers. Youth and Teen Programs will focus on a range of active programs (martial arts, dance, and active recreation) as well as cultural (art and theater workshops), social, and after‐school programs. All programs will generally be registration‐based to ensure adequate enrollment. BCRP Summer camps will continue to be provided and expanded to include additional activities drawing upon BCRP’s citywide facilities and programs. Youth and Adult Team Sports will include special skill‐based sports clinics and competitive sports leagues in conjunction with BCRP’s Youth and Adults Sports programs. Non‐competitive sports team options will also be available for those who do not want to compete. Active Older Adult programs will include fitness and wellness classes, social events, trips, educational, and craft related activities. Family Programs will include social activities (movie nights), active activities (dance), and healthy lifestyle related events. Specific programs will vary by center and by season. Aquatics Programs will be expanded as the new community center facilities with indoor pools are developed. Programs will focus on learn to swim, aqua aerobics, competitive swim team development, and life guard training. Programs will be offered at BCRP facilities and at some Baltimore City Public School facilities, to be determined.
Recreation and Aquatics Facilities Analysis and Plan 15

16 Baltimore City Recreation & Parks Department
Figure 4: BCRP Recreation and Aquatics Facilities Plan
Recreation and Aquatics Facilities Analysis and Plan 17
Figure 5: BCRP Recreation and Aquatics Plan Coverage Area
Capital and Operating Costs The capital costs to implement the full plan have been estimated by BCRP staff to be $136.05 million in current dollars. Full implementation of the plan is dependent upon available funding and may take 10‐15 years. As a result, estimated costs will have to be adjusted to reflect actual costs at the time. Capital funds are anticipated to come from a variety of State, City General, and Bond Funds, as well as Table Games and Casino Revenues. If the proceeds from the sale of municipal garages is made available, implementation of the plan can be accomplished within a shorter time frame. Implementation of the plan has already begun. Operating costs for BCRP’s existing recreation centers vary, but on average run annually between $225,000 and $300,000 per center. BCRP’s existing aquatic facilities include both indoor and outdoor. The indoor pools generally operate nine months out of the year with individual operating budgets of $259,000. The outdoor facilities include major park pools, neighborhood pools, and spray pads and are open from Memorial Day to Labor Day. Annual operating costs per location are $110,000 for the park pools, $9,000 for the neighborhood pools, and $5,500 for each spray pad. The new Fitness and Wellness facilities in the Recreation and Aquatics Facilities Plan are larger in square footage, offer more programming with longer operating hours, incorporate an indoor pool and are projected to generate revenue. Calculations project operation of the new centers to be just over $1 million annually with between $40,000 and $80,000 in revenue, depending upon the center location and amenities. Together with BCRP’s reorganization of its staffing structure, the new facilities will begin to impact BCRP’s overall recreation center operating budget, incrementally, starting in FY 2017 based on the projects that have already been capital funded to date. The budget savings that will occur from the reorganization of existing aquatic and recreation center facilities will be used to offset the recreation operating costs of the agency.
E. Recommendations The integration of the Services Assessment and the Recreation and Aquatics Facilities Analysis and Plan facilitates a straight forward approach to recommendations. These recommendations include the following: Continue to Evaluate Future Facility Amenities BCRP should continue to evaluate program and service opportunities for those areas of the City identified as having unaddressed gaps in recreation service as well as those with adequate coverage. For the purposes of this report, the following amenities may be considered a baseline, and align with the programs and services identified in the “Advance Market Position” strategy discussed in Section V with regard to the Integration of the Recreation and Aquatics Facilities Analysis and Plan with the Services Assessment:
• Fitness Equipment and Room • Gym • Multi‐Purpose Room • Pool (Indoor or Outdoor)
18 Baltimore City Recreation & Parks Department
Recreation and Aquatics Facilities Analysis and Plan 19
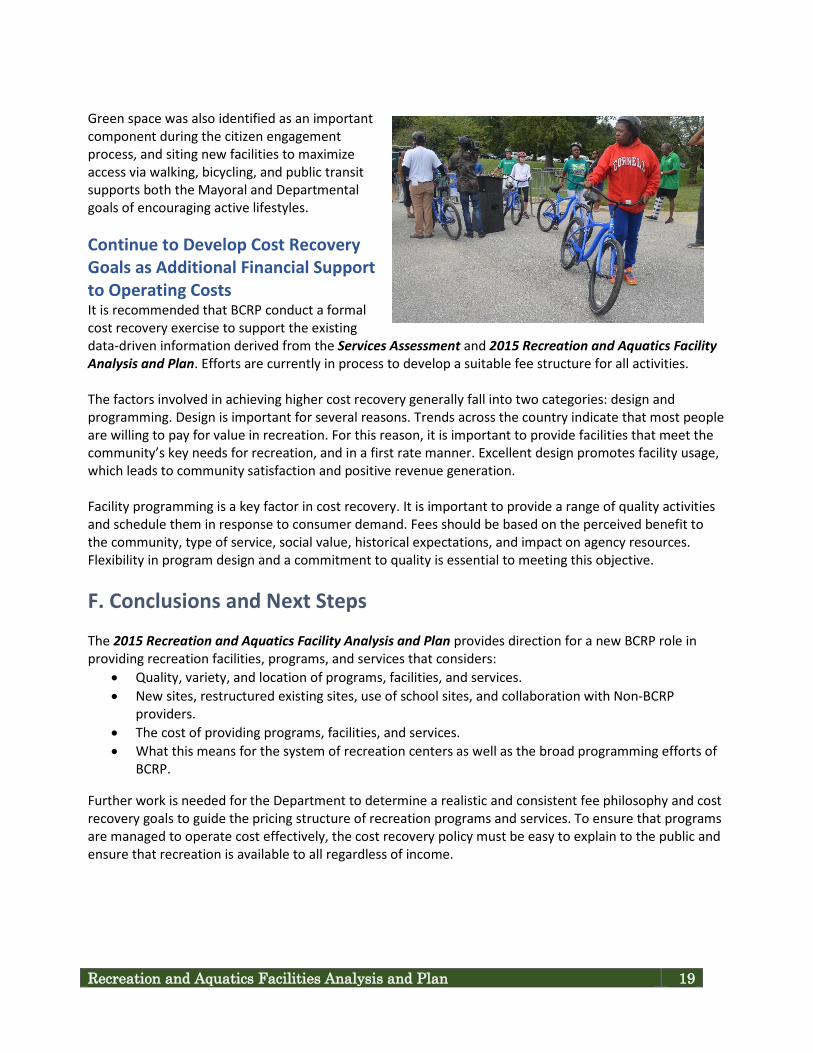
Green space was also identified as an important component during the citizen engagement process, and siting new facilities to maximize access via walking, bicycling, and public transit supports both the Mayoral and Departmental goals of encouraging active lifestyles.
Continue to Develop Cost Recovery Goals as Additional Financial Support to Operating Costs It is recommended that BCRP conduct a formal cost recovery exercise to support the existing data‐driven information derived from the Services Assessment and 2015 Recreation and Aquatics Facility Analysis and Plan. Efforts are currently in process to develop a suitable fee structure for all activities. The factors involved in achieving higher cost recovery generally fall into two categories: design and programming. Design is important for several reasons. Trends across the country indicate that most people are willing to pay for value in recreation. For this reason, it is important to provide facilities that meet the community’s key needs for recreation, and in a first rate manner. Excellent design promotes facility usage, which leads to community satisfaction and positive revenue generation. Facility programming is a key factor in cost recovery. It is important to provide a range of quality activities and schedule them in response to consumer demand. Fees should be based on the perceived benefit to the community, type of service, social value, historical expectations, and impact on agency resources. Flexibility in program design and a commitment to quality is essential to meeting this objective. F. Conclusions and Next Steps The 2015 Recreation and Aquatics Facility Analysis and Plan provides direction for a new BCRP role in providing recreation facilities, programs, and services that considers:
• Quality, variety, and location of programs, facilities, and services. • New sites, restructured existing sites, use of school sites, and collaboration with Non‐BCRP
providers. • The cost of providing programs, facilities, and services. • What this means for the system of recreation centers as well as the broad programming efforts of
BCRP. Further work is needed for the Department to determine a realistic and consistent fee philosophy and cost recovery goals to guide the pricing structure of recreation programs and services. To ensure that programs are managed to operate cost effectively, the cost recovery policy must be easy to explain to the public and ensure that recreation is available to all regardless of income.

20 Baltimore City Recreation & Parks Department

Recreation and Aquatics Facilities Analysis and Plan 21
II. INTRODUCTION Baltimore City Recreation and Parks (BCRP) is steadily moving toward a data‐driven approach to effectively analyze and plan future programs, facilities, and services. The Recreation and Aquatics Facilities Analysis and Plan is representative of this approach in that it systematically assesses existing physical facilities service coverage to determine geographic gaps. The goal of the Recreation and Aquatics Facilities Analysis and Plan is to:
• Provide the rationale for BCRP’s approach to the recreation center strategy. • Outline the strategy, specific locations for future facilities, and program focus. • Present a recreation and aquatic facilities plan with projected capital and operating costs.
A. Overview BCRP desires to provide high quality recreation facilities and an equitable level of recreation services for Baltimore citizens. To accomplish this goal, the Recreation and Aquatics Facilities Analysis and Plan was conducted concurrently with a Services Assessment, a comprehensive analysis of recommended market provision strategies for more than 170 BCRP programs and services. Taken together, both reports inform the Department’s plan for recreation and aquatic facilities and programs. These reports follow the completion of the 2011 Recreation Center Task Force and Implementation Plan to address the Mayor’s call for quality over quantity in Baltimore City’s recreation centers, and emphasize a collaborative vision to achieve a high level of recreation program and service delivery for the entire community. B. Project Approach To determine existing recreation service coverage in Baltimore City, BCRP and Non‐BCRP recreation facilities were mapped to reflect the distances travelled by the predominant users of the facilities. BCRP recreation facilities were also scored and ranked by the amenities provided. Gaps in existing recreation service coverage in the City were identified and evaluated as to their desirability to locate additional recreation facilities or programming. A future recreation and aquatics facilities plan developed by the Department was then overlaid on the existing gap assessment to determine the adequacy of the Department’s projected citywide coverage. The analysis results informed revisions to address underserved areas of the city with recreational programs. The Department’s 2015 Recreation and Aquatic Facilities Plan is outlined in this document.
The study and analysis process made use of high level GIS which included a customized scoring and weighting system, developed in collaboration with BCRP staff, to rank the existing and future recreation facilities, coverage areas, evaluate the gaps and map the results. The following relevant city plans were reviewed to inform the service coverage analysis:
• Baltimore City Healthy Baltimore Plan (2015) • BCRP Services Assessment (2015) • Baltimore City Aquatics Master Plan Health Impact Assessment (2013) 7.20.2014 Draft • BCRP Aquatics Facilities Plan (2013) (not formally released) • Baltimore City Public Schools 21st Century Buildings Plan (2012) • Mayor’s Recreation Center Task Force Report and Implementation Plan (2011) • Red Line Transportation Plan (2011) • Health Indices – Baltimore City Health Department (2011) • 2011 Recreation Center Task Force Report and Implementation Plan
GIS Data Layers Used A number of GIS data layers, described in Appendix A: GIS Datasets Used for Analysis, were used to compile service area summary statistics, existing recreation center scores, and service gaps scores to assist in the future site selection process. Data was obtained from BCRP, the City of Baltimore Departments of Planning and Housing Community Development, the U.S. Census 2010, ESRI, and American Community Survey 2012. The inventory, scoring, and ranking analysis of BCRP’s existing 40 recreation centers and 23 aquatic facilities was developed using multiple data sets. A gap analysis of current service area coverage was performed and potential future coverage was qualitatively evaluated against the scored gaps. Future coverage was assumed to include services provided by the facilities listed in Appendix B: Potential Future Service Providers. The analysis resulted in the identification of two areas deemed by the City to be underserved, with consideration of opportunities for the location of future recreation facilities and/or programs. These were evaluated by BCRP staff and informed the Recreation and Aquatic Facilities Analysis and Plan. C. Existing BCRP Recreation Centers and Aquatic Facilities Service
Coverage As of September 2014, BCRP operated 40 recreation centers and 23 aquatic facilities, all of which were included in the assessment of existing service area coverage, as illustrated in Figure 6. Figure 6: Existing BCRP Recreation Centers and Aquatic Facilities 22 Baltimore City Recreation & Parks Department

Methodology
Recreation and Aquatics Facilities Analysis and Plan 23

The existing recreation and aquatics facilities were categorized and scored, based on a system developed with BCRP staff. The results were mapped to illustrate the existing service area coverage in the BCRP recreation center and aquatic facilities system. Each facility was assigned a classification based on type (Recreation or Aquatic) and building or facility category. Recreation Facilities were categorized as School Wing, Adjacent to a School, Small Stand Alone, or Large Stand Alone according to the building size or configuration. Aquatic Facilities were categorized as Spray Pad, Neighborhood Pool, Park Pool, or Indoor Pool. Table 4 illustrates the distribution of these facilities by category. Table 4: Distribution of Baltimore City Recreation and Aquatic Facilities by Category
Facility Type Category Count
Recreation Facility
School Wing 21 Adjacent to a school 3 Small Stand Alone 7 Large Stand Alone 9
Aquatic Facility
Spray Pad 2 Neighborhood Pool 12 Park Pool 6 Indoor Pool 3
Available amenities were identified for each facility to be used for scoring and comparison purposes. Each facility was also assigned an assumed service area which was later used to illustrate its user base on a map. Service Area Definition Service areas were defined for each category of facility based upon the assumed distance that residents were most likely to travel to access the facility and the mode of transportation they were most likely to use at that distance. Table 5 summarizes the assumed primary mode of transportation and service areas for each facility category. It is further assumed that public transit users would walk up to one‐half mile from the transit stop to a recreation center or aquatic facility. Table 5: Assumed Access Type and Service Areas by Facility Category
Facility Type Category Access Type Service Area
Recreation Facility
School Wing Pedestrian or Bicycle ½ mile Adjacent to a School Vehicle 1 mile Small Stand Alone Pedestrian or Bicycle ½ mile Large Stand Alone Vehicle 1 mile
Aquatic Facility
Spray Pad Pedestrian or Bicycle ½ mile Neighborhood Pool Pedestrian or Bicycle ½ mile Park Pool Vehicle 2 miles Indoor Pool Vehicle 1 mile
These assumptions were validated and refined as necessary for individual facilities by BCRP staff. For
24 Baltimore City Recreation & Parks Department

example, Roosevelt Park Pool was assigned a service area of one‐half mile despite its categorization as a Park Pool. This facility draws area‐wide users, but parking is a challenge, so it is predominantly accessed by walking. As a result, a one‐half mile service area was assigned for Roosevelt Pool rather than the two mile service area allocated to other park pools. The map representation of the service areas varied depending on the assumed mode of access as follows:
• If a facility was predominantly accessed by vehicle (any distance greater than one‐half mile), the service area was delineated by drive distance along the street network. Baltimore City’s GIS street centerline layer and ESRI’s Network Analyst extension were used to generate these service areas.
• If a facility was predominantly accessed by walking or bicycling (one‐half mile), it was assumed that
users were not constrained by the street network. Round buffers were used to generate the service areas of one‐half mile in any direction to the facility.
A summary of the access type, service area definitions, and map representation is described in Table 6 below. Table 6: Summary of Service Area Definitions and Assumptions
Access Type
Service Area Service Area Definition
Map Representation
Pedestrian and Bicycle
½ mile ½ mile radius in any direction
Round buffer
Vehicle
Greater than ½ mile
Drive distance along street
centerline
Non‐circular polygon
The assumed service areas for existing recreation facilities are summarized in Table 7. Table 7: Assumed Service Areas for Existing Recreation Facilities
Name Center Type Service Area Primary Access Bentalou Adjacent to school 1 mile Vehicle C.C. Jackson School Wing 1/2 mile Pedestrian & Bicycle Cahill Large Stand Alone 1 mile Vehicle Carroll F. Cook School Wing 1/2 mile Pedestrian & Bicycle Cecil‐Kirk Adjacent to school 1 mile Vehicle Chick Webb Large Stand Alone 1 mile Vehicle Clifton Park (Rita Church) Large Stand Alone 1 mile Vehicle Coldstream Small Stand Alone 1/2 mile Pedestrian & Bicycle Collington Square School Wing 1/2 mile Pedestrian & Bicycle Curtis Bay Small Stand Alone 1/2 mile Pedestrian & Bicycle DeWees Small Stand Alone 1 mile Vehicle Edgewood‐Lyndhurst Large Stand Alone 1 mile Vehicle Ella Bailey School Wing 1/2 mile Pedestrian & Bicycle Farring‐Baybrook Large Stand Alone 1 mile Vehicle
Name Center Type Service Area Primary Access
Recreation and Aquatics Facilities Analysis and Plan 25

Fort Worthington School Wing 1/2 mile Pedestrian & Bicycle Fred B. Leidig School Wing 1/2 mile Pedestrian & Bicycle Gardenville School Wing 1/2 mile Pedestrian & Bicycle Greenmount Large Stand Alone 1 mile Vehicle Herring Run School Wing 1/2 mile Pedestrian & Bicycle James D. Gross School Wing 1/2 mile Pedestrian & Bicycle James McHenry School Wing 1/2 mile Pedestrian & Bicycle John Eager Howard School Wing 1/2 mile Pedestrian & Bicycle Lakeland School Wing 1/2 mile Pedestrian & Bicycle Lillian Jones School Wing 1/2 mile Pedestrian & Bicycle Locust Point Small Stand Alone 1/2 mile Pedestrian & Bicycle Madison Square School Wing 1/2 mile Pedestrian & Bicycle Mary E. Rodman Adjacent to school 1 mile Vehicle Medfield Small Stand Alone 1/2 mile Pedestrian & Bicycle Mora Crossman School Wing 1/2 mile Pedestrian & Bicycle Morrell Park Large Stand Alone 1 mile Vehicle Mount Royal School Wing 1/2 mile Pedestrian & Bicycle Northwood School Wing 1/2 mile Pedestrian & Bicycle Oliver Small Stand Alone 1/2 mile Pedestrian & Bicycle Patapsco School Wing 1/2 mile Pedestrian & Bicycle Patterson Park (Virginia S. Baker)
Large Stand Alone 1 mile Vehicle
Robert C. Marshall School Wing 1/2 mile Pedestrian & Bicycle Roosevelt Large Stand Alone 1 mile Vehicle Samuel F. B. Morse School Wing 1/2 mile Pedestrian & Bicycle Solo Gibbs Small Stand Alone 1/2 mile Pedestrian & Bicycle Woodhome School Wing 1/2 mile Pedestrian & Bicycle
The assumed service areas for existing aquatic facilities are summarized in Table 8. Table 8: Assumed Service Area Coverage for Existing Aquatic Facilities Name Pool Type Service Area Primary Access Ambrose Kennedy Neighborhood Pool 1/2 mile Pedestrian & Bicycle C.C. Jackson Neighborhood Pool 1/2 mile Pedestrian & Bicycle Callowhill Indoor Pool 1 mile Vehicle Central Rosemont Neighborhood Pool 1/2 mile Pedestrian & Bicycle Cherry Hill Indoor Indoor Pool 1 mile Vehicle Cherry Hill Splash Park Pool 2 miles Vehicle Chick Webb Indoor Pool 1 mile Vehicle City Springs Neighborhood Pool 1/2 mile Pedestrian & Bicycle Clifton Park Pool 2 miles Vehicle Coldstream Neighborhood Pool 1/2 mile Pedestrian & Bicycle Druid Hill Park Pool 2 miles Vehicle Farring‐Baybrook Neighborhood Pool 1/2 mile Pedestrian & Bicycle Greater Model Neighborhood Pool 1/2 mile Pedestrian & Bicycle
Name Pool Type Service Area Primary Access
26 Baltimore City Recreation & Parks Department
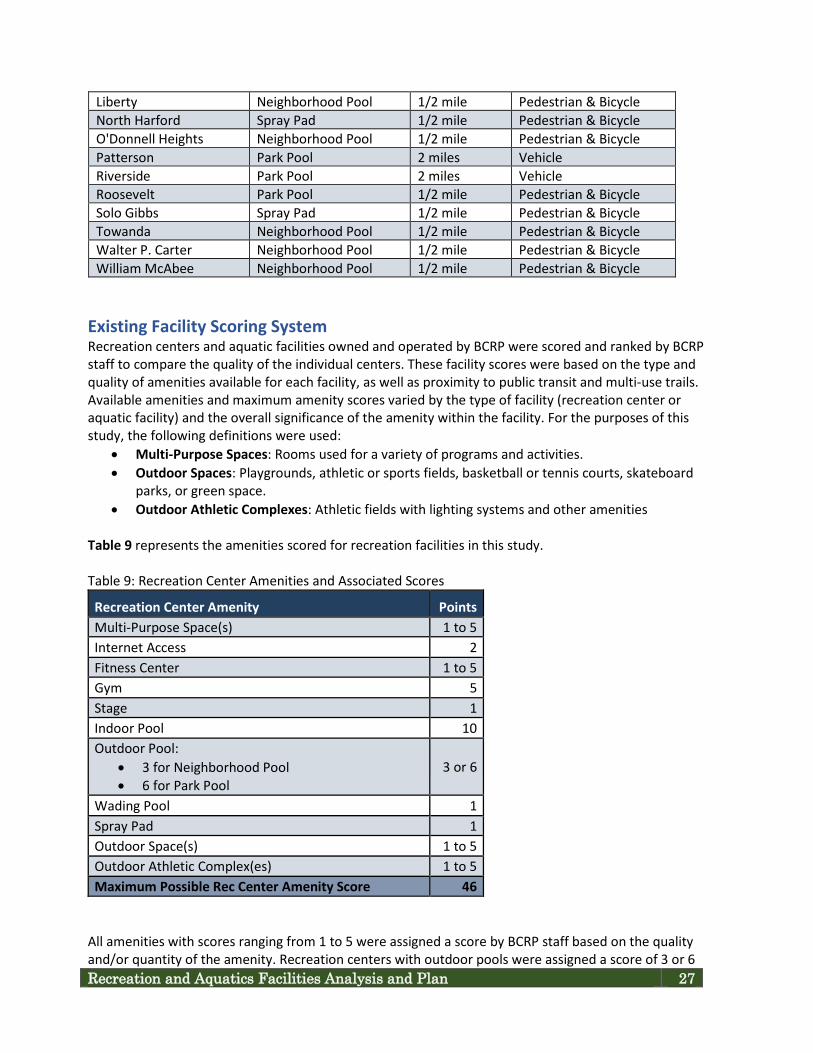
Liberty Neighborhood Pool 1/2 mile Pedestrian & Bicycle North Harford Spray Pad 1/2 mile Pedestrian & Bicycle O'Donnell Heights Neighborhood Pool 1/2 mile Pedestrian & Bicycle Patterson Park Pool 2 miles Vehicle Riverside Park Pool 2 miles Vehicle Roosevelt Park Pool 1/2 mile Pedestrian & Bicycle Solo Gibbs Spray Pad 1/2 mile Pedestrian & Bicycle Towanda Neighborhood Pool 1/2 mile Pedestrian & Bicycle Walter P. Carter Neighborhood Pool 1/2 mile Pedestrian & Bicycle William McAbee Neighborhood Pool 1/2 mile Pedestrian & Bicycle
Existing Facility Scoring System Recreation centers and aquatic facilities owned and operated by BCRP were scored and ranked by BCRP staff to compare the quality of the individual centers. These facility scores were based on the type and quality of amenities available for each facility, as well as proximity to public transit and multi‐use trails. Available amenities and maximum amenity scores varied by the type of facility (recreation center or aquatic facility) and the overall significance of the amenity within the facility. For the purposes of this study, the following definitions were used:
• Multi‐Purpose Spaces: Rooms used for a variety of programs and activities. • Outdoor Spaces: Playgrounds, athletic or sports fields, basketball or tennis courts, skateboard
parks, or green space. • Outdoor Athletic Complexes: Athletic fields with lighting systems and other amenities
Table 9 represents the amenities scored for recreation facilities in this study. Table 9: Recreation Center Amenities and Associated Scores
Recreation Center Amenity
Points Multi‐Purpose Space(s) 1 to 5 Internet Access 2 Fitness Center 1 to 5 Gym 5 Stage 1 Indoor Pool 10 Outdoor Pool:
• 3 for Neighborhood Pool • 6 for Park Pool
3 or 6
Wading Pool 1 Spray Pad 1 Outdoor Space(s) 1 to 5 Outdoor Athletic Complex(es) 1 to 5 Maximum Possible Rec Center Amenity Score 46
All amenities with scores ranging from 1 to 5 were assigned a score by BCRP staff based on the quality and/or quantity of the amenity. Recreation centers with outdoor pools were assigned a score of 3 or 6 Recreation and Aquatics Facilities Analysis and Plan 27

depending on the type of pool (neighborhood or park pool). The maximum possible amenity score for a recreation center was 46, based on the assumption that every amenity would be present in the center at the highest quality. Aquatic facilities, by their nature, possess very different amenities to recreation centers. Table 10 represents the amenities scored for aquatic facilities in the level of service analysis. Table 10: Aquatic Center Amenities and Associated Scores
Aquatic Center Amenity
Points Indoor Pool 10 Outdoor Pool
• 3 for Neighborhood Pool • 6 for Park Pool
3 or 6
Spray Pad 1 Wading Pool 1 Locker Facilities 1 Restrooms 1 Maximum Possible Aquatic Center Amenity Score 20
The maximum possible amenity score for an aquatic center was 20, based on the assumption that every amenity would be present in the center at the highest quality. Each facility was also assigned a score to reflect proximity to public transit (City bus, Charm City Circulator, Light Rail, and Metrorail). If one or more transit stops existed within walking distance (one‐half mile) of a center, the center received one point for Proximity to Transit. Spatial analysis was used to determine whether a transit stop was within a one‐half mile circular radius of the center. An additional score was assigned to each center to reflect proximity to multi‐use trails. Each facility received one point if a multi‐use trail exists within one‐half mile of the center. The rationale for including multi‐modal transportation data sets is not only to raise awareness of the needs of potential facility users who may not have access to a car, including children, people with disabilities, and senior citizens, but also to support the promotion of healthy lifestyles, a priority for both the Mayor and BCRP. The final score for each facility was derived by aggregating the associated amenity and proximity to transit and multi‐use trail scores. The maximum possible scores for recreation and aquatic centers are illustrated in Table 11. Table 11: Maximum Score for Existing Recreation and Aquatic Centers Points
28 Baltimore City Recreation & Parks Department

Score Category Recreation Center Aquatic Center Maximum Amenities Score Based on the type, significance, and quality of amenities available for the facility.
46
20
Maximum Transit Score One or more of the following transit stops exists within one‐half mile of the recreation center:
• City bus stop • Charm City Circulator stop • Light rail station • Metrorail station
1
1
Maximum Trails Score A completed multi‐use trail is within ½ mile of the recreation center
1
1
Maximum Possible Recreation Center Score 48 22 Facility scores were generated using the aforementioned criteria and each center was classified as “High,” “Medium,” or “Low” scoring using Jenks’ Natural Breaks method. These scores and classifications were mapped to the service areas to illustrate breadth of coverage by high, medium, and low scoring City‐operated centers (green, orange, and red respectively). Facilities accessed primarily by people walking or traveling by bicycle were represented with one‐half mile round service areas, while those facilities primarily accessed by people with vehicles were represented by a one mile non circular service area defined by the street network. MAP SYMBOLOGY Recreation Center Scores (as evaluated by BCRP staff)
Recreation and Aquatics Facilities Analysis and Plan 29

• Green = High Level of Service • Orange = Medium Level of Service • Red = Low Level of Service
Gap Scores (as defined by the factors in the model) • Brown = More desirable for siting recreation center • Orange = Desirable for siting recreation center • Yellow = Less desirable for siting recreation center
= Future BCRP Recreation Center Round service areas
• ½ mile distance in any direction • Primary access = walking or bicycling
• Non‐Circular service areas • 1 mile driving distance along street network • Primary access = vehicle
Map symbology may also be found in Appendix C: Level of Service Maps and Tables. Existing Recreation Facility Scoring Results The scoring analysis resulted in six recreation centers with a high score, 24 recreation centers with a medium score, and 10 recreation centers with a low score. Virginia S. Baker (in Patterson Park) scored the highest with a score of 33 (out of a maximum of 46 points) due to the variety of existing amenities in Patterson Park as a whole, while James McHenry scored the lowest with a score of 7. Clifton Park/Rita Church (26) will score higher after a new gymnasium is built, and Morrell Park (18) was scored lower due to a lack of green space and existing park amenities. Table 12 illustrates the distribution of recreation centers by score category. See Appendix C: Level of Service Maps and Tables for the more detailed score by center. Table 12: Summary of Existing Recreation Facilities by Score Category
Score Category Existing Recreation Centers
30 Baltimore City Recreation & Parks Department
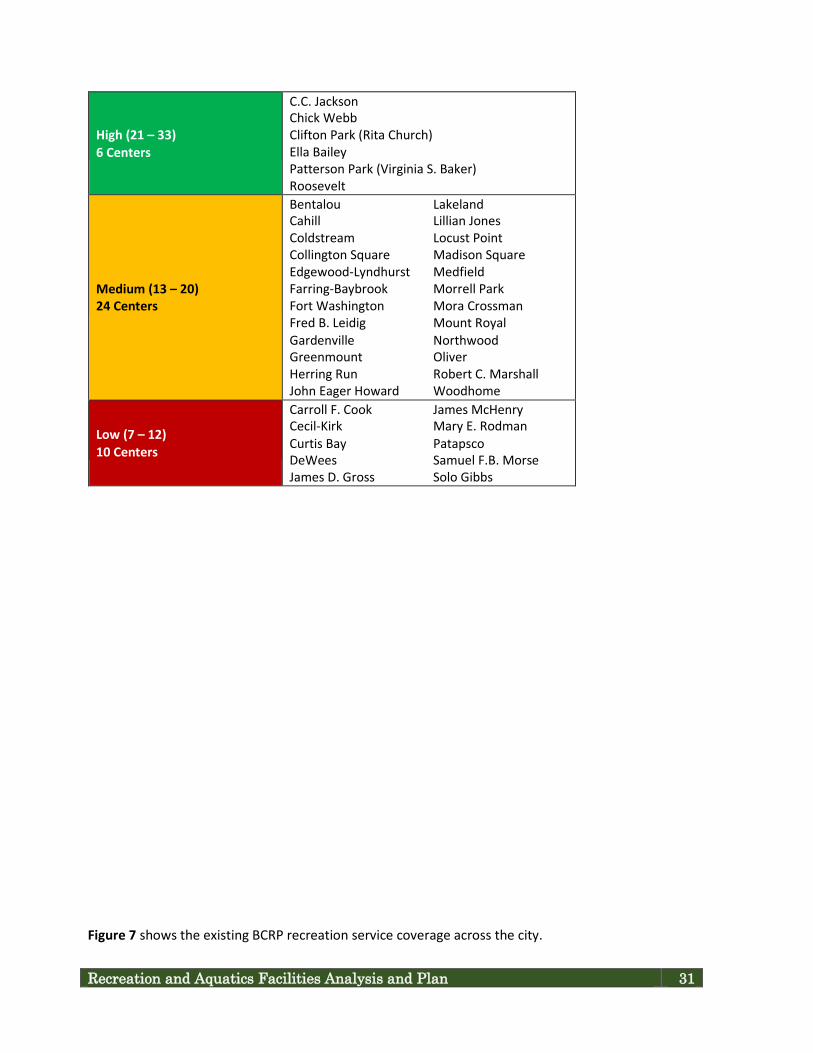
High (21 – 33) 6 Centers
C.C. Jackson Chick Webb Clifton Park (Rita Church) Ella Bailey Patterson Park (Virginia S. Baker) Roosevelt
Medium (13 – 20) 24 Centers
Bentalou Lakeland Cahill Lillian Jones Coldstream Locust Point Collington Square Madison Square Edgewood‐Lyndhurst Medfield Farring‐Baybrook Morrell Park Fort Washington Mora Crossman Fred B. Leidig Mount Royal Gardenville Northwood Greenmount Oliver Herring Run Robert C. Marshall John Eager Howard Woodhome
Low (7 – 12) 10 Centers
Carroll F. Cook James McHenry Cecil‐Kirk Mary E. Rodman Curtis Bay Patapsco DeWees Samuel F.B. Morse James D. Gross Solo Gibbs
Figure 7 shows the existing BCRP recreation service coverage across the city.
Recreation and Aquatics Facilities Analysis and Plan 31

Figure 7: Existing BCRP Recreation Centers: Service Coverage and Amenity Scores
D. Existing Aquatic Facility Scoring Results
32 Baltimore City Recreation & Parks Department
For the existing aquatic facilities, the scoring analysis resulted in nine aquatic centers with a high score, two aquatic centers with a medium score, and 12 aquatic centers with a low score. Callowhill and Cherry Hill Indoor Pools scored the highest with a score of 14 (out of a maximum of 22 points), while North Harford Spray Pad scored the lowest with a score of 2. Table 13 illustrates the distribution of aquatic facilities by score category. See Appendix C: Level of Service Maps and Tables for the more detailed score by aquatic facility. Table 13: Summary of Existing Aquatic Facilities by Score Category
Score Category Existing Aquatic Centers
High (8 – 14) 9 centers
Callowhill Cherry Hill Indoor Cherry Hill Splash Chick Webb
Clifton Druid Hill Patterson Riverside Roosevelt
Medium (6 – 7) 2 centers
Ambrose Kennedy William McAbee
Low (2 – 5) 12 centers
C.C. Jackson Central Rosemont City Springs Coldstream Farring‐Baybrook Greater Model
Liberty North Harford O'Donnell Heights Towanda Solo Gibbs Walter P. Carter
These scores and classifications were mapped to the service areas to illustrate breadth of coverage by high, medium, and low scoring City‐operated centers (green, orange, and red respectively) as illustrated in Figure 8.
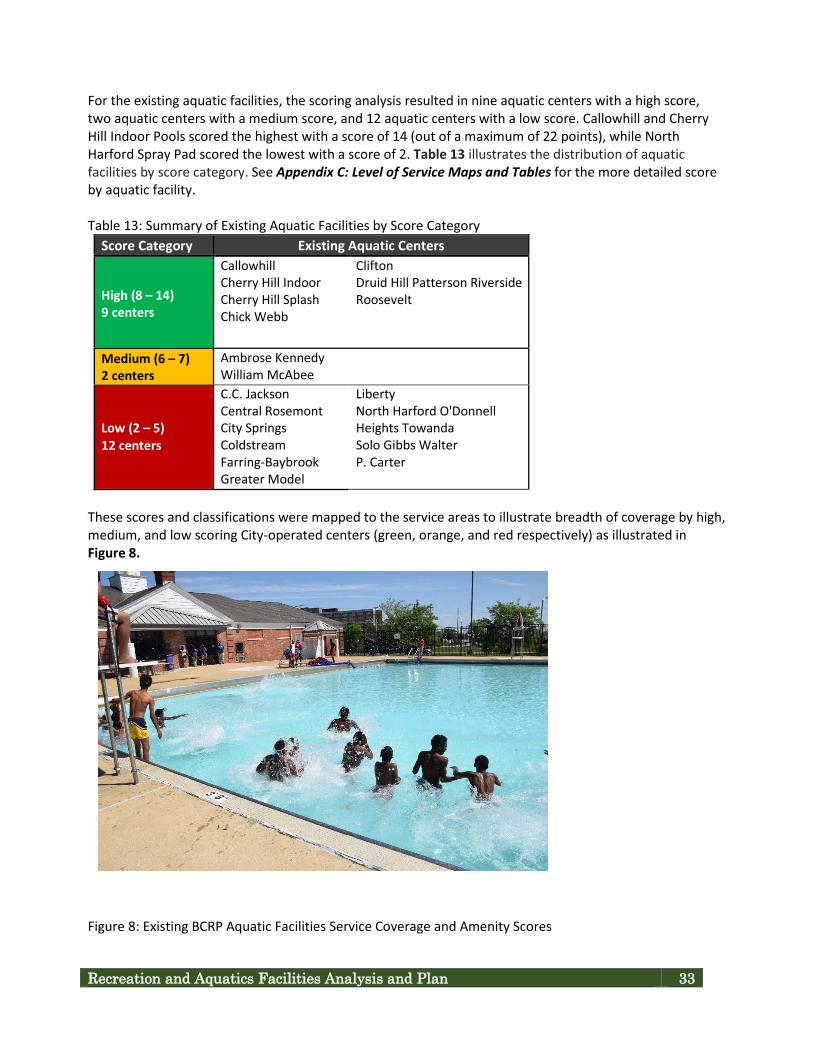
Figure 8: Existing BCRP Aquatic Facilities Service Coverage and Amenity Scores
Recreation and Aquatics Facilities Analysis and Plan 33

34 Baltimore City Recreation & Parks Department
E. Non‐BCRP Providers
BCRP is not the only provider of recreation programs in Baltimore City. For the purposes of this study, only Non‐BCRP providers of recreation services with “brick and mortar facilities,” amenities, and recreation programs similar to BCRP were identified and mapped to indicate supplemental recreation service area coverage. The inclusion of these 17 Non‐BCRP providers helped inform the analysis of the existing Baltimore City recreation program coverage. Evaluating services offered by Non‐BCRP providers also helped to determine geographic gaps in recreation program coverage within the City, and are considered as part of future BCRP recreation and aquatic program provision. In a level of service analysis, graphically illustrating Non‐BCRP Providers may provide opportunities for collaboration in program and service delivery, as well as collaborative future facility development. The variety, quality, and breadth of programs varies among providers from large, nationally recognized providers such, as the YMCA or JCC, to small, local non‐profits focused on one demographic, program, or service. Some Non‐BCRP Providers are in partnership with BCRP to operate within Baltimore City owned facilities. Some of these relationships were initiated as part of the Department’s 2011 Recreation Center Implementation Plan to encourage other community‐based organizations to provide recreation services in facilities where BCRP lacked the capacity to do so. BCRP has numerous partnerships with other organizations to provide recreation services, with varying degrees of success. Five centers were taken over by the Baltimore City Public Schools, with the result that success of the center was, for the most part, principal driven, and not all of the sites fared well. Providers at sites including Collington Square, Solo Gibbs, and Lillian Jones did not have the capacity to sustain the expected level of programming. Other providers, such as the Young Men’s Christian Association (YMCA) and Jewish Community Center (JCC), have privately owned and operated facilities, and function as non‐profit organizations. Non‐BCRP Providers selected for inclusion in the level of service analysis are listed in Table 14 below. Table 14: Non‐BCRP Providers by Type Non‐BCRP Provider Type Count BCRP Partner or Contractor 8 Young Men’s Christian Association (YMCA) 2 Jewish Community Center (JCC) 1 Youth Opportunity Centers (YO!) 2 Living Classrooms (Carmelo Anthony Center) 1 Civic Works (Goodnow Community Center) 1 Boys and Girls Club 2
The locations and assumed service areas of the Non‐BCRP Providers included in the level of service analysis were mapped to illustrate supplemental coverage. Non‐BCRP Provider facilities were not scored, and their service areas are symbolized in grey on all maps, as illustrated in Figure 9. Figure 9: Existing Non‐BCRP Provider Recreation Centers: Service Coverage Recreation and Aquatics Facilities Analysis and Plan 35
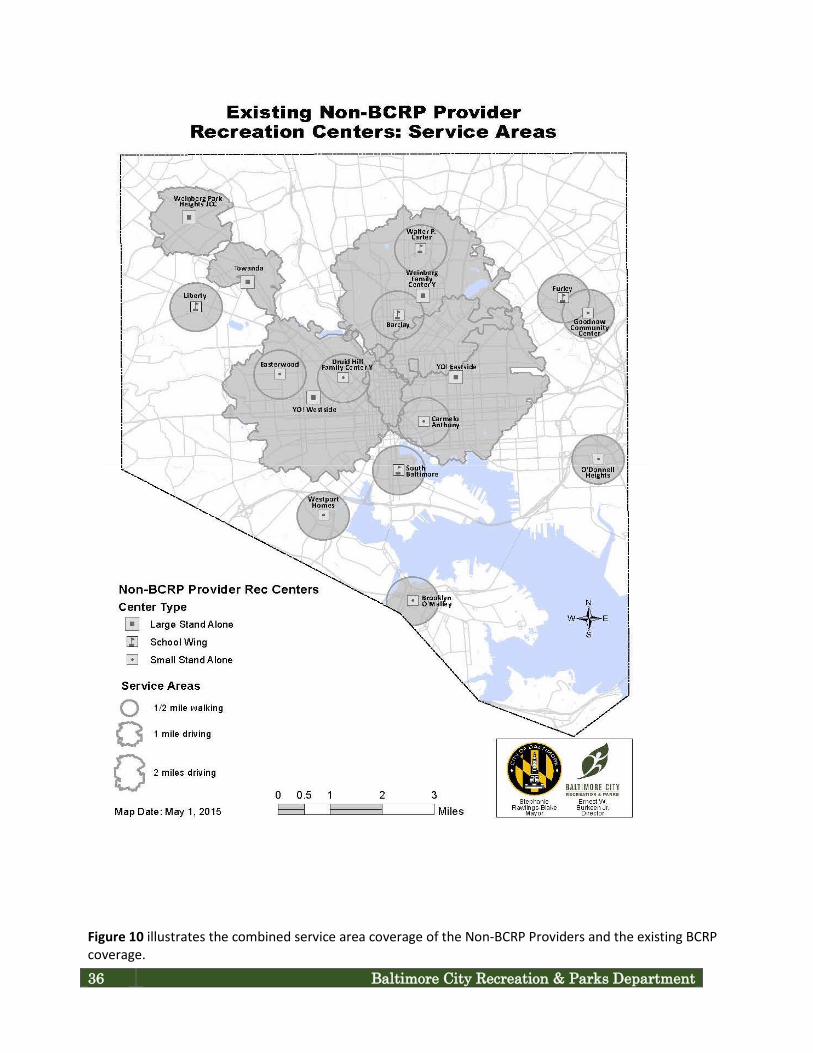
Figure 10 illustrates the combined service area coverage of the Non‐BCRP Providers and the existing BCRP coverage.
36 Baltimore City Recreation & Parks Department

Figure 10: Existing BCRP and Non‐BCRP Provider Recreation Centers: Service Coverage
An additional list of approximately 260 alternative Non‐BCRP recreation service providers was compiled as part of a separate services assessment exercise to evaluate the market position and strategies for BCRP Recreation and Aquatics Facilities Analysis and Plan 37
recreation programs and services moving forward. Many of these alternative providers offer recreation programs at many different sites across the city and are not housed in one drop‐in location, yet they greatly contribute to the universe of recreation programs and services offered to Baltimore City residents. The ability to map this universe of recreation programs across the city is complex and is constantly shifting based upon the variable nature of programs offered. While these programs are not reflected in the Non‐BCRP alternative provider maps in this report, they contribute greatly despite their transitory nature to the number and variety of recreation programs serving all age groups in Baltimore City. The nature of these program offerings are temporal, changing by season or year based upon demand, staff, funding, etc. They therefore provide a snapshot of programs that are current at any one given point in time. Research conducted by BCRP of the overall universe of Non‐BCRP providers in Baltimore City, those with “brick and mortar” locations and those without, identified five categories of Providers:
Larger Legacy Recreational Organizations (nonprofit) – These nonprofit groups have missions that have historically focused on youth development. Some have their own physical facilities, while others are program providers. There are nine (9) such locations and programs from the 33rd Street Y of MD, JCC, to the Boys and Girls Club programs at the Justice Center for the Juvenile Detention Center. Social/Civic Organizations (non‐profit) – These non‐profit groups focus on the social and civic needs of at‐risk, low income, or marginalized populations. Many charitable, non‐profit organizations were established to meet these challenges and gaps in services and to serve as intermediaries for private foundation and donor funds to support these efforts. There is a wide variety of over 100 of these groups from smaller organizations such as Omega Baltimore at Easterwood to larger capacity entities such as Child First Authority (in the city charter) and the Parks & People Foundation. Many have specific missions and provide only music (Orchkids) or visual arts (Art with a Heart). Some of these organizations are site specific operations, while others provide services city wide. Many of the smaller groups have been quickly mobilized to respond to immediate needs, have limited access to resources, and lack the capacity to sustain themselves over the long run. Community‐Based/Volunteer Youth Athletic Organizations – These community‐based, youth athletic programs range from Baseball (James Mosher and Roland Park Little Leagues) to girls’ volleyball teams like the “Starlings.” Over 90 organizations provide a wide variety of sports teams, leagues, and clinics in Baltimore City serving well over 1,000 children, most of which are in specific neighborhoods. Some are organized and sponsored by larger organizations, e.g., the Amateur Athletic Union (AAU) and United States Tennis Association (USTA). BCRP helps to facilitate many of the leagues and coordinates field usage. This list does not include school based high school athletics programs. City Agency Social Service Providers – There are many other agencies besides BCRP that deliver over 70 recreational, developmental, and leisure programs from seniors’ programs at CARE centers to youth development at Youth Opportunity (YO!) Centers and Head Start programs sponsored by the Mayor’s Office of Economic Development and Human Services, respectively. The major provider of afterschool enrichment is through the Family League as part of the Community Schools Initiative. The Family League contracts with 48 program providers for the delivery of afterschool services at over 60 locations. Many are of the “social/civic” and “legacy” classification. Such programming mirrors that of the BCRP Community Recreation Centers, which often provide similar programming at a recreation center which is attached to the school. Private, Fitness, Leisure, and Recreation Companies (for‐profit) – There are many for‐profit, fee‐ based program service providers to accommodate an existing gap in services or to meet the needs of
38 Baltimore City Recreation & Parks Department

the economy, new population influx, demographic shifts, and new target markets. There are well over 100 of these businesses, including fitness trainers providing fitness training to urban professionals and their families, private gyms and pools, recreational clubs, for profit youth sports clinics, day care providers, and after school centers. These groups are market driven and focused on a specific target market. They serve a younger professional demographic, which is different than the populations and demographics BCRP traditionally serves.
Recreation and Aquatics Facilities Analysis and Plan 39

40 Baltimore City Recreation & Parks Department

Recreation and Aquatics Facilities Analysis and Plan 41
III. ANALYSIS OF BCRP’S EXISTING RECREATION FACILITIES SERVICE COVERAGE
BCRP’s existing service area coverage was analyzed to identify areas underserved by recreation facilities (gaps). Once identified, the gaps were evaluated according to a detailed, weighted criteria to determine their locational desirability to site new recreational services. This gap analysis served as a base to compare BCRP’s future facilities plan (discussed in Section IV) to determine how well the plan addressed existing service gaps. A. Existing BCRP Service Area Gap Identification The objectives of the service area gap analysis were to:
• Identify and evaluate gaps in coverage of existing BCRP recreation facilities. • Consider recreation services coverage provided by selected Non‐BCRP providers. • Score and weight gaps in coverage according to factors to determine their locational desirability for
recreation programming or the siting of a new recreation facility. The following assumptions were used to define gaps in BCRP coverage:
• Gaps in service exist when a location does not have coverage from an existing BCRP recreation center.
• Gaps in service exist when coverage is provided by a low scoring BCRP recreation center (i.e. the service areas for any recreation centers with scores of 7 through 12).
Figure 11 illustrates the assumed gaps in coverage derived from BCRP existing recreation center locations. Dark grey indicates service gaps; clear areas indicate existing facility service areas.
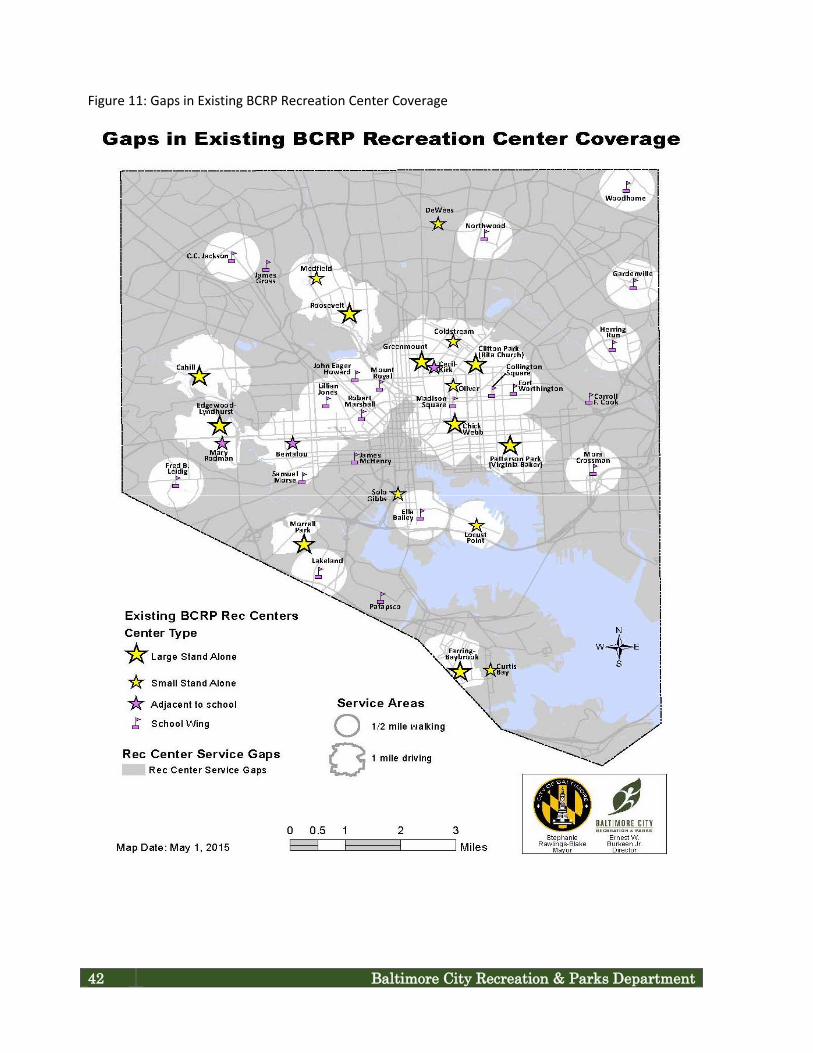
Figure 11: Gaps in Existing BCRP Recreation Center Coverage
42 Baltimore City Recreation & Parks Department

Recreation and Aquatics Facilities Analysis and Plan 43
Gap Analysis and Scoring The gaps were divided into grids one‐eighth of a mile by one‐eighth of a mile in size, and each grid was assigned scores indicative of desirability for siting a new facility. Some gaps in coverage are more desirable for siting new centers than others due to a variety of factors. For the purpose of comparing and evaluating the service area gaps, Table 15 lists the criteria and relative significance identified for inclusion in a scoring model: Table 15: Gap Scoring Criteria and Weighting Scoring Criteria Relative Significance (Weighting) Proximity to Public Transit & Multi‐Use Trails 50% of total score Coverage from Non‐BCRP Providers 30% of total score Planning and Development Initiatives 10% of total score Population 10% of total score
Quantitative scores derived for each factor were reclassified as “More Desirable,” “Desirable,” and “Less Desirable” using the Jenks Natural Breaks method and illustrated on maps using the color theme brown, orange, and yellow, respectively for comparison. An explanation of the scoring approach for each of the above four factors in Table 15 (Gap Scoring Criteria and Weighting) is described below. Proximity to Multi‐Modal Transportation Multi‐modal transportation options, especially modes other than private vehicles, increases the desirability of a location for siting a new recreation center, because it is assumed that the number of people that can access the center increases with the number of access options available. Better conditions for walking have benefits to the quality of life in cities. In a growing number of communities, the level of walking is considered an indicator of a community’s livability – a factor that has a profound impact on attracting businesses and workers as well as tourism. In cities where people can regularly be seen out walking, there is a palpable sense that these are safe and friendly places to live and visit. The social interaction possible when the number of people walking increases is a major factor for improving quality of life. Comfortable and accessible pedestrian environments offer alternatives to personal vehicles, which limit opportunities for social contact with others. By providing appropriate pedestrian facilities and amenities, communities enable the interaction between neighbors and other citizens that can strengthen relationships and contribute to a healthy sense of identity and place.1 The gap analysis model considers proximity to multi‐use trails, existing and planned, as well as transit stops in deriving the proximity score. Criteria and points allocated are defined in Table 16. If a gap satisfied any of the proximity criteria, it received the associated scores. The aggregated proximity score for each grid was reclassified as “More Desirable,” “Desirable,” and “Less Desirable” using the Jenks Natural Breaks method to illustrate the scoring results on a map located in Appendix C: Level of Service Maps and Tables.
1 http://www.pedbikeinfo.org/data/factsheet_social.cfm

Table 16: Proximity Criteria and Scoring Proximity to Multi‐Modal Transporation Criteria Points Within ½ mile of trail 5 Within ½ mile of Charm City Circulator stop 1 Within ½ mile of Light Rail station 1 Within ½ mile of Metrorail Station 1 Within ½ mile of proposed Red Line Station 1 Within ½ mile of 1 bus stop 1 Within ½ mile of stops for 2 or more bus lines (additional point) 1 Maximum Proximity to Multi‐Modal Trans. Score 11
Coverage by Non‐BCRP Providers Gaps in service were scored to indicate their need based on coverage by Non‐BCRP Providers. If a gap intersected the service area of a Non‐BCRP provider, the gap received a lower score, as it is assumed to be a less desirable site for a new facility than a location that has no coverage from Non‐BCRP Providers. Points were allocated as illustrated in Table 17. Non‐BCRP provider coverage scores for the service area gaps were reclassified as “More Desirable,” “Desirable,” and “Less Desirable” using the Jenks Natural Breaks method. The scoring results are illustrated in Appendix C: Level of Service Maps and Tables. Table 17: Coverage by Non‐BCRP Providers Criteria and Scoring
Non‐BCRP Provider Coverage Criteria Points No coverage from alternative or significant providers 5 Coverage from alternative service provider (BCRP partners) 2 Coverage from significant player only (JCC, YMCA) 2 Coverage from both alternative service provider and significant player 1 Maximum Non‐BCRP Provider Coverage Score 5
Planning and Development Initiatives It was assumed that locations with existing planning and development initiatives were more desirable to site a new recreation facility, because plans or investments have been made toward neighborhood improvements in these areas. Layers representing the areas of planning and development initiatives were compiled and each layer assigned a score based on the significance of the initiative. The planning and development initiatives with the most significance received five points, and the less significant initiatives received three points. Table 18 summarizes the planning and development initiatives considered in this analysis and associated scores. The aggregated scores were reclassified as “More Desirable,” “Desirable,” and “Less Desirable” using the Jenks Natural Breaks method. The scoring results are illustrated in Appendix C: Level of Service Maps and Tables.
44 Baltimore City Recreation & Parks Department

Table 18: Planning and Development Initiatives Criteria and Scoring
Planning and Development Initiatives Criteria
Points Vacants to Values (V2V) Emerging Markets 5 Vacants to Values (V2V) Community Development Clusters 5 Existing Public Housing 5 Planned Mixed Income Public Housing 5 Area Master Plans 3 Healthy Neighborhoods 3 Hope VI Development 3 Maximum Possible Planning and Development Initiative Score 29
Population It was assumed that the attractiveness of a location for siting a new facility increases with the number of local residents the facility can serve. As a result, higher population was considered more desirable in the scoring model. Population information was derived from the ESRI U.S. Census Block Centroid Populations dataset, where each point represents the centroid of its Census Block and carries an attribute for the block population. The population for each gap was calculated based on the sum of the population reported in the points, which the gap intersected. Population criteria and scoring are described in Table 19. The population was then classified as High (More Desirable), Medium (Desirable), or Low (Less Desirable) using Jenks Natural Breaks Method. The resulting gap analysis is illustrated in Appendix C: Level of Service Maps and Tables. Table 19: Population Criteria and Scores Population Criteria Points High Population (≥ 388 people) 5 Medium Population (118 to 387 people) 3 Low Population (1 to 117 people) 1 Maximum Population Score 5
Gap Scoring Results The total gap score is the weighted sum of the Proximity, Non‐BCRP Provider Coverage, Planning and Development Initiatives, and Population scores. The maximum possible weighted score is 100 points. Table 20 summarizes the weights applied to each scoring factor. Table 20: Maximum Gap Scores and Weights
Scoring Factor Maximum Possible Score
Percent of Total Score
Weights Weighted Maximum Score
Proximity 11 50% 4.55 50 Alternative Providers 5 30% 6.00 30 Planning and Development Initiatives 29 10% 0.34 10 Population 5 10% 2.00 10 TOTAL 50 100% 100
Recreation and Aquatics Facilities Analysis and Plan 45

Figure 12 illustrates the aggregated scores for the gaps based on the scoring described above, and the weighted sum of the Proximity, Non‐BCRP Provider Coverage, Planning and Development Initiatives, and Population scores. These scores were used to determine the approximate service areas of BCRP facilities and programs, as well as to determine any unaddressed gaps in service coverage that are addressed by current and future planning. The dark brown represents the most desirable areas for siting a recreation facility or providing recreation programs. Desirable areas are represented in orange and less desirable areas are indicated in yellow.
46 Baltimore City Recreation & Parks Department

Figure 12: Aggregated Scores for Gaps in Existing BCRP Recreation Center Coverage
Recreation and Aquatics Facilities Analysis and Plan 47

48 Baltimore City Recreation & Parks Department

IV. ANALYSIS OF BCRP’S PLAN FOR FUTURE RECREATION FACILITIES SERVICE COVERAGE
A. Plan for Future Recreation Facilities BCRP’s plan proposes a combination of twenty (20) upgraded, expanded, existing, or newly constructed recreation center and aquatic facilities. The plan also includes school‐based recreation programming in community spaces within 22 school locations to be developed as part of Baltimore City Public School’s new 21st Century Buildings Plan.
Figure 13 shows the future facilities plan analyzed and evaluated for recreation service area coverage.
Recreation and Aquatics Facilities Analysis and Plan 49
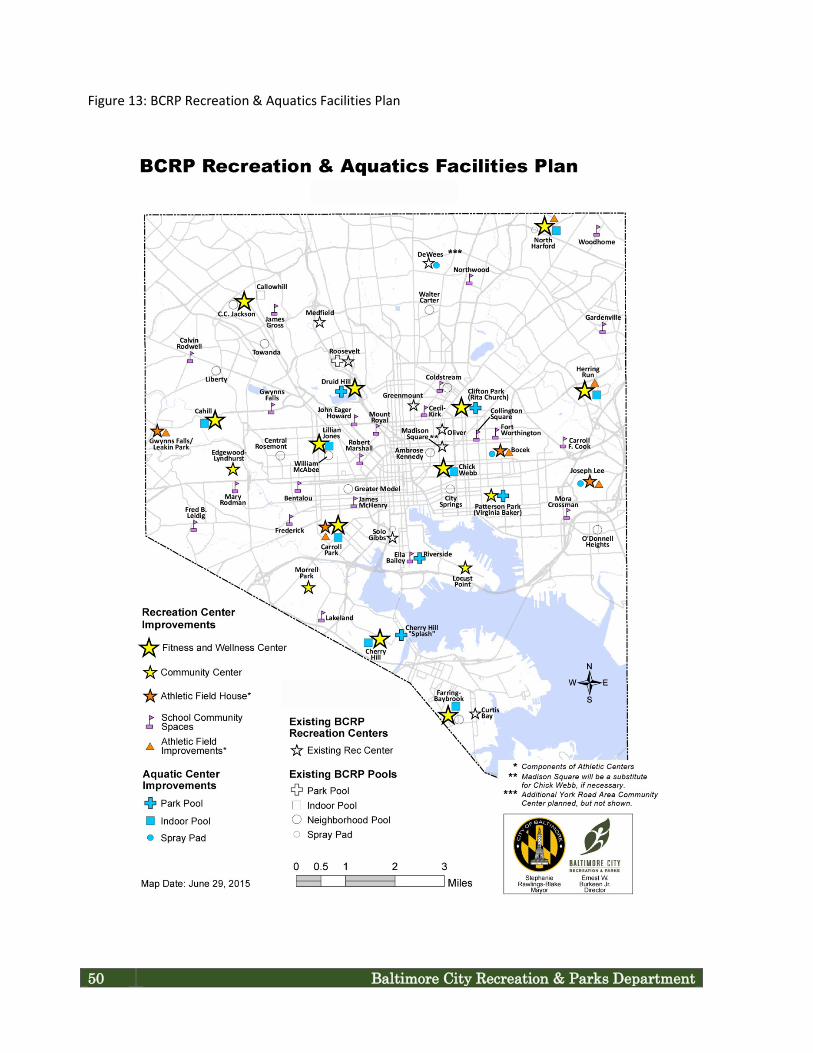
50 Baltimore City Recreation & Parks Department
Figure 13: BCRP Recreation & Aquatics Facilities Plan

Recreation and Aquatics Facilities Analysis and Plan 51
The plan’s 20 future BCRP facilities were scored in the same manner as existing facilities for comparison purposes, assigned anticipated service area coverage, and mapped. The school‐based spaces were assigned service area coverage, but not scored, given that the facilities are still under design and will likely be similar across the sites. The resultant coverage was evaluated against the gaps identified as part of the existing service coverage illustrated in Figure 13 above. BCRP Proposed Facilities The second set of objectives of the service area gap analysis was to:
• Evaluate the locations of future recreation centers and aquatic facilities in BCRP’s plan. • Consider planned community space identified as part of Baltimore City Public Schools 21st Century
Building Plan against gaps in existing coverage. • Ascertain for further review any unaddressed gaps not addressed by the plan. • Inform the refinement of the future facility strategy.
A dataset was developed representing an inventory of 20 recreation centers proposed by BCRP:
• Fitness and Wellness Centers (11) • Community Centers (5) • Outdoor Athletic Centers (4)
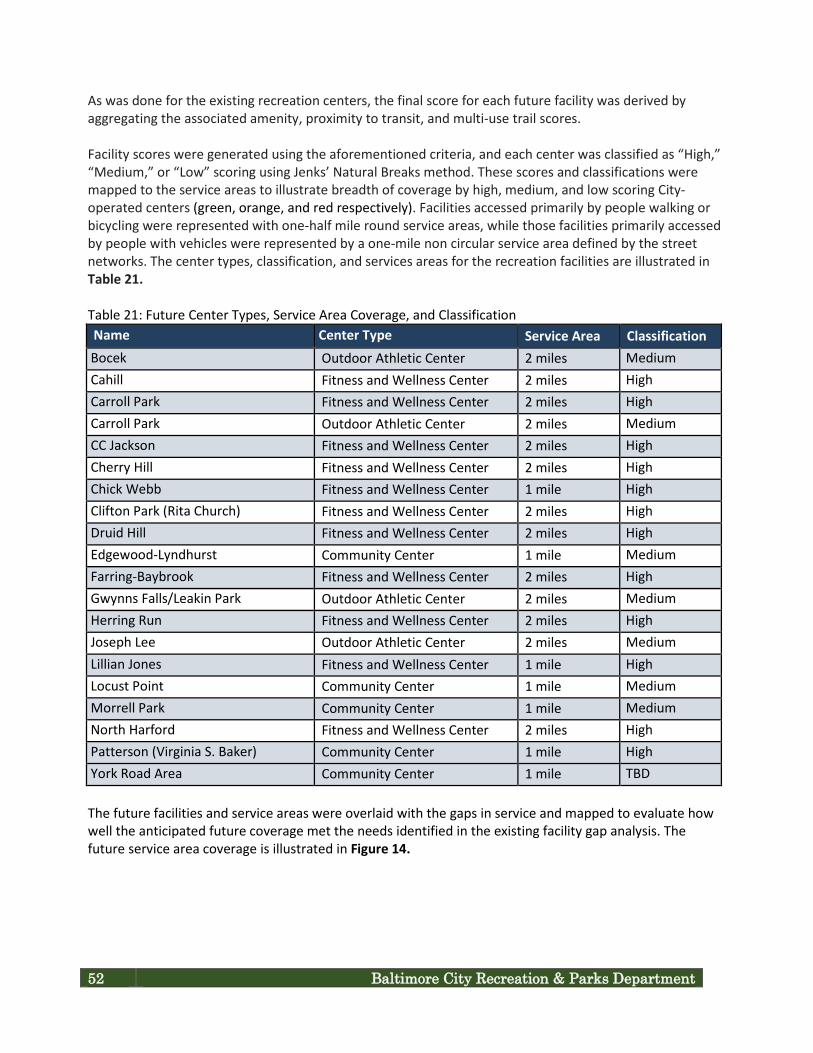
As was done for the existing recreation centers, the final score for each future facility was derived by aggregating the associated amenity, proximity to transit, and multi‐use trail scores. Facility scores were generated using the aforementioned criteria, and each center was classified as “High,” “Medium,” or “Low” scoring using Jenks’ Natural Breaks method. These scores and classifications were mapped to the service areas to illustrate breadth of coverage by high, medium, and low scoring City‐operated centers (green, orange, and red respectively). Facilities accessed primarily by people walking or bicycling were represented with one‐half mile round service areas, while those facilities primarily accessed by people with vehicles were represented by a one‐mile non circular service area defined by the street networks. The center types, classification, and services areas for the recreation facilities are illustrated in Table 21. Table 21: Future Center Types, Service Area Coverage, and Classification Name Center Type Service Area Classification Bocek Outdoor Athletic Center 2 miles Medium Cahill Fitness and Wellness Center 2 miles High Carroll Park Fitness and Wellness Center 2 miles High Carroll Park Outdoor Athletic Center 2 miles Medium CC Jackson Fitness and Wellness Center 2 miles High Cherry Hill Fitness and Wellness Center 2 miles High Chick Webb Fitness and Wellness Center 1 mile High Clifton Park (Rita Church) Fitness and Wellness Center 2 miles High Druid Hill Fitness and Wellness Center 2 miles High Edgewood‐Lyndhurst Community Center 1 mile Medium Farring‐Baybrook Fitness and Wellness Center 2 miles High Gwynns Falls/Leakin Park Outdoor Athletic Center 2 miles Medium Herring Run Fitness and Wellness Center 2 miles High Joseph Lee Outdoor Athletic Center 2 miles Medium Lillian Jones Fitness and Wellness Center 1 mile High Locust Point Community Center 1 mile Medium Morrell Park Community Center 1 mile Medium North Harford Fitness and Wellness Center 2 miles High Patterson (Virginia S. Baker) Community Center 1 mile High York Road Area Community Center 1 mile TBD The future facilities and service areas were overlaid with the gaps in service and mapped to evaluate how well the anticipated future coverage met the needs identified in the existing facility gap analysis. The future service area coverage is illustrated in Figure 14. 52 Baltimore City Recreation & Parks Department

Figure 14: Plan for Future BCRP Recreation & Aquatics Facilities Service Area Coverage – Without Schools
Recreation and Aquatics Facilities Analysis and Plan 53

B. Planned School Community Spaces BCRP proposes 22 School Community Spaces to be constructed within selected Baltimore City Public Schools as they are renovated and replaced under the Baltimore City Public Schools (BCPS) “21st Century Buildings Plan.” These spaces would support BCRP recreation programming in combination with access and use of additional facilities within the school (such as the gymnasium, art room, etc.). BCRP currently operates attached recreation centers at 19 of the 22 schools. Two additional schools are proposed by BCRP for new BCRP recreation programs. The new recreation programs at these schools will be further defined as part of an MOU agreement with Baltimore City Public Schools and in consultation with residents of the local communities. A dataset was developed to represent an inventory of the 22 Planned School Community Spaces, their service areas (all assumed to be one‐half mile), and expected levels of service. Table 22 defines the data set for the 22 Planned School Community Spaces. Table 22: Planned School Community Spaces Service Area Name Center Type Service Area Bentalou Planned School Community Space 1/2 mile Carroll F Cook Planned School Community Space 1/2 mile Calvin Rodwell Planned School Community Space 1/2 mile Cecil‐Kirk Planned School Community Space 1/2 mile Coldstream Planned School Community Space 1/2 mile Collington Square Planned School Community Space 1/2 mile Ella Bailey Planned School Community Space 1/2 mile Fort Worthington Planned School Community Space 1/2 mile Fred B. Leidig Planned School Community Space 1/2 mile Frederick Planned School Community Space 1/2 mile Gardenville Planned School Community Space 1/2 mile Gwynns Falls Planned School Community Space 1/2 mile James D Gross Planned School Community Space 1/2 mile James McHenry Planned School Community Space 1/2 mile John Eager Howard Planned School Community Space 1/2 mile Lakeland Planned School Community Space 1/2 mile Mary E. Rodman Planned School Community Space 1/2 mile Mora Crossman Planned School Community Space 1/2 mile Mount Royal Planned School Community Space 1/2 mile Northwood Planned School Community Space 1/2 mile Robert C. Marshall Planned School Community Space 1/2 mile Woodhome Planned School Community Space 1/2 mile
The planned facilities and service areas were mapped and overlaid with the gaps in service to evaluate how well the anticipated future coverage of Planned School Community Spaces met the needs identified in the gap analysis. The plan for future school community spaces coverage is shown in Figure 15. The plan showing coverage for all BCRP operated recreation facilities and school based community spaces is shown in Figure 16.
54 Baltimore City Recreation & Parks Department
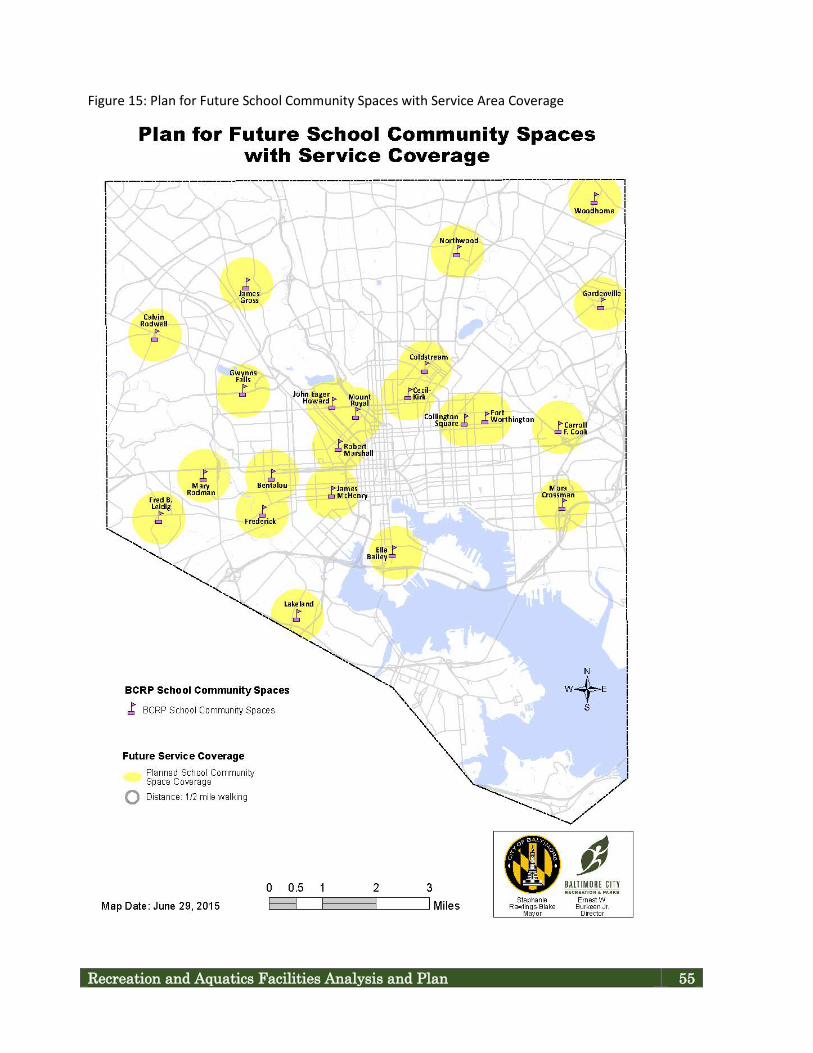
Recreation and Aquatics Facilities Analysis and Plan 55
Figure 15: Plan for Future School Community Spaces with Service Area Coverage
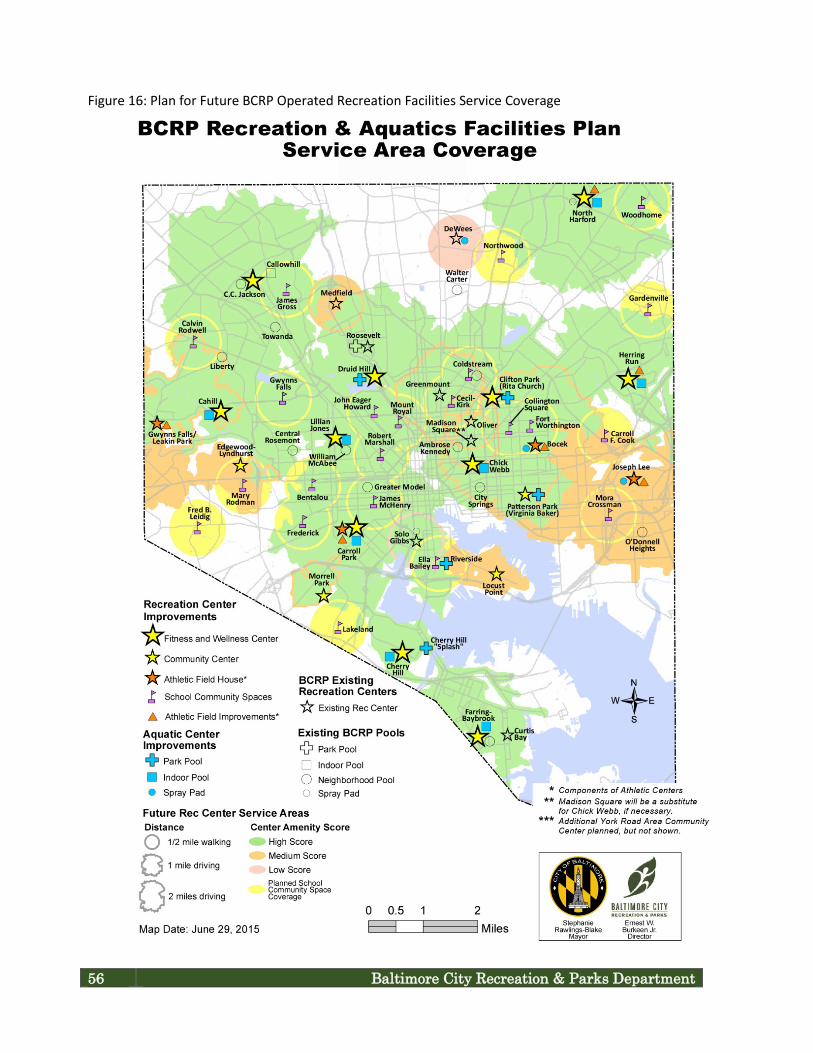
Figure 16: Plan for Future BCRP Operated Recreation Facilities Service Coverage
56 Baltimore City Recreation & Parks Department

The plan for all future recreation service coverage including BCRP operated, school‐based spaces and Non BCRP providers is shown in Figure 17. Figure 17: Plan for All Future Recreation Service Coverage ‐ BCRP Operated, School‐Based Spaces and Non BCRP Providers.
Recreation and Aquatics Facilities Analysis and Plan 57
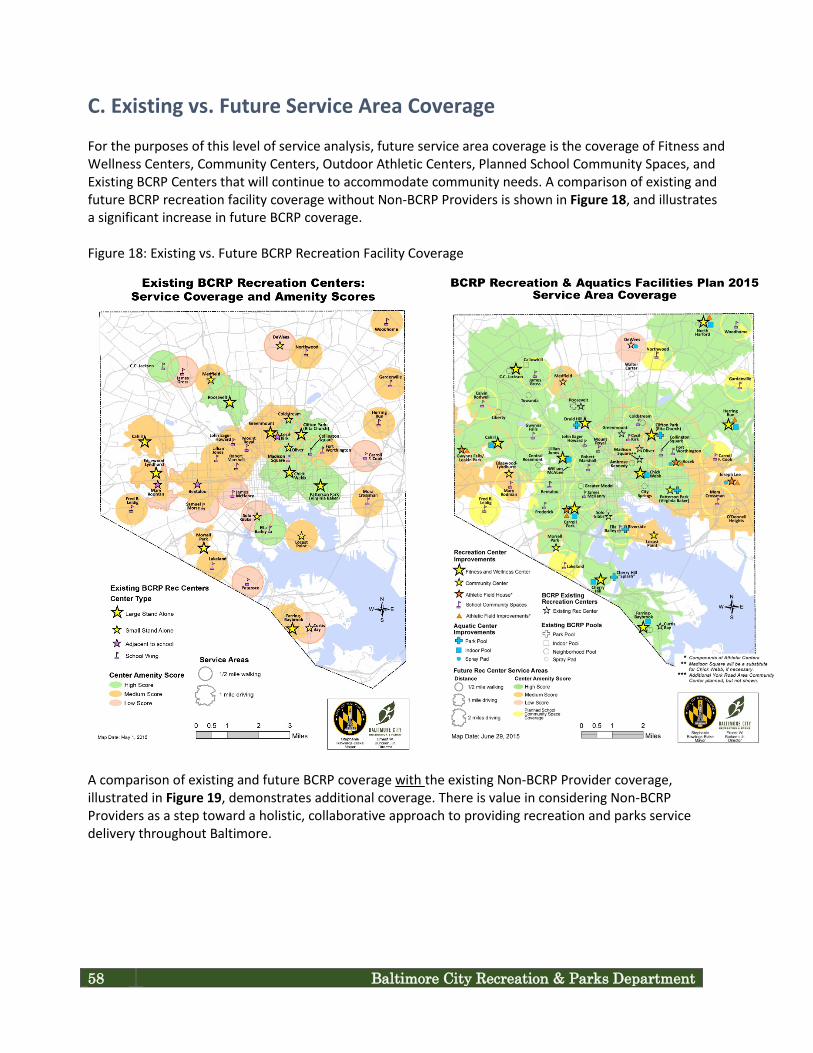
58 Baltimore City Recreation & Parks Department
C. Existing vs. Future Service Area Coverage For the purposes of this level of service analysis, future service area coverage is the coverage of Fitness and Wellness Centers, Community Centers, Outdoor Athletic Centers, Planned School Community Spaces, and Existing BCRP Centers that will continue to accommodate community needs. A comparison of existing and future BCRP recreation facility coverage without Non‐BCRP Providers is shown in Figure 18, and illustrates a significant increase in future BCRP coverage. Figure 18: Existing vs. Future BCRP Recreation Facility Coverage
A comparison of existing and future BCRP coverage with the existing Non‐BCRP Provider coverage, illustrated in Figure 19, demonstrates additional coverage. There is value in considering Non‐BCRP Providers as a step toward a holistic, collaborative approach to providing recreation and parks service delivery throughout Baltimore.

Recreation and Aquatics Facilities Analysis and Plan 59
Figure 19: Existing vs Future Coverage by BCRP and Non‐BCRP Providers
The analysis of both reveals unaddressed gaps in service coverage, warranting further evaluation of demographics, Non‐BCRP Providers, and dialogue with residents in these areas. Providing mobile recreation services, programming existing parks and open space, and evaluating transportation options to Fitness and Wellness Centers should be considered along with future center development in these areas. D. Unaddressed Gaps in Service Area Coverage The future service area coverage by BCRP and Non‐BCRP Providers was analyzed in conjunction with the gap analysis maps to determine unaddressed gaps in service. Gap desirability was determined using the selected level of service analysis criteria discussed in Section III, specifically Table 15: Gap Scoring Criteria and Weighting, p. 39 and Table 20: Maximum Gap Scores and Weights, p. 41. This review revealed two areas of the city without access to a recreation center or aquatic facility that were highly desirable locations to offer new recreation programs or a new facility as illustrated in Figure 20. The two areas were:
• North Baltimore (Roland Park, Tuscany Canterbury, Blythewood, Guilford, Homeland) • Southwest Baltimore ( Violetville, Saint Agnes, Gwynns Falls)
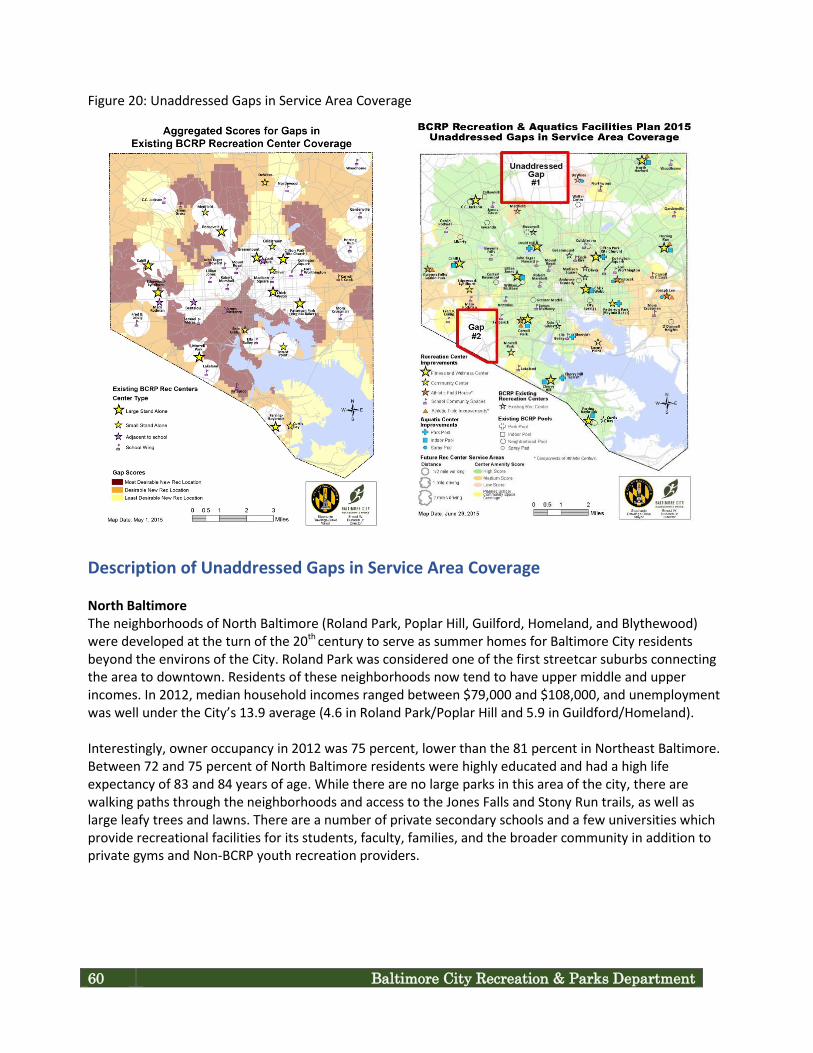
Figure 20: Unaddressed Gaps in Service Area Coverage
Description of Unaddressed Gaps in Service Area Coverage North Baltimore The neighborhoods of North Baltimore (Roland Park, Poplar Hill, Guilford, Homeland, and Blythewood) were developed at the turn of the 20th century to serve as summer homes for Baltimore City residents beyond the environs of the City. Roland Park was considered one of the first streetcar suburbs connecting the area to downtown. Residents of these neighborhoods now tend to have upper middle and upper incomes. In 2012, median household incomes ranged between $79,000 and $108,000, and unemployment was well under the City’s 13.9 average (4.6 in Roland Park/Poplar Hill and 5.9 in Guildford/Homeland). Interestingly, owner occupancy in 2012 was 75 percent, lower than the 81 percent in Northeast Baltimore. Between 72 and 75 percent of North Baltimore residents were highly educated and had a high life expectancy of 83 and 84 years of age. While there are no large parks in this area of the city, there are walking paths through the neighborhoods and access to the Jones Falls and Stony Run trails, as well as large leafy trees and lawns. There are a number of private secondary schools and a few universities which provide recreational facilities for its students, faculty, families, and the broader community in addition to private gyms and Non‐BCRP youth recreation providers.
60 Baltimore City Recreation & Parks Department
There are also a variety of private gyms and Non‐BCRP youth recreation providers. The final plan, discussed in Section VI, does not propose additional city services in this area given the wide availability of private recreational opportunities that adequately fill the area’s need and a population that makes good use of these facilities. A community center is recommended on the eastern edge of Gap #1 in the York Road area to provide additional coverage. A specific site has not been determined, but the center is anticipated to draw users from east of York Road. Southwest Baltimore The Southwest Baltimore neighborhoods of Violetville, Morrell Park, Irvington, Yale Heights, Saint Josephs, Allendale, Gwynns Falls, Saint Agnes, Wilhelm Park, and Oaklee are situated south and west of Carroll Park. Generally characterized as lower middle income, stable residential neighborhoods, 70 percent of the properties in Morrell Park and Violetville, and 61 percent of the properties in Irvington, Gwynns Falls, and Allendale were owner occupied in 2012. Residents tend to have median incomes between $33,000 and $45,000. The unemployment rate in 2012 differed quite a bit between neighborhoods, with residents of Irvington, Gwynns Falls, Allendale, Yale Heights, and Saint Agnes at 19.2 percent compared with 13.4 percent in Morrell Park and Violetville. Similar differences between the neighborhoods were visible in the percentage of households living below the poverty line at 19.8 percent and 10.7 percent respectively. In 2012, the percentage of residents with a Bachelor’s degree or higher education was well below the City’s median: Irvington, Yale Heights et al were 11 percent, and Morrell Park/Violetville were 7.9 percent. Life expectancy in these areas was slightly below the City’s average of 74 in 2012. BCRP staff examined and evaluated the North and Southwest Baltimore areas to determine opportunities for the provision of recreation program and services. North Baltimore, while lacking in BCRP facilities, contains many other Non‐BCRP private recreational facilities and opportunities for residents. Residents in these neighborhoods have multiple recreation options. Gaps in the Southwest Baltimore area could be addressed by extending existing BCRP recreation services via mobile recreation facilities, programming in existing parks and open space, and making adjustments to the provision of existing transportation options. In recent developments, the Department understands that St. Agnes is currently in talks with the YMCA of Central Maryland to build a new facility on the Old Cardinal Gibbons site. A multi‐purpose synthetic turf field is already planned and funded as part of the redevelopment. If this happens it will eliminate the gap in recreation services in the Southwest area altogether. The results of these findings informed the revision to the recreation and aquatics facilities plan discussed in Section VI together with research of current national recreation trends and models as well as strategies used by other cities to provide recreation services and serve recreation needs (discussed in Section V).
Recreation and Aquatics Facilities Analysis and Plan 61

62 Baltimore City Recreation & Parks Department

Recreation and Aquatics Facilities Analysis and Plan 63
V. A NEW DIRECTION FOR RECREATION PROVISION IN BALTIMORE
Similar to many urban recreation and parks agencies throughout the country, BCRP is evaluating how programs and services are delivered through a city‐wide system of recreation centers and aquatics facilities. A challenge exists in striking a balance between maintaining local neighborhood services amidst the reality of aging and outdated facilities, while responding to demands for higher quality and more diverse, up to date programs. To inform the agency’s recreation and aquatic facility plan moving forward, BCRP looked at current trends in Baltimore City as well as recreation facility and programming across the country to see how other cities are addressing similar issues. The Department concurrently undertook an assessment of its existing recreation services over the past year to align and inform its programs and services with the agency’s mission and vision moving forward. The review of Baltimore City trends and national trends in facilities and programming, together with the key findings, strategies, and actions outlined in the Department’s Services Assessment advocate for the Department to take a broader, more holistic approach to the provision of recreation services in Baltimore City. A. Baltimore City Trends Baltimore City’s Healthy Baltimore 2015 Plan has outlined a bold vision: “A city where all residents realize their full health potential.” The plan calls for a commitment from every city agency, the health industry, the private sector, and Baltimore citizenry to engage in understanding the relevance of where residents live, work, and play on their health outcomes. The plan highlights the importance of designing communities for health promotion by providing safer opportunities for residents to walk to schools, parks, and recreational facilities, which in turn supports active lifestyles. According to the 2009 “Baltimore City Community Health Survey,” 33.8 percent of all Baltimore citizens are obese (39.4 percent of low income residents, 16.5 percent of high income residents). Healthy Baltimore 2015 has set ambitious community improvement goals in several priority areas. BCRP is poised to move forward with quality leadership to provide a high level of programs, services, and facilities for all of Baltimore’s citizens, which can directly impact the following Healthy Baltimore 2015 priorities:
• Be Tobacco Free • Redesign Communities to Prevent Obesity • Promote Heart Health • Promote Healthy Children and Adolescents • Create Health Promoting Neighborhoods
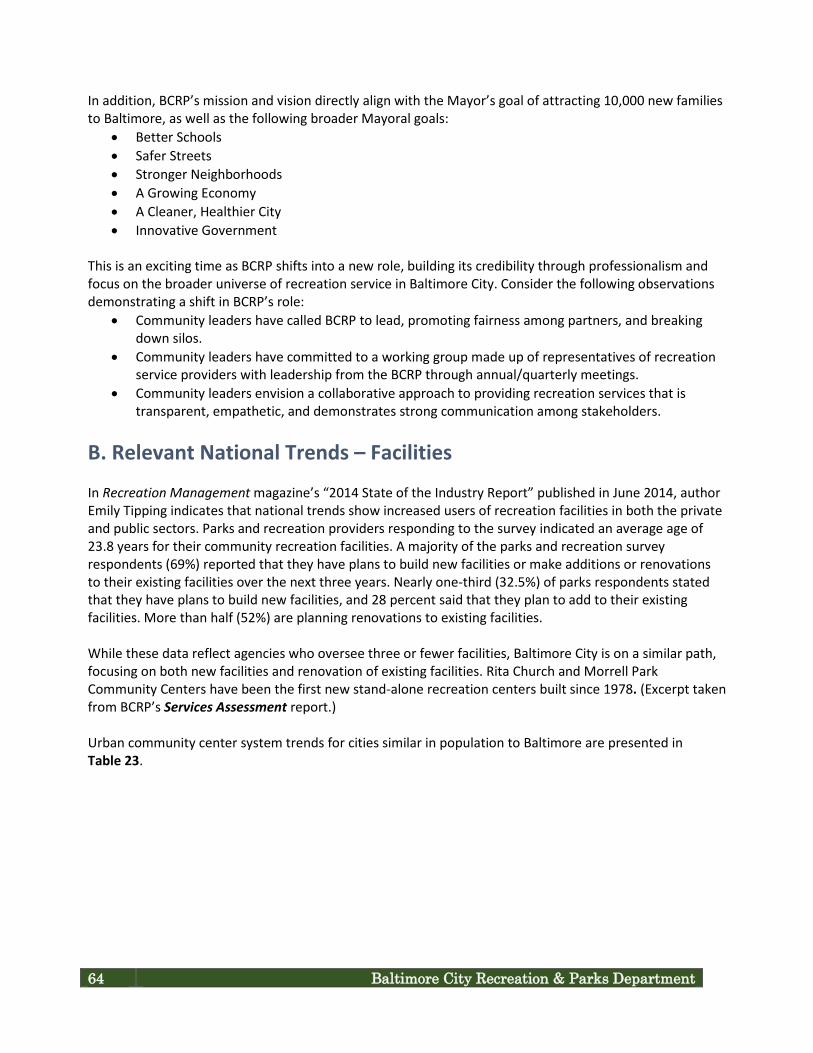
In addition, BCRP’s mission and vision directly align with the Mayor’s goal of attracting 10,000 new families to Baltimore, as well as the following broader Mayoral goals:
• Better Schools • Safer Streets • Stronger Neighborhoods • A Growing Economy • A Cleaner, Healthier City • Innovative Government
This is an exciting time as BCRP shifts into a new role, building its credibility through professionalism and focus on the broader universe of recreation service in Baltimore City. Consider the following observations demonstrating a shift in BCRP’s role:
• Community leaders have called BCRP to lead, promoting fairness among partners, and breaking down silos.
• Community leaders have committed to a working group made up of representatives of recreation service providers with leadership from the BCRP through annual/quarterly meetings.
• Community leaders envision a collaborative approach to providing recreation services that is transparent, empathetic, and demonstrates strong communication among stakeholders.
B. Relevant National Trends – Facilities In Recreation Management magazine’s “2014 State of the Industry Report” published in June 2014, author Emily Tipping indicates that national trends show increased users of recreation facilities in both the private and public sectors. Parks and recreation providers responding to the survey indicated an average age of 23.8 years for their community recreation facilities. A majority of the parks and recreation survey respondents (69%) reported that they have plans to build new facilities or make additions or renovations to their existing facilities over the next three years. Nearly one‐third (32.5%) of parks respondents stated that they have plans to build new facilities, and 28 percent said that they plan to add to their existing facilities. More than half (52%) are planning renovations to existing facilities. While these data reflect agencies who oversee three or fewer facilities, Baltimore City is on a similar path, focusing on both new facilities and renovation of existing facilities. Rita Church and Morrell Park Community Centers have been the first new stand‐alone recreation centers built since 1978. (Excerpt taken from BCRP’s Services Assessment report.) Urban community center system trends for cities similar in population to Baltimore are presented in Table 23. 64 Baltimore City Recreation & Parks Department

64 Baltimore City Recreation & Parks Department
Table 23: Urban Community Center Comparisons
Community Population 2010 U.S.
Census
Current # Centers & Definitions
Projected Centers & Square Footage
Service Area Notes Siting Tools Used
Denver, CO 600,158 11 local 9 neighborhood 7 regional
1 regional 60K sq ft
10 NSRAs (Neighborhood Recreation Service Areas) determined with major geographic boundaries. LOS measured in 1/3 mile for walkability and 3 mile radius for regional centers
Service Equity Gap Analysis. Focused on combination of walkable (local), neighborhood, and regional LOS.
Prince George’s County, MD
863,420
43 neighborhood 2 regional (to
become multi‐generational)
Will repurpose and remodel – no closures
9 multi‐generational 60‐80K sq ft
9 service areas defined (non‐political, based on population projections)
Market Study Cost Recovery Population Projections Travel Distance – 10 min by
car Active access – building 200
miles of trails Equity – site regardless of
income levels
Virginia Beach, VA 437,994
4 ‐ 82K+ sq ft 1 ‐ 22K sq ft 1 ‐ 70K sq ft
1 renovation 67K sq ft;
7 service areas; not related to unserved populations
No reported data
Tulsa, OK 391,886
(2010) 21 Community Centers, 11 fully functional, the remainder partial or not functional; 5 pools in operation and approved for renovation
No reported data No specific service areas
Service Equity and Gap Analysis based on composite values methodology of existing system; consideration of other providers, growing population
Baltimore 620,961 40 Recreation Centers, undesignated
11 Fitness and Wellness (30,000+ sf) 5 Community Centers 4 Outdoor Athletic Centers, 22 School‐Based
6 Geographic Recreation Service Areas
GIS based level of service gap analysis; consideration of alternative providers; existing City plans for future housing, U.S. Census data; proximity to athletic fields, transit, and active transportation opportunities
Recreation and Aquatics Facilities Analysis and Plan 65
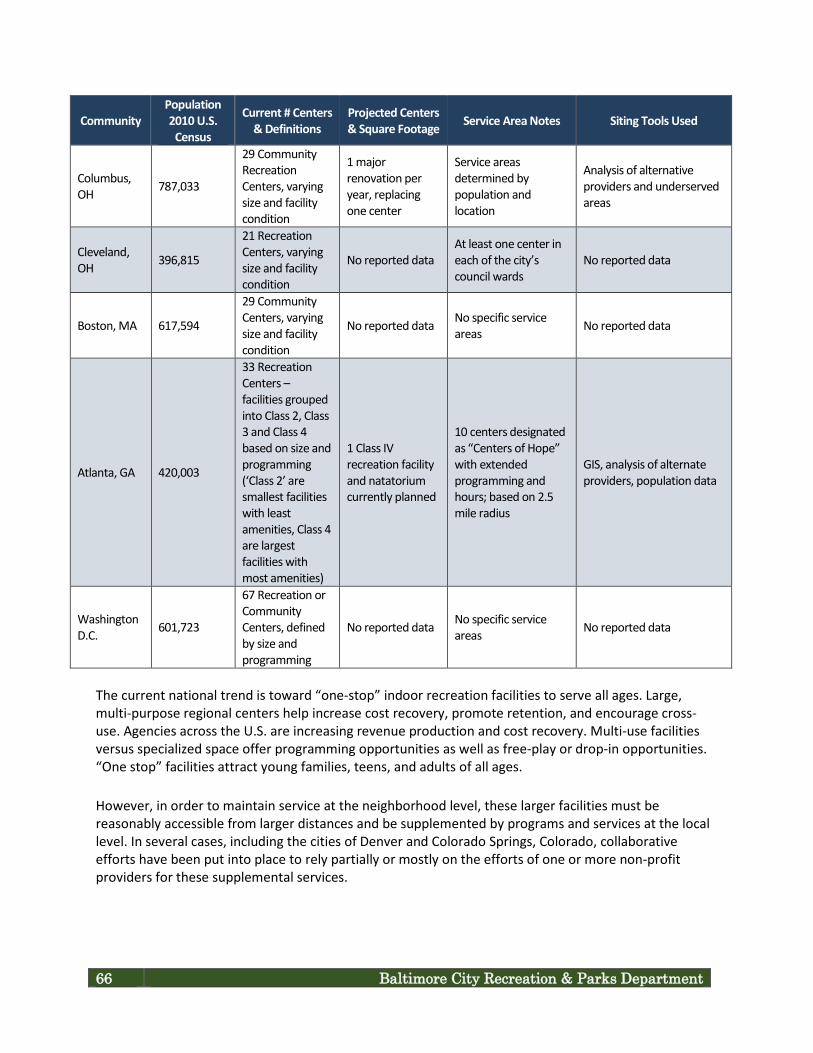
Community Population 2010 U.S.
Census
Current # Centers & Definitions
Projected Centers & Square Footage Service Area Notes Siting Tools Used
Columbus, OH 787,033
29 Community Recreation Centers, varying size and facility condition
1 major renovation per year, replacing one center
Service areas determined by population and location
Analysis of alternative providers and underserved areas
Cleveland, OH 396,815
21 Recreation Centers, varying size and facility condition
No reported data At least one center in each of the city’s council wards
No reported data
Boston, MA 617,594
29 Community Centers, varying size and facility condition
No reported data No specific service areas No reported data
Atlanta, GA 420,003
33 Recreation Centers – facilities grouped into Class 2, Class 3 and Class 4 based on size and programming (‘Class 2’ are smallest facilities with least amenities, Class 4 are largest facilities with most amenities)
1 Class IV recreation facility and natatorium currently planned
10 centers designated as “Centers of Hope” with extended programming and hours; based on 2.5 mile radius
GIS, analysis of alternate providers, population data
Washington D.C. 601,723
67 Recreation or Community Centers, defined by size and programming
No reported data No specific service areas No reported data
The current national trend is toward “one‐stop” indoor recreation facilities to serve all ages. Large, multi‐purpose regional centers help increase cost recovery, promote retention, and encourage cross‐use. Agencies across the U.S. are increasing revenue production and cost recovery. Multi‐use facilities versus specialized space offer programming opportunities as well as free‐play or drop‐in opportunities. “One stop” facilities attract young families, teens, and adults of all ages. However, in order to maintain service at the neighborhood level, these larger facilities must be reasonably accessible from larger distances and be supplemented by programs and services at the local level. In several cases, including the cities of Denver and Colorado Springs, Colorado, collaborative efforts have been put into place to rely partially or mostly on the efforts of one or more non‐profit providers for these supplemental services.
66 Baltimore City Recreation & Parks Department

Recreation and Aquatics Facilities Analysis and Plan 67
C. Relevant National Trends – Programs General Programming One of the most common concerns in the recreation industry is creating innovative programming to draw participants into facilities and services. According to Recreation Management magazine’s “2013 State of the Industry Report,” the most popular programs offered by survey respondents include holiday events and other special events (64.2 %), fitness programs (61.4%), educational programs (58.9%), day camps and summer camps (55.2%), youth sports teams (54.3%), sports tournaments and races (49.2 %), mind‐body/balance programs (49.1%), swimming programming (teams and lessons) (48.5%), adult sports teams (47.8 %), sports training (44.1%), arts and crafts (42.7%), and programs for active older adults (40.9%). The report also suggested that slightly more than three in ten (30.2%) respondents indicated that they are planning to add additional programs at their facilities over the next three years. The most common types of programming they are planning to add include:
• Educational programs (up from No. 5 on 2012 survey) • Fitness programs (up from No. 3) • Mind‐body/balance programs – yoga, tai chi, Pilates, or martial arts (up from No. 6) • Day camps and summer camps (up from No. 10) • Holiday events and other special events (up from No. 7) • Environmental education (down from No. 1) • Teen programming (down from No. 2) • Active older adults programming (down from No. 4) • Sports tournaments or races (not on the 2012 survey) • Sport training (not on the 2012 Survey)
Off the top 10 list for new programming from 2012 are adult sport teams and performing arts. Fitness Programming There have been many changes in fitness programs in the last decade. The American College of Sports Medicine’s (ACSM’s) Health and Fitness Journal has conducted an annual survey since 2007 to determine trends that would help create a standard for health and fitness programming. Table 24 shows survey results that focus on trends in the commercial, corporate, clinical, and community health and fitness industry. Strength training remains at a solid 2nd for the second year in a row and body weight training appears for the first time in the top 20 trend survey.
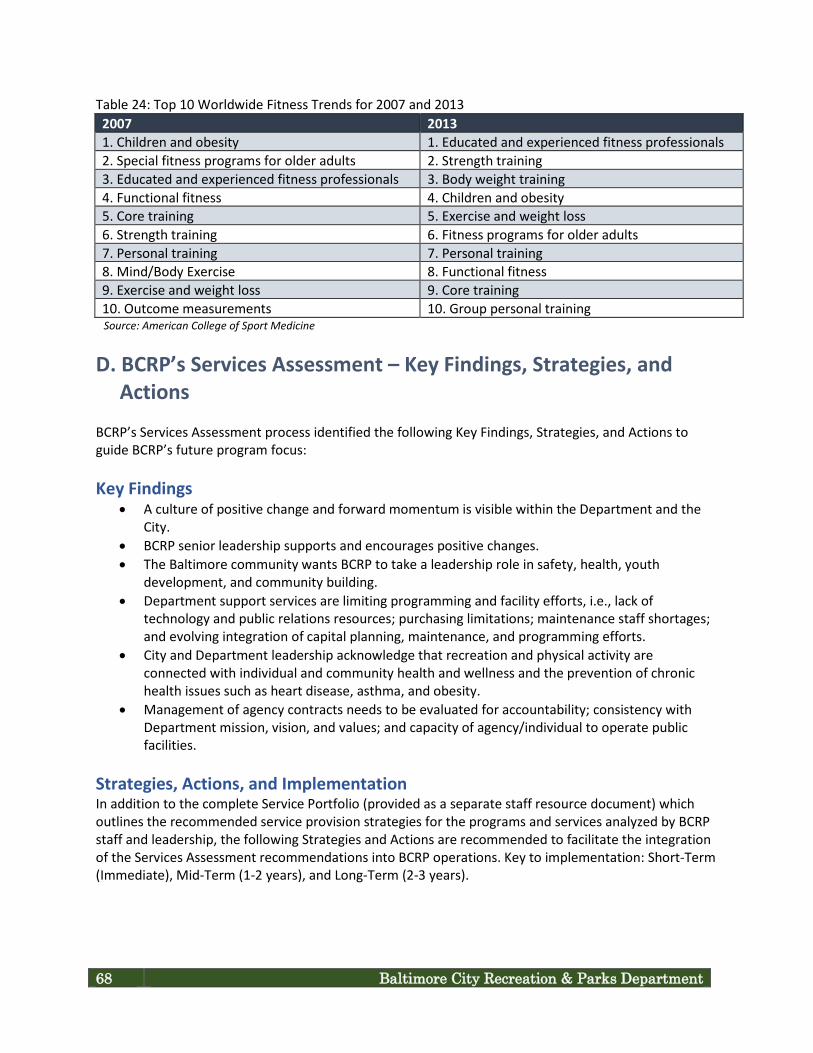
Table 24: Top 10 Worldwide Fitness Trends for 2007 and 2013 2007 2013 1. Children and obesity 1. Educated and experienced fitness professionals 2. Special fitness programs for older adults 2. Strength training 3. Educated and experienced fitness professionals 3. Body weight training 4. Functional fitness 4. Children and obesity 5. Core training 5. Exercise and weight loss 6. Strength training 6. Fitness programs for older adults 7. Personal training 7. Personal training 8. Mind/Body Exercise 8. Functional fitness 9. Exercise and weight loss 9. Core training 10. Outcome measurements 10. Group personal training Source: American College of Sport Medicine
D. BCRP’s Services Assessment – Key Findings, Strategies, and
Actions BCRP’s Services Assessment process identified the following Key Findings, Strategies, and Actions to guide BCRP’s future program focus: Key Findings
• A culture of positive change and forward momentum is visible within the Department and the City.
• BCRP senior leadership supports and encourages positive changes. • The Baltimore community wants BCRP to take a leadership role in safety, health, youth
development, and community building. • Department support services are limiting programming and facility efforts, i.e., lack of
technology and public relations resources; purchasing limitations; maintenance staff shortages; and evolving integration of capital planning, maintenance, and programming efforts.
• City and Department leadership acknowledge that recreation and physical activity are connected with individual and community health and wellness and the prevention of chronic health issues such as heart disease, asthma, and obesity.
• Management of agency contracts needs to be evaluated for accountability; consistency with Department mission, vision, and values; and capacity of agency/individual to operate public facilities.
Strategies, Actions, and Implementation In addition to the complete Service Portfolio (provided as a separate staff resource document) which outlines the recommended service provision strategies for the programs and services analyzed by BCRP staff and leadership, the following Strategies and Actions are recommended to facilitate the integration of the Services Assessment recommendations into BCRP operations. Key to implementation: Short‐Term (Immediate), Mid‐Term (1‐2 years), and Long‐Term (2‐3 years).
68 Baltimore City Recreation & Parks Department

Strategy Actions Implementation QUALITY FOCUS a. Establish performance measures for staff, programs,
and services. Short‐Term
DATA DRIVEN DECISION‐MAKING
a. Establish Services Assessment Tool in the organization. b. Consider establishing a combined marketing and
research unit. c. Conduct cost recovery exercise to supplement Services
Assessment data.
Short‐Term Long‐Term Mid‐Term
SUPERIOR LEADERSHIP
a. Provide and foster high quality, professional leadership of park and recreation services in Baltimore City, both internally within the Department and externally within the community.
Short‐Term
PROMOTE POSITIVE CHANGE
a. Institute formal multi‐neighborhood outreach efforts and listening sessions to share programs, volunteer opportunities, community center/neighborhood center plans, etc.
b. Enhance and coordinate social media presence on Facebook, Twitter, Pinterest, Instagram, videos; i.e. match icons on website to social media sites, connect with NBC “Shine A Light” initiative.
Short‐Term Short‐Term
Recreation and Aquatics Facilities Analysis and Plan 69

E. Integration of Recreation and Aquatics Facilities Analysis and Plan with Services Assessment
The Services Assessment provided an inventory and assessment of more than 170 programs and services currently delivered by BCRP in 27 service categories. BCRP staff received training in how to use the Services Assessment as a planning tool which evaluates a program’s alignment with BCRP’s values, vision, and mission; market position; and revenue potential. As future fitness and wellness and community centers are designed, the Services Assessment tool facilitates data‐driven programming decisions to maximize participation, achieve high levels of customer satisfaction, and develop positive revenue streams. In addition to facility user fees, other activities that generate significant revenue without large staff and other costs are instructional classes, birthday parties, special events, athletic field rentals, and community center rentals. Other sources of income could include: grants, sponsorships, equipment rentals and sales, training camps, sales of licensed merchandise, vending, and food concession sales. A component of the Services Assessment determined a provision strategy for each program or service. There are seven service provision strategies, ranging from Core Services, which BCRP has identified as central to the agency’s mission, vision, and values and benefitting all community members, to Divest, which suggests the program or service is not relevant to BCRP’s mission, vision, and values, or the department lacks the capacity to deliver the program. For the purpose of this report, two service provision strategies are discussed – Affirm Market Position and Advance Market Position. Programs that BCRP staff scored in these strategies warrant consideration for inclusion in BCRP’s future community center programming. Affirm Market Position Definition A number of (or one significant) alternative provider(s) exists, yet the service has financial capacity (ability to generate revenue outside of tax resources), and BCRP is in a strong market position to provide the service to customers or the community. Affirming market position includes efforts to capture more of the market and investigating the merits of competitive pricing strategies. This includes investment of resources to realize a financial return on investment. Typically, these services have the ability to generate excess revenue. Analysis Numerous services scored with a service strategy to Affirm Market Position. Affirming market position suggests a strategy to carry existing service forward into new service areas as sites are selected, expanding market reach, evaluating pricing strategies, and enhancing investment of resources to realize a return on investment. Table 25 lists some of the programs and services recommended for this strategy.
70 Baltimore City Recreation & Parks Department

Recreation and Aquatics Facilities Analysis and Plan 71
Table 25: BCRP Sample List of Services Indicated for Affirming Market Position Service Category Program or Service
Arts and Culture • Native American Programs • Black History Month Classes
Youth and Adult Sports • Basketball – Youth and Adult Sports • Ice Hockey, Ice Skating
Aquatics • Water Aerobics/Aquatic Zumba – Seniors Out of School Time • Camps – all themes Specialized Events Requiring Registration • Host Webinars
Facility Rentals/Exclusive Use • Private/Public/Individual Rentals (includes Birthday Parties)
Maintenance • Car parking for outdoor events • Clean outdoor rented space for permitted activities
Advance Market Position Definition A smaller number of (or no) alternative providers exist to provide the service, it has financial capacity, and BCRP is in a strong market position to provide it. Primarily due to the fact that there are fewer, if any, alternative providers, advancing market position of the service is a logical operational strategy. This includes efforts to capture more of the market (promotion, outreach, etc.) and investigating the merits of market pricing. Also, this service could generate excess revenue by increasing volume. Analysis Similar to programs and services scored in the Affirm Market Position strategy, numerous services scored in this service provision strategy. Table 26 lists some of the programs and services recommended for this strategy.

Table 26: BCRP Sample List of Services Indicated for Advancing Market Position Service Category Program or Service
Fitness and Wellness • Walking Programs, Line Dancing/Folk Dancing – Seniors
• Aerobics/Jazzercise/fitness/Zumba/Dance
Arts and Culture • Arts and Crafts, Performing Arts • Cooking and Language Classes
Youth and Adult Sports • Adaptive Sports Classes • Baseball, Broomball, Floor Hockey, Wheelchair Basketball
Outdoor • Beginner Kayaking, Inner Harbor Kayak Tours Environmental Education/Nature Programs
• Exhibits/Shows • Tours/Walks (guided) – Seniors
Community Wide Events • Senior Trips, City‐wide Senior Special Events
• Fun Wagon Mobile Recreation Unit Facility Rentals/Exclusive Use • Pavilion Rentals, Garden and Facility Rentals Applications/Permitted Services • Facility and Event Permitting Support Services • Volunteer data collection, orientation, and recognition
72 Baltimore City Recreation & Parks Department

VI. BCRP’S 2015 RECREATION AND AQUATIC FACILITIES PLAN
A. Guiding Principles The recreation and aquatics facility and program plan builds on the recommendations outlined in the Mayor’s 2011 Recreation Center Task Force Report and the BCRP’s Implementation Plan. Relevant excerpts from the report may be found in Appendix D: Mayor’s 2011 Recreation Center Task Force Report. The final plan is also informed by the geographic gap analysis provided in this report along with an assessment of the Department’s services and programs. The plan is further guided by the following principals and priorities:
• Equitable Citywide Distribution. Locate facilities with equitable geographic distribution throughout the city to serve all residents.
• Address Gaps in Service. Create new facilities where needed to address existing lack of recreation opportunities.
• Focus on Quality over Quantity of Facilities. Maximize the use and improvement of recreation facilities for future programming and use.
• Locate Recreation and Aquatic Facilities in or next to Existing Parks, Athletic Fields, and Schools. Co‐locate facilities to integrate multi‐activity programming and operations and to maximize facility use.
• Program for all Age Groups and Socio‐Economic Levels. Expand recreation programs beyond after school programs to focus on all age groups, individuals, families, seniors, and communities.
• Access to Public Transportation. Locate facilities near existing bus, subway, and light rail services; park trails; and bicycle routes to ensure easy access with or without cars.
• Promote Recreation and Health. Promote recreation as part of an active, healthy lifestyle and as a method to address obesity. Align with the Mayor’s and Department of Health’s goals for Healthy Baltimore 2015.
• Support the Mayor’s Goal to Increase the City’s Population by 10,000 Families. Provide attractive, state‐of‐the‐art recreation facilities and programs to serve existing residents and attract new residents to Baltimore and to grow the City’s tax base.
• Collaborate with Non‐BCRP Recreation Providers. Work with Non‐BCRP recreation providers to expand recreation resources to Baltimore City residents.
• Locate Facilities to Support Areas Targeted For Public Investment. Locate recreation facilities in or near areas with current and future plans for public investment, including the Red Line light rail line, new mixed use and housing development, 21st Century Schools, and targeted economic investment.
Recreation and Aquatics Facilities Analysis and Plan 73

B. Facility Types and Program Strategy The new facilities in the Recreation and Aquatics Facilities Plan are different from BCRP’s existing facilities. The plan will upgrade, expand, and restructure existing recreation center facilities to function as multi‐ activity and multi‐generational complexes, making use of existing BCRP components, including parks, outdoor athletic fields, field houses, outdoor pools, and splash pads. The new Fitness and Wellness Centers are larger in square footage, offer more programming with longer operating hours, and incorporate an indoor pool. The new facilities are also projected to generate revenue. They will be located in or adjacent to parks with access to outdoor athletic fields and recreational facilities (outdoor pool, skate park, park trails, etc.) depending upon the park. These locations will offer extended morning and evening operating hours and a full range of programs to attract and serve all age groups. The centers will serve as a hub for a range of recreational activities including fitness and wellness, aquatics, youth and adult sports, environmental education, and active outdoor programs. Outdoor Athletic Centers comprised of athletic fields and field houses will support BCRP core programs, relieve the overuse of many existing athletic fields, and provide additional opportunities for programming and revenue generation. Existing recreation centers will continue to provide programs at current levels. After the newer types of centers are opened, BCRP will re‐evaluate the programming offerings within the new landscape of recreation services, and if necessary, repurpose underutilized facilities and programs to serve other unmet local recreation and park needs. All plans for facility re‐use will be determined in consultation with the local community. An additional 22 school‐based community spaces are planned in conjunction with Baltimore City Public Schools’ (BCPSS) “21st Century Building Plan.” Nineteen (19) of these spaces are at locations with existing recreation centers, and three (3) will be new recreation program spaces. The 22 recreation spaces will be planned, reconfigured, and programmed together with BCPSS’s funded building plan. The capital plan identifies a combination of community center types and park locations for existing facility upgrades or new construction projects. Facilities are categorized into specific types: Fitness and Wellness Centers (11), Community Centers (5), Outdoor Athletic Centers (4), School‐Based Recreation Spaces (22), Outdoor Pools and Spray Pads (8) and Indoor Pools (8). Fitness and Wellness Centers Fitness and Wellness centers are recreation facilities that are located in or near parks, other recreational facilities, and athletic fields. These larger (30,000+ s.f.), full‐service centers will provide multiple programs and activities for all ages, extended hours of operation in the mornings and afternoons, and 6 ‐ 7 day operations. The centers will include spaces such as fitness areas, dance and multi‐purpose rooms, a gymnasium, and men’s and women’s locker rooms. Several of the new facilities will include indoor pools. The wide variety of programming will be designed for individuals, teens, youth, adults, active older adults, and families and will attract residents citywide.
74 Baltimore City Recreation & Parks Department

Community Centers Community centers are recreation facilities that located in or near parks, other aquatics facilities, and athletic fields. These smaller centers (less than 30,000 s.f.) will provide a range of programs and activities for all ages with extended hours of operation. The facilities will vary in size and programming depending upon location. Expanded spaces may include a fitness room, dance spaces, multi‐purpose rooms, lobby and circulation areas, and men’s/women’s changing rooms/bathrooms. Programming will likely serve more local residents. Outdoor Athletic Centers Outdoor athletic centers are focused around team field sports, playgrounds, and fitness facilities and are located in parks. Seasonal athletic centers will vary in facilities, size, and programming depending upon location. Facilities may include a field house, lighted athletic artificial turf fields, grass fields, a playground, outdoor spray pad, walking loop, and fitness stations and parking. Some of these facilities will operate on a seasonal basis with a strong focus on outdoor recreation programs and will support summer day camp activities. School‐Based Recreation Spaces School‐based recreation spaces will offer local recreation programs and activities operated in multi‐purpose spaces housed within Baltimore City Public Schools’ new 21st Century school buildings. BCRP will provide recreation programming at levels to be determined in conjunction with the local community and school needs. Outdoor Pools and Spray Pads The larger outdoor pools are located in major parks. These citywide facilities will be upgraded and renovated to improve bathhouse and pool facilities and provide new water park features. This will bring the facilities up to current industry standards. Several new stand‐alone water spray pads will be built to serve outdoor athletic centers and parks and expand access to outdoor water features during the warmer months. These facilities, with interactive water features and jet sprays, will be open to all and operate with part time aquatic staffing. The spray pads serve a wide range of ages, including adults. All existing outdoor neighborhood pools will remain open and continue to operate with current programming. As new facilities open in the future, these facilities will be reevaluated to determine how they can best serve community and area needs for parks and recreation. Indoor Pools Indoor Pools are a new component of the Recreation and Aquatics Plan. The Department currently has three facilities and plans to include several new indoor pool facilities as part of the Fitness and Wellness Centers. These new citywide facilities will be open year round and focus on learn to swim programming, leisure and active play areas for all ages, individuals and families. The plan acknowledges two gaps in the provision of existing recreation services: North Baltimore (Gap #1) and Southwest Baltimore (Gap #2). Needs identified for additional recreation services in Southwest Baltimore (Gap #2) will likely be addressed by a facility to be developed by a Non‐BCRP provider. In North Baltimore, the gaps are adequately addressed by a variety of facilities provided by private educational and private institutions.
Recreation and Aquatics Facilities Analysis and Plan 75

76 Baltimore City Recreation & Parks Department
C. Recreation Program Strategy Programming at the new community center complexes and facilities will build upon the Department’s strategy to support active, healthy lifestyles; address obesity; and to appeal to individuals, families, and community residents of all age groups. Programs will be designed to foster and develop a range of educational, recreational, cultural, fitness and wellness, and life skills. While there will be core programs, supplemental program offerings will vary by center to reflect the interests and needs of the local communities. Communities will be encouraged to participate in the design and program development of the centers. The Department will also encourage collaboration with other Non‐BCRP providers to offer joint or specialized programs. Fitness and Wellness classes will be a new program component of the community centers. Classes will require registration with an additional fee, but will be priced on a sliding scale to ensure that all will be able to participate regardless of income. The centers will offer fitness classes, as such aerobics, yoga, and cardio fitness for beginners, active older adults, and intermediate levels. Youth and Teen Programs will focus on a range of active programs (martial arts, dance, and active recreation) as well as cultural (art and theater workshops), social, and after‐school programs. Manyl programs will be registration‐based to ensure adequate enrollment. BCRP Summer camps will continue to be provided and expanded to include additional activities drawing upon BCRP’s citywide facilities and programs. Youth and Adult Team Sports will include special skill‐based sports clinics and competitive sports leagues in conjunction with BCRP’s Youth and Adults Sports programs. Non‐competitive sports team options, such as baseball, football and soccer will also be available for those who do not want to compete. Active Older Adult programs will include fitness and wellness classes, social events, trips, educational, and craft related activities. Family Programs will include social activities (movie nights), active activities (dance), and healthy lifestyle related events. Specific programs will vary by center and by season. Aquatics Programs will be expanded as the new community center facilities with indoor pools are developed. Programs will focus on learn to swim, aqua aerobics, competitive swim team development, and life guard training. Programs will be offered at BCRP facilities and at some Baltimore City Public School facilities, to be determined. The 2015 Recreation and Aquatics Facilities Plan is shown in Figure 21; service area coverage of the 2015 plan is shown in Figure 22; and full citywide recreation service area coverage with both BCRP and non BCRP providers is shown in Figure 23.

D. BCRP Recreation and Aquatics Facilities Plan 2015 Figure 21: BCRP Recreation and Aquatics Facilities Plan 2015
Recreation and Aquatics Facilities Analysis and Plan 77

Figure 22: BCRP Recreation and Aquatics Facilities Plan Service Area Coverage 2015
78 Baltimore City Recreation & Parks Department

Figure 23: Citywide BCRP and Non BCRP Recreation Plan Service Area Coverage 2015
Recreation and Aquatics Facilities Analysis and Plan 79
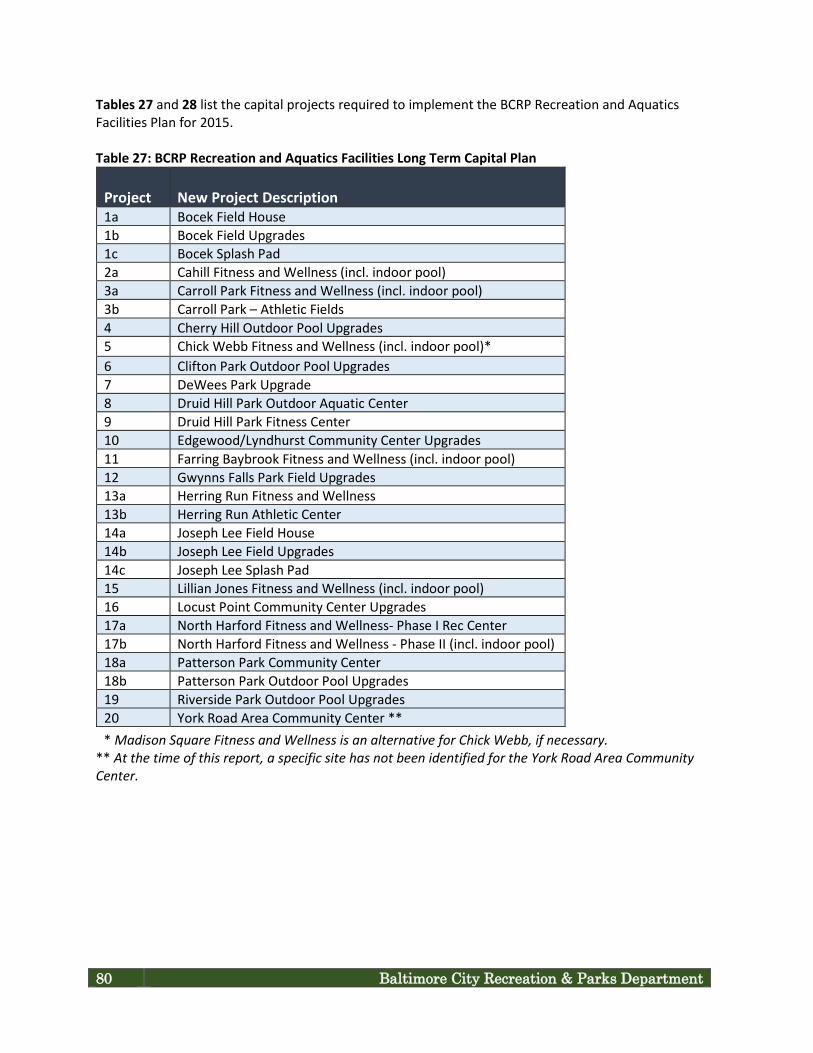
Tables 27 and 28 list the capital projects required to implement the BCRP Recreation and Aquatics Facilities Plan for 2015. Table 27: BCRP Recreation and Aquatics Facilities Long Term Capital Plan Project
New Project Description
1a Bocek Field House 1b Bocek Field Upgrades 1c Bocek Splash Pad 2a Cahill Fitness and Wellness (incl. indoor pool) 3a Carroll Park Fitness and Wellness (incl. indoor pool) 3b Carroll Park – Athletic Fields 4 Cherry Hill Outdoor Pool Upgrades 5 Chick Webb Fitness and Wellness (incl. indoor pool)* 6 Clifton Park Outdoor Pool Upgrades 7 DeWees Park Upgrade 8 Druid Hill Park Outdoor Aquatic Center 9 Druid Hill Park Fitness Center 10 Edgewood/Lyndhurst Community Center Upgrades 11 Farring Baybrook Fitness and Wellness (incl. indoor pool) 12 Gwynns Falls Park Field Upgrades 13a Herring Run Fitness and Wellness 13b Herring Run Athletic Center 14a Joseph Lee Field House 14b Joseph Lee Field Upgrades 14c Joseph Lee Splash Pad 15 Lillian Jones Fitness and Wellness (incl. indoor pool) 16 Locust Point Community Center Upgrades 17a North Harford Fitness and Wellness‐ Phase I Rec Center 17b North Harford Fitness and Wellness ‐ Phase II (incl. indoor pool) 18a Patterson Park Community Center 18b Patterson Park Outdoor Pool Upgrades 19 Riverside Park Outdoor Pool Upgrades 20 York Road Area Community Center ** * Madison Square Fitness and Wellness is an alternative for Chick Webb, if necessary.
** At the time of this report, a specific site has not been identified for the York Road Area Community Center.
80 Baltimore City Recreation & Parks Department

Table 28: New BCRP School Based Recreation Spaces New School Based Recreation Spaces 1 Fort Worthington ES 2 John Eager Howard ES 3 Frederick ES 4 Northwood ES 5 Mora Crossman/John Rurah ES/MS 6 Calvin Rodwell ES 7 Mary E Rodman ES 8 Gywnns Falls ES 9 John D Gross/Edgecomb Circle ES/MS 10 Mt. Royal ES 11 Fred B Leidig/Beechfield ES/MS 12 Robert C Marshall/Templeton ES 13 Collington Square ES 14 Carroll F Cook/Armistead Gardens ES/MS 15 Gardenville/Hazelwood ES/MS 16 James McHenry ES 17 Bentalou/Mary Winterling ES 18 Lakeland ES/MS 19 Woodhome ES 20 Cecil‐Kirk 21 Coldstream ES 22 Ella Bailey/Thomas Johnson ES/MS
Capital and Operating Costs Capital Costs The capital costs to implement the full plan are estimated to be $136.05 million in current dollars. Full implementation of the plan is dependent upon available funding and will likely take 10‐15 years, and as a result, estimated costs will have to be adjusted to reflect actual costs at the time. Capital funds are anticipated to come from a variety of State, City General, and Bond Funds, and Table Games and Casino Revenues. Implementation of the plan has already begun. If the proceeds from the sale of municipal garages is made available, implementation of the plan can be accomplished within a shorter time frame. Table 29 shows the projects with identified funding. These projects have either been recently completed or are in the process of development. Table 30 shows the new projects in the plan for which funds have not been identified.
Recreation and Aquatics Facilities Analysis and Plan 81
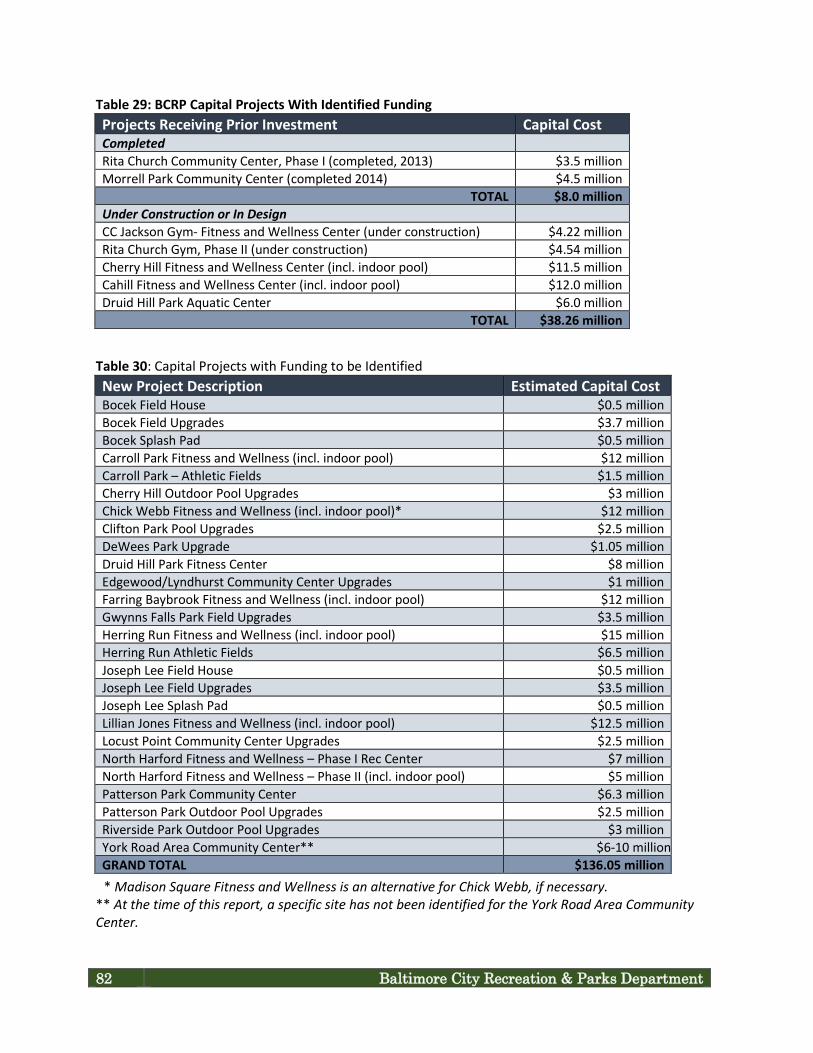
Table 29: BCRP Capital Projects With Identified Funding Projects Receiving Prior Investment Capital Cost Completed Rita Church Community Center, Phase I (completed, 2013) $3.5 million Morrell Park Community Center (completed 2014) $4.5 million
TOTAL $8.0 million Under Construction or In Design CC Jackson Gym‐ Fitness and Wellness Center (under construction) $4.22 million Rita Church Gym, Phase II (under construction) $4.54 million Cherry Hill Fitness and Wellness Center (incl. indoor pool) $11.5 million Cahill Fitness and Wellness Center (incl. indoor pool) $12.0 million Druid Hill Park Aquatic Center $6.0 million
TOTAL $38.26 million Table 30: Capital Projects with Funding to be Identified New Project Description Estimated Capital Cost Bocek Field House $0.5 million Bocek Field Upgrades $3.7 million Bocek Splash Pad $0.5 million Carroll Park Fitness and Wellness (incl. indoor pool) $12 million Carroll Park – Athletic Fields $1.5 million Cherry Hill Outdoor Pool Upgrades $3 million Chick Webb Fitness and Wellness (incl. indoor pool)* $12 million Clifton Park Pool Upgrades $2.5 million DeWees Park Upgrade $1.05 million Druid Hill Park Fitness Center $8 million Edgewood/Lyndhurst Community Center Upgrades $1 million Farring Baybrook Fitness and Wellness (incl. indoor pool) $12 million Gwynns Falls Park Field Upgrades $3.5 million Herring Run Fitness and Wellness (incl. indoor pool) $15 million Herring Run Athletic Fields $6.5 million Joseph Lee Field House $0.5 million Joseph Lee Field Upgrades $3.5 million Joseph Lee Splash Pad $0.5 million Lillian Jones Fitness and Wellness (incl. indoor pool) $12.5 million Locust Point Community Center Upgrades $2.5 million North Harford Fitness and Wellness – Phase I Rec Center $7 million North Harford Fitness and Wellness – Phase II (incl. indoor pool) $5 million Patterson Park Community Center $6.3 million Patterson Park Outdoor Pool Upgrades $2.5 million Riverside Park Outdoor Pool Upgrades $3 million York Road Area Community Center** $6‐10 million GRAND TOTAL $136.05 million * Madison Square Fitness and Wellness is an alternative for Chick Webb, if necessary.
** At the time of this report, a specific site has not been identified for the York Road Area Community Center.
82 Baltimore City Recreation & Parks Department
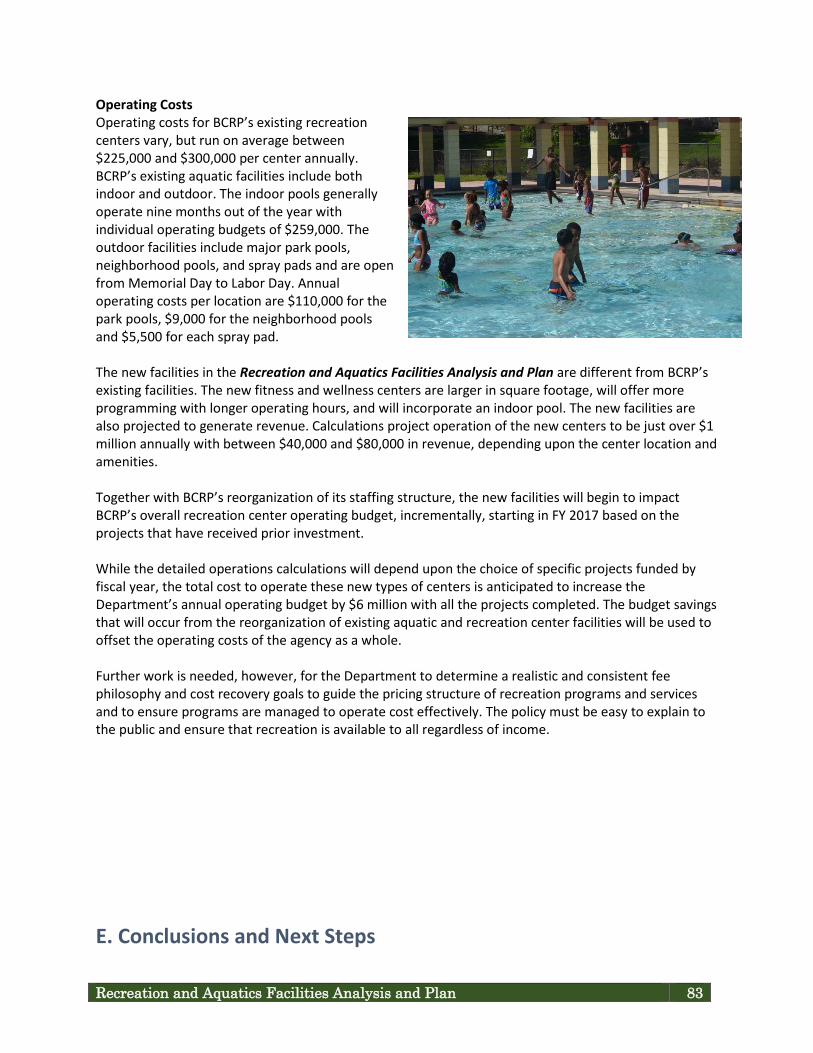
Recreation and Aquatics Facilities Analysis and Plan 83
Operating Costs Operating costs for BCRP’s existing recreation centers vary, but run on average between $225,000 and $300,000 per center annually. BCRP’s existing aquatic facilities include both indoor and outdoor. The indoor pools generally operate nine months out of the year with individual operating budgets of $259,000. The outdoor facilities include major park pools, neighborhood pools, and spray pads and are open from Memorial Day to Labor Day. Annual operating costs per location are $110,000 for the park pools, $9,000 for the neighborhood pools and $5,500 for each spray pad. The new facilities in the Recreation and Aquatics Facilities Analysis and Plan are different from BCRP’s existing facilities. The new fitness and wellness centers are larger in square footage, will offer more programming with longer operating hours, and will incorporate an indoor pool. The new facilities are also projected to generate revenue. Calculations project operation of the new centers to be just over $1 million annually with between $40,000 and $80,000 in revenue, depending upon the center location and amenities. Together with BCRP’s reorganization of its staffing structure, the new facilities will begin to impact BCRP’s overall recreation center operating budget, incrementally, starting in FY 2017 based on the projects that have received prior investment. While the detailed operations calculations will depend upon the choice of specific projects funded by fiscal year, the total cost to operate these new types of centers is anticipated to increase the Department’s annual operating budget by $6 million with all the projects completed. The budget savings that will occur from the reorganization of existing aquatic and recreation center facilities will be used to offset the operating costs of the agency as a whole. Further work is needed, however, for the Department to determine a realistic and consistent fee philosophy and cost recovery goals to guide the pricing structure of recreation programs and services and to ensure programs are managed to operate cost effectively. The policy must be easy to explain to the public and ensure that recreation is available to all regardless of income. E. Conclusions and Next Steps
The Recreation and Aquatics Facility Analysis and Plan provides direction for a new BCRP role in providing recreation facilities, programs, and services that considers:
• Quality, variety, and location of programs, facilities, and services. • New sites, restructured existing sites, use of school sites, and collaboration with Non‐BCRP
providers. • The cost of providing programs, facilities, and services.
What this means for the system of recreation centers as well as the broad programming efforts of BCRP will be continually assessed. Moving forward, it is recommended that BCRP implement the following recommendations. Continue to Evaluate Future Facility Amenities BCRP should continue to evaluate program and service opportunities for those areas of the City identified as having unaddressed gaps in recreation service as well as those with adequate coverage. It is important to identify facility amenities in coordination with program and service delivery planning. Identifying the financial and cost recovery goals of facility development, filling gaps in service delivery, ensuring social equity in program and service delivery, and ensuring proximity to trails and open space are prerequisites to determining the desired amenities. BCRP’s Recreation and Aquatic Facilities Analysis and Plan identifies specific goals and measures of success for facilities, programs, and services. Citizen engagement during the planning and design process is vital to establish community ownership of the facility. For the purposes of this report, the following amenities may be considered a baseline, and align with the programs and services identified in the “Advance Market Position” strategy discussed in Section V with regard to the Integration of the Recreation and Aquatics Facilities Analysis and Plan with the Services Assessment.
• Fitness Equipment and Room • Gym • Multi‐Purpose Room • Pool (Indoor or Outdoor)
Green space was also identified as an important component during the citizen engagement process, and siting new facilities to maximize access via walking, bicycling, and public transit supports both the Mayoral and Departmental goals of encouraging active lifestyles. Continue to Develop Cost Recovery Goals as Additional Financial Support to Operating Costs It is recommended that BCRP conduct a formal cost recovery exercise to support the existing data‐ driven information derived from the Services Assessment and Recreation and Aquatics Facility Analysis and Plan. Efforts are currently in process to develop a suitable fee structure for all activities. Having a common language for terms such as direct and indirect costs and determining what is to be included in a revenue and expense analysis are critical to the success of developing credible and usable cost recovery philosophy and related goals. Cost recovery philosophies for recreation and parks agencies
84 Baltimore City Recreation & Parks Department

across the country vary widely, largely due to community values and policy makers’ preferences. The factors involved in achieving higher cost recovery generally fall into two categories: design and programming. Design is important for several reasons. Trends across the country indicate that most people are willing to pay for value in recreation. For this reason, it is important to provide facilities that meet the community’s key needs for recreation, and in a first rate manner. Excellent design promotes facility usage, which leads to community satisfaction and positive revenue generation. Facility programming is a key factor in cost recovery. It is important to provide a range of quality activities and schedule them in response to consumer demand. Fees should be based on the perceived benefit to the community, type of service, social value, historical expectations, and impact on agency resources. Flexibility in program design and a commitment to quality is essential to meeting this objective. Marketing is a significant factor in programming success. At a very basic level, regular, periodic surveying of the community along with a regular analysis of promotional efforts including social media tracking, focus group surveys, and targeted outreach efforts are essential to understanding community values and demand for recreation programs and services. Knowledge of Non‐BCRP Providers in the community helps to avoid service gaps and unnecessary duplication. Creative efforts to enhance facility usage are also important in cost recovery. One example might be an arrangement with local hotels under which the hotels could offer their guests a discounted pass to a facility in exchange for payment for those passes or an annual fee paid to the agency. BCRP’s leadership, staff, and volunteers are well poised to continue leading the agency’s transition toward a health and livability focused, forward thinking, and data‐driven provider of comprehensive recreation and park services to all citizens of Baltimore.
Recreation and Aquatics Facilities Analysis and Plan 85

86 Baltimore City Recreation & Parks Department

APPENDIX A: GIS DATASETS USED FOR ANALYSIS
Data Layer Source Description
U.S. Census Block Groups ESRI U.S. Census
Census 2010 Block Groups with total population and age breakdowns. For more information visit ArcGIS Resources or the U.S. Census.
U.S. Census Block Centroid Populations
ESRI U.S. Census
U.S. Census Block Centroid Populations represents the populations of the U.S. Census blocks as centroids. U.S. Census blocks nest within all other tabulated census geographic entities and are the basis for all tabulated data. For more information visit ArcGIS Resources or the U.S. Census.
Population Below Poverty Level American Community Survey (ACS) 2012
ACS Table C17002: Ratio Of Income To Poverty Level In The Past 12 Months reports poverty status at the block group level for the previous year according to US Census poverty thresholds. This table was appended to the Census Block Groups layer for spatial representation and analysis. This layer was used to calculate the population below 125% poverty.
Baltimore City street centerline network Baltimore City
A routable street centerline dataset used to delineate service areas defined by a driving distance.
Multi‐use Trails BCRP Pedestrian and bike paths completed as of July 2014.
Bus Stops BCRP Locations of city bus stops. Charm City Circulator Stops BCRP Locations of charm city circulator stops. Light rail Stations BCRP Locations of light rail stations. Subway Stations BCRP Locations of subway (metro) stations. Red Line Stations BCRP Locations of planned red line stations. Mixed Income Housing BCRP Planned mixed‐income housing developments. Baltimore Development Corporation (BDC) Focus Area BCRP BDC economic investment areas. For more
information see the BDC Website.
Vacants to Values (V2V) Emerging Markets BCRP
Vacants to Values (V2V) Emerging Markets are essentially locations that have been selected by the V2V program as having a relatively greater impact on the redevelopment of an otherwise distressed area.
Vacants to Values (V2V) Community Development Clusters
BCRP Community development clusters are clustered blocks of land purchased for redevelopment and revitalization.
Healthy Neighborhoods BCRP
These are fairly stable neighborhoods that have some vacancies but will become more stable with improvements. Home loan incentives are available in these areas.
Recreation and Aquatics Facilities Analysis and Plan 87
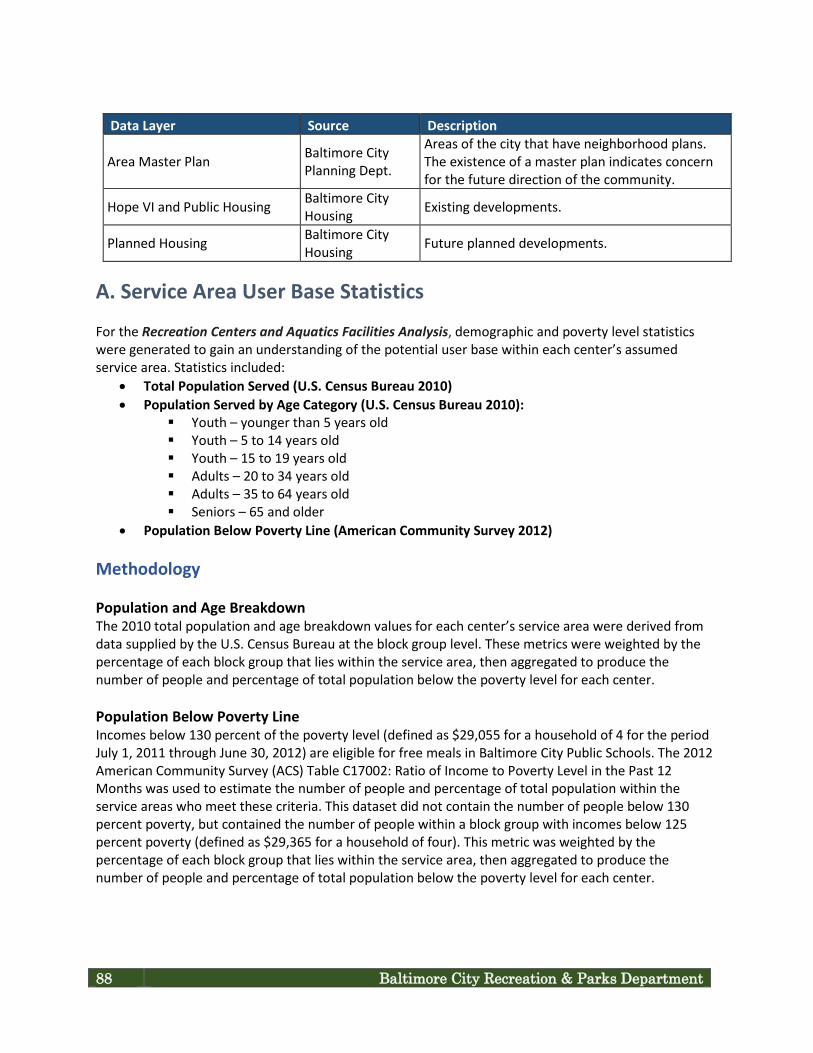
Data Layer Source Description
Area Master Plan Baltimore City Planning Dept.
Areas of the city that have neighborhood plans. The existence of a master plan indicates concern for the future direction of the community.
Hope VI and Public Housing Baltimore City Housing Existing developments.
Planned Housing Baltimore City Housing Future planned developments.
A. Service Area User Base Statistics For the Recreation Centers and Aquatics Facilities Analysis, demographic and poverty level statistics were generated to gain an understanding of the potential user base within each center’s assumed service area. Statistics included:
• Total Population Served (U.S. Census Bureau 2010) • Population Served by Age Category (U.S. Census Bureau 2010):
Youth – younger than 5 years old Youth – 5 to 14 years old Youth – 15 to 19 years old Adults – 20 to 34 years old Adults – 35 to 64 years old Seniors – 65 and older
• Population Below Poverty Line (American Community Survey 2012) Methodology Population and Age Breakdown The 2010 total population and age breakdown values for each center’s service area were derived from data supplied by the U.S. Census Bureau at the block group level. These metrics were weighted by the percentage of each block group that lies within the service area, then aggregated to produce the number of people and percentage of total population below the poverty level for each center. Population Below Poverty Line Incomes below 130 percent of the poverty level (defined as $29,055 for a household of 4 for the period July 1, 2011 through June 30, 2012) are eligible for free meals in Baltimore City Public Schools. The 2012 American Community Survey (ACS) Table C17002: Ratio of Income to Poverty Level in the Past 12 Months was used to estimate the number of people and percentage of total population within the service areas who meet these criteria. This dataset did not contain the number of people below 130 percent poverty, but contained the number of people within a block group with incomes below 125 percent poverty (defined as $29,365 for a household of four). This metric was weighted by the percentage of each block group that lies within the service area, then aggregated to produce the number of people and percentage of total population below the poverty level for each center.
88 Baltimore City Recreation & Parks Department

B. Existing Recreation Centers Service Area Statistics Table 31: Service Area User Base Statistics for Existing Recreation Centers
Name
Service Area
Total
Population Served (Census 2010)
% Y
outh
Ser
ved
(< 5
yrs
)
% Y
outh
Ser
ved
(5 ‐
14 y
rs)
% Y
outh
Ser
ved
(15
‐ 19
yrs)
% A
dults
Ser
ved
(20
‐ 34
yrs)
% A
dults
Ser
ved
(35
‐ 64
yrs)
% S
enio
rs
Serv
ed (6
5 &
% P
opul
atio
n Be
low
Pov
erty
Li
ne (A
CS 2
012)
Bentalou 1 mile 21,988 7% 20% 12% 19% 40% 12% 43% C.C. Jackson 1/2 mile 9,382 7% 23% 14% 19% 39% 13% 38% Cahill 1 mile 9,949 6% 26% 16% 19% 41% 14% 24% Carroll F. Cook 1/2 mile 3,276 8% 25% 11% 20% 40% 13% 35% Cecil‐Kirk 1 mile 23,404 7% 16% 9% 25% 41% 10% 38% Chick Webb 1 mile 28,990 6% 14% 9% 32% 37% 9% 51% Clifton Park (Rita Church) 1 mile 19,606 8% 21% 13% 20% 38% 12% 37% Coldstream 1/2 mile 9,002 8% 23% 13% 22% 39% 11% 41% Collington Square 1/2 mile 10,163 8% 22% 13% 19% 37% 13% 45% Curtis Bay 1/2 mile 3,455 10% 21% 9% 25% 39% 8% 23% DeWees 1 mile 8,138 7% 25% 16% 21% 40% 12% 23% Edgewood‐Lyndhurst 1 mile 12,219 6% 24% 14% 18% 38% 17% 29% Ella Bailey 1/2 mile 10,350 5% 5% 2% 51% 32% 7% 13% Farring‐Baybrook 1 mile 8,795 11% 24% 10% 26% 34% 7% 38% Fort Worthington 1/2 mile 9,206 8% 24% 14% 19% 37% 15% 40% Fred B. Leidig 1/2 mile 8,271 7% 22% 11% 24% 40% 9% 24% Gardenville 1/2 mile 6,366 7% 29% 16% 20% 43% 10% 19% Greenmount 1 mile 23,535 6% 15% 12% 31% 40% 10% 38% Herring Run 1/2 mile 6,045 9% 28% 15% 28% 35% 7% 25% James D. Gross 1/2 mile 8,822 8% 22% 13% 21% 37% 13% 35% James McHenry 1/2 mile 10,602 7% 20% 11% 30% 37% 9% 48% John Eager Howard 1/2 mile 12,886 7% 19% 15% 25% 39% 10% 37% Lakeland 1/2 mile 4,570 9% 27% 13% 25% 35% 8% 30% Lillian Jones 1/2 mile 13,767 8% 24% 14% 21% 38% 10% 44% Locust Point 1/2 mile 2,386 6% 6% 3% 42% 38% 8% 5% Madison Square 1/2 mile 10,725 9% 22% 16% 20% 36% 12% 49% Mary E. Rodman 1 mile 14,860 6% 23% 14% 18% 38% 16% 30% Medfield 1/2 mile 4,913 5% 15% 7% 29% 41% 14% 10% Mora Crossman 1/2 mile 4,802 8% 19% 10% 29% 35% 13% 24% Morrell Park 1 mile 2,699 7% 29% 14% 23% 41% 12% 27% Mount Royal 1/2 mile 11,518 5% 16% 13% 32% 35% 12% 40% Northwood 1/2 mile 8,793 6% 24% 30% 23% 36% 15% 15% Oliver 1/2 mile 9,562 8% 21% 13% 19% 40% 12% 38% Patapsco 1/2 mile 6,274 11% 26% 11% 23% 29% 8% 50% Patterson Park (Virginia S. Baker) 1 mile 34,630 8% 14% 7% 36% 34% 7% 32% Robert C. Marshall 1/2 mile 13,459 9% 23% 12% 23% 35% 12% 58% Roosevelt 1 mile 12,215 5% 11% 10% 32% 37% 17% 16% Samuel F. B. Morse 1/2 mile 9,172 8% 26% 15% 21% 38% 9% 48% Solo Gibbs 1/2 mile 8,594 5% 9% 4% 49% 30% 10% 22%
Recreation and Aquatics Facilities Analysis and Plan 89
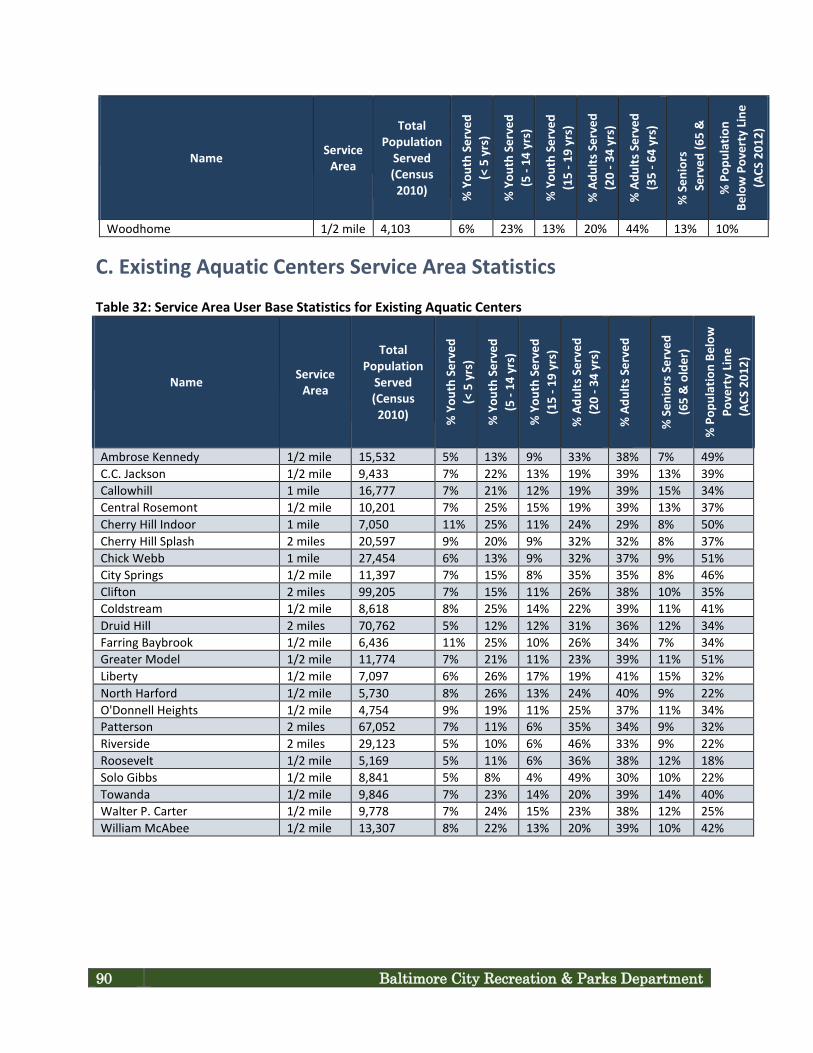
(35
‐ 64
yrs)
Name
Service Area
Total
Population Served (Census 2010)
% Y
outh
Ser
ved
(< 5
yrs
)
% Y
outh
Ser
ved
(5 ‐
14 y
rs)
% Y
outh
Ser
ved
(15
‐ 19
yrs)
% A
dults
Ser
ved
(20
‐ 34
yrs)
% A
dults
Ser
ved
(35
‐ 64
yrs)
% S
enio
rs
Serv
ed (6
5 &
% P
opul
atio
n Be
low
Pov
erty
Lin
e (A
CS 2
012)
Woodhome 1/2 mile 4,103 6% 23% 13% 20% 44% 13% 10%
C. Existing Aquatic Centers Service Area Statistics Table 32: Service Area User Base Statistics for Existing Aquatic Centers
Name
Service Area
Total Population
Served (Census 2010)
% Y
outh
Ser
ved
(< 5
yrs
)
% Y
outh
Ser
ved
(5 ‐
14 y
rs)
% Y
outh
Ser
ved
(15
‐ 19
yrs)
% A
dults
Ser
ved
(20
‐ 34
yrs)
% A
dults
Ser
ved
% S
enio
rs S
erve
d (6
5 &
old
er)
% P
opul
atio
n Be
low
Po
vert
y Li
ne
(ACS
201
2)
Ambrose Kennedy 1/2 mile 15,532 5% 13% 9% 33% 38% 7% 49% C.C. Jackson 1/2 mile 9,433 7% 22% 13% 19% 39% 13% 39% Callowhill 1 mile 16,777 7% 21% 12% 19% 39% 15% 34% Central Rosemont 1/2 mile 10,201 7% 25% 15% 19% 39% 13% 37% Cherry Hill Indoor 1 mile 7,050 11% 25% 11% 24% 29% 8% 50% Cherry Hill Splash 2 miles 20,597 9% 20% 9% 32% 32% 8% 37% Chick Webb 1 mile 27,454 6% 13% 9% 32% 37% 9% 51% City Springs 1/2 mile 11,397 7% 15% 8% 35% 35% 8% 46% Clifton 2 miles 99,205 7% 15% 11% 26% 38% 10% 35% Coldstream 1/2 mile 8,618 8% 25% 14% 22% 39% 11% 41% Druid Hill 2 miles 70,762 5% 12% 12% 31% 36% 12% 34% Farring Baybrook 1/2 mile 6,436 11% 25% 10% 26% 34% 7% 34% Greater Model 1/2 mile 11,774 7% 21% 11% 23% 39% 11% 51% Liberty 1/2 mile 7,097 6% 26% 17% 19% 41% 15% 32% North Harford 1/2 mile 5,730 8% 26% 13% 24% 40% 9% 22% O'Donnell Heights 1/2 mile 4,754 9% 19% 11% 25% 37% 11% 34% Patterson 2 miles 67,052 7% 11% 6% 35% 34% 9% 32% Riverside 2 miles 29,123 5% 10% 6% 46% 33% 9% 22% Roosevelt 1/2 mile 5,169 5% 11% 6% 36% 38% 12% 18% Solo Gibbs 1/2 mile 8,841 5% 8% 4% 49% 30% 10% 22% Towanda 1/2 mile 9,846 7% 23% 14% 20% 39% 14% 40% Walter P. Carter 1/2 mile 9,778 7% 24% 15% 23% 38% 12% 25% William McAbee 1/2 mile 13,307 8% 22% 13% 20% 39% 10% 42%
90 Baltimore City Recreation & Parks Department
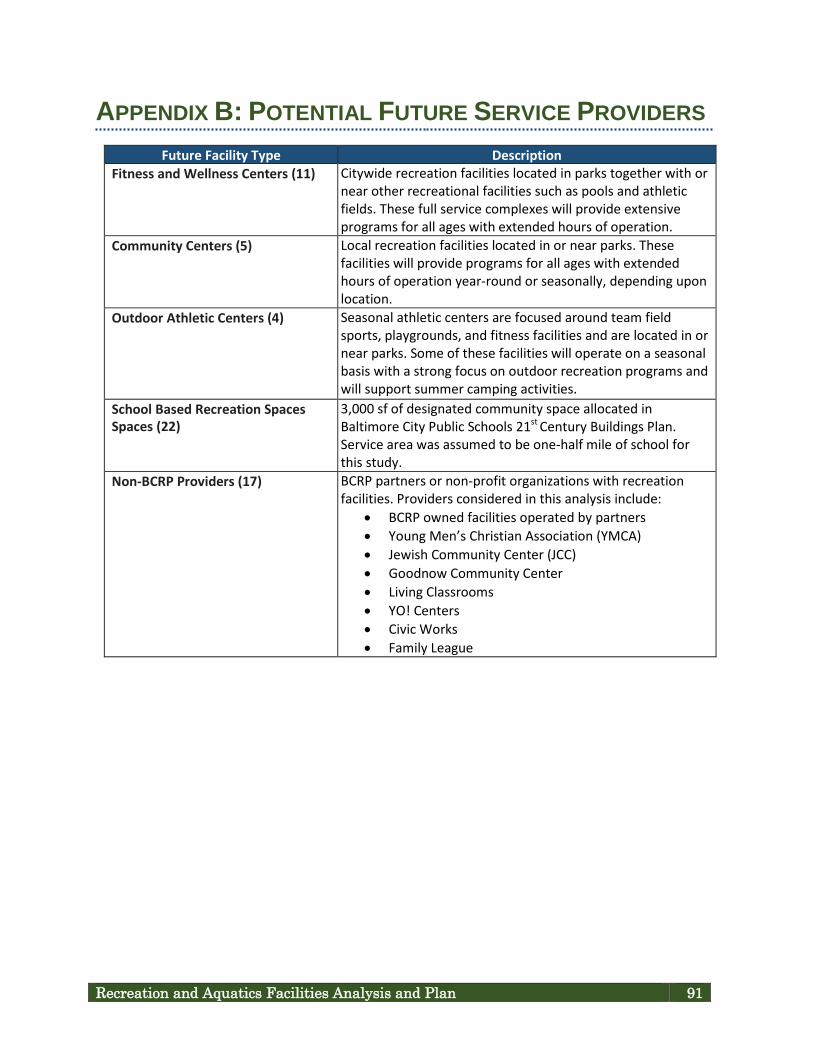
APPENDIX B: POTENTIAL FUTURE SERVICE PROVIDERS
Future Facility Type Description Fitness and Wellness Centers (11) Citywide recreation facilities located in parks together with or
near other recreational facilities such as pools and athletic fields. These full service complexes will provide extensive programs for all ages with extended hours of operation.
Community Centers (5) Local recreation facilities located in or near parks. These facilities will provide programs for all ages with extended hours of operation year‐round or seasonally, depending upon location.
Outdoor Athletic Centers (4) Seasonal athletic centers are focused around team field sports, playgrounds, and fitness facilities and are located in or near parks. Some of these facilities will operate on a seasonal basis with a strong focus on outdoor recreation programs and will support summer camping activities.
School Based Recreation Spaces Spaces (22)
3,000 sf of designated community space allocated in Baltimore City Public Schools 21st Century Buildings Plan. Service area was assumed to be one‐half mile of school for this study.
Non‐BCRP Providers (17) BCRP partners or non‐profit organizations with recreation facilities. Providers considered in this analysis include:
• BCRP owned facilities operated by partners • Young Men’s Christian Association (YMCA) • Jewish Community Center (JCC) • Goodnow Community Center • Living Classrooms • YO! Centers • Civic Works • Family League
Recreation and Aquatics Facilities Analysis and Plan 91

92 Baltimore City Recreation & Parks Department
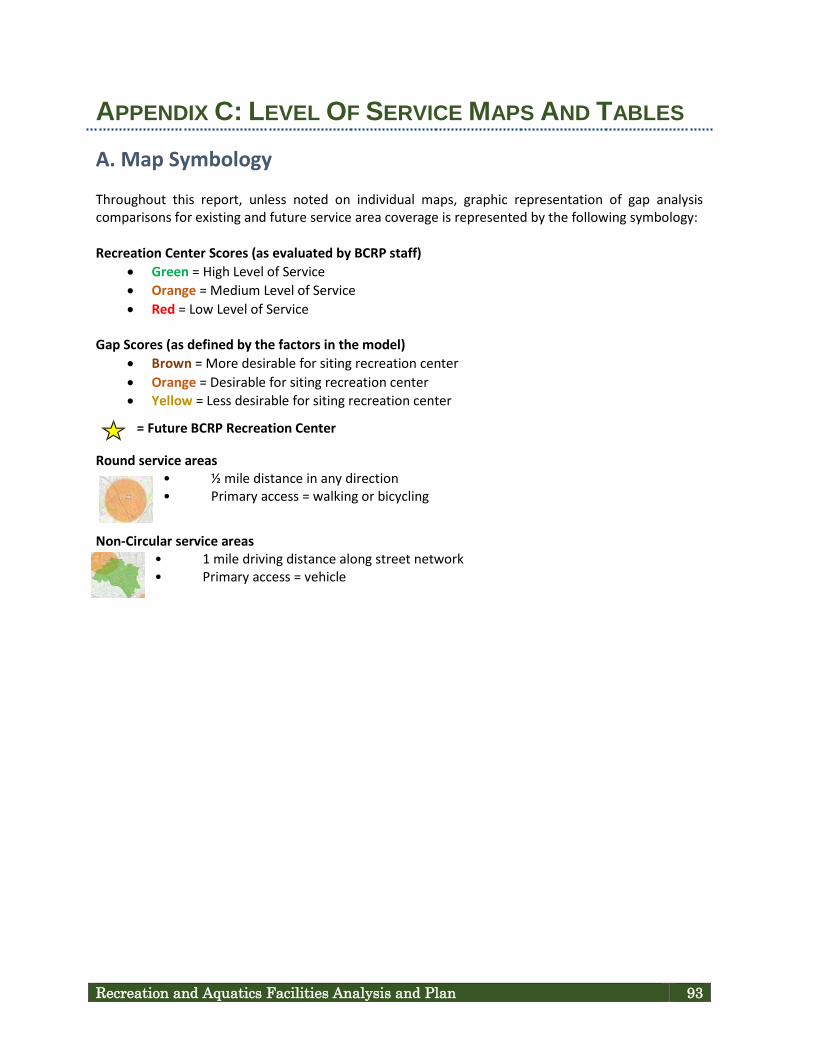
Recreation and Aquatics Facilities Analysis and Plan 93
APPENDIX C: LEVEL OF SERVICE MAPS AND TABLES A. Map Symbology Throughout this report, unless noted on individual maps, graphic representation of gap analysis comparisons for existing and future service area coverage is represented by the following symbology: Recreation Center Scores (as evaluated by BCRP staff)
• Green = High Level of Service • Orange = Medium Level of Service • Red = Low Level of Service
Gap Scores (as defined by the factors in the model)
• Brown = More desirable for siting recreation center • Orange = Desirable for siting recreation center • Yellow = Less desirable for siting recreation center
= Future BCRP Recreation Center
Round service areas • ½ mile distance in any direction • Primary access = walking or bicycling
Non‐Circular service areas • 1 mile driving distance along street network • Primary access = vehicle
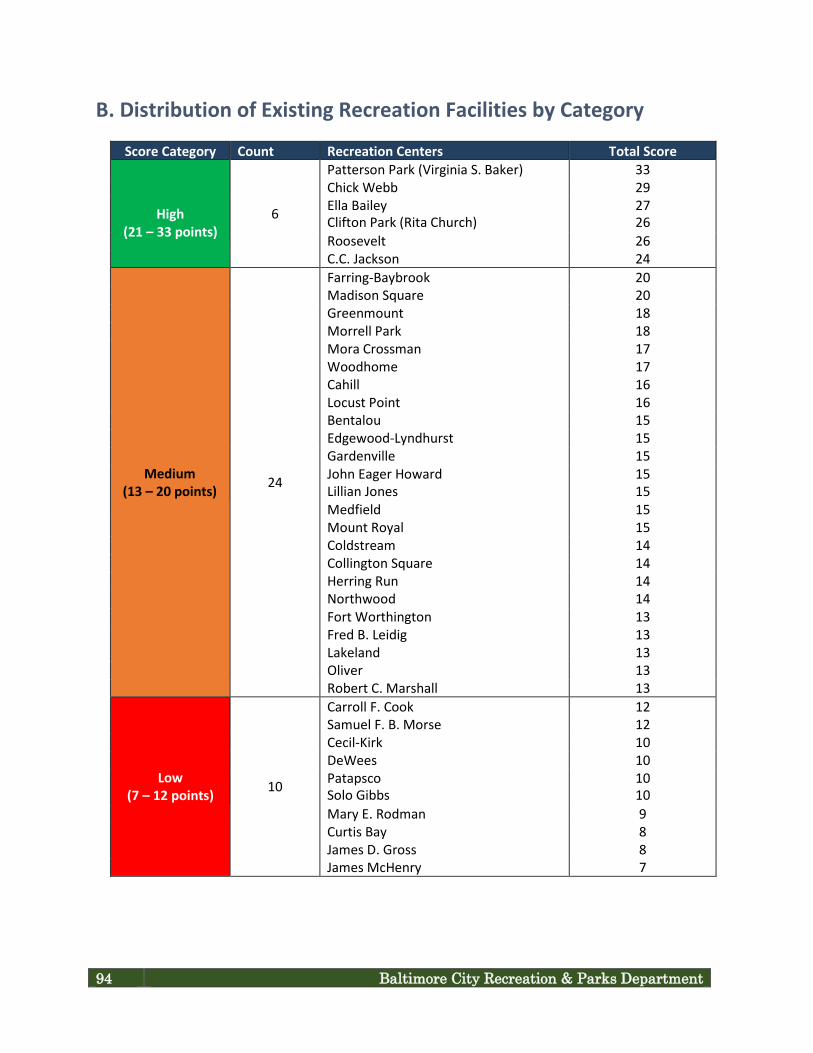
B. Distribution of Existing Recreation Facilities by Category
Score Category Count Recreation Centers Total Score
High (21 – 33 points)
6
Patterson Park (Virginia S. Baker) 33 Chick Webb 29 Ella Bailey Clifton Park (Rita Church)
27 26
Roosevelt 26 C.C. Jackson 24
Medium (13 – 20 points)
24
Farring‐Baybrook 20 Madison Square 20 Greenmount 18 Morrell Park 18 Mora Crossman 17 Woodhome 17 Cahill 16 Locust Point 16 Bentalou 15 Edgewood‐Lyndhurst 15 Gardenville 15 John Eager Howard Lillian Jones
15 15
Medfield 15 Mount Royal 15 Coldstream 14 Collington Square 14 Herring Run 14 Northwood 14 Fort Worthington 13 Fred B. Leidig 13 Lakeland 13 Oliver 13 Robert C. Marshall 13
Low (7 – 12 points)
10
Carroll F. Cook 12 Samuel F. B. Morse 12 Cecil‐Kirk 10 DeWees 10 Patapsco Solo Gibbs
10 10
Mary E. Rodman 9 Curtis Bay 8 James D. Gross 8 James McHenry 7
94 Baltimore City Recreation & Parks Department
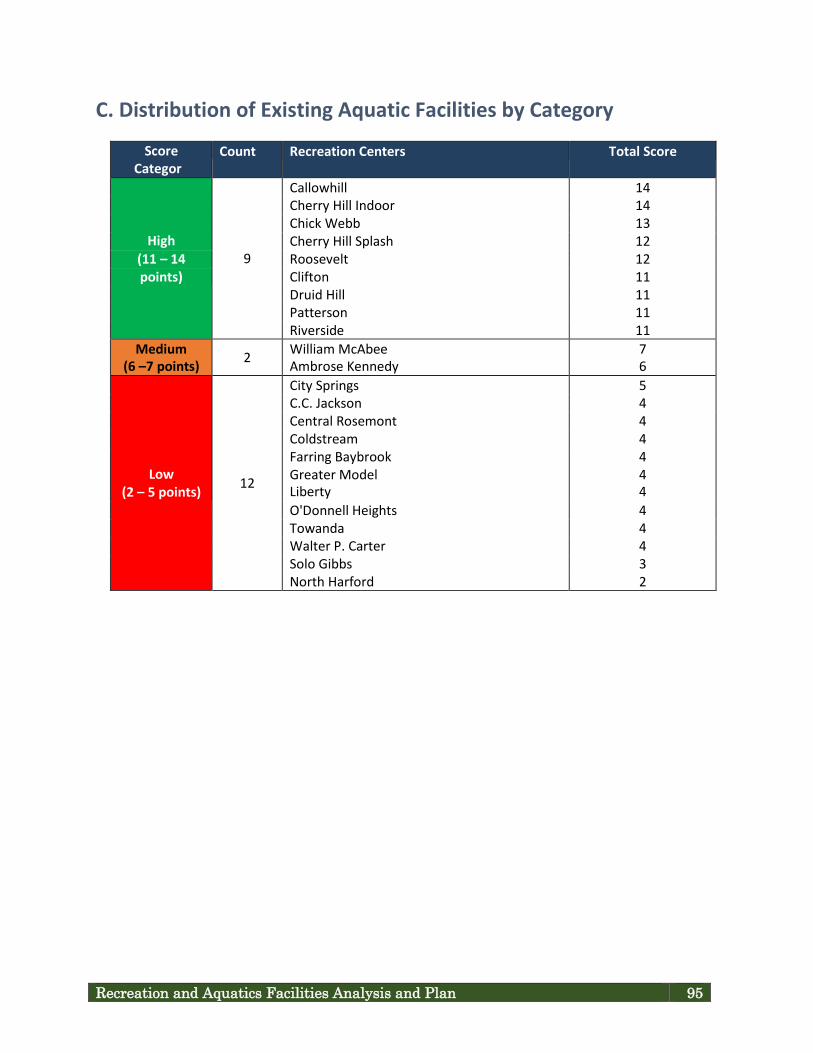
C. Distribution of Existing Aquatic Facilities by Category
Score Categor
Count Recreation Centers Total Score
High
9
Callowhill 14 Cherry Hill Indoor 14 Chick Webb 13 Cherry Hill Splash 12
(11 – 14 Roosevelt 12 points) Clifton 11
Druid Hill 11 Patterson 11 Riverside 11
Medium (6 –7 points)
2 William McAbee Ambrose Kennedy
7 6
Low (2 – 5 points)
12
City Springs 5 C.C. Jackson 4 Central Rosemont 4 Coldstream 4 Farring Baybrook 4 Greater Model Liberty
4 4
O'Donnell Heights 4 Towanda 4 Walter P. Carter 4 Solo Gibbs 3 North Harford 2
Recreation and Aquatics Facilities Analysis and Plan 95
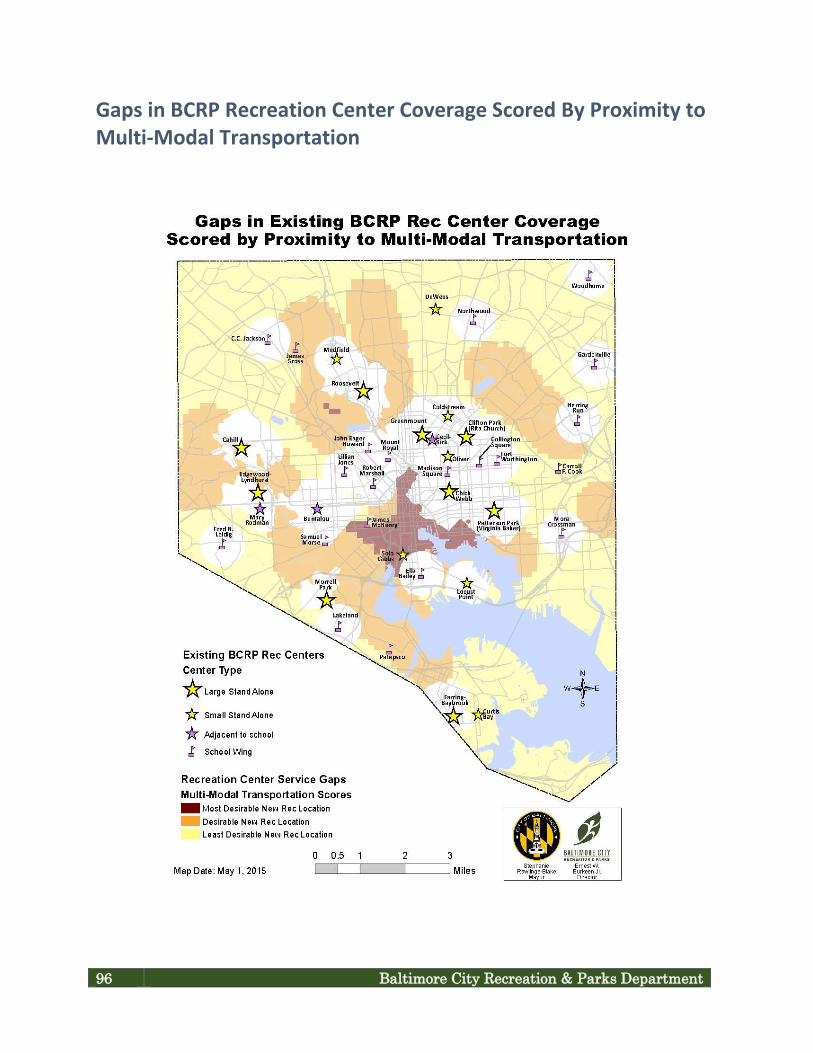
Gaps in BCRP Recreation Center Coverage Scored By Proximity to Multi‐Modal Transportation
96 Baltimore City Recreation & Parks Department

Gaps in BCRP Recreation Center Coverage Scored with Non‐BCRP Providers
Recreation and Aquatics Facilities Analysis and Plan 97
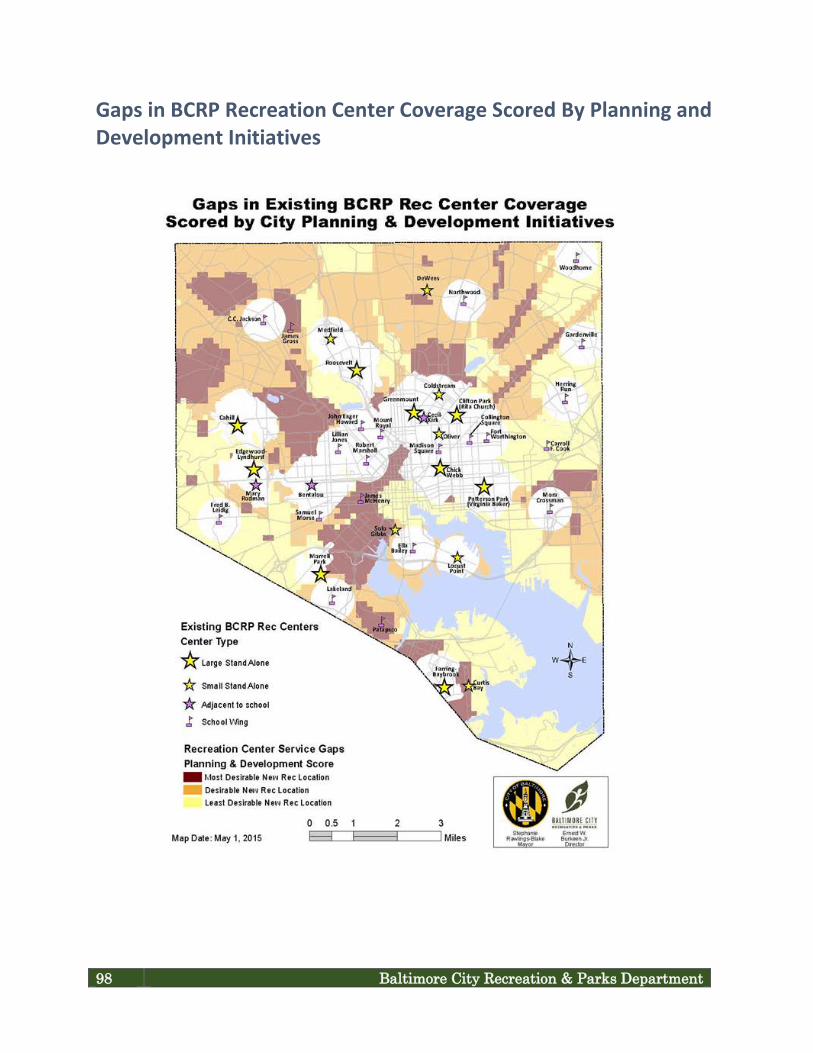
Gaps in BCRP Recreation Center Coverage Scored By Planning and Development Initiatives
98 Baltimore City Recreation & Parks Department
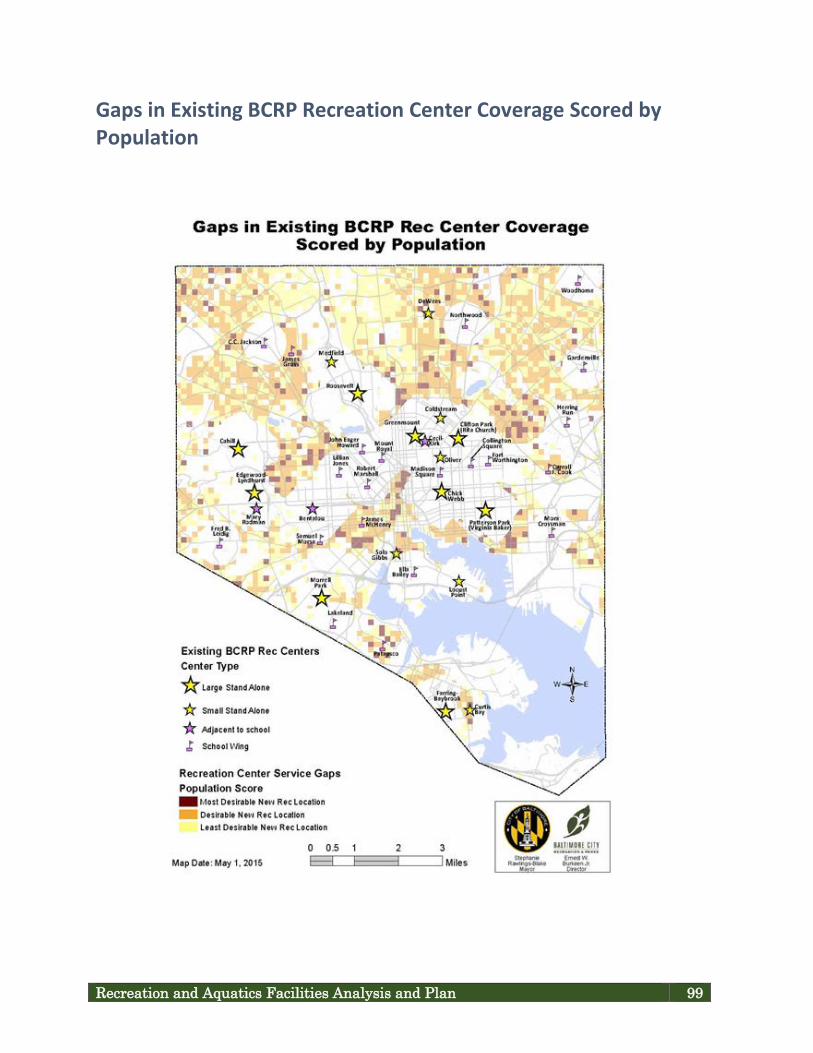
Gaps in Existing BCRP Recreation Center Coverage Scored by Population
Recreation and Aquatics Facilities Analysis and Plan 99

100 Baltimore City Recreation & Parks Department

APPENDIX D: MAYOR’S 2011 RECREATION CENTERS TASK FORCE REPORT (EXCERPT) A. Short‐Term and Long‐Term Goals and Strategies In addition to developing the model center criteria and the report card evaluation, the Task Force felt it was important to create a short‐term and long‐term goal with associated strategies for each to help guide the Department in its implementation the Task Force’s vision both now and in the future. Short‐Term Goal Over the next two years, stabilize recreation facilities, and move them toward safer, more encompassing community centers with expanded services available through partnerships based on financial reality. Recommended Short‐Term Strategies:
a) Each recreation center must provide programming for all ages with a focus on youth programs and activities;
b) Centers will provide customized programming and services that respond to community needs; c) Centers will be compliant with the approved Baltimore City building code, standards and other
applicable laws; d) Alternative programming will be offered for an appropriate amount of time wherever a center
must be removed from inventory; e) Underutilized facilities and those that have completed their useful life cycle will be turned over
to outside groups or City agencies; f) Centers must provide at minimum two staff members at all times. Recreation centers should
attain the staff‐to‐participant ratio recommended by Safe and Sound; g) Assess recreational opportunities within the Department and Citywide (other organizations); h) Prior to deciding the future of an individual center, several factors must be evaluated, including
(but not limited to): the report card score, area programs and resources, potential partners, and community participation;
i) Centers must be open during out‐of‐school times, school breaks, before school and after school, and Saturdays;
j) The Department should acquire non‐general funding sources for centers in addition to traditional tax support;
k) Fees should reflect the community that the center serves to the best extent possible; l) The Department will apply for available grants to support recreation programs and facilities and
will create grant goals in terms of the amount of funding received. Task Force Long‐Term Goal
Recreation and Aquatics Facilities Analysis and Plan 101

The Department will have a network of community centers supported by a comprehensive plan that includes a capital plan, an operations plan, and a financial plan. Recommended Long‐Term Strategies:
a) For every 50,000 residents there will be one high‐quality model community center; b) The centers will be supported by a capital program that will bring all facilities to a new building
standard; c) Community center facilities will receive annual building report card reviews. No community
center with a building report card score as determined by the Department in conjunction with a service area gap analysis should remain operational—it should either be improved or repurposed;
d) Each community center must provide programming for all ages with an emphasis on youth e) programs and activities; f) The Department should acquire non‐general funding sources for recreation and community
centers in addition to traditional tax support; g) Prior to deciding the future of an individual center, several factors must be evaluated, including
but not limited to: the report card score, area programs and resources, potential partners, and community participation;
h) In neighborhoods not directly served by a community center, the Department must ensure that similar programs exist in either schools or non‐profit t organizations to meet the recreational needs of the community;
i) Community centers must be open during out‐of‐school time and Saturdays j) The Department should identify non‐general funding sources for community centers, partners
or other dedicated funding sources; k) Create opportunities for other community stakeholders to assume the operation of identified
recreation centers; l) Each community center should have an advisory council.
102 Baltimore City Recreation & Parks Department