BCL6 antagonizes NOTCH2 to maintain survival of human...
37
Valls et al. Targeting BCL6 in FL 1 Supplemental Information for: BCL6 antagonizes NOTCH2 to maintain survival of human follicular lymphoma cells Ester Valls 1# , Camille Lobry 2,7# , Huimin Geng 1,3,8 , Ling Wang 1 , Mariano Cardenas 1 , Martín Rivas 1 , Leandro Cerchietti 1 , Philmo Oh 2 , Shao Ning Yang 1 , Erin Oswald 1 , Camille W. Graham 4 , Yanwen Jiang 1 , Katerina Hatzi 1,9 , Xabier Agirre 1,10 , Eric Perkey 5,11 , Zhuoning Li 1 , Wayne Tam 6 , Kamala Bhatt 2 , John P. Leonard 1 , Patrick A. Zweidler-McKay 4 , Ivan Maillard 5 , Olivier Elemento 3 , Weimin Ci 1,12* , Iannis Aifantis 2* and Ari Melnick 1* 1 Division of Hematology/Oncology, Department of Medicine; Weill Cornell Medical College, New York, NY, 10065, USA 2 Department of Pathology and Perlmutter Cancer Center, New York University School of Medicine, New York, New York 10016, USA 3 Institute for Computational Biomedicine, Weill Cornell Medical College, New York, NY, 10065, USA 4 Division of Pediatrics, University of Texas M. D. Anderson Cancer Center, Houston, TX 77030, USA 5 Life Sciences Institute, Division of Hematology-Oncology, Department of Internal Medicine; University of Michigan, Ann Arbor, MI, USA 6 Department of Pathology and Laboratory Medicine, Weill Cornell Medical College, New York, NY, 10065, USA 7 Institut Gustave Roussy, INSERM U1170, Villejuif and Université Paris Sud, Orsay, France 8 Department of laboratory Medicine, University of California San Francisco, San Francisco, CA, 94143, USA 9 Department of Cancer Biology and Genetics, Memorial Sloan Kettering Cancer Center, New York, New York 10065, USA 10 Division of Hematology/Oncology, Centre for Applied Medical Research (CIMA), University of Navarra, Pamplona, Spain 11 Graduate Program in Cellular and Molecular Biology 12 Key Laboratory of Genomic and Precision Medicine, Beijing Institute of Genomics, Chinese Academy of Sciences, Beijing, 100101, China
Transcript of BCL6 antagonizes NOTCH2 to maintain survival of human...

Valls et al. Targeting BCL6 in FL
1
Supplemental Information for:
BCL6 antagonizes NOTCH2 to maintain survival of human follicular lymphoma cells
Ester Valls1#, Camille Lobry2,7#, Huimin Geng1,3,8, Ling Wang1, Mariano Cardenas1, Martín Rivas1,
Leandro Cerchietti1, Philmo Oh2, Shao Ning Yang1, Erin Oswald1, Camille W. Graham4, Yanwen
Jiang1, Katerina Hatzi1,9, Xabier Agirre1,10, Eric Perkey5,11, Zhuoning Li1, Wayne Tam6, Kamala Bhatt2,
John P. Leonard1, Patrick A. Zweidler-McKay4, Ivan Maillard5, Olivier Elemento3, Weimin Ci1,12*, Iannis
Aifantis2* and Ari Melnick1*
1Division of Hematology/Oncology, Department of Medicine; Weill Cornell Medical College, New York,
NY, 10065, USA 2Department of Pathology and Perlmutter Cancer Center, New York University School of Medicine,
New York, New York 10016, USA 3Institute for Computational Biomedicine, Weill Cornell Medical College, New York, NY, 10065, USA 4Division of Pediatrics, University of Texas M. D. Anderson Cancer Center, Houston, TX 77030, USA
5Life Sciences Institute, Division of Hematology-Oncology, Department of Internal Medicine; University
of Michigan, Ann Arbor, MI, USA
6Department of Pathology and Laboratory Medicine, Weill Cornell Medical College, New York, NY,
10065, USA 7Institut Gustave Roussy, INSERM U1170, Villejuif and Université Paris Sud, Orsay, France 8Department of laboratory Medicine, University of California San Francisco, San Francisco, CA,
94143, USA 9Department of Cancer Biology and Genetics, Memorial Sloan Kettering Cancer Center, New York,
New York 10065, USA 10Division of Hematology/Oncology, Centre for Applied Medical Research (CIMA), University of
Navarra, Pamplona, Spain 11Graduate Program in Cellular and Molecular Biology 12Key Laboratory of Genomic and Precision Medicine, Beijing Institute of Genomics, Chinese Academy
of Sciences, Beijing, 100101, China

Valls et al. Targeting BCL6 in FL
2
Inventory of Supplemental Information Supplementary Figure S1. Related to Figure 1 Supplementary Figure S2. Related to Figure 2 Supplementary Figure S3. Related to Figure 3 Supplementary Figure S4. Related to Figure 3 Supplementary Figure S5. Related to Figure 4 Supplementary Figure S6. Related to Figure 5 Supplementary Figure S7. Related to Figure 5 Supplementary Figure S8. Related to Figure 6 Supplementary Table S1. Related to Figure 1 and Supplementary Figure S1 Supplementary Table S2. Related to Figure 1 Supplementary Table S3. Related to Figure 1 Supplementary Table S4. Related to Figure 1 Supplementary Table S5. Related to Figures 1, 2, 3, 4, 6, Supplementary Figures S1, S3, S4, S6 and S7. Supplementary Table S6. Related to Supplementary Figure S1 Supplementary Table S7. Related to Supplementary Figure S1 Supplementary Table S8. Related to Supplementary Figure S1. Supplementary Table S9. Related to Figure 1 and Supplementary Figure S1 Supplementary Table S10. Related to Figure 2
Valls et al. Targeting BCL6 in FL
3
Supplementary Figure S1
A
C
D
GENE FUNCTIONS
tyrosine-specific protein kinasecell cycleapoptosiscellular structure morphogenesislymphoid organ developmenttranscriptionothers functions
Tyrosine-specific protein kinase
Cell cycle
Apoptosis
Cellular structure morphogenesis Lymphoid organ development
Transcription
Other functions
B
0.5 1.0 1.5 0.0
RBP-Jk
MAML2
NOTCH2
NEG
2.0 % enrichment vs. input
BCL6 IgG
GCB
F
relative expression
low high +3
+2
+1
0
-1
-2
-3
BCL6 expression
BC
L6 ta
rget
s in
GC
B-D
LBC
L ex
pres
sion
arr
ays
BCL6
GCB DLBCL (n=71)
p<0.05 in GCB- DLBCL
BCL6 expression BCL6_Ave BCL6_1 BCL6_2 BCL6_3 NOTCH2_1 NOTCH2_2 NOTCH2_3 RBPJ_1 RBPJ_2 CDKN1A_1 MAML2_1 NOTCH1_1 MAML2_2 CCND1_1 NRARP_1 HEY1_1 NOTCH1_2
G
E BCL6_targets_CHIPCHIP Proliferation_DLBCL Cell_cycle_Whitfield Proliferation Myc_ChIP_PET_Expr_Up Glutamine_Glucose_starve_both_down Serum_response_Fb_down Glutamine_starve_down Tcell_cytokine_induced_proliferation Pan_B_U133plus Resting_monocyte_GNF Myc_RNAi_OCILy3 IL6_Ly10_Up_group1 Germinal_center_Bcell_DLBCL Myc_overexpression_1.5x_up
BCL6 targets in DLBCL
BC
L6 b
indi
ng e
nric
hmen
t in
FL
NOTCH2
3
1.30 0
2
0
3.5
0
2
0
1.17
1.20
1.36
1kb
BCL6
2kb
TP53
2kb 2kb 1kb
HPRT1 COX6B
tyrosine-specific protein kinase
YES1, HCK
cell cycle CDK8, EIF4G2, FH, HERC5, NOTCH2 apoptosis ID3, IFIH1, NOTCH2, SOCS2 cellular structure morphogenesis
ARF6, ARHGAP15, BLZF1, DDX5, ERBB2IP, NOTCH2, SOCS2, UBB
lymphoid organ development
AOF2, BAZ2A, CBX3, CCL3, CCR6, ECGF1, ID2, NOTCH2, RPS19, SETMAR, SMARCE1, TSPYL1
transcription AOF2, ARID3B, BAZ2A, BLZF1, CBX3, CDK8, CTNND1, HIPK1, ID2, ID3, MEIS2, MLLT3, NOTCH2, NR4A2, NR4A3, RPS14, SMARCE1, SUPT3H, THAP7, TRIM33, TXNIP, UBB, ZBTB3, ZNF133, ZNF140, ZNF184, ZNF304, ZNF331, ZNF335, ZNF432, ZNF473, ZNF524, ZNF573, ZNF74, ZNF79
Valls et al. Targeting BCL6 in FL
4
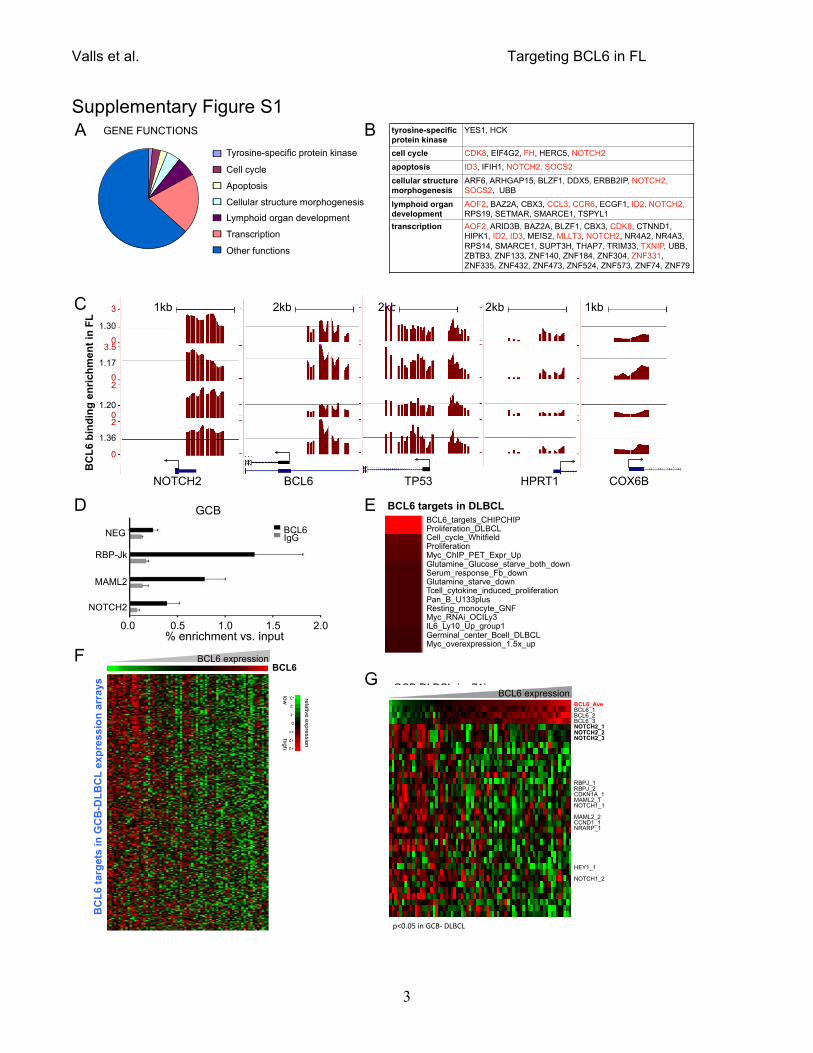
Supplementary Figure S1: BCL6 displays a specific genomic localization pattern in FL. (A) A pie
chart representation of the involved gene functions of the 184 target genes. Gene function analysis was
performed by David Gene Functional Annotation Tool [1, 2]. (B) NOTCH2 is highlighted on the
classification of BCL6 bound-genes on involved gene functions from previous panel A. (C) BCL6
binding enrichment in FL. From left to right: NOTCH2, BCL6, TP53 (the last 2 as positive control
targets), and, HPRT1 and COX6B as negative control targets. (D) QChIP was performed in primary
GCB cells to validate BCL6 binding to direct target genes repressed in FL specimens. BCL6 enrichment
is represented as % of input. Black bars represent BCL6 and gray bars IgG control. The graph shows
the mean of three independent experiments and error bars are the standard error of the mean (SEM,
for primers see Supplementary Table S5). (E) The relative enrichment of specific gene signatures on
DLBCL BCL6 target gene sets summarized in a heat map. The statistical significance (BH adjusted p
values) is provided in color key. (F) A heatmap representation of the relative transcript abundance of
BCL6 target genes in GCB-DLBCLs that display inverse correlation (p<0.05, Spearman correlation)
with BCL6 expression, from a publicly available dataset of 71 primary DLBCL expression profiles. The
color key indicates the relative expression values. (G) Primary GCB-DLBCL gene expression profiles
were sorted by BCL6 expression from low to high (top row of heatmap), and the relative expression
values of a set of Notch complex and target genes displayed in subsequent rows, indicating their
degree of inverse correlation (p values are all p<0.05, Spearman correlation, n=71) with BCL6. Details
are provided in Supplementary Tables S5, S7 and S8. (See Figure 1).

Valls et al. Targeting BCL6 in FL
5
Supplementary Figure S2
Supplementary Figure S2: Inverse correlation between BCL6 and NOTCH2 complex genes in primary GC B-cells. (A) Naïve B-cells (red) and GC B-cells (green) were purified as detailed in
methods section. Purity was >95% and >94% purity for naïve and GC B-cells respectively based IgD
and CD38 B-cell markers. The histogram in the left panel shows the relative cell number of IgD staining
for Naïve B-cells; the right panel shows the same for CD38 positive GC B-cells. (B) Immunoblots were
conducted using BCL6 and ICN2 antibodies in lysates from purified human Naïve B-cells and GC B-
cells. Actin immunoblot is included as loading control. (D) Murine splenocytes (blue) were isolated as
detailed in methods section. Purity was >95% in all experiments as verified with staining for
CD45R/B220+ B-cell marker. Three independent experiments and representative cell purification is
shown. (See Figure 2).
B
0 102 103 104 105
BCL6
ICN2
Actin Naive GC B-cells
100
100 75 50
37
MW (KDa)
C
0 102 103 104 105
APC-A
0
20
40
60
80
100
% o
f Max
99.60.390.39 99.6
Murine splenocytes 100
80
60
40
20
0
0 102 103 104 105
CD45R / B220
Rel
ativ
e ce
ll nu
mbe
r
Naïve B-cells
0 102 103 104 105
PE-A
0
20
40
60
80
100
% o
f Max
95.24.35 95.7 4.35
100
80
60
40
20
0
IgD
Rel
ativ
e ce
ll nu
mbe
r
GC B-cells
0 102 103 104 105
FITC-A
0
20
40
60
80
100
% o
f Max
94.55.71 94.5
100
80
60
40
20
0
CD38
Rel
ativ
e ce
ll nu
mbe
r
0 102 103 104 105
A
Valls et al. Targeting BCL6 in FL
6
Supplementary Figure S3
B A Experiment Day
0
1
7
14
-1 Serum
NP65-CGG/SRBC
Tamoxifen
Serum
Serum Spleen
Tissue Genotype
FACS IHC
WT
WT ICN2
ICN2
WT ICN2
WT ICN2
WT ICN2
D
PNA
WT
40 μm 20 μm
ICN
2
Num
ber o
f GC
/ Spl
een
WT n=5
ICN2 n=8
10
15
20
0
5
PNA p= 0.0001
WT n=5
0
10
5
ICN2 n=8
BCL6/ B220 p= 0.0001
15
20
C
Num
ber o
f GC
/ Spl
een
E
ICN
2
BCL6/ B220
WT
40 μm 20 μm
F
GC
are
a (μ
m2 )
BCL6/ B220 PNA p < 0.0001
100
400
0
200
WT ICN2
300
750 1000
100
500
WT ICN2
500
0
300
400
750 1000
200
p = 0.0002
H
0
200
300
100
PNA BCL6/ B220
Aver
age
GC
are
a (μ
m2 )
P < 0.0001 P = 0.0002 G
GC
are
a (μ
m2 )
ICN2
WT
Valls et al. Targeting BCL6 in FL
7
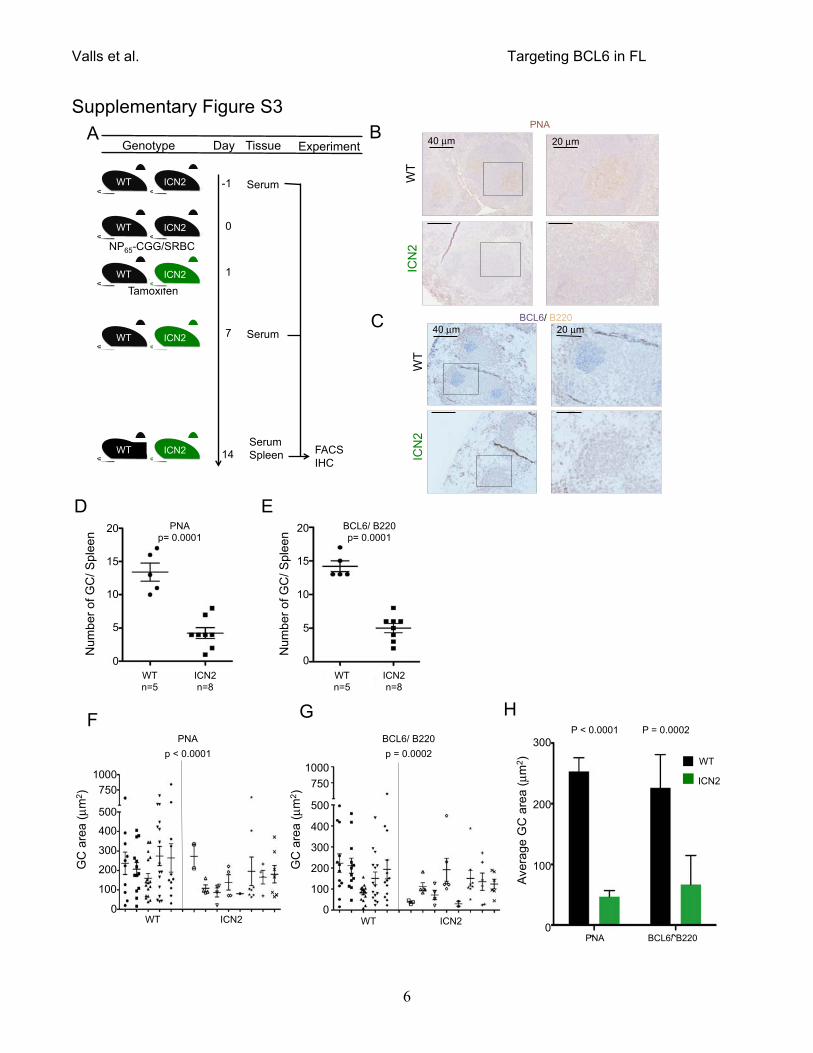
Supplementary Figure S3: GC reaction is impaired in Notch2 knock-in mice. (A) Schematic
representation of GC induction experiments in ICN2 inducible mice. The first row reflects the alleles
present in the experiment that include ROSA26 WT (in black) and ROSA26-ICN2-IRES-YFP or
ROSA26-ICN2-YFP/CγCre (in green); the second row is the day; the third is the tissue or serum
harvest and the fourth column is the assay conducted. GC immunization used was NP65-CGG for
mouse strain engineered to contain an ICN2-IRES-YFP (ICN2) cassette with a loxP flanked NEO-ATG
knocked in to the ROSA26 locus, crossed with a tamoxifen inducible ROSA26-Cre-ERT2 strain or in
ROSA26-WT (WT) – Cre-ER T2, or Sheep Red Blood Cells (SRBC) for CγCre-WT or -ICN2 mice. (B)
Representative images of spleen sections from CγCre-WT (control) and -ICN2 knock-in mice stained for
GC markers PNA 14 days after immunization with SRBC. The black squares on left column (4X)
highlight GCs, which are shown at 20X amplification in the right column. Scale bars are 100 μm (4X)
and 20 μm (20X). (C) Same experiment performed in panel B for BCL6+/B220+ staining. (D) The
number of GCs per spleen (Y-axis) from immunohistochemistry shown in panel B. PNA+ clusters are
shown. The range bars represent the mean values and SEM and the p values are shown on top. (E)
Same experiment performed in panel D for BCL6+/B220+ staining. (F) The surface area occupied by
GCs in the spleens of immunized and induced ICN2 and control mice is shown for PNA staining, and is
represented by their area in μm2 (Y-axis). The average of the means for each group is shown. Each
column corresponds to an individual mouse; each point is an individual GC; p values are shown on top.
SEM and p values are shown. (G) Same experiment performed in panel F for BCL6+/B220+ staining.
(H) Average of GC area (μm2) of WT (black) and ICN2 (green) mice from IHC of paraffin-embedded
spleen slides stained with PNA+ and BCL6+/B220+ antibodies. The mean values are 301.7 +/-35.49 vs.
68.14 +/-17.39 μm2 for PNA+ GC, and 226.1 +/-24.55 vs. 66.76 +/-16.97 μm2. Data shown for
immunized CγCre-WT (n=5) and CγCre-ICN2 (n=8) mice. The statistical significance of this difference is
shown based on unpaired two-tailed t test (P< 0.0001 and P= 0.0002 respectively). (See Figure 3, for
primers see Supplementary Table S5).

Valls et al. Targeting BCL6 in FL
8
Supplementary Figure S4
B
WT n=5
ICN2 n=8
0
3
4
1
2
5 p < 0.0001
% G
C (G
L7+ /
CD
95+ )
E 105
104
103
102
101
105
104
103
102
101
105
104
103
102
101
105
104
103
102
101
WT
CD21
CD
23
0 102 103 104 105 0 102 103 104 105 0 102 103 104 105
105
104
103
102
101
105
104
103
102
101
105
104
103
102
101 0 102 103 104 105
105
104
103
102
101
0 102 103 104 105 0 102 103 104 105 0 102 103 104 105 0 102 103 104 105
ICN
2 C
prolife
ra,on'
apoptosis'
APOPTOSIS D
WT ICN2
WT ICN2
WT ICN2
WT ICN2
WT ICN2
0
30
40
10
20
50
0
30
40
10
20
50
# C
aspa
se C
lust
er C
ells
# TU
NEL
Clu
ster
Cel
ls
0
10
15
5
20
# KI
-67
Clu
ster
Cel
ls
PROLIFERATION
0
10
15
5
20
# PC
NA
Clu
ster
Cel
ls
F 105
104
103
102
101
0 102 103 104 105 0 102 103 104 105
CD
8
0 102 103 104 105
105
104
103
102
101
105
104
103
102
101
0 102 103 104 105
105
104
103
102
101
0 102 103 104 105
Gr-1
CD
11b
0 102 103 104 105
105
104
103
102
101
105
104
103
102
101
0 102 103 104 105
Lymphoid
lineage M
yeloid lineage
CD4
WT ICN2 ICN2*
* Gated on YFP
A ICN2
0.24
WT
1.69
CD95
105
104
103
102
105
105
104
103
102
104 103 101 102 105 104 103 101 102
3.17%
0.49%
WT ICN2 105
104
103
102
101 102 103 104 105
GL
7
101 102 103 104 105
105
104
103
102
p < 0.0001 p < 0.0013 p < 0.0001 p < 0.0004
GC 0.49%
GC 3.17%
FoB 66%
MZB 10.1%
FoB 70.7%
MZB 7.79%
FoB 73.3%
MZB 10.9%
FoB 70.4%
MZB 10.5%
FoB 63.8%
MZB 17.5%
FoB 67%
MZB 11.6%
FoB 66.1%
MZB 16.1%
FoB 64.2%
MZB 17%

Valls et al. Targeting BCL6 in FL
9
Supplementary Figure S4: GC reaction is impaired in Notch2 knock-in mice. (A) Flow-cytometry
analysis of B220+GL7+CD95+ labeled splenic GC B-cell populations. Cells were gated for B220+, GL7 is
on the Y-axis and CD95(Fas) is on the X-axis. The percentage of double positive cells corresponds to
GC B-cells (black box). (B) The percentage of B220+ gated GL7+/CD95+ GC B-cells among total
splenocytes is shown from the spleens of immunized WT (n=5) and ICN2 induced (n=8) mice. In the
presence of ICN2, the abundance of B220+GL7+CD95+ GC B-cells was reduced three-fold as compared
to WT animals (1.7% vs. 0.6% mean GC B-cells vs. total splenocytes, p=0.0003 unpaired two-tailed t
test. (C) Number of proliferative clusters on GC of WT (black) and ICN2 (green) mice from IHC of
paraffin-embedded spleen slides stained with PNA+ and KI-67+ antibodies. The mean values are 14.17
+/-0.54 vs. 7 +/-0.8 for PCNA+cells and 14.17.1 +/-0.47 vs. 6.5 +/-1.53 for KI-67+ cells. The statistical
significance of this difference is shown based on unpaired two-tailed t test (P=0.0001 and P=0.0013
respectively). Data shown for immunized WT (n=6) and ICN2 (n=8) mice. (D) Number of apoptotic
clusters on GC of WT (black) and ICN2 (green) mice from IHC of paraffin-embedded spleen slides
stained with TUNEL+, CASPASE3+. The mean values are 36 +/-2.67 vs. 11.43 +/- 3.23 for TUNEL+
cells and 29.17 +/- 3.48 vs 8.28 +/- 2.44 for Caspase 3+ cells; The statistical significance of this
difference is shown based on unpaired two-tailed t test (P= 0.0001 and P= 0.0004 respectively). Data
shown for immunized WT (n=6) and ICN2 (n=8) mice. (E) Flow-cytometry analysis of MZB and FoB cell
populations and in CγCre-WT (top), CγCre-INC2 +/- (bottom) mice splenocytes. Dot plots are shown for
B220+ gated cells, CD23 (Y axis) versus CD21 (X axis). (F) Flow-cytometry analysis of T lymphoid and
myeloid lineages in UBCCre (left), UBCCre INC2 +/- (middle) and UBCCre ICN2+/- gated on YFP
(right) mice splenocytes. Dot plots are shown for B220+ gated cells, CD8 (Y axis) versus CD4 (X axis)
for T lymphoid lineage (upper panels), and CD11b (Y axis) versus Gr-1 (X axis) for myeloid lineage
(bottom panels) (see Figure 3 and Supplementary Table S5).

Valls et al. Targeting BCL6 in FL
10
Supplementary Figure S5
Supplementary Figure S5: BCL6 represses NOTCH2 complex genes and Notch activity. (A)
Western Blot for BCL6 after BCL6 siRNA in the 4 cell lines mentioned above. Representation of 3
independent experiments. (B) Luminiscence assay for BPI using BCL6-BTB reporter in OCI-Ly1, SU-
DHL-4, Sc-1 and DoHH2 cell lines. Star means p-value < 0.0001. (C) The relative transcript abundance
of NOTCH2, MAML1, MAML2 and RBPJ-k was examined by QPCR in GCB-DLBCL cell lines OCI-Ly1
(black bars) and SU-DHL-4 (gray bars) 72 h after BCL6 siRNA depletion vs. control siRNA. Values
were normalized to HPRT and fold change (Y-axis) is represented over a scrambled siRNA control.
(see Figure 4 and Supplementary Table S5).
A si
C
siBC
L6
siC
siBC
L6
siC
siBC
L6
siC
siBC
L6
OCI-Ly1 SU-DHL-4 Sc-1 DoHH2
BCL6
Ac
tin
Reporter assay BCL6-BTB with RI-BPI in lymphoma cell lines
0
20
40
60
80
100
120
PBS RI-BPI 10µM
PBS RI-BPI 10µM
PBS RI-BPI 10µM
PBS RI-BPI 10µM
OCI-Ly1 SUDHL4 DOHH2 SC-1
%b
Rep
ress
ion
to P
BS
P < 0.0001
*
*
*
*
Reporter'assay'BCL6/BTB'with'RI/BPI'in'lymphoma'cells'
% R
epre
ssio
n to
PBS
B Fo
ld c
hang
e to
siC
(N
orm
aliz
ed to
HPR
T)
MAML1 MAML2 RBPJ-k 0
1
2
3
4
5
20 6
30 40
siC
siBCL6-OCI-Ly1 siBCL6-SU-DHL-4
NOTCH2
C

Valls et al. Targeting BCL6 in FL
11
Supplementary Figure S6
Fold
cha
nge
to s
iC (
Nor
mal
ized
to H
PRT)
B
-2
1
-4
-3
2
-2
1
-4
-3
2
1.5
siC -1.5
-2.5
-2
-1
-1.5
-1
-2.5
-2
siC
siC
siC -1.5
-1
-2.5
-2
-3
-1.5
-1
-2.5
-2
-3
-1
2
-3
-2
3
-1.5
1.5
-2.5
-2
1
OC
I-Ly1 BCL6
-1.5
-1
-2.5 -2
-3
-1.5
-1
-2.5 -2
-3
-1.5 1
-3
-2 2.5
1.5
-1.5 1
-3 -2.5
2
1.5
-2
siC D
oHH
2 NOTCH2
siC
siC
-1.5
-1
-2.5
-2
-1.5
-1
-2.5
-2
siC -1.5
1
-2
2 1.5
-1.5
1
2
1.5
-2
Sc-1
0
25
50
75
100
125
48H 72H
0
25
50
75
100
125
siC
48 h 72 h
0
25
50
75
100
125
150
48h 72h
0
25
50
75
100
125
150
48h 72h 125
100
75
50
25
0
125
100
75
50
25
0
150
125
100
75
50
25
0
siC
siC
siC SU
-DH
L-4
siBCL6-2+siNOTCH2-1 siBCL6-1 siNOTCH2-2 siNOTCH2-1
siBCL6-2+siNOTCH2-2 siBCL6-2+siNOTCH2-1 siBCL6-2 siNOTCH2-2 siNOTCH2-1
siBCL6-2+siNOTCH2-2 siBCL6-2+siNOTCH2-1 siBCL6-1 siNOTCH2-2 siNOTCH2-1
siBCL6-2+siNOTCH2-2 siBCL6-2+siNOTCH2-1 siBCL6-2 siNOTCH2-2 siNOTCH2-1
siBCL6-2+siNOTCH2-2 siBCL6-2+siNOTCH2-1 siBCL6-1* siNOTCH2-2 siNOTCH2-1
siBCL6-2+siNOTCH2-2
0
25
50
75
100
125 125
100
75
50
25
0
D siC
OC
I-Ly8
siC
Fold
cha
nge
to s
iC
(N
orm
aliz
ed to
HPR
T)
% C
ell v
iabi
lity
* ns
* ns
* ns
* ns
ns *
** *
* *
* *
F
-1.5
1.5
-2.5 -2
1
-1.5
-2
1
E 1.5
-1.5
-2
1
1.5
-3
-5
1 -2
-4
C
150
125
100
75
50
25
0
% C
ell v
iabi
lity
siC
Control BPI A
Annexin V
7AAD
7AAD
0 102 103 104 105 0 102 103 104 105
105
104
103
102
0
105
104
103
102
0
0 102 103 104 105
105
104
103
102
0
0 102 103 104 105
105
104
103
102
0
0 102 103 104 105
105
104
103
102
0
DoHH2
0 102 103 104 105
105
104
103
102
0
Sc-1 SU-DHL-4 Control Control BPI BPI
0.8% 94.1%
1.54% 3.56%
9.31% 63.7%
2.68% 24.3%
1.3% 93.1%
2.02%
21.3% 34.3%
13.4% 31%
1.08% 92.2%
2% 4.76%
14.7% 60%
4.65% 20.7% 3.58%

Valls et al. Targeting BCL6 in FL
12
Supplementary Figure S6: FL cells are dependent on BCL6 in a NOTCH2-dependent manner. (A) Dot plot measuring 7AAD (Y-axis) and AnnexinV (X axis) to assess apoptosis in FL (DoHH2 and
Sc-1) and DLBCL (SU-DHL-4) cell lines treated with Control Peptide (left) or BPI (right) at 48h. (B)
DoHH2, Sc-1, SU-DHL-4 and OCI-Ly1 cells (top to bottom) were transfected with siControl (siC),
siNOTCH2, siBCL6 or both and mRNA was extracted. BCL6 and NOTCH2 expression levels were
normalized to HPRT and fold change to siC is represented in the graph. The plots are the mean of 4
experiments and the error bars are the SEM. (C) Viability was determined in DoHH2, Sc-1, SU-DHL-4
and OCI-Ly1 cell lines (top to bottom) after transduction with the indicated siRNA sequences. Cell
proliferation index is shown relative to 100% value of siControl (dotted line). Average of 3 experiments
and SEM are represented. (D) QPCR was used to determine the abundance of BCL6 (upper panel)
and NOTCH2 (lower panel) mRNAs on OCI-Ly8 cells 48 hours after siRNA transfections. The results
were normalized to HPRT and represented as fold change compared to siC. The plots are the mean of
3 experiments and the error bars are the SEM. (E) OCI-Ly8 cells were transfected with siControl (siC),
two siRNA sequences targeting NOTCH2 (siNOTCH2-1, siNOTCH2-2), and two siBCL6 (siBCL6-1,
left panel and siBCL6-2, right panel) or combinations of both siRNA. Results are shown at 72h. Cell
proliferation was measured as detailed before. (F) A competitive proliferation assay was performed in
DoHH2 and Sc-1 cells transduced with ICN2-GFP or GFP expressing retrovirus. GFP-positive
percentages (Y axis) were measured by flow-cytometry every other day (X axis). Triplicate
experiments were normalized to day 2 values. Averages +/- SD are shown. Statistical significance is
shown (p value one-tailed t test). * p<0.05; **p<0.005 (see also Figure 5 and Supplementary Table S9, for primers see Supplementary Table S5).

Valls et al. Targeting BCL6 in FL
13
Supplementary Figure S7
A live/CD19+/CD93-
anti-Notch1
CD21/35
CD
23
MZB
FoB
anti-Notch2 Control
83 ± 1
85 ± 1 4.6 ± 1
0 102 103 104 105
105
104
103
102
0
0 102 103 104 105
105
104
103
102
0
0 102 103 104 105
105
104
103
102
0
B
0.0
5.0×10⁶
1.0×10⁷
1.5×10⁷
2.0×10⁷
02040607580859095
100
% M
ZBs
cells
0.0
5.0×10⁵
1.0×10⁶
1.5×10⁶ p<0.0001
p<0.0001
% F
oB c
ells
#FoB
/ sp
leen
#M
ZB /
sple
en
0
2
4
6
8 p<0.0001
aN2 C aN1
ns
aN2 C aN1
aN2 C aN1 aN2 C aN1
CD25
c-ki
t
CD25
c-ki
t
c-kit
CD
44
0 102 103 104 105
105
104
103
102
0
0 102 103 104 105
105
104
103
102
0
0 102 103 104 105
105
104
103
102
0
0 102 103 104 105
105
104
103
102
0
0 102 103 104 105
105
104
103
102
0
0 102 103 104 105
105
104
103
102
0
live/CD8-/lin- anti-Notch1 anti-Notch2 Control 0.21 ± 0.02 0.90± 0.11 0.26± 0.03 0.99± 0.08
ETP/ DN1 DN2
0.33 ± 0.04 0.25± 0.04
33 ± 4 66± 4 28± 1 70± 1
DN4 DN3
73 ± 4 27± 4
0 102 103 104 105
105
104
103
102
0
C D
0
10000
20000
30000
0
10000
20000
30000
CD
25 M
FI o
f Lin
-/c-
Ki+
thym
ocyt
es
p<0.0001
p<0.0001
aN2 C aN1
aN2 C aN1
CD
25 M
FI o
f Lin
-/c-
Kit-
thym
ocyt
es
Valls et al. Targeting BCL6 in FL
14
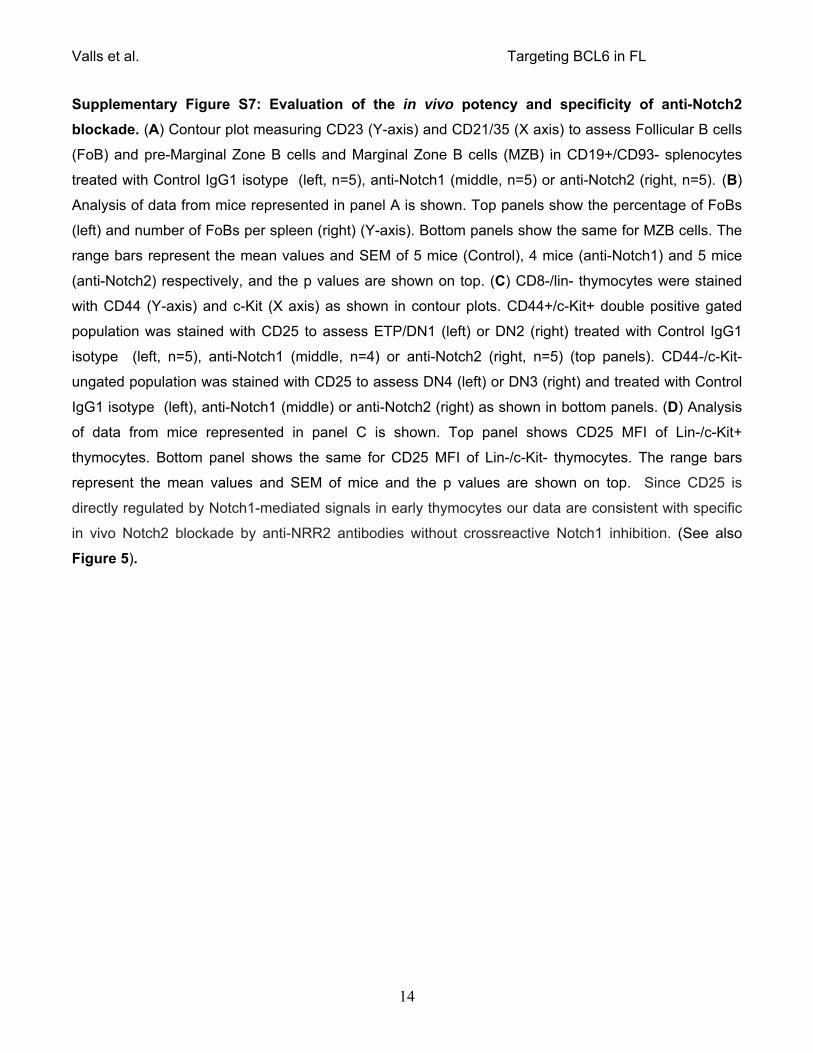
Supplementary Figure S7: Evaluation of the in vivo potency and specificity of anti-Notch2 blockade. (A) Contour plot measuring CD23 (Y-axis) and CD21/35 (X axis) to assess Follicular B cells
(FoB) and pre-Marginal Zone B cells and Marginal Zone B cells (MZB) in CD19+/CD93- splenocytes
treated with Control IgG1 isotype (left, n=5), anti-Notch1 (middle, n=5) or anti-Notch2 (right, n=5). (B)
Analysis of data from mice represented in panel A is shown. Top panels show the percentage of FoBs
(left) and number of FoBs per spleen (right) (Y-axis). Bottom panels show the same for MZB cells. The
range bars represent the mean values and SEM of 5 mice (Control), 4 mice (anti-Notch1) and 5 mice
(anti-Notch2) respectively, and the p values are shown on top. (C) CD8-/lin- thymocytes were stained
with CD44 (Y-axis) and c-Kit (X axis) as shown in contour plots. CD44+/c-Kit+ double positive gated
population was stained with CD25 to assess ETP/DN1 (left) or DN2 (right) treated with Control IgG1
isotype (left, n=5), anti-Notch1 (middle, n=4) or anti-Notch2 (right, n=5) (top panels). CD44-/c-Kit-
ungated population was stained with CD25 to assess DN4 (left) or DN3 (right) and treated with Control
IgG1 isotype (left), anti-Notch1 (middle) or anti-Notch2 (right) as shown in bottom panels. (D) Analysis
of data from mice represented in panel C is shown. Top panel shows CD25 MFI of Lin-/c-Kit+
thymocytes. Bottom panel shows the same for CD25 MFI of Lin-/c-Kit- thymocytes. The range bars
represent the mean values and SEM of mice and the p values are shown on top. Since CD25 is
directly regulated by Notch1-mediated signals in early thymocytes our data are consistent with specific
in vivo Notch2 blockade by anti-NRR2 antibodies without crossreactive Notch1 inhibition. (See also
Figure 5).

Valls et al. Targeting BCL6 in FL
15
Supplementary Figure S8
0.0 0.5 1.0 1.5 2.0 2.5
12 13
Control
Pt.
16
mR
NA
a
bu
nd
an
ce
RI-
BP
I (F
old
to
co
ntr
ol)
APOL6 ATF5 CCR6 NOTCH2 HOXA13 STAT3 HPRT
3.0 12 13
0 0.5
1
1.5 2
2.5 3
Patie
nt 1
6 m
RN
A ab
unda
nce
(F
old
chan
ge to
Con
trol )
APOL6 ATF5 CCR6 HOXA13 NOTCH2 STAT3 HPRT
Control
A
B Vehicle RI-BPI
TUN
EL
DoHH2 mice
Cas
pase
3
50 μm
Vehicle RI-BPI Sc-1 mice 50 μm
DoHH2 Sc-1 DoHH2 Sc-1
Vehicle RI-BPI
D
C

Valls et al. Targeting BCL6 in FL
16
Supplementary Figure S8: RI-BPI suppresses FL tumors in vivo and ex vivo. (A) Single cell
suspensions were generated from a BCL6 positive FL biopsy specimen (patient 16). The cells were
cultured and treated with 10 μM RI-BPI for 48h. QPCR was performed to determine the abundance of
FL BCL6 target gene transcripts APOL6, ATF5, CCR6, HOXA13, NOTCH2, as well as for the positive
control BCL6 target gene STAT3, and HPRT as housekeeping control. Results are expressed as fold
induction compared to control (vehicle). (B) Representative immunohistochemistry images of 4
independent DoHH2 tumors after treatment with control or RI-BPI assayed for apoptosis by TUNEL and
Caspase 3 stainings (top and bottom panels respectively). Red bar represents 50 μm. (C)
Representative immunohistochemistry images of 4 independent Sc-1 tumors after treatment with
control or RI-BPI assayed for apoptosis by TUNEL and Caspase 3 stainings (top and bottom panels
respectively). Red bar represents 50 μm. (D) Quantification of positive cells relative to total cells in field
of all tumors for TUNEL (left graph) and Caspase 3 (right graph). SEM and p-values were calculated for
every treatment and cell line. (see Figure 6 and Supplementary Table S5 for primers).

Valls et al. Targeting BCL6 in FL
17
Supplementary Table S1 Supplementary Table S1: BCL6 target genes on FL patient samples ChIp-onChIP. From left to right:
1) SEQ_ID: Sequence ID name on ChIp-on-ChIP microarray; 2) Annotation: annotation number form
NCBI reference sequence; 3) Gene: Gene name. See also Figure 1A and Supplementary Figure S1A.

Valls et al. Targeting BCL6 in FL
18
Supplementary Table S2 Supplementary Table S2: Gene sets that are enriched among BCL6 target genes in FL samples. The
signatures presented in the table are those that have enrichment of multi-test adjusted p value<0.01
using Benjamini and Hochberg (BH) method for targets in FL list. From left to right: 1) Signature names;
2) Signature names in the original database where they were obtained[3]; 3) –logBH (multi-test
adjusted p value): the statistical values (see also Figure 1C).

Valls et al. Targeting BCL6 in FL
19
Supplementary Table S3 Supplementary Table S3: Excel file containing the statistical analysis of the 184 FL targets with
significant inverse correlation with BCL6. From left to right: 1) BCL6 target genes in FL: gene name; 2)
Spearman p value: cut-off was set as p<0.05; 3) Rho correlation values (see Figure 1B).

Valls et al. Targeting BCL6 in FL
20
Supplementary Table S4
Supplementary Table S4: p value of NOTCH2 target genes and members of its transcriptional
complex that are inversely correlated to BCL6 in primary FL specimens. Statistical significance was
assessed by Spearman correlation test. Cut-off was set as p<0.05. rho value is shown in third column
(see Figure 1C).

Valls et al. Targeting BCL6 in FL
21
Supplementary Table S5
RT-PCR primers
AICDA-F GGAAGGGCTGCATGAAAAT AICDA-R AAAGTCCCAAAGTACGAAATGC APOL6-F ACACAGATTTGCTGCCACAG APOL6-R GCTCCACGTCTTCACACAGA ATF5-F CTATGAGGTCCTTGGGGGAG ATF5-R TCGCTCAGTCATCCAGTCAG BCL6-F GACTCTGAAGAGCCACCTG BCL6-R CTGGCTTTTGTGACGGAAAT CCND1-F CTCACACGCTTCCTCTCCA CCND1-R TCCTCCTCTTCCTCCTCCTC FH-F TTGGTGACAGCTCTCAATCCT FH-R TCGTCAAACTGCTCTGCTGT GAPDH-F CGACCACTTTGTCAAGCTCA GAPDH-R CCCTGTTGCTGTAGCCAAAT HES1-F CGGACATTCTGGAAATGACA HES1-R GTCACCTCGTTCATGCACTC HES6-F AAGCCCCTGGTGGAGAAG HES6-R ACCGTCAGCTCCAGCACTT HOXA13-F CTGGAACGGCCAAATGTACT HOXA13-R GCTCTTTCTCCCCCTCCTA HPRT-F AAAGGACCCCACGAAGTGTT HPRT-R TCAAGGGCATATCCTACAACAA MAML1-F CGAGCAGAACTCCCTGTTTC MAML1-R CTGGGTCCCAACACTGGTAG MAML2-F GCAATTGATGGGAAAGAAGC MAML2-R GCCTTGACAAATGTCGGTTT NOTCH2-F TTGTTGTTGAAAAATGGGGC NOTCH2-R CTCGATTGGCAAAATGGTCT RBPJ-F TCACTCCTGTGCCTGTGGTA RBPJ-R GCTTCTACATCCCCAAACCA RUNX1-F TCTGCAGAACTTTCCAGTCG RUNX1-R GTCGGGGAGTAGGTGAAGG mBcl6-F AGTCCCCACAGCATACAGAGAT mBcl6-R CCCATTCTCACAGCTAGAATCC mHprt-F CCAGACAAGTTTGTTGTTGGA mHprt-R GGCTTTGTATTTGGCTTTTCC mMaml1-F ACCCAACACAAAGCACCTTC mMaml1-R GAGGACAGCTGGAGTTGGAC mMaml2-F AGCCAGCTGCTCAGTATTCG mNotch2-F GAATGGGGCCAACAGAGATA mNotch2-R GGTCCATGTGGTCAGTGATG mRbpj-F TGGTTTGGGGATGTAGAAGC mRbpj-R CGTCATTTCGGACCAAAGTC
qCHIP primers APOL6-F AAAGTGACAGCTGGAGCCC
APOL6-R GGCCTTTGAACAGGAATTGA
ATF5-F TCGGCTGAAGAAAGAAGGTG
ATF5-R TTCTCACTACAGTGTCGCCG
BCL6-F GCAGTGGTAAAGTCCGAAGC
BCL6-R AGCAACAGCAATAATCACCTG

Valls et al. Targeting BCL6 in FL
22
FH-F ACCGGCTCCAAGAATAACCT
FH-R GTGTAAGGCCTTCGGATTCA
GAPDH-F ACGTAGCTCAGGCCTCAAGA
GAPDH-R GCTGCGGGCTCAATTTATAG
HES1-F GGCGGCAATAAAACATCCT
HES1-R CCGAGCTGCAGTTTGACAT
HOXA13-F AAACACCCTGCCACTGTTTC
HOXA13-R TTCTGCAGTGAGACCACAGG
MAML1-F CTGCCAGATTCCCCTTTTCT
MAML1-R AAGAGGCGGCTATTGGTTTC
MAML2-F CCCAGTGGCTGAAGAGGTAA
MAML2-R CCGCTTAACCGAGTCTGATG
NOTCH2-F CTGAGCCTTGAAGCAGGAG
NOTCH2-R GCCTGGGCAGATCCACAT
P86478-F CTCCAGCAGTCGGCTTTC
P86478-R GTGAACCTGTGGACACCTCC
RBPJ-F GGAGCTGGTCTAGGCAAACA
RBPJ-R CCTTCCACTACTCGGCTCAG
Genotyping primers
ROSA26-ICN2
1338_6: CGAGACTCTAGCAATCACAAGC
1338_7: CTGCCTCCTCGGAGAGAAGC
ROSA26-CreER
ROSA26_F: AAAGTCGCTCTGAGTTGTTATCAG
CRE_R: AGGCAAATTTTGGTGTACGG
ROSA26wt_R: GGAGCGGGAGAAATGGATATG
UBC-CreER
UBCCRE_F: TGAAGCTCCGGTTTTGAACT
CRE_R: AGGCAAATTTTGGTGTACGG
Supplementary Table S5: Primers used for RT-PCR (see Figures 2A, 2D, 2E, 4A, 4B, 6B, 6E,
Supplementary S5C, S6B, S6D and S8A). Primers used for QChIP (see Figures 1F and
Supplementary S1D). Primers used to genotype ROSA26-ICN2; ROSA26-CreER and UBC-CreER
mice (see Figures 3, Supplementary Figures S3 and S4).

Valls et al. Targeting BCL6 in FL
23
Supplementary Table S6
Supplementary Table S6: DLBCL p-values on DLBCL signatures. (See Supplementary Figure S1E).

Valls et al. Targeting BCL6 in FL
24
Supplementary Table S7
Supplementary Table S7: BCL6 target genes in GCB-DLBCL. Spearman and rho. (See
Supplementary Figure S1F).

Valls et al. Targeting BCL6 in FL
25
Supplementary Table S8
Supplementary Table S8: DLBCL p-values and rho values on GCB-DLBCL probesets for Notch2
pathway genes. (See Supplementary Figure S1G).

Valls et al. Targeting BCL6 in FL
26
Supplementary Table S9
Supplementary Table S9: Overlap BCL6 target genes on FL and DLBCL datasets. (See Figure 1B for
full FL datasets and Supplementary Figure S1F for DLBCL datasets).

Valls et al. Targeting BCL6 in FL
27
Supplementary Table S10
Supplementary Table S10: p value of NOTCH2 target genes and members of its transcriptional
complex that are inversely correlated to BCL6 in primary GC B-cells. Statistical significance was
assessed by Spearman correlation test. Cut-off was set as p<0.1. rho value is shown in third column.
GC B-cell array accession number: GSE2350[4] (see Figure 2B).

Valls et al. Targeting BCL6 in FL
28

Valls et al. Targeting BCL6 in FL
29
Supplemental Experimental Procedures
Quantitative RT-PCR. RNA was prepared using Trizol extraction (Invitrogen, Carlsbad, CA). cDNA
was prepared using high-capacity cDNA reverse transcription kit (Applied Biosystems). Detection was
done using Fast SyberGreen on 7900HT Fast Real-Time PCR System with 384-Well Block Module
thermal cycler both from Applied Biosystems (Foster city, CA) and using the following conditions: initial
step of 20 seconds (sec) at 95C followed by 40 cycles of 1 sec at 95C and 20 sec at 60C. In siRNA
knockdown, RI-BPI and naïve+cytokine experiments, gene target expression levels were normalized
to HPRT, values are represented as fold change relative to control using the ΔΔCt method. For the
experiments comparing two different cell types (see Fig. 2A) and human FL tumors in mice xenograft
(see Fig. 6E) values are expressed as efficiency-corrected ΔCt method as described previously [5]. All
results are shown as the average of three independent experiments and error bars are standard error
of the mean (SEM). qRT-PCR primers for specific genes were purchased from Fisher Scientific
(Pittsburgh, PA) are listed in Supplementary Table S5.
Plasmids and reporter assays. The pHesAB plasmid was used for reporter assays. This is a pGL2-
based reporter construct with endogenous Hes1 promoter containing two binding sites for RPB-Jk and
two binding sites for Hes proteins and drives expression of luciferase. pGL2-basic construct was used
as control. DoHH2 and Sc-1 cell lines were co-transfected with 500 ng of pHESAB along with 20 pmol
of siRNA for BCL6 or scrambled sequence used as a control (Invitrogen, Carlsbad, CA). pRL-TK
Renilla was used as internal control (Promega, Madison, WI) at a 10:1 ratio. Cells were transfected
using the Amaxa 96-well plate electroporation method (Lonza, Walkerrsville, MD). 24 hours post-
transfection cells were harvested and divided to prepare protein extracts or to assess for abundance of
renilla-luciferase using the Dual-Luciferase Reporter Assay Kit (Promega, Madison, WI) and a
Synergy4 plate reader (BioTek Instruments, Winooski, VT). The percentage of luciferase activity is
shown normalized to renilla values. p21 and CSFR plasmids were used for RUNX1-BCL6 reporter
assays. 100 ng of either plasmid were co-transfected in 293T cells with 50 ng of RUNX1 and/or 50 ng
of BCL6. Luciferase activity was measured as above, normalized to tubulin expression by immunoblot
and quantified by densitometry using ImageJ software (NIH). Values are reported as fold change to
reporter basal activity.
Caspase activity. The number of apoptotic cells was determined by measuring the activity of the
caspases 7 and 3 using a luminogenic substrate (Caspase-Glo 3/7, Promega) following the
manufacturer’s instructions. Cells were exposed for 24 h to vehicle or RI-BPI 10 μM. Caspase activity

Valls et al. Targeting BCL6 in FL
30
was normalized to cell number by multiplexing with CellTiter blue. Results are expressed in
percentage of RLU in the treated vs. control cells. Experiment was carried out in biological duplicates
with experimental triplicates. Results are expressed as mean with SEM. In addition, apoptotic death
was morphologically confirmed by microscopy after staining with ethidium bromide and acridine
orange (not shown).
TUNEL assay. DNA fragmentation coupled to the apoptotic response was detected in morphologically
identifiable nuclei and apoptotic bodies present in formalin-fixed paraffin-embedded tumors by the
TUNEL assay (ApopTag, Chemicon, Temecula, CA) following the manufacturer’s instructions. Tissue
slides were pre-treated with 0.5% trypsin for 15 minutes (Zymed, San Francisco, CA), to improve the
exposure of DNA. Results are expressed as mean and SEM percent of positive nuclei over total nuclei.
Chromatin immunoprecipitation (QChIP and ChIP-on-Chip). ChIPs were performed as described
in Ci et. al. [6] with modifications. ChIP in cell lines was performed using 2x10⁷ cells. Protein-DNA
double cross-link was performed using 2 mM EGS in PBS for 20 minutes at room temperature (RT),
(Cat# 21565) Pierce (Rockfold, IL) followed by 1% formaldehyde another 10 minutes at RT in rotation
(F1635) Sigma Aldrich (St. Louis, MO), cell lysates were sonicated for 30 minutes at an amplitude of
45%, Branson Digital Sonifier (Danbury, CT). Fragment size achieved was between 500-1000bp and
was assessed in an agarose gel. Chromatin immunoprecitiation was performed O/N incubating cell
lysates with 10 μg BCL6 (clone N3) or Actin antibodies (see Transfections section for details), an
aliquot for input was saved before immunoprecipitation. DNA fragments enriched by ChIP were
quantified by real-time PCR using the Fast SYBR green kit and 7900HT real-time thermal cycler
(Applied Biosystems). 2-∆CT values (antibody-input) were expressed as percentage of input and were
calculated by standard curve method. At least three independent experiments were performed in each
condition. Results are represented as standard error of the mean (SEM). ChIP of FL patient samples
was performed as detailed above with some modifications. 1x10⁷ CD20 positive FL cells were
obtained from the hematopathology department from four different patients with approval from the
Weill Cornell Institutional Review Board. After validation of enrichment by QChIP, BCL6 or Actin ChIP
products and their respective input genomic fragments were amplified by ligation-mediated PCR
(LMPCR) enrichment of positive control genes verified in additional QChIPs. The products were co-
hybridized with the respective input samples to NimbleGen promoter arrays, human genome v. 35,
May 2004, NimbleGen Systems (Madison, WI). Western blot was performed to verify BCL6 expression
in all four FL patient samples being all positive and responsive to RI-BPI treatment. QChIP primers for
specific genes were purchased from Fisher Scientific (Pittsburgh, PA) are listed in Supplementary

Valls et al. Targeting BCL6 in FL
31
Table S5.
Data analysis of ChIP-on-Chip. ChIP-on-Chip analysis was performed as previously described[6].
Briefly, to identify target genes of BCL6 from each array, the log-ratio between the probe intensities of
the ChIP product and input was computed by taking moving windows of three neighboring probes for
the average log-ratio and determining the maximum value of those windows as the signal for each
probeset (or gene promoter). Random permutation probe log-ratios were used as background control.
The peak cutoff was established as higher than 0.993 quantile of the log-ratio values generated from
randomly permutated probes, since the ratio of randomly expected "hits" to called "hits" is within a
range where the false discovery rate remains less than 10%. A locus with maximum moving average
above cut-offs in at least three of the four FL samples is considered a binding target. Since this high
stringent-overlapping approach can miss some potential targets, Pearson correlations among probeset
log-ratios between biological replicates were computed as a way to rescue promoters that did not pass
the cut-off in one or two replicates (probesets with a correlation >0.9 between at least two pairs of
unpassed with passed replicates were rescued and included in the final set of BCL6 targets). De novo
motif analysis was performed using the FIRE motif discovery program [7] using default parameters, as
previously described on the ChIP-on-Chip data [6]. CpG-islands were predicted using newcpgreport
from the EMBOSS package (http://emboss.sourceforge.net/), with default parameters. For
unsupervised analysis, the arrays were quantile normalized to a range of values between 0 and 1.
Hierarchical clustering was performed using the Euclidean distance and ward method in the R software
package.
Pathway analysis. The enrichment of BCL6 target genes associated with lymphoid-specific gene
expression signatures [3] and Gene Ontology (GO) biological processes (BP) [8] was examined. The
lymphoid-specific gene expression signatures [3] contain 243 signatures illuminating normal and
pathological lymphoid biology curated from literature (http://lymphochip.nih.gov/signaturedb/). The BP
annotations of GO[8] were downloaded from GSEA Molecular Signatures Database (MSigDB) C5
collection (http://www.broad.mit.edu/gsea/msigdb/). Fisher’s Exact test (adjusted by the number of
genes on the array) was used to calculate enrichment p values and Benjamini-Hochberg (BH)
correction for multiple testing was used for False Discovery Rate (FDR) control. Ingenuity Pathway
Analysis software (IPA) (Redwood City, CA) was used to identify top scored networks for the BCL6
target genes. Gene function analysis was performed by DAVID Gene Functional Annotation Tool [1].

Valls et al. Targeting BCL6 in FL
32
Gene expression microarray data and RNA-seq. Publically available gene expression microarray
data were obtained from 191 primary FLs [9]. Data processing and normalization were performed as
previously described [9]. The expression values of multiple probesets representing the same gene were
averaged in al cases but for Figure 2A, where we experienced better results showing the single probes
separately. The negative correlation with BCL6 was calculated for each gene using one-tailed
Spearman correlation. For RNA sequencing, total RNA was extract from cell lines using Trizol
(LifeTechnologies). RNA concentration was determined using Qubit (LifeTechnologies) and integrity
was verified using Agilent 2100 Bioanalyzer (Agilent Technologies). Libraries were generated using
mRNA-seq sample prep kit (Illumina), through which mRNA was selected by two rounds of purification
using magnetic polydT beads and then fragmented. First-strand synthesis was performed using random
oligos and SuperscriptIII (Invitrogen). After second-strand synthesis, a 50-bp paired-end library was
prepared following the Illumina paired-end library preparation protocol. Pair-end sequencing (PE50)
was performed on Illumina HiSeq2500. Raw image data were converted into base calls and fastq files
via the Illumina pipeline CASAVA version 1.8 with default parameters. All 50-bp-long paired-end reads
were mapped to the reference human (hg19) or mouse (mm10) genome sequence, using TopHat2
aligner[10] with the default parameters and --library-type fr-unstranded for total RNAseq or --library-type
fr-firststrand for strand-specific total RNAseq. The mRNA expression level for each gene was
represented as FPKM (fragments per kilobase of transcript per million fragments mapped), called by
Cufflinks[11] in the Tophat2 package.
Primary B-cell populations’ isolation, culture conditions and cytokine treatments. Tonsillar
tissue was obtained as discarded material from routine tonsillectomies at the Montefiore Children’s
Hospital and WCMC (with approval of Institutional Review Boards of Albert Einstein College of
Medicine, Montefiore Hospital and Weill Cornell Medical College and in accordance with the Helsinki
protocols). Tonsillar mononuclear cells were separated by density centrifugation with Fico/Lite
LymphoH (Atlanta Biologicals, Norcross, GA). Samples were divided in two and the mononuclear cells
rophatPro Separator system from Miltenyi Biotec Inc. (Auburn, CA) as follows: For naïve B cells a first
staining was performed with anti-IgD-FITC and a second staining with FITC-microbeads Miltenyi
Biotec (Auburn, CA), and performed a positive selection. GC B-cell isolation consisted of a first
staining with anti-CD77 Beckman Coulter (Brea, CA), a second staining with anti-MARM, mouse anti-
rat IgM, BD Pharmingen (Franklin Lakes, NJ) and a third staining with rat anti-mouse IgG1
microbeads, Miltenyi Biotec (Auburn, CA) followed by a positive selection. The purity of the isolated B
cell populations was determined by flow cytometry LSRII system Beckton Dickinson (Franklin Lakes,
NJ). Naïve B cells are IgD+CD38lo and GC B-cells are IgD-CD77+CD38hi (see Fig. S3 for purity of

Valls et al. Targeting BCL6 in FL
33
samples). Antibodies used for flow cytometry were as follows: anti-IgD-FITC, anti-CD38-APC and anti-
CD77 plus MARM-FITC BD Pharmingen (Franklin Lakes, NJ). The FlowJo software from Treestar, Inc.
(Ashland, OR) was used for the flow cytometry analysis. Following purification, the samples were
processed for mRNA and protein extraction. Naïve B cells were co-cultured with a stromal layer of
OP9. OP9 is a bone marrow-derived pre-adipocyte cell line that is capable of supporting the growth
and differentiation of multiple hematopoietic cell lineages from hematopoietic progenitor cells (HPCs [12]. Co-cultures were grown in RPMI with 20% FBS, 1%PS, 2mM L-Glutamine and 10 mMHepes.
Cytokine treatment was done using 30 ng/ml of IL4 and 30 ng/ml of IL21 Antigenix America
(Huntington Station, NY) or vehicle for up to 4 days. Cell viability was assessed every day by Trypan
blue dye-exclusion and cytokines were added to media every other day. Alternatively, resting B
lymphocytes from BL57/6 mice spleens were isolated. B220+ splenocytes were obtained by negative
selection with anti-CD43 and anti-Mac-1/CD11b monoclonal antibodies coupled to magnetic
microbeads Miltenyi Biotec (Auburn, CA). Cell purity was >95% and was assessed by CD45R/B220+
BD Pharmingen (Franklin Lakes, NJ). Cells were subjected to the same treatments as for naïve B
cells, but using mouse specific cytokines Antigenix America (Huntington Station, NY). mRNA was
extracted using Trizol protocol (Invitrogen, CA).
ICN2 knock in mice and NP and SRBC immunization: ROSA26-ICN2-IRES-YFP knock-in mice
were generated by insertion of a loxP flanked splice acceptor NEO-ATG cassette with two polyA sites
followed by the ICN2-IRES-YFP cassette into the ROSA26 locus, allowing the ROSA26 promoter to
drive the expression of the NEO-ATG cassette. Cre recombinase mediates the excision of the loxP
flanked NEO-ATG and use of the splice acceptor in the ICN2-IRES-YFP cassette. The IRES-YFP
bicistronic mRNA allows expression to be monitored by YFP expression. In order to express the
transgene (ICN2-IRES-YFP) these mice were crossed with Tamoxifen inducible ROSA26-CreERT2
mice expressing CreERT2 from the ubiquitously expressed ROSA26 promoter [13] or with the CγCre
[14] mice obtained from Jackson laboratories. It has been monitored that a single dose of tamoxifen
allows for 50% allelic recombination efficiency of the ROSA26 locus. ROSA26-ICN2-YFP mice were
generated by Spyros Artavanis-Tsakonas and Exelixis (South San Francisco, CA) and were kept in
specific pathogen-free conditions at the New York University School of Medicine. Experiments were
performed in accordance to the guidelines of the New York University Institutional Animal Care and
Use Committee. For GC studies, serum of pre-immunized mice (ROSA 26 WT and ROSA26-ICN2-
IRES-YFP knock in) was collected one day prior the start of the experiment (day -1). The next day,
mice were injected intraperitoneally with 100 μl of 4Hydroxy-3nitrophenylacetyl hapten-chicken gamma
globulin (NP65-GCC) in alum (day 0). For CreERT2 induction, Tamoxifen (Sigma Aldrich - T5648) was
Valls et al. Targeting BCL6 in FL
34
solubilized in corn oil (Sigma Aldrich - C8267) at a concentration of 20mg/mL and one day after NP
immunization, a single intraperitoneal injection of 0.2mg/g body weight was administered.
Alternatively, mice were immunized intraperitoneally with 500 μl 2% sheep red blood cells (SRBC) in
PBS. Serum was collected at day 7 and day 14. Mice were sacrificed and spleens were harvested for
IHC and Flow-cytometry analysis. Schematic representation of experiment in Figure S4A. Genotyping
primers are listed in Supplementary Table S5.
Flow-cytometry and Immunohistochemistry of GC. B220+ splenocytes from WT and ICN2 mice
were obtained as described above. For GC B cell population we gated on B220+ (BD Biosciences)
and GL7 eFluor674 (eBioscience) and CD95(Fas) PECy7 (BD biosciences). For plasma cell
population (CD38+ CD138+) we used CD38 APC (eBioscience) and CD138 PE (BD Biosciences).
ICN2 expression was assessed by B220+ YFP+. Immunohistochemistry of spleens was performed on
formalin-fixed paraffin-embedded sections with the following primary antibodies: PNA (Vector
Laboratories, CA), BCL6 (N3, Santa Cruz Biotech, CA) and CD45R/B220 (Caltag, CA). Briefly,
deparaffinized slides were antigen-retrieved in citric buffer (pH 6.4) in a steam-bath. We incubated with
biotinylated PNA for 2h at RT followed by avidin-HRP for 1h and DAB for color development. Finally,
slides were counter-stained with hematoxylin; all reagents were from (Vector Laboratories, CA). For
BCL6/B220 staining we proceeded the same way as for PNA, but prior to primary hybridization slides
were permeabilized. Primary antibody was incubated O/N in a humid chamber at 4C. The following
day slides were hybridized with anti-rabbit IgG-Biotin for 2h at RT. ABC-AP staining was used as
substrate for BCIP/NBT developing reagent (purple color). For the second staining with B220, slides
were washed with TBST (10 mM Tris pH 7.5 + 0.01% Tween-20) and boiled for 2 minutes with the
same buffer. Then we proceed with the incubation of the primary antibody as explained for PNA but
without doing counter-staining with hematoxylin. BCL6 shows a purple pattern, while B220 staining is
pale brown. To count the GC we used CellSens Software (Olympus America Inc.).
Anti-NRR2 specificity, flow antibodies and gating strategy. To evaluate the in vivo potency and
specificity of antibody-mediated Notch2 blockade, we injected anti-NRR2 to control B6 mice and
assessed the impact of anti-NRR2 administration on Notch2 vs. Notch1-regulated lymphoid populations [15-17]. B6 wildtype mice (female age and litter matched controls, 8-10 weeks) were treated for 60
hours with humanized IgG1 neutralized antibodies against Notch1 (anti-N1), Notch2 (anti-N2), or
isotype control [18]. All antibodies were injected i.p. (5 mg/kg) in 200μl PBS. To look for Notch2 specific
effects splenic B cells were monitored for loss of either absolute numbers and percentage of MZBs and
CD21/35 expression in FoBs. Conversely, anti-NRR1 but not anti-NRR2 administration inhibited CD25

Valls et al. Targeting BCL6 in FL
35
expression (a specific Notch1 target gene) in early Notch1-dependent thymocyte progenitors[19]. The
following antibodies were from BioLegend: APC-Cy7 conjugated anti-CD4 (clone: RM4-4) and B220
(RA3-6B2). FitC conjugated anti-CD44 (IM7). PE conjugated anti-CD23 (B3B4). APC conjugated anti-
CD117 (c-KIT, 2B8) and CD93 (AA4.1). PE-Cy7 conjugated anti-CD25 (PC61) and CD19 (6D5). BV421
conjugated anti-CD8a (53-6.7) and CD21/35. Lineage cocktail was PE conjugated CD19 (6D5), B220
(RA3-6B2), CD11c (N418), CD11b (M1/70), Gr-1 (RB6-8C5), TER-119, TCRβ (H57-597), CD3 (145-
2C11), NK1.1 (PK136), and TCRγδ (GL3). Dead cells were excluded with Zombie Aqua fixable viability
dye (BioLegend). Flow cytometric analysis was performed on a 3-laser Fortessa (BD).

Valls et al. Targeting BCL6 in FL
36
Supplemental References
1. Dennis G., Jr., Sherman B.T., Hosack D.A., Yang J., Gao W., Lane H.C., et al., DAVID: Database for Annotation, Visualization, and Integrated Discovery. Genome Biol, 2003. 4(5): p. P3.
2. Huang da W., Sherman B.T., and Lempicki R.A., Systematic and integrative analysis of large gene lists using DAVID bioinformatics resources. Nat Protoc, 2009. 4(1): p. 44-57.
3. Shaffer A.L., Wright G., Yang L., Powell J., Ngo V., Lamy L., et al., A library of gene expression signatures to illuminate normal and pathological lymphoid biology. Immunol Rev, 2006. 210: p. 67-85.
4. Basso K., Klein U., Niu H., Stolovitzky G.A., Tu Y., Califano A., et al., Tracking CD40 signaling during germinal center development. Blood, 2004. 104(13): p. 4088-96.
5. Bookout A.L., Cummins C.L., Mangelsdorf D.J., Pesola J.M., and Kramer M.F., High-throughput real-time quantitative reverse transcription PCR. Curr Protoc Mol Biol, 2006. Chapter 15: p. Unit 15 8.
6. Ci W., Polo J.M., Cerchietti L., Shaknovich R., Wang L., Yang S.N., et al., The BCL6 transcriptional program features repression of multiple oncogenes in primary B cells and is deregulated in DLBCL. Blood, 2009. 113(22): p. 5536-48.
7. Elemento O., Slonim N., and Tavazoie S., A universal framework for regulatory element discovery across all genomes and data types. Mol Cell, 2007. 28(2): p. 337-50.
8. Ashburner M., Ball C.A., Blake J.A., Botstein D., Butler H., Cherry J.M., et al., Gene ontology: tool for the unification of biology. The Gene Ontology Consortium. Nature genetics, 2000. 25(1): p. 25-9.
9. Dave S.S., Wright G., Tan B., Rosenwald A., Gascoyne R.D., Chan W.C., et al., Prediction of survival in follicular lymphoma based on molecular features of tumor-infiltrating immune cells. N Engl J Med, 2004. 351(21): p. 2159-69.
10. Kim D., Pertea G., Trapnell C., Pimentel H., Kelley R., and Salzberg S.L., TopHat2: accurate alignment of transcriptomes in the presence of insertions, deletions and gene fusions. Genome Biol, 2013. 14(4): p. R36.
11. Trapnell C., Williams B.A., Pertea G., Mortazavi A., Kwan G., van Baren M.J., et al., Transcript assembly and quantification by RNA-Seq reveals unannotated transcripts and isoform switching during cell differentiation. Nat Biotechnol, 2010. 28(5): p. 511-5.
12. Kodama H., Nose M., Niida S., and Nishikawa S., Involvement of the c-kit receptor in the adhesion of hematopoietic stem cells to stromal cells. Exp Hematol, 1994. 22(10): p. 979-84.
13. Seibler J., Zevnik B., Kuter-Luks B., Andreas S., Kern H., Hennek T., et al., Rapid generation of inducible mouse mutants. Nucleic Acids Res, 2003. 31(4): p. e12.
14. Casola S., Cattoretti G., Uyttersprot N., Koralov S.B., Seagal J., Hao Z., et al., Tracking germinal center B cells expressing germ-line immunoglobulin gamma1 transcripts by conditional gene targeting. Proc Natl Acad Sci U S A, 2006. 103(19): p. 7396-401.
15. Saito T., Chiba S., Ichikawa M., Kunisato A., Asai T., Shimizu K., et al., Notch2 is preferentially expressed in mature B cells and indispensable for marginal zone B lineage development. Immunity, 2003. 18(5): p. 675-85.
16. Radtke F., Wilson A., Stark G., Bauer M., van Meerwijk J., MacDonald H.R., et al., Deficient T cell fate specification in mice with an induced inactivation of Notch1. Immunity, 1999. 10(5): p. 547-58.
17. Tran I.T., Sandy A.R., Carulli A.J., Ebens C., Chung J., Shan G.T., et al., Blockade of individual Notch ligands and receptors controls graft-versus-host disease. The Journal of clinical investigation, 2013. 123(4): p. 1590-604.
18. Wu Y., Cain-Hom C., Choy L., Hagenbeek T.J., de Leon G.P., Chen Y., et al., Therapeutic antibody targeting of individual Notch receptors. Nature, 2010. 464(7291): p. 1052-7.

Valls et al. Targeting BCL6 in FL
37
19. Maillard I., Tu L., Sambandam A., Yashiro-Ohtani Y., Millholland J., Keeshan K., et al., The requirement for Notch signaling at the beta-selection checkpoint in vivo is absolute and independent of the pre-T cell receptor. The Journal of experimental medicine, 2006. 203(10): p. 2239-45.