BCL11A enhancer dissection by Cas9-mediated in situ saturating ...
23
ARTICLE doi:10.1038/nature15521 BCL11A enhancer dissection by Cas9- mediated in situ saturating mutagenesis Matthew C. Canver 1 *, Elenoe C. Smith 1 *, Falak Sher 1 *, Luca Pinello 2 *, Neville E. Sanjana 3 *, Ophir Shalem 3 , Diane D. Chen 1 , Patrick G. Schupp 1 , Divya S. Vinjamur 1 , Sara P. Garcia 2 , Sidinh Luc 1 , Ryo Kurita 4 , Yukio Nakamura 4,5 , Yuko Fujiwara 1,6 , Takahiro Maeda 7 , Guo-Cheng Yuan 2 , Feng Zhang 3 1, Stuart H. Orkin 1,6 1 & Daniel E. Bauer 1 1 Enhancers, critical determinants of cellular identity, are commonly recognized by correlative chromatin marks and gain-of-function potential, although only loss-of-function studies can demonstrate their requirement in the native genomic context. Previously, we identified an erythroid enhancer of human BCL11A, subject to common genetic variation associated with the fetal haemoglobin level, the mouse orthologue of which is necessary for erythroid BCL11A expression. Here we develop pooled clustered regularly interspaced palindromic repeat (CRISPR)-Cas9 guide RNA libraries to perform in situ saturating mutagenesis of the human and mouse enhancers. This approach reveals critical minimal features and discrete vulnerabilities of these enhancers. Despite conserved function of the composite enhancers, their architecture diverges. The crucial human sequences appear to be primate-specific. Through editing of primary human progenitors and mouse transgenesis, we validate the BCL11A erythroid enhancer as a target for fetal haemoglobin reinduction. The detailed enhancer map will inform therapeutic genome editing, and the screening approach described here is generally applicable to functional interrogation of non-coding genomic elements. Enhancers are classically described as distal genetic elements that positively regulate gene expression in an orientation-independent manner in ectopic heterologous gain-of-function expression experi- ments 1 . These elements coordinate when, where and how genes are expressed. Enhancer sequences bind transcription factors and are correlated with specific chromatin features including reduced DNA methylation, characteristic histone modifications, heightened chro- matin accessibility, long-range promoter interactions, and bidirec- tional transcription. Recent chromatin mapping has demonstrated the abundance of distal regulatory elements bearing an enhancer signature 2–4 . The biological importance of enhancers is underscored by gene expression studies showing the predictive power of enhancer profile on lineage-specific programs 5–7 . Highly marked and clustered enhan- cers (for example, so-called strong, stretch, or super-enhancers) are particularly suggestive of cellular identity and may help to infer lin- eage-specific regulatory factors 8–10 . Genome-wide association studies reveal enrichment of trait-associated variants in sequences bearing lineage-restricted enhancer signatures 4,8,11,12 . Enhancers display signs of evolutionary constraint as well as heightened turnover with evid- ence of positive selection 13–16 . Despite their importance, enhancers are typically defined by cri- teria unrelated to in situ functional requirement. Advances in putative enhancer mapping, as well as large-scale oligonucleotide synthesis, facilitate enhancer reporter assays on a massively parallel scale, allow- ing a systematic evaluation of the functional significance of enhancer sequences 17,18 . Nonetheless, ectopic heterologous enhancer assays cannot address the necessity of an element in its native chromatin environment. The growing appreciation of the nonrandom distri- bution of distal elements both with respect to the linear genome and within the three-dimensional nuclear environment emphasizes the importance of studying enhancers by perturbing their endogenous condition 10,19 . Insightful observations have been made by mutagenizing enhan- cers using traditional molecular genetic approaches 20,21 ; however, the low throughput of these classical methods constrains their widespread application. Furthermore, the elevated turnover of many enhancer sequences between species may limit the ability to derive conclusions from nonhuman organisms regarding human gene regulation. Advances in genome editing technology make practical the facile modification of the human genome 22,23 . High-throughput Cas9- mediated functional genomics studies have revealed novel genes required for various biological processes 24–27 . Genome editing is like- wise suitable for the study of non-coding genetic elements such as enhancers, although these experiments have previously been con- ducted at low throughput 28–30 . Human composite enhancer Recently, we observed that common genetic variants associated with fetal haemoglobin (HbF; a 2 c 2 ) level and b-haemoglobin disorder clinical severity mark an adult-developmental-stage- and erythroid-lineage-spe- cific intronic enhancer of BCL11A (ref. 28), a validated repressor of HbF and therapeutic target for b-haemoglobin disorders 28,31–33 . This compos- ite human enhancer is composed of three DNase I hypersensitive sites (DHSs), termed h155, h158 and h162 on the basis of distance in kilobases (kb) from the transcriptional start site (TSS) 28 . The most highly *These authors contributed equally to this work. 1These authors jointly supervised this work. 1 Division of Hematology/Oncology, Boston Children’s Hospital, Department of Pediatric Oncology, Dana-Farber Cancer Institute, Harvard Stem Cell Institute, Department of Pediatrics, Harvard Medical School, Boston, Massachusetts 02115, USA. 2 Department of Biostatistics and Computational Biology, Dana-Farber Cancer Institute and Harvard School of Public Health, Boston, Massachusetts 02115, USA. 3 Broad Institute of MIT and Harvard, McGovern Institute for Brain Research, Department of Brain and Cognitive Sciences and Department of Biological Engineering, MIT, Cambridge, Massachusetts 02142, USA. 4 Cell Engineering Division, RIKEN BioResource Center, Tsukuba, Ibaraki 305-0074, Japan. 5 Comprehensive Human Sciences, University of Tsukuba, Tsukuba, Ibaraki 305-8577, Japan. 6 Howard Hughes Medical Institute, Boston, Massachusetts 02115, USA. 7 Division of Hematology, Department of Medicine, Brigham and Women’s Hospital, Harvard Medical School, Boston, Massachusetts 02115, USA. 00 MONTH 2015 | VOL 000 | NATURE | 1 G2015 Macmillan Publishers Limited. All rights reserved
Transcript of BCL11A enhancer dissection by Cas9-mediated in situ saturating ...

ARTICLEdoi:10.1038/nature15521
BCL11A enhancer dissection by Cas9-mediated in situ saturating mutagenesisMatthew C. Canver1*, Elenoe C. Smith1*, Falak Sher1*, Luca Pinello2*, Neville E. Sanjana3*, Ophir Shalem3, Diane D. Chen1,Patrick G. Schupp1, Divya S. Vinjamur1, Sara P. Garcia2, Sidinh Luc1, Ryo Kurita4, Yukio Nakamura4,5, Yuko Fujiwara1,6,Takahiro Maeda7, Guo-Cheng Yuan2, Feng Zhang31, Stuart H. Orkin1,61 & Daniel E. Bauer11
Enhancers, critical determinants of cellular identity, are commonly recognized by correlative chromatin marks andgain-of-function potential, although only loss-of-function studies can demonstrate their requirement in the nativegenomic context. Previously, we identified an erythroid enhancer of human BCL11A, subject to common geneticvariation associated with the fetal haemoglobin level, the mouse orthologue of which is necessary for erythroidBCL11A expression. Here we develop pooled clustered regularly interspaced palindromic repeat (CRISPR)-Cas9 guideRNA libraries to perform in situ saturating mutagenesis of the human and mouse enhancers. This approach revealscritical minimal features and discrete vulnerabilities of these enhancers. Despite conserved function of the compositeenhancers, their architecture diverges. The crucial human sequences appear to be primate-specific. Through editing ofprimary human progenitors and mouse transgenesis, we validate the BCL11A erythroid enhancer as a target for fetalhaemoglobin reinduction. The detailed enhancer map will inform therapeutic genome editing, and the screeningapproach described here is generally applicable to functional interrogation of non-coding genomic elements.
Enhancers are classically described as distal genetic elements thatpositively regulate gene expression in an orientation-independentmanner in ectopic heterologous gain-of-function expression experi-ments1. These elements coordinate when, where and how genes areexpressed. Enhancer sequences bind transcription factors and arecorrelated with specific chromatin features including reduced DNAmethylation, characteristic histone modifications, heightened chro-matin accessibility, long-range promoter interactions, and bidirec-tional transcription. Recent chromatin mapping has demonstratedthe abundance of distal regulatory elements bearing an enhancersignature2–4.
The biological importance of enhancers is underscored by geneexpression studies showing the predictive power of enhancer profileon lineage-specific programs5–7. Highly marked and clustered enhan-cers (for example, so-called strong, stretch, or super-enhancers) areparticularly suggestive of cellular identity and may help to infer lin-eage-specific regulatory factors8–10. Genome-wide association studiesreveal enrichment of trait-associated variants in sequences bearinglineage-restricted enhancer signatures4,8,11,12. Enhancers display signsof evolutionary constraint as well as heightened turnover with evid-ence of positive selection13–16.
Despite their importance, enhancers are typically defined by cri-teria unrelated to in situ functional requirement. Advances in putativeenhancer mapping, as well as large-scale oligonucleotide synthesis,facilitate enhancer reporter assays on a massively parallel scale, allow-ing a systematic evaluation of the functional significance of enhancersequences17,18. Nonetheless, ectopic heterologous enhancer assayscannot address the necessity of an element in its native chromatin
environment. The growing appreciation of the nonrandom distri-bution of distal elements both with respect to the linear genomeand within the three-dimensional nuclear environment emphasizesthe importance of studying enhancers by perturbing their endogenouscondition10,19.
Insightful observations have been made by mutagenizing enhan-cers using traditional molecular genetic approaches20,21; however, thelow throughput of these classical methods constrains their widespreadapplication. Furthermore, the elevated turnover of many enhancersequences between species may limit the ability to derive conclusionsfrom nonhuman organisms regarding human gene regulation.Advances in genome editing technology make practical the facilemodification of the human genome22,23. High-throughput Cas9-mediated functional genomics studies have revealed novel genesrequired for various biological processes24–27. Genome editing is like-wise suitable for the study of non-coding genetic elements such asenhancers, although these experiments have previously been con-ducted at low throughput28–30.
Human composite enhancerRecently, we observed that common genetic variants associated with fetalhaemoglobin (HbF; a2c2) level and b-haemoglobin disorder clinicalseverity mark an adult-developmental-stage- and erythroid-lineage-spe-cific intronic enhancer of BCL11A (ref. 28), a validated repressor of HbFand therapeutic target for b-haemoglobin disorders28,31–33. This compos-ite human enhancer is composed of three DNase I hypersensitive sites(DHSs), termed h155, h158 and h162 on the basis of distance inkilobases (kb) from the transcriptional start site (TSS)28. The most highly
*These authors contributed equally to this work.1These authors jointly supervised this work.
1Division of Hematology/Oncology, Boston Children’s Hospital, Department of Pediatric Oncology, Dana-Farber Cancer Institute, Harvard Stem Cell Institute, Department of Pediatrics, HarvardMedical School, Boston, Massachusetts 02115, USA. 2Department of Biostatistics and Computational Biology, Dana-Farber Cancer Institute and Harvard School of Public Health, Boston, Massachusetts02115, USA. 3Broad Institute of MIT and Harvard, McGovern Institute for Brain Research, Department of Brain and Cognitive Sciences and Department of Biological Engineering, MIT, Cambridge,Massachusetts 02142, USA. 4Cell Engineering Division, RIKEN BioResource Center, Tsukuba, Ibaraki 305-0074, Japan. 5Comprehensive Human Sciences, University of Tsukuba, Tsukuba, Ibaraki305-8577, Japan. 6Howard Hughes Medical Institute, Boston, Massachusetts 02115, USA. 7Division of Hematology, Department of Medicine, Brigham and Women’s Hospital, Harvard Medical School,Boston, Massachusetts 02115, USA.
0 0 M O N T H 2 0 1 5 | V O L 0 0 0 | N A T U R E | 1
G2015 Macmillan Publishers Limited. All rights reserved

trait-associated haplotype is defined by two single nucleotide poly-morphisms (SNPs): rs1427407 within h162 and rs7606173 withinh155 (Extended Data Fig. 1a). Previously, we showed that this enhancerpossessed ectopic erythroid-restricted, adult-stage-specific enhanceractivity28. Moreover, the mouse orthologue of the composite enhan-cer—defined by primary sequence homology, shared erythroid enhancerchromatin signature and syntenic position relative to coding sequences—was shown to be required for BCL11A expression and embryonic globingene repression in a mouse erythroid cell line but dispensable in a mouseB-lymphoid cell line28.
To evaluate the requirement for human BCL11A enhancersequences, we used HUDEP-2 cells, an immortalized human CD341
haematopoietic stem and progenitor cell (HSPC)-derived erythroidprecursor cell line that expresses BCL11A and predominantly b- ratherthan c-globin34. We used the CRISPR-Cas9 nuclease system to generateclones of HUDEP-2 cells with deletion of the 12-kb BCL11A compositeenhancer by introduction of a pair of chimaeric single guide RNAs(sgRNAs). Enhancer deletion resulted in near-complete loss ofBCL11A expression and induction of c-globin and HbF protein tosimilar levels as cells with BCL11A knockout (Fig. 1a–c), consistentwith the possibility that these sequences could serve as targets fortherapeutic genome editing for HbF reinduction for the b-haemoglo-binopathies35. Although targeted deletions by paired double strandbreaks (DSBs) may be achieved by genome editing, competing genomicoutcomes include local insertion/deletion (indel) production at eachcleavage site as well as inversion of the intervening segment22,23,36–38.
Tiled pooled enhancer editing in situWe hypothesized that composite enhancers may be composed of afunctional hierarchy with essential and dispensable constituent com-ponents. A functional hierarchy might enable enhancer disruption bya single DSB at a critical region followed by non-homologous endjoining (NHEJ) repair with indels. In fact, the hypothesis that a pre-valent mechanism of trait associations is enhancer variation rests onthe premise that single nucleotide changes themselves may substan-tively modulate enhancer function. Therefore, we reasoned that atiling set of sgRNAs could uncover critical enhancer regions by dis-ruption of nearly all sequences within an enhancer on the basis of thetypical outcome of Cas9 cleavage and NHEJ repair, an indel spectrumwith frequent deletions of up to 10 base pairs (bp) from the cleavageposition22,23,36,38,39.
We designed all possible sgRNAs within the human BCL11A com-posite enhancer DHSs (Fig. 1d, e) as restricted only by the presence ofthe Streptococcus pyogenes Cas9 (SpCas9) NGG protospacer adjacentmotif (PAM) sequence, which restricts cleavage at an average 1/8frequency at each genomic position22,39. The NGG-PAM-restrictedsgRNAs had a median gap between adjacent genomic cleavages of4 bp and 90th percentile of 18 bp (Fig. 1f), which suggested that thisstrategy could approach saturation mutagenesis in situ. We includednon-targeting sgRNAs as negative controls as well as sgRNAs tilingexon 2 of BCL11A as positive controls (Fig. 1e). The library wassuccessfully cloned to a lentiviral vector. The basic experimentalschema was to transduce HUDEP-2 cells with the lentiviral libraryat low multiplicity such that nearly all selected cells contained a singleintegrant (Fig. 1d). After expansion, differentiation, sorting by HbFlevel, genomic DNA isolation and deep sequencing of integratedsgRNAs, an HbF enrichment score was calculated for each sgRNAby comparing its representation in HbF-high and HbF-low pools (seeSupplementary Information and Extended Data Fig. 2 for additionaltechnical details).
We mapped the HbF enrichment score of each sgRNA to its pre-dicted position of genomic cleavage (Fig. 2a). Most enhancer targetingsgRNAs showed no significant enrichment or depletion from theHbF-high pool. The enriching sgRNAs co-localized to discretegenomic positions. For example, we observed a cluster of sgRNAsat h162 with modest enrichment, a cluster at h155 with moderate
enrichment (as well as adjacent clusters with depletion), and a clusterat h158 with marked enrichment. Of note, we observed ten sgRNAsat h158 with cleavage positions within 42 bp each with HbF enrich-ment scores exceeding 0.99, the median enrichment score of BCL11Aexon-2-targeting sgRNAs.
Exon-2-targeted sgRNAs showed a linear correlation between HbFenrichment and cellular dropout, suggesting that sgRNAs that resultin complete knockout of BCL11A lead to a reduced rate of cell accu-mulation inseparable from HbF derepression (Fig. 2b). In contrast,the sgRNAs at h158 associated with marked HbF enrichment showedblunted impact on dropout (Fig. 2b). This finding could be consistentwith a low residual level of BCL11A adequate to promote cellularaccumulation but inadequate to suppress HbF.
To corroborate these findings, we introduced two sgRNAs to theHUDEP-2/Cas9 cells to produce targeted deletion or inversionclones36. Deletion of h158 phenocopied deletion of the compositeenhancer and deletion of h155 had moderate effect (while deletion ofh162 showed a non-significant trend towards a modest effect), consist-ent with the magnitude of top-scoring and co-localizing sgRNAs fromthe screen (Fig. 2a, c–e). Inversion of the h158 or h155 sites had nosignificant effect on gene expression, demonstrating that the BCL11Aenhancer functions in an orientation-independent manner in situ, con-sistent with the classic enhancer definition1 (Fig. 2c–e).
a
BC
L11A
exp
ressio
n
0
0.2
0.4
0.6
0.8c
103
100
80
60
40
20
0104
Per
cent
maxim
um
HbF level
Enhancer deleted
Control
BCL11A null
105 106
b
β-lik
e g
lob
in (%
)
εγδβ
0
20
40
60
80
100
d
f
Gap between adjacent
cleavages (bp)
0 25 50 75
sg
RN
A (no
.)
100
20
40
0
200
Median (4 bp)
90th percentile (18 bp)
Synthesize enhancer saturating sgRNA library
Sort cells by HbF, measure library representation
Map sgRNA enrichment to genome
Clone lentiviral library, transduce cells
EnhancerPAMsgRNA
HbF level Reads
Read
s
e
702
49 (7.0)
120 (17.1)
n (%)
212 (30.2)
174 (24.8)
147 (20.9)
DHS +55 (1,283 bp)
DHS +58 (1,264 bp)
DHS +62 (1,370 bp)
Exon 2 (330 bp)
Non-targeting
Total
Con
trol
BCL11A
null
Enhan
cer d
elet
ed
Con
trol
BCL11A
null
Enhan
cer d
elet
ed
Figure 1 | Tiled pooled in situ CRISPR-Cas9 BCL11A enhancer screen.a–c, Deletion of the human composite BCL11A enhancer in HUDEP-2 cellsdemonstrates its necessity for BCL11A expression (normalized to GAPDH),repression of c-globin mRNA, and repression of HbF; control clones,n 5 4; BCL11A null, n 5 1; enhancer deleted, n 5 3; error bars show s.e.m.d, Workflow of CRISPR-Cas9 enhancer screen showing library synthesis,delivery and analysis. e, Human NGG PAM sgRNA library distribution. f, Gapsbetween adjacent genomic cleavages for NGG PAM sgRNAs targeting BCL11Aexon 2, h155, h158 and h162.
2 | N A T U R E | V O L 0 0 0 | 0 0 M O N T H 2 0 1 5
RESEARCH ARTICLE
G2015 Macmillan Publishers Limited. All rights reserved

To validate the findings from the HUDEP-2 cells, the top-scoringenhancer-targeting sgRNA from the screen (number 1621 at h158)was tested in primary human erythroblasts by lentiviral transductionof human CD341 HSPCs exposed to ex vivo erythroid culture con-ditions. Consistent with the screen results, sgRNA-1621 resulted indownregulation of BCL11A expression and corresponding upregula-tion of c-globin expression and increase in HbF1 cells (Fig. 2f–h).Notably, sgRNA-1621 did not alter surface marker profile, enuc-leation frequency, or cellular morphology (Extended Data Fig. 3c).Together, these results suggest proof-of-principle of an individualsgRNA targeting a non-coding element for therapeutic genome edit-ing of b-haemoglobin disorders.
Primate-specific enhancer sequencesWe applied a hidden Markov model (HMM) to the sgRNA enrich-ment score data to infer functionally important sequences within each
DHS (Extended Data Fig. 4a). This model defined three functionalstates—active, repressive and neutral—based on likelihood to encom-pass sequences that positively, negatively and neutrally regulate targetgene expression, respectively. The model identified functional stateswithin each DHS (Fig. 3a–c). At each of the three DHSs, the activestates were precisely located at regions with the highest degree ofDNase I sensitivity.
The overall sequence conservation at the h158 active region appearsboth less intense and less distinct from flanking sequences as comparedto those of h162 and h155 (Fig. 3a–c). The top-scoring sgRNAs in thescreen co-localize to 42 bp within h158 (Fig. 4 and Extended DataFig. 5b). The third-highest-scoring enhancer-targeted sgRNA (sgRNA-1617) mapped directly onto an apparent GATA1 motif, although below agenome-scale significance threshold (P 5 3.74 3 1024). The mouseorthologous sequence has a GATA1 motif P value only modestly higherthan has the human (P 5 4.333 1024). This GATA1 motif appears tohave relatively high vertebrate conservation, with exact human sequenceidentity in rabbits, pigs, dogs and elephants. The top-scoring sgRNA(sgRNA-1621) mapped to a position 15 bp from this GATA1 motif(Fig. 4). An additional four sgRNAs mapping between sgRNA-1621
a
b
Enrichment (log2)
Dro
po
ut
(lo
g2)
Relative distance to TSS (kb)
7 8 55 56 58 59 62 63–2
0
2
4Exon 2Non-targeting DHS +55 DHS +58 DHS +62
–4
–2
0
2
–2 0 2 4–2 0 2 4–2 0 2 4–2 0 2 4–2 0 2 4
r = –0.09651P = 0.2944
r = –0.7769P < 0.0001
r = –0.32P < 0.0001
r = –0.2094P = 0.0055
r = –0.1862P = 0.0483
c d
BC
L11A
exp
ressio
n
0
0.2
0.4
0.6
0.8
eεγδβ
β-lik
e g
lob
in (%
)
0
20
40
60
80
100
Hb
F+ c
ells
(%
)
0
10
20
30
40
60
50
f
BC
L11A
exp
ressio
n
0
0.2
0.4
0.6 g
β-lik
e g
lob
in (%
)
0
20
40
60
80
100
εγδβ
h
Hb
F+ c
ells
(%
)
0
20
40
60
Enrichm
ent
(lo
g2)
Con
trol
Enhan
cer d
elet
ed
DHS +
55 d
elet
ed
DHS +
58 d
elet
ed
DHS +
62 d
elet
ed
DHS +
55 in
verte
d
DHS +
58 in
verte
d
Con
trol
Enhan
cer d
elet
ed
DHS +
55 d
elet
ed
DHS +
58 d
elet
ed
DHS +
62 d
elet
ed
DHS +
55 in
verte
d
DHS +
58 in
verte
d
Con
trol
Enhan
cer d
elet
ed
DHS +
55 d
elet
ed
DHS +
58 d
elet
ed
DHS +
62 d
elet
ed
DHS +
55 in
verte
d
DHS +
58 in
verte
d
Non
-tar
getin
g
BCL11A
exon
2 (0
249)
DHS +
58 (1
621)
Non
-tar
getin
g
BCL11A
exon
2 (0
249)
DHS +
58 (1
621)
Non
-tar
getin
g
BCL11A
exon
2 (0
249)
DHS +
58 (1
621)
Figure 2 | Functional mapping of the BCL11A enhancer. a, Mapping sgRNAHbF enrichment scores relative to genomic cleavage positions. Non-targetingsgRNAs are pseudo-mapped with 5-bp spacing. b, Correlation betweencellular dropout and HbF enrichment scores. c–e, BCL11A expression normal-ized to GAPDH (c), b-like globin expression (d), and HbF1 fraction (e) inHUDEP-2 cells with deletion or inversion of individual DHSs; control clones,n 5 4; enhancer deleted, n 5 3; 155 deleted, n 5 1; 158 deleted, n 5 1; 162deleted, n 5 5; 155 inverted, n 5 3; 158 inverted, n 5 2. f–h, BCL11A expres-sion normalized to GAPDH (f), b-like globin expression (g), and HbF1 fraction(h) in primary human erythroid precursors transduced with Cas9 and individualsgRNAs; n 5 3. Error bars represent s.e.m. (c, d, f, g) or s.d. (e, h).
a Chr2: 1 kb60,725,000
Active
Repressive
Neutral
States
rs7606173
DHS +55 HMM
DNase I
HbF enrichment
1
0
–1
b
c
Chr2: 1 kb60,721,500
Chr2: 1 kb60,717,500
Active
Neutral
States
Active
Neutral
States
PhyloP
PhastCons
PhyloP
PhastCons
PhyloP
PhastCons
rs1427407
DHS +58 HMM
DNase I
HbF enrichment
HbF enrichment
DHS +62 HMM
DNase I
2
0
0.5
0
Figure 3 | Inferred functional enhancer states relative to genomic features.a–c, HMM segmentation of functional enhancer states. HbF enrichment scoresare shown throughout DHSs h155, h158 and h162 by grey lines and circles,with the blue line representing smoothed enrichment score. DNase Isequencing from primary human erythroblasts28. PhyloP (scale from 24.5 to4.88) and PhastCons (from 0 to 1) estimates of evolutionary conservationamong 100 vertebrates are shown. Positions of SNPs rs7606173 and rs1427407are denoted, which together define the haplotype most highly associated withHbF level28.
0 0 M O N T H 2 0 1 5 | V O L 0 0 0 | N A T U R E | 3
ARTICLE RESEARCH
G2015 Macmillan Publishers Limited. All rights reserved

and sgRNA-1617 each had substantially elevated HbF enrichmentscores. Underlying these sgRNAs were additional predicted motifs (thatis, RXRA, EHF, ELF1 and STAT1). Although these sequences showed ahigh level of conservation among primates, they showed high degeneracyamong nonprimate vertebrates (Fig. 4).
We tested the pattern of mutations observed upon treatment ofcells with either sgRNA-1621 or sgRNA-1617 by deep sequencing.Each of these sgRNAs is sufficient to substantially induce HbF inhuman erythroid cells (Fig. 2h and Extended Data Fig. 3a, b). Wesorted cells exposed to Cas9 and these sgRNAs into HbF-high andHbF-low pools. We determined the indel spectrum in each popu-lation by deep sequencing (Extended Data Fig. 4b). As expected, weobserved indels clustering around the predicted cleavage positions. Bycomparing the per nucleotide indel ratio between cells from the HbF-high and HbF-low pools, we calculated a relative indel enrichmentacross the sequencing amplicon. Notably, both sgRNAs yielded max-imal HbF indel enrichment not precisely at the expected cleavageposition but offset at shared intervening sequences (Fig. 4). Thesesites of maximal HbF mutation enrichment mapped to 7 bp directlyoverlapping predicted motifs (Fig. 4). Taken together, these data sug-gest that a conserved GATA1 motif scoring below the predictionthreshold adjacent to primate-specific sequences form the core ofan enhancer essential for human erythroid BCL11A expression andHbF repression.
Mouse enhancer dissectionTo test functional conservation of the BCL11A enhancer, we exam-ined the orthologous mouse Bcl11a enhancer in greater detail.Erythroid DNase I sensitivity is observed at those sequences homo-logous to h155 and h162 but not h158 (Extended Data Fig. 6a),consistent with the reduced sequence homology within the h158active region (Fig. 3a–c). We performed a pooled CRISPR enhancersaturating mutagenesis screen in MEL ey:mCherry reporter cells,similar to the human screen described above (Extended Data Figs 6and 7, and Supplementary Information).
Upon mapping the sgRNA cleavage positions to the genome, weagain observed that the majority of enhancer-targeting sgRNAsdemonstrated no significant ey enrichment or depletion. We observedco-localization of sets of sgRNAs with ey enrichment (Fig. 5a). Therewas a similar complex pattern at the m155 orthologue as at h155,with adjacent regions with enriching and depleting sgRNAs from thehigh-ey:mCherry pool at the DHS core. At the m158 orthologue we
did not observe any evidence of ey enriching or depleting sgRNAs. Atthe m162 orthologue there was a marked peak, with five sgRNAswith ey enrichment scores exceeding 1.30, the median enrichmentscore of Bcl11a exon-2-targeting sgRNAs (Fig. 5a). This potent impactof the m162 orthologue was in contrast to the modest impact ofindividual sgRNAs or DHS deletion at h162.
We used pairs of sgRNAs in the presence of Cas9 to produceMEL clones with deletions of various substituent elements at theBcl11a enhancer (Fig. 5b). Deletion of the DNase-insensitive m158orthologue had no apparent effect on Bcl11a expression, consistentwith the pooled screen result. Deletion of the m155 orthologue led toan approximately twofold reduction in Bcl11a expression (mean
1621
Chr2:--->
50 bp60,722,350
Klf1
Klf1
RREB1
Rxra
ELF1
16171621
EHFSTAT1
144 bp murine insertion
2
DHS +58 HMM
GapsHumanChimpGorilla
RhesusBaboon
MarmosetBushbaby
Chinese tree shrewSquirrelMouse
Pig
RatNaked mole-rat
Rabbit
CowDog
ElephantOpossum
ChickenZebrafish
Primate
Nonprimate
Motifs
PhyloP
PhastCons
1617
HbF enrichment
HbF indel enrichment
Min Max
0
Figure 4 | Primate-specific BCL11A enhancerfunctional core. DHS h158 functional coredefined by maximal HbF enrichment score andactive HMM state. HbF enrichment scores areshown by grey lines and circles. HbF indelenrichment per nucleotide is based on amplicongenomic sequencing of sorted cells exposed toeither sgRNA-1617 or -1621. No common SNPs(minor allele frequency .1%) are present at thisregion. JASPAR motifs (P , 1024) are depictedin black with selected motifs annotated bytranscription factor based on known erythroid-specific function or genomic position. Gata1 motifLOGO at sgRNA-1617 cleavage position asdescribed in text. Orthologous sequences are listedfrom representative primates and nonprimatesof distributed phylogeny. PhyloP (scale from24.5 to 4.88) and PhastCons (from 0 to 1)estimates of evolutionary conservation among100 vertebrates are shown.
c
0
20
40
60
80
100
Hu
man
β-l
ike g
lob
in (%
)
12.514.5
16.518.5
εγβ
Embryonic day
12.514.5
16.518.5
12.514.5
16.518.5
DHS +62 +/+ DHS +62 +/Δ DHS +62 Δ/Δ
a
7 8 51 52 54 55 58 59
Relative distance to TSS (kb)
En
rich
men
t (lo
g2)
–2
0
2
4
Exon 2Non-targeting DHS +55 DHS +58 DHS +62
b
0.01
0.1
1
10
Bcl
11a
exp
ressio
n
MEL
Enhan
cer d
elet
ed
DHS +
55 d
elet
ed
DHS +
58 d
elet
ed
DHS +
62 d
elet
ed
DHS +
62 in
verte
d
Figure 5 | Functional sequence requirement at the mouse Bcl11a erythroidenhancer for in vivo haemoglobin switching. a, Mapping sgRNA eyenrichment scores to genomic cleavage positions. Non-targeting sgRNAs werepseudo-mapped with 5 bp spacing. b, Bcl11a expression in mouse erythroidclones with deletion or inversion of individual DHSs relative to non-deletedcontrols. c, Transgenic humanb-like globin expression inb-YAC/162 deletionmice. For 1/1, 1/D and D/D: at E12.5, n 5 5, 11 and 3 embryos, respectively;at E14.5, n 5 2, 3 and 4; at E16.5, n 5 2, 4 and 1; at E18.5, n 5 3, 1 and 3.Error bars represent s.e.m.
4 | N A T U R E | V O L 0 0 0 | 0 0 M O N T H 2 0 1 5
RESEARCH ARTICLE
G2015 Macmillan Publishers Limited. All rights reserved
residual level 49%, P , 0.0001), whereas deletion of the m162 ortho-logue approached deletion of the entire composite enhancer interms of reduction in Bcl11a expression (mean residual levels of 8%(P , 0.0001) and 6% (P , 0.0001), respectively, Fig. 5b; also seeSupplementary Information and Extended Data Figs 8 and 9). Inaddition, clones in which the m162 orthologue was inverted showedno change in Bcl11a expression, suggesting that the mouse enhancer,like the human enhancer, functions independently of orientation insitu (Figs 2c–e and 5b).
Erythroid-restricted function in vivoTo substantiate the importance of the m162 orthologue for Bcl11aexpression and to validate BCL11A enhancer disruption as a thera-peutic strategy, we generated mice deficient for the Bcl11a m162orthologue. We used the same Cas9 and paired sgRNA deletion strat-egy in mouse embryonic stem cells, from which we derived mice withgermline transmission of the enhancer deletion. Previous studies havedemonstrated essential roles for Bcl11a in structural development ofthe central nervous system and B lymphopoiesis40–42. Notably, unlikeconventional Bcl11a knockouts, which die hours after birth, m162orthologue deletion mice were born healthy at expected Mendelianratios (Extended Data Fig. 10a). The m162 orthologue deletion micealso showed normal frequencies of B-cell progenitors in the fetal liverand mature B lymphocytes in the adult peripheral blood (ExtendedData Fig. 10b, c). Other haematopoietic lineages were also observed atwild-type frequencies (Extended Data Fig. 10c). Bcl11a expressionwas unperturbed in the brain or sorted B cell precursors from embry-onic day 16.5 (E16.5) embryos (Extended Data Fig. 10d). In contrast,there was substantial reduction in Bcl11a levels in sorted E16.5 eryth-roid precursors (26% residual, P , 0.05; Extended Data Fig. 10d).
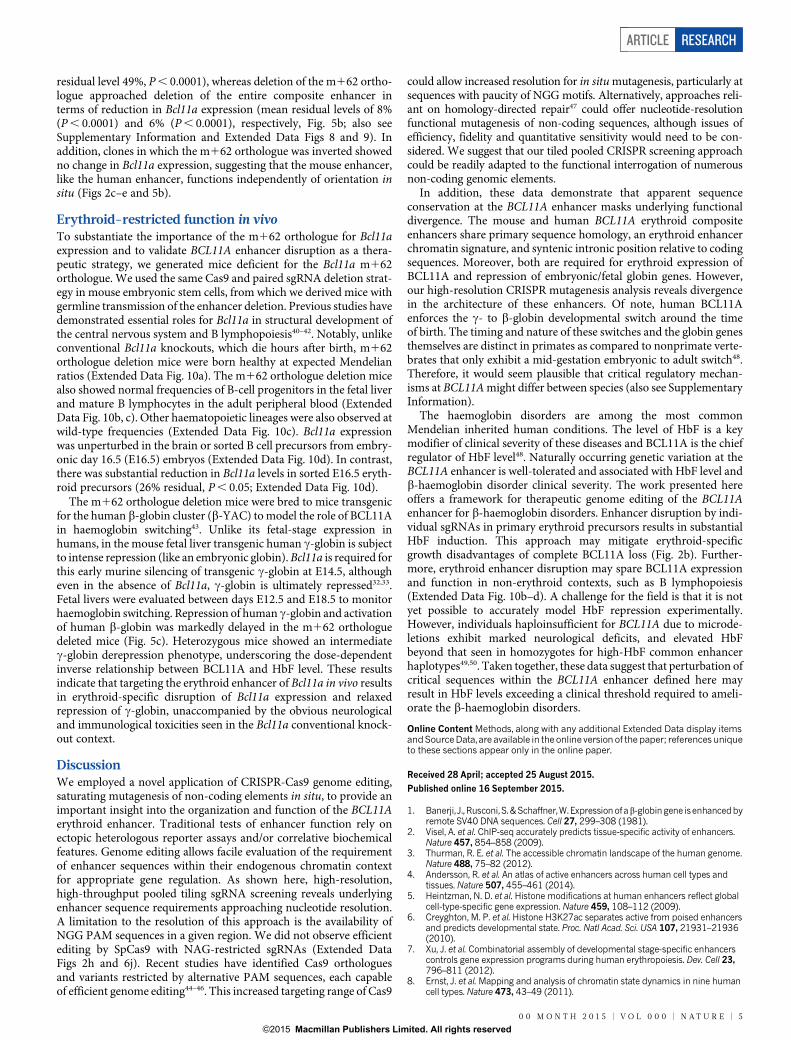
The m162 orthologue deletion mice were bred to mice transgenicfor the human b-globin cluster (b-YAC) to model the role of BCL11Ain haemoglobin switching43. Unlike its fetal-stage expression inhumans, in the mouse fetal liver transgenic human c-globin is subjectto intense repression (like an embryonic globin). Bcl11a is required forthis early murine silencing of transgenic c-globin at E14.5, althougheven in the absence of Bcl11a, c-globin is ultimately repressed32,33.Fetal livers were evaluated between days E12.5 and E18.5 to monitorhaemoglobin switching. Repression of human c-globin and activationof human b-globin was markedly delayed in the m162 orthologuedeleted mice (Fig. 5c). Heterozygous mice showed an intermediatec-globin derepression phenotype, underscoring the dose-dependentinverse relationship between BCL11A and HbF level. These resultsindicate that targeting the erythroid enhancer of Bcl11a in vivo resultsin erythroid-specific disruption of Bcl11a expression and relaxedrepression of c-globin, unaccompanied by the obvious neurologicaland immunological toxicities seen in the Bcl11a conventional knock-out context.
DiscussionWe employed a novel application of CRISPR-Cas9 genome editing,saturating mutagenesis of non-coding elements in situ, to provide animportant insight into the organization and function of the BCL11Aerythroid enhancer. Traditional tests of enhancer function rely onectopic heterologous reporter assays and/or correlative biochemicalfeatures. Genome editing allows facile evaluation of the requirementof enhancer sequences within their endogenous chromatin contextfor appropriate gene regulation. As shown here, high-resolution,high-throughput pooled tiling sgRNA screening reveals underlyingenhancer sequence requirements approaching nucleotide resolution.A limitation to the resolution of this approach is the availability ofNGG PAM sequences in a given region. We did not observe efficientediting by SpCas9 with NAG-restricted sgRNAs (Extended DataFigs 2h and 6j). Recent studies have identified Cas9 orthologuesand variants restricted by alternative PAM sequences, each capableof efficient genome editing44–46. This increased targeting range of Cas9
could allow increased resolution for in situ mutagenesis, particularly atsequences with paucity of NGG motifs. Alternatively, approaches reli-ant on homology-directed repair47 could offer nucleotide-resolutionfunctional mutagenesis of non-coding sequences, although issues ofefficiency, fidelity and quantitative sensitivity would need to be con-sidered. We suggest that our tiled pooled CRISPR screening approachcould be readily adapted to the functional interrogation of numerousnon-coding genomic elements.
In addition, these data demonstrate that apparent sequenceconservation at the BCL11A enhancer masks underlying functionaldivergence. The mouse and human BCL11A erythroid compositeenhancers share primary sequence homology, an erythroid enhancerchromatin signature, and syntenic intronic position relative to codingsequences. Moreover, both are required for erythroid expression ofBCL11A and repression of embryonic/fetal globin genes. However,our high-resolution CRISPR mutagenesis analysis reveals divergencein the architecture of these enhancers. Of note, human BCL11Aenforces the c- to b-globin developmental switch around the timeof birth. The timing and nature of these switches and the globin genesthemselves are distinct in primates as compared to nonprimate verte-brates that only exhibit a mid-gestation embryonic to adult switch48.Therefore, it would seem plausible that critical regulatory mechan-isms at BCL11A might differ between species (also see SupplementaryInformation).
The haemoglobin disorders are among the most commonMendelian inherited human conditions. The level of HbF is a keymodifier of clinical severity of these diseases and BCL11A is the chiefregulator of HbF level48. Naturally occurring genetic variation at theBCL11A enhancer is well-tolerated and associated with HbF level andb-haemoglobin disorder clinical severity. The work presented hereoffers a framework for therapeutic genome editing of the BCL11Aenhancer for b-haemoglobin disorders. Enhancer disruption by indi-vidual sgRNAs in primary erythroid precursors results in substantialHbF induction. This approach may mitigate erythroid-specificgrowth disadvantages of complete BCL11A loss (Fig. 2b). Further-more, erythroid enhancer disruption may spare BCL11A expressionand function in non-erythroid contexts, such as B lymphopoiesis(Extended Data Fig. 10b–d). A challenge for the field is that it is notyet possible to accurately model HbF repression experimentally.However, individuals haploinsufficient for BCL11A due to microde-letions exhibit marked neurological deficits, and elevated HbFbeyond that seen in homozygotes for high-HbF common enhancerhaplotypes49,50. Taken together, these data suggest that perturbation ofcritical sequences within the BCL11A enhancer defined here mayresult in HbF levels exceeding a clinical threshold required to ameli-orate the b-haemoglobin disorders.
Online Content Methods, along with any additional Extended Data display itemsandSourceData, are available in the online version of the paper; references uniqueto these sections appear only in the online paper.
Received 28 April; accepted 25 August 2015.
Published online 16 September 2015.
1. Banerji, J., Rusconi, S. &Schaffner,W. Expression ofab-globin gene isenhancedbyremote SV40 DNA sequences. Cell 27, 299–308 (1981).
2. Visel, A. et al. ChIP-seq accurately predicts tissue-specific activity of enhancers.Nature 457, 854–858 (2009).
3. Thurman, R. E. et al. The accessible chromatin landscape of the human genome.Nature 488, 75–82 (2012).
4. Andersson, R. et al. An atlas of active enhancers across human cell types andtissues. Nature 507, 455–461 (2014).
5. Heintzman, N. D. et al. Histone modifications at human enhancers reflect globalcell-type-specific gene expression. Nature 459, 108–112 (2009).
6. Creyghton, M. P. et al. Histone H3K27ac separates active from poised enhancersand predicts developmental state. Proc. Natl Acad. Sci. USA 107, 21931–21936(2010).
7. Xu, J. et al. Combinatorial assembly of developmental stage-specific enhancerscontrols gene expression programs during human erythropoiesis. Dev. Cell 23,796–811 (2012).
8. Ernst, J. et al. Mapping and analysis of chromatin state dynamics in nine humancell types. Nature 473, 43–49 (2011).
0 0 M O N T H 2 0 1 5 | V O L 0 0 0 | N A T U R E | 5
ARTICLE RESEARCH
G2015 Macmillan Publishers Limited. All rights reserved

9. Parker, S. C. J. et al. Chromatin stretch enhancer states drive cell-specific generegulation and harbor human disease risk variants. Proc. Natl Acad. Sci. USA 110,17921–17926 (2013).
10. Whyte, W. A. et al. Master transcription factors and mediator establish super-enhancers at key cell identity genes. Cell 153, 307–319 (2013).
11. Paul, D. S. et al. Maps of open chromatin guide the functional follow-up of genome-wide association signals: Application to hematological traits. PLoS Genet. 7,e1002139 (2011).
12. Maurano, M. T. et al. Systematic localization of common disease-associatedvariation in regulatory DNA. Science 337, 1190–1195 (2012).
13. Hardison, R. C. Variable evolutionary signatures at the heart of enhancers. NatureGenet. 42, 734–735 (2010).
14. Vierstra, J. et al. Mouse regulatory DNA landscapes reveal global principles of cis-regulatory evolution. Science 346, 1007–1012 (2014).
15. Villar, D. et al. Enhancer evolution across 20 mammalian species. Cell 160,554–566 (2015).
16. Pennacchio, L. A. et al. In vivo enhancer analysis of human conserved non-codingsequences. Nature 444, 499–502 (2006).
17. Melnikov, A. et al. Systematic dissection and optimization of inducible enhancersin human cells using a massively parallel reporter assay. Nature Biotechnol. 30,271–277 (2012).
18. Patwardhan, R. P. et al. Massively parallel functional dissection of mammalianenhancers in vivo. Nature Biotechnol. 30, 265–270 (2012).
19. Sexton, T. & Cavalli, G. The role of chromosome domains in shaping the functionalgenome. Cell 160, 1049–1059 (2015).
20. Bender, M., Bulger, M., Close, J. & Groudine, M. b-globin gene switching and DNaseI sensitivity of the endogenous b-globin locus in mice do not require the locuscontrol region. Mol. Cell 5, 387–393 (2000).
21. Johnson, K. D. et al. Cis-element mutated in GATA2-dependent immunodeficiencygoverns hematopoiesis and vascular integrity. J. Clin. Invest. 122, 3692–3704(2012).
22. Cong, L. et al. Multiplex genome engineering using CRISPR/Cas systems. Science339, 819–823 (2013).
23. Mali, P. et al. RNA-guided human genome engineering via Cas9. Science 339,823–826 (2013).
24. Wang, T., Wei, J. J., Sabatini, D. M. & Lander, E. S. Genetic screens in human cellsusing the CRISPR-Cas9 system. Science 343, 80–84 (2014).
25. Shalem, O. et al. Genome-scale CRISPR-Cas9 knockout screening in human cells.Science 343, 84–87 (2014).
26. Koike-Yusa, H., Li, Y., Tan, E.-P., Velasco-Herrera, M. D. C. & Yusa, K. Genome-widerecessive genetic screening in mammalian cells with a lentiviral CRISPR-guideRNA library. Nature Biotechnol. 32, 267–273 (2014).
27. Zhou, Y. et al. High-throughput screening of a CRISPR/Cas9 library for functionalgenomics in human cells. Nature 509, 487–491 (2014).
28. Bauer, D. E. et al. An erythroid enhancer of BCL11A subject to genetic variationdetermines fetal hemoglobin level. Science 342, 253–257 (2013).
29. Groschel, S.et al. Asingleoncogenicenhancer rearrangement causes concomitantEVI1 and GATA2 deregulation in Leukemia. Cell 157, 369–381 (2014).
30. Mansour, M. R. et al. An oncogenic super-enhancer formed through somaticmutation of a noncoding intergenic element. Science 346, 1373–1377 (2014).
31. Sankaran, V. G. et al. Human fetal hemoglobin expression is regulated by thedevelopmental stage-specific repressor BCL11A. Science 322, 1839–1842(2008).
32. Sankaran, V. G. et al. Developmental and species-divergent globin switching aredriven by BCL11A. Nature 460, 1093–1097 (2009).
33. Xu, J. et al. Correction of sickle cell disease in adult mice by interference with fetalhemoglobin silencing. Science 334, 993–996 (2011).
34. Kurita, R. et al. Establishment of immortalized human erythroid progenitor celllines able to produce enucleated red blood cells. PLoS ONE 8, e59890 (2013).
35. Hardison, R. C. & Blobel, G. A. GWAS to therapy by genome edits? Science 342,206–207 (2013).
36. Canver, M. C. et al. Characterization of genomic deletion efficiency mediated byclusted regularly interspaced palindromic repeats (CRISPR)/Cas9 nucleasesystem in mammalian cells. J. Biol. Chem. 289, 21312–21324 (2014).
37. Mandal, P. K. et al. Efficient ablation of genes in human hematopoietic stem andeffector cells using CRISPR/Cas9. Cell Stem Cell 15, 643–652 (2014).
38. Ran, F. A. et al. Double nicking by RNA-guided CRISPR Cas9 for enhanced genomeediting specificity. Cell 154, 1380–1389 (2013).
39. Hsu, P. D. et al. DNA targeting specificity of RNA-guided Cas9 nucleases. NatureBiotechnol. 31, 827–832 (2013).
40. Liu, P.et al. Bcl11a is essential for normal lymphoiddevelopment. Nature Immunol.4, 525–532 (2003).
41. John, A. et al. Bcl11a is required for neuronal morphogenesis and sensory circuitformation in dorsal spinal cord development. Development 139, 1831–1841(2012).
42. Yu, Y. et al. Bcl11a is essential for lymphoid development and negatively regulatesp53. J. Exp. Med. 209, 2467–2483 (2012).
43. Porcu, B. S. et al. The human b globin locus introduced by YAC transfer exhibits aspecific and reproducible pattern of developmental regulation in transgenic mice.Blood 90, 4602–4609 (1997).
44. Ran, F. A. et al. In vivo genome editing using Staphylococcus aureus Cas9. Nature520, 186–191 (2015).
45. Kleinstiver, B. P. et al. Engineered CRISPR-Cas9 nucleases with altered andimproved PAM specificities. Nature 523, 481–485 (2015).
46. Esvelt, K. M. et al. Orthogonal Cas9 proteins for RNA-guided gene regulation andediting. Nature Methods 10, 1116–1121 (2013).
47. Findlay, G. M., Boyle, E. A., Hause, R. J., Klein, J. C. & Shendure, J. Saturation editingof genomic regions by multiplex homology-directed repair. Nature 513, 120–123(2014).
48. Bauer, D. E., Kamran, S. C. & Orkin, S. H. Reawakening fetal hemoglobin: Prospectsfor new therapies for the beta-globin disorders. Blood 120, 2945–2953 (2012).
49. Basak, A. et al.Persistence of fetal hemoglobin and altered neurodevelopment dueto BCL11A deletions. JCI 125, 2363–2368 (2015).
50. Funnell, P. W. et al. 2p15-p16.1 microdeletions encompassing and proximal toBCL11A are associated with elevated HbF in addition to neurologic impairment.Blood 126, 89–93 (2015).
Supplementary Information is available in the online version of the paper.
Acknowledgements We thank J. Hughes and D. Higgs for assistance with analysis ofChIP-seq; R. Mathieu and the Boston Children’s Hospital Hematology/Oncology-HSCIFlow Cytometry Research Facility for cell sorting; Z. Herbert and F. Abderazzaq at theDana-Farber Cancer Institute Molecular Biology Core Facility and Center for CancerComputational Biology, respectively, for sequencing; J. Doench for providing TALENs;C. Peng for advice with MEL reporter cell generation; F. Godinho and M. Nguyen fortechnical help with ESCs and transgenic mice; A. Dass,C. Lin and S. Kamran for generaltechnical assistance; C. Brendel and D. Williams for input regarding lentiviraltransduction of HSPCs; J. Desimini for graphical assistance; and J. Xu and G. Lettre forinsightfuldiscussions. M.C.C. is supported byF30DK103359-01A1. E.C.S. is supportedby a Jane Coffin Childs Memorial Fund for Medical Research Fellowship. L.P. issupported by NHGRI Career Development Award K99HG008399. N.E.S. is supportedby a Simons Center for the Social Brain Postdoctoral Fellowship and NIH NHGRI awardK99-HG008171. O.S. is supported by a fellowship from the Klarman FamilyFoundation. S.L. is supportedbya Leukemia&Lymphoma Society FellowAward. T.M. issupported by NIH R01 A1084905. G.-C.Y. is supported by NIH R01HL119099 andR01HG005085. F.Z. is supported by the NIMH (5DP1-MH100706) and NIDDK(5R01-DK097768), a Waterman award from the National Science Foundation, theKeck, McKnight, Damon Runyon, Searle Scholars, Merkin, Vallee, and SimonsFoundations, and Bob Metcalfe. S.H.O. is supported by P01HL032262 andP30DK049216 (Center of Excellence in Molecular Hematology). D.E.B. is supported byan NIDDK Career Development Award K08DK093705, Doris Duke CharitableFoundation Innovations in Clinical Research Award (2013137), and Charles H. HoodFoundation Child Health Research Award. Computational tools and instructions fordesigning CRISPR-Cas9 sgRNA libraries for conducting non-coding screening can befound at the Zhang laboratory website http://www.genome-engineering.org.
Author Contributions D.E.B. conceived this study. N.E.S., O.S. and F.Z. conceived thepooled non-coding screening strategy using CRISPR-Cas9. M.C.C., N.E.S., O.S., F.Z.,S.H.O. and D.E.B. designed and executed the pooled CRISPR screening strategy. E.C.S.,F.S., Y.F., S.L., S.H.O. and D.E.B. designed, produced and analysed the transgenic mice.R.K. and Y.N.provided theHUDEP-2cell line.M.C.C., F.S., T.M.,S.H.O. andD.E.B. adaptedthe HUDEP-2 cell line as a model of globin gene regulation. M.C.C., F.S., D.D.C., P.G.S.,D.S.V. and D.E.B. performed all experiments in cell lines. M.C.C., L.P., N.E.S., S.P.G.,G.-C.Y., F.Z., S.H.O. and D.E.B. analysed the data. L.P., S.P.G. and G.-C.Y. developed theHMM. M.C.C., S.H.O., and D.E.B. wrote the manuscript with input from all authors.
Author Information All reagents described in this manuscript have been depositedwith Addgene (http://www.addgene.org). Reprints and permissions information isavailable at www.nature.com/reprints. The authors declare competing financialinterests: details are available in the online version of the paper. Readers are welcometo comment on the online version of the paper. Correspondence and requests formaterials should be addressed to D.E.B. ([email protected]), S.H.O.([email protected]), or F.Z. ([email protected]).
6 | N A T U R E | V O L 0 0 0 | 0 0 M O N T H 2 0 1 5
RESEARCH ARTICLE
G2015 Macmillan Publishers Limited. All rights reserved

METHODSNo statistical methods were used to predetermine sample size.Generation of genomic deletions in HUDEP-2 cells. HUDEP clone 2 (HUDEP-2)was used as previously described34. HUDEP-2 cells were expanded in StemSpanSFEM (Stem Cell Technologies) supplemented with 1026 M dexamethasone(Sigma), 100 ng ml21 human stem cell factor (SCF) (R&D), 3 international units(IU) ml21 erythropoietin (Amgen), 1% L-glutamine (Life Technologies), and 2%penicillin/streptomycin. 1mg ml21 doxycycline (Sigma) was included in the cul-ture to induce expression of the human papilloma virus type 16 E6/E7 genes34.HUDEP-2 cells were differentiated in Iscove’s Modified Dulbecco’s Medium(IMDM) (Life Technologies) supplemented with 330mg ml21 holo-transferrin(Sigma), 10 mg ml21 recombinant human insulin (Sigma), 2 IU ml21 heparin(Sigma), 5% human solvent detergent pooled plasma AB (Rhode Island BloodCenter), 3 IU ml21 erythropoietin, 100 ng ml21 human SCF, 1mg ml21 doxycy-cline, 1% L-glutamine, and 2% penicillin/streptomycin.
Tandem sgRNA lentiviruses were transduced into HUDEP-2 with stable Cas9expression (Supplementary Table 1). Bulk cultures were incubated for 7–10 dayswith 10 mg ml21 blasticidin and 1mg ml21 puromycin selection to allow for edit-ing. Then bulk cultures were plated clonally at limiting dilution. 96 well plateswith greater than 30 clones per plate were excluded to avoid mixed clones. Afterapproximately 14 days of clonal expansion, genomic DNA was extracted using50 ml QuickExtract DNA Extraction Solution per well (Epicentre). Clones werescreened for deletion by conventional PCR with one PCR reaction internal tosegment to be deleted (non-deletion band) and one gap-PCR reaction across thedeletion junction (deletion band) that would only amplify in the presence ofdeletion36. Biallelic deletion clones were identified as the absence of the non-deletion PCR band and the presence of the deletion PCR band (SupplementaryTable 2). Inversion clones were identified as previously described by PCR36
(Supplementary Table 3). Briefly, inversion clones had one inverted allele andone deleted allele without the presence of non-deletion alleles. In our experiencebiallelic inversion clones are very rare events36. PCR was performed using theQiagen HotStarTaq 23 master mix and the following cycling conditions: 95 uCfor 15 min; 35 cycles of 95 uC for 15 s, 60 uC for 1 min, 72 uC for 1 min; 72 uC for10 min. Alternatively, PCR was also performed using 23 Accuprime Supermix II(Life Technologies) with the following cycling conditions: 94 uC for 2 min; 35cycles of 94 uC for 20 s, 60 uC for 20 s, 68 uC for 1 min kb21 of PCR product; 68 uCfor 5 min. RNA was extracted from each positive clone using a kit (Qiagen) andquantitative real-time RT-qPCR was performed using iQ SYBR Green Supermix(Bio-Rad). Primers used are found in Supplementary Table 5. Gene expressionwas normalized to that of GAPDH. We isolated four control, one BCL11A null,three composite enhancer deleted, one h155 deleted, one h158 deleted, fiveh162 deleted, three h155 inverted, and two h158 inverted clones. TheBCL11A null clone had a 216 bp interstitial deletion of exon 2, preventing bindingof the RT–qPCR primers. All gene expression data reported from these clonesrepresents the mean of at least three technical replicates.Design and synthesis of human and mouse lentiviral sgRNA libraries. Every20-mer sequence upstream of an NGG or NAG PAM sequence on the plus orminus strand was identified for both the human and mouse orthologous 155,158 and 162 DHS as well as BCL11A/Bcl11a exon 2 (Fig. 1 and Extended DataFigs 2, 6). Relative to the human hg19 reference genome, a reference was usedwith the following substitutions to approximate a common low-HbF-associatedhaplotype: rs1427407-G, rs1896293-T, rs6706648-T, rs6738440-G, rs7606173-C.The mouse orthologous sequences to each of the human DHSs were defined byusing the liftOver tool of UCSC Genome Browser as previously described28. Eachof the sgRNA oligos were synthesized as previously described25,51,52 and clonedusing a Gibson Assembly master mix (New England Biolabs) into lentiGuide-Puro (Addgene plasmid ID 52963) which had been BsmBI digested, gel purified,and dephosphorylated. Gibson Assembly products were transformed to electro-competent cells (E. cloni, Lucigen). Sufficient colonies were isolated to ensure,903 library coverage for both human and mouse libraries. Plasmid librarieswere deep sequenced to 5333 and 8133 coverage for human and mouse libraries,respectively, to confirm representation.
To produce lentivirus, HEK293T cells were cultured with Dulbecco’s ModifiedEagle’s Medium (DMEM) (Life Technologies) supplemented with 10% fetalbovine serum (FBS) (Omega Scientific) and 2% penicillin-streptomycin (LifeTechnologies) in 15 cm tissue culture treated Petri dishes. HEK293T cells weretransfected at 80% confluence in 12 ml of media with 13.3mg psPAX2, 6.7mgVSV-G, and 20 mg of the lentiviral construct plasmid of interest using 180mg oflinear polyethylenimine (Polysciences). Medium was changed 16–24 h aftertransfection. Lentiviral supernatant was collected at 48 and 72 h post-transfectionand subsequently concentrated by ultracentrifugation (24,000 rpm for 2 h at 4 uCwith Beckman Coulter SW 32 Ti rotor).
Tiled pooled CRISPR-Cas9 screen for in situ functional mapping the humanBCL11A erythroid enhancer. HUDEP-2 cells with stable Cas9 expression weretransduced at low multiplicity with the human sgRNA library lentivirus poolwhile in expansion medium. Control transductions were performed to ensuretransduction rate did not exceed 50%. Cell numbers were maintained throughoutthe experiment at levels adequate to exceed 1,0003 representation of the library.10 mg ml21 blasticidin (Sigma) and 1 mg ml21 puromycin (Sigma) were added24 h after transduction to select for lentiviral library integrants in cells withCas9. Cells were cultured in expansion media for one week followed by differ-entiation media for an additional week.
Intracellular staining was performed by fixing cells with 0.05% glutaraldehyde(grade II) (Sigma) for 10 min at room temperature. Cells were centrifuged for5 min at 600g and then resuspended in 0.1% Triton X-100 (Life Technologies) for5 min at room temperature for permeabilization. Triton X-100 was diluted withphosphate buffered saline (PBS) with 0.1% BSA and then centrifuged at 600g for15 min. Cells were stained with anti-human antibodies for HbF (clone HbF-1with FITC or APC conjugation; Life Technologies) and b-haemoglobin antibody(clone 37-8 with PerCP-Cy5 or PE conjugation; Santa Cruz) for 20 min in thedark. Cells were washed to remove unbound antibody before FACS analysis.0.2mg HbF and 2mg of adult haemoglobin (HbA) (b-haemoglobin) antibodieswere used per 5 million cells. Control cells exposed to a non-targeting sgRNAsample and BCL11A exon 2 were used as negative and positive controls, respect-ively, to establish flow cytometry conditions. Populations of cells with the top andbottom 10% of expression of HbF were sorted by FACS.
After sorting the HbF-high and HbF-low pools, library preparation and deepsequencing was performed as previously described25. Briefly, genomic DNA wasextracted using the Qiagen Blood and Tissue kit. Herculase PCR reaction(Agilent) using lentiGuide-Puro specific primers (59-AATGGACTATCATATGCTTACCGTAACTTGAAAGTATTTCG-39 and 59-CTTTAGTTTGTATGTCTGTTGCTATTATGTCTACTATTCTTTCCC-39) including a handlesequence was performed as follows: Herculase II reaction buffer (13), forwardand reverse primers (0.5mM each), dimethyl sulfoxide (DMSO) (8%), deoxynu-cleotide triphosphates (dNTPs) (0.25 mM each), Herculase II Fusion DNAPolymerase (0.5 reactions) using the following cycling conditions: 95 uC for2 min; 20 cycles of 95 uC for 15 s, 60 uC for 20 s, 72 uC for 30 s; 72 uC for 5 min.Multiple reactions of no more than 200 ng each were used to amplify from 6.6mggDNA (,13106 cell genomes) per pool. Samples were subjected to a second PCRusing handle-specific primers25 to add adaptors and indexes to each sample usingthe following conditions: Herculase II reaction buffer (13), forward and reverseprimers (0.5 mM each), dNTPs (0.25 mM each), Herculase II Fusion DNAPolymerase (0.5 reactions) with the following cycling conditions: 95 uC for2 min; 25 cycles of 95 uC for 15 s, 60 uC for 20 s, 72 uC for 30 s; 72 uC for 5 min.PCR products were run on an agarose gel and the band of expected size was gelpurified. Illumina MiSeq 150 bp paired end sequencing was performed.
sgRNA sequences present in the plasmid pool as well as in the HbF-high andHbF-low pools were enumerated. Guide sequences were mapped to the guidescomprising the sgRNA library without allowing mismatches. Total reads werenormalized to library sequencing depth. Cellular dropout score was determinedby calculating (1) the ratio of normalized reads in the cells at end of experiment(average of reads in the HbF-high and HbF-low pools) to reads in the plasmidpool; (2) log2 transformation; and (3) median of biological replicates. HbF enrich-ment score was determined by calculating (1) the ratio of normalized reads in theHbF-high compared to reads in the HbF-low pools; (2) log2 transformation; and(3) median of biological replicates. After exclusion of sgRNAs with dropoutscores ,223 and NAG PAM sgRNAs, a quantile–quantile plot was made witha line fitted through the first and third quantiles using R software. HbF enrich-ment scores and cellular dropout scores were compared by Spearman rank cor-relation. sgRNA sequences were mapped to the human genome (hg19) withcleavage positions set to between positions 17 and 18 given PAM positions21–23. For visual comparisons to targeting sgRNAs, non-targeting sgRNAs werepseudomapped each separated by 5 bp.Validation in primary human CD341 HSPCs. Primary human CD341 HSPCsfrom G-CSF mobilized healthy adult donors were obtained from the Center ofExcellence in Molecular Hematology at the Fred Hutchinson Cancer ResearchCenter, Seattle, Washington. CD341 HSPCs were subject to erythroid differenti-ation liquid culture as previously described53. Briefly, HSPCs were thawed on day0 into erythroid differentiation medium (EDM) consisting of IMDM supplemen-ted with 330mg ml21 holo-human transferrin, 10mg ml21 recombinant humaninsulin, 2 IU ml21 heparin, 5% human solvent detergent pooled plasma AB,3 IU ml21 erythropoietin, 1% L-glutamine, and 2% penicillin/streptomycin.During days 0–7 of culture, EDM was further supplemented with 1026 M hydro-cortisone (Sigma), 100 ng ml21 human SCF, and 5 ng ml21 human IL-3 (R&D).
ARTICLE RESEARCH
G2015 Macmillan Publishers Limited. All rights reserved

During days 7–11 of culture, EDM was supplemented with 100 ng ml21 humanSCF only. During days 11–18 of culture, EDM had no additional supplements.
HSPCs were transduced with lentiCas9-Blast (Addgene plasmid ID 52962)24 h after thawing in the presence of 10 mM 16,16-dimethylprostaglandin E2(PGE2; Cayman Chemical). At 48 h after thawing, medium was changed andcells were transduced with lentiGuide-Puro or lentiGuide-Crimson cloned withrelevant sgRNA sequence in the presence of 10mM PGE2. Three independenttransductions were performed per sgRNA. At 72 h after thawing, medium waschanged and HSPCs were selected with 10mg ml21 blasticidin and 1 mg ml21
puromycin or 10 mg ml21 blasticidin followed by sorting for lentiGuide-Crimson1 cells on day 16 of culture. Blasticidin and/or puromycin selectionoccurred from days 3 to 8 of culture.
Differentiation was assessed on day 18 of culture using anti-human antibodiesagainst the transferrin receptor (CD71) (Clone OKT9 with FITC conjugation;eBioscience) and glycophorin A (CD235a) (Clone HIR2 with PE conjugation;eBioscience). Enucleation was assessed using 2 mg ml21 of the cell-permeableDNA dye Hoescht 33342 (Life Technologies). CD235a1Hoescht 333422 cellswere determined to be enucleated erythroid cells. Cells were intracellularlystained for HbF and HbA on day 18 of culture as described above. 50,000–100,000 cells were centrifuged onto microscope slides at 350 rpm for 4 min.Slides were stained with Harleco May–Grunwald stain (Millipore) for 2 min,Giemsa stain (Sigma) for 12 min, and two water washes for 30 s each. Slides wereair dried and then coverslipped using Fisher Chemical Permount MountingMedium (Fisher). RNA isolation and RT–qPCR was performed as above. Geneexpression was normalized to that of GAPDH. All gene expression data representthe mean of at least three technical replicates.
PCR primers were designed to amplify the genomic cleavage site for a givensgRNA. Resulting PCR products were subjected to Sanger sequencing. Sequencingtraces were used for editing quantification using a previously described publicallyavailable tool54.Computational analysis. Human erythroid H3K27ac ChIP-seq was obtainedfrom Xu et al.7 and mouse erythroid H3K27ac ChIP-seq was obtained fromKowalczyk et al.55 and Dogan et al.56. We uniformly processed all the data setsusing the same pipeline with the same criteria to call super-enhancers. Specifically,we started from raw reads and realigned each data set with Bowtie2 with the defaultparameters. We then removed duplicate reads with the Picard Suite. To call thepeaks we used MACS2 in the narrow mode. Finally, to call the super-enhancers weused the ROSE algorithm with the default parameters10. Using these settings, peakscloser than 12.5 kb are stitched together and then ranked based on the H3K27acintensity. To assign super-enhancers to genes we used again ROSE with defaultsettings. In particular, the tool reports three categories of genes for each super-enhancer: (1) overlapping genes (genes for which the gene body region overlaps asuper-enhancer); (2) proximal genes (genes close to a super-enhancer considering awindow of 50 kb); (3) closest gene (closest gene considering its TSS and the centre ofthe super-enhancer). To generate a Venn diagram of genes for super-enhancer datasets, we used the union of these three gene categories.
HMM segmentation was performed to automatically segment the enrichmentscore signals into enhancer regions with active, repressive and neutral effect. Wedesigned a HMM with 3 states using the GHMM package (http://ghmm.source-forge.net/). To learn the HMM parameters we used the Baum–Welch algorithm.To find the best segmentation for each region we used the Viterbi algorithm. Theemission probability for each state was modelled as a Gaussian distribution andall the possible transitions between states were allowed as shown in ExtendedData Fig. 4a. Since the signal was not obtained with a constant genomic resolu-tion, we interpolated and smoothed the signal using a Gaussian kernel over 12 bpand applied the HMM to the smoothed signal. To set the initial parameters, weused the 1%, 50% and 99% percentile of the smoothed signal for the prior of themeans of the repressive, neutral and active states, respectively, while the prior forthe standard deviation was set to 0.001 for all the three states.
Motif analysis was performed to evaluate the human and mouse enhancerregions for potential binding sites for known transcription factors. We used theFIMO software57 with a P-value threshold of ,1024. For each region we extractedsequences using the hg19 and mm9 assemblies respectively for human andmouse. The motif database was the latest version of the JASPAR database58.
Deep sequencing paired-end reads of genomic amplicons from genome editingtarget sites were first filtered for reads with PHRED quality score ,30, mergedwith the FLASH (Fast Length Adjustment of SHort reads) software, and subse-quently aligned to a reference amplicon using the needle aligner from theEMBOSS suite (http://emboss.sourceforge.net/) to quantify insertions and dele-tions. Per nucleotide frequency of deletion of a position, insertion directly adja-cent to the position, or no mutation at the position was quantitated usingCRISPResso (https://github.com/lucapinello/CRISPResso).
Pooled CRISPR-Cas9 screen for high-resolution functional mapping ofmouse Bcl11a enhancer. Murine erythroleukaemia (MEL, MEL-745A cl.DS19) cells were cultured in DMEM supplemented with 10% FBS, 1%L-glutamine, and 2% penicillin/streptomycin as previously described28,36. Celllines tested negative for mycoplasma contamination. ey:mCherry reporter MELcells with stable Cas9 expression were transduced at low multiplicity with themouse sgRNA library lentivirus pool (see Supplementary Information andExtended Data Fig. 6 for additional technical details). Control transductions wereperformed to ensure that the transduction rate did not exceed 50%. Cell numberswere maintained throughout the experiment at levels adequate to exceed 1,0003
representation of the library. 10 mg ml21 blasticidin and 1mg ml21 puromycinwere added 24 h after transduction to select for lentiviral library integrants in cellswith Cas9. Subsequently cells were cultured for 2 weeks. The top and bottom 5%of ey-mCherry-expressing cells exposed to the library were sorted by FACS. Anon-targeting sgRNA sample was used as a negative control and Bcl11a exon 2 asa positive control to establish flow cytometry conditions. After sorting, librarypreparation and deep sequencing were performed as described for the humanlibrary25.
sgRNA sequences present in the Hbb-ey:mCherry-high and Hbb-ey:mCherry-low pools were enumerated. Cellular dropout and ey enrichment scores werecalculated analogously to the human screen. sgRNA sequences were then mappedto the mouse genome (mm9).Generation of genomic deletions in MEL cells. Deletions in MEL cells weregenerated using two sgRNA as previously described36. Briefly, sgRNA sequenceswere cloned into pX330 (Addgene plasmid ID 42230) using a Golden Gateassembly cloning strategy (Supplementary Table 1). MEL cells were electropo-rated with 5 mg of each pX330-sgRNA plasmid and 0.5 mg pmax–GFP (Lonza) inBTX electroporation buffer using a BTX electroporator (Harvard Apparatus).Approximately 48 h post-electroporation, the top 1–3% of GFP1cells were sortedand plated clonally at limiting dilution. Clones were allowed to grow for 7–10days. Clones were screened for deletion by conventional PCR using the samestrategy as with the HUDEP-2 cells (Supplementary Tables 2 and 4). Inversionclones were identified by PCR as previously described36 (Supplementary Table 3).Generation of genomic deletions in mouse embryonic stem cells (mESCs).mESCs were maintained on irradiated mouse embryonic fibroblasts (GlobalStem)and cultured in high glucose DMEM supplemented with 15% FBS, 1% L-glutamine,2% penicillin/streptomycin (Life Technologies), 100mM non-essential amino acids(Life Technologies), 1% nucleosides (Sigma), 1024 M b-mercaptoethanol (Sigma),and 103 U ml21 leukaemia inhibitory factor (Millipore). Cells were passaged using0.25% trypsin (Life Technologies).
The Bcl11a 162 deletion mice were derived from CRISPR-Cas9 modified CJ9ES cells. Using Amaxa ES Cell transfection reagent (Lonza), two million mESCswere electroporated with 2 mg of each pX330 plasmid vector containing indi-vidual target sequences flanking the 162 site along with 0.5mg of a GFP plasmid.After 48 h, the top 5% of GFP expressing cells were sorted, plated on irradiatedfibroblasts and maintained. Individual ES cell colonies were then picked andscreened for biallelic deletion using the same strategy as HUDEP-2 and MELcells36. DNA for screening CRISPR-Cas9 modified clones was obtained fromgelatin adapted ES cell clones to avoid genomic contamination from the fibro-blasts. Correctly targeted clones with greater than 80% normal karyotype wereused to generate mice. Clones were injected into embryonic day 3.5 (E3.5) C57BL/6 blastocysts and implanted into pseudo-pregnant females.
The b-YAC mouse line (A20), previously described as containing a transgeneencompassing ,150 kb of the human b-globin locus43, was used to analysehuman globin expression. The mouse line was maintained in a hemizygous stateand bred with Bcl11a 162 deletion mice. Sufficient matings were established toensure adequate homozygotes for analysis.Mouse cell and tissue analysis. The experiments were not randomized and theinvestigators were not blinded to allocation during experiments and outcomeassessment. For developmental haematopoiesis, fetal liver cells were taken atE12.5, E14.5, E16.5 and E18.5 and mechanically dissociated to form single cellsuspensions from which RNA was extracted using the RNeasy Plus Mini Kit(Qiagen) and analysed. At E16.5, fetal livers were also stained with CD19-PerCP-Cy5.5 (Clone 1D3; eBioscience), B220-APC (RA3-6B2; Biolegend), CD71-PE(Clone C2; BD Biosciences), and Ter119-FITC (Clone Ter119; BD Biosciences)to isolate B cells (B2201CD191) and erythroid cells (Ter1191CD711) by FACSfor RNA extraction and Bcl11a quantification. Additionally, flow cytometry wasused to analyse fetal liver from E18.5 embryos. Single cell suspensions were stainedwith IgM-FITC (Clone Il-41; eBioscience), CD19-PerCP-Cy5.5, (Clone 1D3;eBioscience), CD43-PE (Clone S7; eBioscience), AA4.1-PE-Cy7 (Clone AA4.1;BD Biosciences), B220-APC, (RA3-6B2; Biolegend), and DAPI (Invitrogen). Foradult haematopoietic assays, peripheral blood was obtained from the tail vein of4-week-old male and female mice. Blood was collected in EDTA-coated tubes, red
RESEARCH ARTICLE
G2015 Macmillan Publishers Limited. All rights reserved

cells removed by 2% dextran (Sigma), residual red cells lysed with ammoniumchloride solution (Stem Cell Technologies) and stained with the followinganti-mouse antibodies: CD3e-FITC (Clone 145-2C11; Biolegend), CD19-PerCP-Cy5.5 (Clone 1D3; eBioscience), CD71-PE (Clone C2; BD Biosciences),NK1.1-PE-Cy5 (Clone PK136; Biolegend), Ter119-APC (Clone TER-119;Biolegend), Gr-1-eF450 (Clone RB6-8C5; eBioscience), B220-BV605 (RA3-6B2; Biolegend), Mac-1-BV510 (Clone M1/70; Biolegend), and 7-AAD (BDBiosciences). Fetal brain analysis was conducted on whole brains from E16.5mouse embryos on ice-cold PBS. Tissue was directly lysed into the RLT plusbuffer (Qiagen) and total RNA extracted according to manufacturer’s instruc-tions provided in the RNeasy Plus Mini Kit. RT-qPCR was performed as above,with gene expression normalized to Gapdh. All gene expression data represent themean of at least three technical replicates. All animal experiments were conductedunder the approval of the local Institutional Animal Care and Use Committee.Cloning lentiCas9-Venus. Venus template59 was PCR amplified to add BamHI(59) and EcoRI (39) restriction sites (lowercase font) for cloning purposesusing the following conditions: KOD buffer (13), MgSO4 (1.5 mM), dNTPs(0.2 mM each), forward primer (0.3 mM; [GGCCGGCCggatccGGCGCAACAAACTTCTCTCTGCTGAAACAAGCCGGAGATGTCGAAGAGAATCCTGGACCGATGGTGAGCAAGGGCGAGGA), reverse primer (0.3mM; GGCCGGCCgaattcTTACTTGTACAGCTCGTCCA), and KOD Hot Start DNA Polymerase(0.02 Uml21) (Millipore). KOD PCR reaction used the following cycling condi-tions: 95 uC for 2 min; 50 cycles of 95 uC for 20 s, 60 uC for 20 s, and 70 uC for 30 s;60 uC for 5 min. PCR products were purified (QIAquick PCR Purification Kit,Qiagen) and blunt end cloned with Zero Blunt PCR cloning kit (Invitrogen).PCR-blunt cloned products and lentiCas9-Blast (Addgene plasmid ID 52962)were separately digested with BamHI-HF (New England Biolabs) and EcoRI-HF (New England Biolabs) in 13 Buffer CutSmart at 37 uC (New EnglandBiolabs). Digest of lentiCas9-Blast was performed to remove the blasticidin cas-sette. Then digested PCR product was ligated into the lentiCas9 backbone.Cloning lentiGuide-Crimson. E2-Crimson template (Clontech) was PCR amp-lified to add BsiWI (59) and MluI (39) restriction sites for cloning purposes usingthe following conditions: KOD buffer (13), MgSO4 (1.5 mM), dNTPs (0.2 mMeach), forward primer (0.3mM; GGCCGGCCCGTACGcgtacgGCCACCATGGATAGCACTGAGAACGTCATCAAGCCCTT), reverse primer (0.3mM; GGCCGGCCacgcgtCTACTGGAACAGGTGGTGGCGGGCCT), and KOD HotStart DNA Polymerase (0.02 U ml21). KOD PCR reaction used the followingcycling conditions: 95 uC for 2 min; 50 cycles of 95 uC for 20 s, 60 uC for 20 s,and 70 uC for 30 s; 60 uC for 5 min. PCR products were purified (QIAquick PCRPurification Kit) and cloned with Zero Blunt PCR cloning kit. Cloned productsand lentiGuide-puro were separately digested with BsiWI (New England Biolabs)and MluI (New England Biolabs) in 13 buffer 3.1 at 37 uC (New EnglandBiolabs). Digest of lentiGuide-Puro (Addgene plasmid ID 52963) was performedto remove the puromycin cassette. Then digested PCR product was ligated intothe lentiGuide backbone.Cloning sgRNAs. lentiGuide-Puro (Addgene plasmid ID 52963) was digestedwith BsmBI in 13 buffer 3.1 at 55 uC (New England Biolabs) for linearization.One unit of TSAP thermosensitive alkaline phosphatase (Promega) was added for1 h at 37 uC to dephosphorylate the linearized lentiGuide and then TSAP was heatinactivated at 74 uC for 15 min. Linearized and dephosphorylated lentiGuide wasrun on an agarose gel and gel purified. sgRNA-specifying oligos were phosphory-lated and annealed using the following conditions: sgRNA sequence oligo(10mM); sgRNA sequence reverse complement oligo (10mM); T4 ligation buffer(13) (New England Biolabs); and T4 polynucleotide kinase (5 units) (NewEngland Biolabs) with the following temperature conditions: 37 uC for 30 min;95 uC for 5 min; and then ramp down to 25 uC at 5 uC min21. Annealed oligoswere ligated into lentiGuide in a 1:3 ratio (vector:insert) using T4 ligation buffer(13) and T4 DNA Ligase (750 units) (New England Biolabs). Plasmids wereverified by sequencing using a U6 promoter forward primer CGTAACTTGAAAGTATTTCGATTTCTTGGC.
sgRNA-specifying oligos using sgRNA sequences from the screen library (seeSource Data associated with Figs 2 and 5) were obtained and cloned as describedinto either lentiGuide-Puro or lentiGuide-Crimson. sgRNA constructs were usedto produce lentivirus and transduce HUDEP-2 with stable Cas9 expression. Bulkcultures were incubated for 7–10 days with 10mg ml21 blasticidin and 1 mg ml21
puromycin selection to allow for editing. Then bulk cultures were plated clonally
at limiting dilution. Clones were allowed to grow for approximately 14 days andthen genomic DNA was extracted using 50 ml QuickExtract DNA ExtractionSolution per well.lentiTandemGuide cloning. lentiGuide-sgRNA1 was digested with PspXI andXmaI at 37 uC for 4 h (New England Biolabs). Digests were run on an agarose geland gel purified. lentiGuide-sgRNA2 was linearized using NotI (New EnglandBiolabs). The hU6 promoter and sgRNA chimaeric backbone for lentiGuide-sgRNA2 was PCR amplified using the following conditions: KOD buffer (13),MgSO4 (1.5 mM), dNTPs (0.2 mM each), forward primer (0.3 mM; GGCCGGCCgctcgaggGAGGGCCTATTTCC), reverse primer (0.3 mM; CCGGCCGGcccgggTTGTGGATGAATACTGCCATTT), and KOD Hot Start DNA Polymerase(0.02 Uml21) (Millipore). KOD PCR reaction used the following cycling condi-tions: 95 uC for 2 min; 50 cycles of 95 uC for 20 s, 60 uC for 20 s, and 70 uC for 30 s;60 uC for 5 min. PCR products were purified (QIAquick PCR Purification Kit),blunt-ended cloned with Zero Blunt PCR cloning kit, transformed, and plated.Colonies were screened by digesting minipreps with EcoRI. Mini-preps were thendigested with PspXI and XmaI as described above followed by PCR purification.After PCR purification, sgRNA2 was ligated into digested lentiGuide-sgRNA1.Sequence was verified with following primers: GGAGGCTTGGTAGGTTTAAGAA and CCAATTCCCACTCCTTTCAA.Generation of HUDEP-2 with stable Cas9. lentiCas9-Blast (Addgene plasmidID 52962) or lentiCas9-Venus were produced as described above and used totransduce HUDEP-2 cells. Transduced cells were selected with 10mg ml21 blas-ticidin or Venus1 cells were sorted. Functional Cas9 was confirmed using thepXPR-011 (Addgene plasmid ID 59702) GFP reporter assay as previouslydescribed60.Generation of ey:mCherry reporter MEL cells. A reporter MEL line in whichmCherry was knocked into the Hbb-y locus was created (Extended Data Fig. 6c).Briefly, a TALEN-induced DSB was created adjacent to the Hbb-y transcriptionalstart site. A targeting vector with mCherry and a neomycin cassette wasintroduced through homology-directed repair. Homology arms includedmm9 sequences from Chr7:111,001,667–111,002,675 and Chr7:111,000,661–111,001,666. Cre-mediated recombination was used to remove the neomycincassette. Long-range PCR spanning each homology arm was used to ensureappropriate targeted integration. Cells were tested upon Bcl11a disruption byRT–qPCR and flow cytometry to confirm expected effects on ey:mCherry dere-pression. Subsequently, CRISPR-Cas9 was used as described above to producecells with monoallelic composite enhancer deletion to maximize screening sens-itivity for enhancer disruption.Generation of MEL cells with stable Cas9 expression. lentiCas9-Blast (Addgeneplasmid ID 52962) lentivirus was produced as described above and used totransduce MEL cells. Transduced cells were selected with 10 mg ml21 blasticidin.Functional Cas9 was confirmed using the pXPR-011 (Addgene plasmid ID59702) GFP reporter assay as previously described60.
51. Sanjana, N. E., Shalem,O. & Zhang, F. Improved vectors and genome-wide librariesfor CRISPR screening. Nature Methods 11, 783–784 (2014).
52. Chen, S.et al. Genome-wideCRISPRscreen ina mousemodel of tumorgrowth andmetastasis. Cell 160, 1246–1260 (2015).
53. Giarratana, M. et al. Proof of principle for transfusion of in vitro generated red bloodcells. Blood 118, 5071–5079 (2011).
54. Brinkman, E. K., Chen, T., Amendola, M. & van Steensel, B. Easy quantitativeassessment of genome editing by sequence trace decomposition. Nucleic AcidsRes. 42, e168 (2014).
55. Kowalczyk, M. S. et al. Intragenic enhancers act as alternative promoters. Mol. Cell45, 447–458 (2012).
56. Dogan, N. et al. Occupancy by key transcription factors is a more accuratepredictor of enhancer activity than histone modifications or chromatinaccessibility. Epigenetics Chromatin 8, 16 (2015).
57. Grant, C. E., Bailey, T. L. & Noble, W. S. FIMO: scanning for occurrences of a givenmotif. Bioinformatics 27, 1017–1018 (2011).
58. Mathelier, A. et al. JASPAR 2014: An extensively expanded and updated open-access database of transcription factor binding profiles. Nucleic Acids Res. 42,142–147 (2014).
59. Weber, K., Bartsch, U., Stocking, C. & Fehse, B. A multicolor panel of novel lentiviral‘gene ontology’ (LeGO) vectors for functional gene analysis. Mol. Ther. 16,698–706 (2008).
60. Doench, J. G. et al. Rational design of highly active sgRNAs for CRISPR-Cas9-mediated gene inactivation. Nature Biotechnol. 32, 1262–1267 (2014).
ARTICLE RESEARCH
G2015 Macmillan Publishers Limited. All rights reserved

a b
Ranked enhancers
BCL11A#100/503
503 super-enhancers,1138 genes
H3K
27ac
sig
nal i
nten
sity
00
50K
100K
150K
4000 8000
Chr2: 50 kb60,700,000
BCL11A
Trait-associated haplotype rs14274073 DHSs
Composite enhancerSuper-enhancer
H3K27ac
rs7606173
DNase I
Extended Data Figure 1 | Human BCL11A locus. a, Schematic of the humanBCL11A locus (hg19, transcription from right to left) with erythroid chromatinmarks and trait-associated haplotype denoted, and composite enhancer as
previously defined28. b, Ranked enhancers in primary human adult erythroidprecursors by H3K27ac signal intensity, with super-enhancers shaded, andsuper-enhancer-associated genes indicated.
RESEARCH ARTICLE
G2015 Macmillan Publishers Limited. All rights reserved

Minus strandb
0 25 50 75 1000
20
40
200
Gap between adjacent cleavages (bp)
sgR
NA
(no.
)
Median (5 bp)90 percentile (15 bp)
c
e
Nor
mal
ized
cou
nt (%
)
0
20
40
60
100
80
103102 104
HbF level (MFI)105 106
7.02% 4.11%2.57% 22.2%
NontargetingExon 2
d
sgR
NA
(no.
)
0 1000 20000
500
1000
1500
Sequence reads
k
Relative distance to TSS (kb)7 8 55 56 58 59 62 63
Exon 2Nontargeting DHS +55 DHS +58 DHS +62
-12
-8
-4
0
4
Dro
pout
(log
2)
Repetitive elements
f
1
6
5
4
3
2
2 3
Rep
licat
e
Replicate4 5
a
****
ns
Non-targeting
Exon 2NGG
Exon 2NAG
-2
0
2
4
HbF
enr
ichm
ent (
log 2)
h
HbF level (MFI)
0
30
60
90
120
Cou
nt
103102 104 105 106
10.3% 10.1%
g
i
1 16 256 40961
16
256
4096
Plasmid1 16 256 4096
1
16
256
4096
Cel
ls
HbF low
HbF
hig
h
Nontargeting Exon 2 DHS +55 DHS +58 DHS +62j
DHS +55 DHS +58 DHS +62
-3 0 3-3
0
3
Sam
ple
-3 0 3Theoretical
-3 0 3
Distance to BCL11A TSS (bp)
8500
56250
59500
63500
Exon 2
DHS +55
DHS +58
DHS +62
1 kb Plus strand
NAG
NAGNGG
NGG
NAGNGG
NAGNGG
1,338
88 (6.6)120 (9.0) n (%)
425 (31.8)361 (27.0)344 (25.7)
636 (47.5)
120 (9.0)
1,338
582 (43.5)
n (%)
DHS +55 (1,283 bp)DHS +58 (1,264 bp)DHS +62 (1,370 bp)
Exon 2 (330 bp)
Nontargeting
Total
Total
NGG PAMNAG PAM
Nontargeting
ARTICLE RESEARCH
G2015 Macmillan Publishers Limited. All rights reserved

Extended Data Figure 2 | Tiled pooled in situ CRISPR-Cas9 BCL11Aenhancer screen. a, Distribution of NGG and NAG PAM sgRNAs mapped togenomic cleavage position. The vertical lines represent cleavage sites forsgRNAs mapped to plus and minus strands. b, Gap distance between adjacentgenomic cleavage position for NAG PAM sgRNAs. c, Library compositionby target sequence and PAM restriction. d, Representation of both NGG andNAG sgRNA (1,338 sgRNAs in total) within the plasmid pool by deepsequencing. The median was 718 normalized reads and the 10th and 90thpercentiles (indicated by the vertical dotted lines) ranged from 337 to 1,205normalized reads. e, HbF distribution in HUDEP-2 cells transduced with Cas9and individual sgRNAs, either non-targeting or targeting BCL11A exon 2.
f, HbF enrichment scores of NGG sgRNAs in six biological replicates. g, Sort oflibrary-transduced cells into HbF-high and HbF-low pools. h, ControlsgRNA enrichment. Boxes demonstrate 25th, median, and 75th percentilesand whiskers minimum and maximum values. ****P , 0.0001, NS, non-significant. i, NGG sgRNA representation in plasmid pool and cells atconclusion of experiment (left), and in HbF-high and HbF-low pools (right),with dotted lines at x 5 y and x 5 8y. j, Quantile–quantile plots of NGG sgRNAenrichment scores. k, Cellular dropout scores of NGG sgRNAs relative togenomic cleavage position and repetitive elements. Non-targeting sgRNAspseudo-mapped with 5-bp spacing.
RESEARCH ARTICLE
G2015 Macmillan Publishers Limited. All rights reserved

a
0
10
20
30
Exon2
1 2 00880249 1438 1448 1449 1450 0068 0070 1458 0187 0188 1617 1619 1620 1621 1622 1623 1624 1626 1629 0210 1833
Non-targeting DHS +55 DHS +58 DHS +62
HbF
+ cel
ls (%
)
cNontargeting BCL11A exon 2
(0249)DHS +58
(1621)
CD
71
CD235a
0.87
1.89
87.4
9.84
0.78
3.04
84.7
11.4
0.74 85.6
10.92.80
CD235a
Hoe
chst
3334
2
86.9
11.6
1.43
0.066
89.5
9.39
1.14
0
88.8
10.0
1.19
0
0 10 20 30-2
-1
0
1
2
3
HbF+ cells (%)
Scre
en s
core
(HbF
enr
ichm
ent)
r = 0.816p < 0.0001
b
Extended Data Figure 3 | Validation of enhancer screen. a, HbF1 fraction inHUDEP-2 cells transduced in arrayed format with 24 sgRNAs from all 5mapping categories with enrichment scores ranging from the highest to thelowest in the screen. b, Correlation between HbF enrichment score from pooledsgRNA screen and HbF1 fraction by arrayed validation of individual
sgRNAs in HUDEP-2 cells. c, Erythroid differentiation of primary humanerythroid precursors evaluated by CD71 and CD235a surface markers,enucleation frequency (CD235a1 Hoescht333422), and morphology byMay–Grunwald Giemsa staining.
ARTICLE RESEARCH
G2015 Macmillan Publishers Limited. All rights reserved
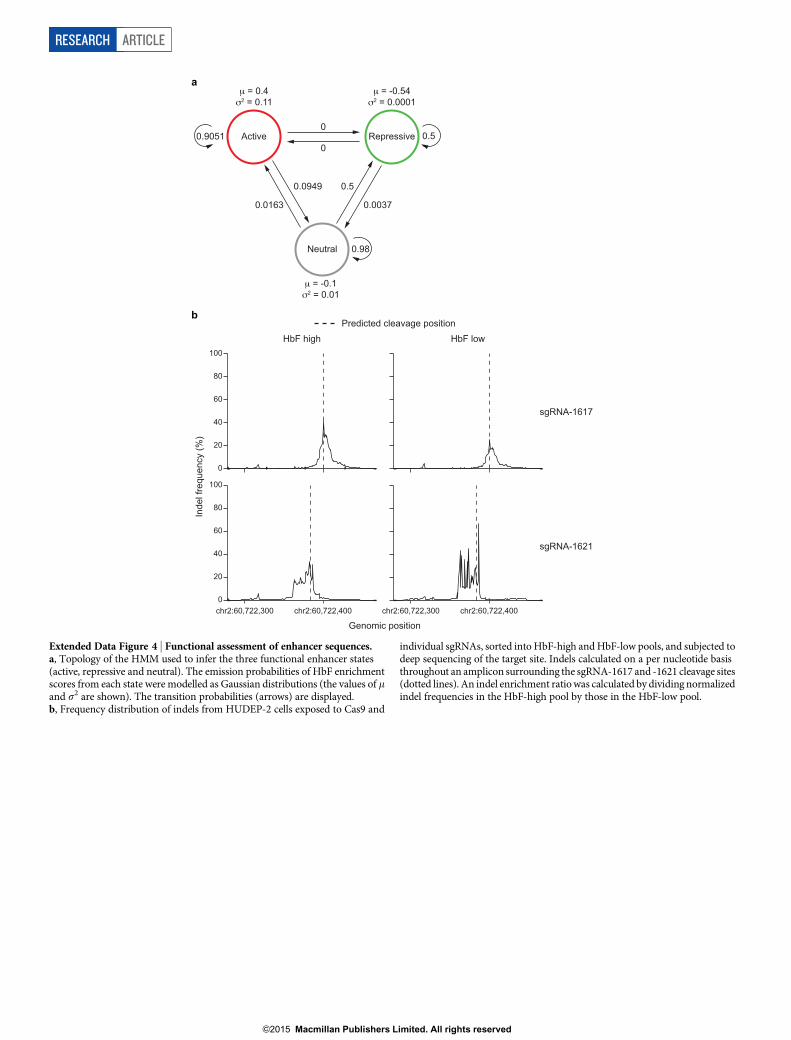
a
b
sgRNA-1617
sgRNA-1621
HbF high100
80
60
40
20
0
Inde
l fre
quen
cy (%
)
chr2:60,722,300 chr2:60,722,400
Genomic positionchr2:60,722,300 chr2:60,722,400
100
80
60
40
20
0
HbF lowPredicted cleavage position
0.9051 0.5
0.98
0.00370.0163
0
0
0.50.0949
Repressive
Neutral
Active
μ = 0.4σ2 = 0.11
μ = -0.54σ2 = 0.0001
μ = -0.1σ2 = 0.01
Extended Data Figure 4 | Functional assessment of enhancer sequences.a, Topology of the HMM used to infer the three functional enhancer states(active, repressive and neutral). The emission probabilities of HbF enrichmentscores from each state were modelled as Gaussian distributions (the values of mand s2 are shown). The transition probabilities (arrows) are displayed.b, Frequency distribution of indels from HUDEP-2 cells exposed to Cas9 and
individual sgRNAs, sorted into HbF-high and HbF-low pools, and subjected todeep sequencing of the target site. Indels calculated on a per nucleotide basisthroughout an amplicon surrounding the sgRNA-1617 and -1621 cleavage sites(dotted lines). An indel enrichment ratio was calculated by dividing normalizedindel frequencies in the HbF-high pool by those in the HbF-low pool.
RESEARCH ARTICLE
G2015 Macmillan Publishers Limited. All rights reserved

Chr2:--->
100 bp 60,722,350AAATAAAATCCAATTCTCCATCACCAAGAGAGCCTTCCGAAAGAGGCCCCCCTGGGCAAACGGCCACCGATGGAGAGGTCTGCCAGTCCTCTTCTACCCCACCCACGCCCCCACCCTAATCAGAGGCCAAACCCTTCCTGGAGCCTGTGATAAAAGCAACTGTTAGCTTGCACTAGACTAGCTTCAAAGTTGTATTGACC
Chr2:--->
rs7606173
100 bp 60,725,500CCAGCAGGGCCTGTCAGAAGAGGCCCTGGACACTGAAGGCTGGGCACAGCCTTGGGGACCGCTCACAGGACATGCAGCAGTGTGTGCCGACAACTCCCTACCGCGACCCCTATCAGTGCCGACCAAGCACACAAGATGCACACCCAGGCTGGGCTGGACAGAGGGGTCCCACAAGATCACAGGGTGTGCCCTGAGAAGGT
GATA2Zfx
Rfx1RFX2 RFX5 TAL1::GATA1 Klf1 Klf1
TFAP2ATFAP2CEBF1
GapsHumanChimpGorilla
RhesusBaboon
MarmosetBushbaby
Chinese_tree_shrewSquirrelMouse
RatNaked_mole-rat
RabbitPig
CowDog
ElephantOpossum
ChickenZebrafish
2
0
1
-1
0
b
a
cChr2:
--->
rs1427407
100 bp 60,718,100A CACAAACATTTCCCTTCTGATATCTACTTGAACTTTCAGATAAAAAAAAAAAAGCAAGTTGCAGTAACATGTTATGCTACACAAAGATTAGCATGAATATCCACCCTCTTTAAACAGCCACCCCACACCCTGGAGAAGAGCAAATGTGAAGTTTATGTGCCAACCAGACTGTGCGCCAGG
RUNX1Klf1
GapsHumanChimpGorilla
RhesusBaboon
MarmosetBushbaby
Chinese_tree_shrewSquirrelMouse
RatNaked_mole-rat
RabbitPig
CowDog
ElephantOpossum
ChickenZebrafish
Mouse screen top hit orthologous cleavage position
TTTTAACCTTCTTAGCACC
Klf1
Klf1RREB1
RxraELF1
1617
1617
1621
1621
EHF STAT1
GapsHumanChimpGorilla
RhesusBaboon
MarmosetBushbaby
Chinese_tree_shrewSquirrelMouse
RatNaked_mole-rat
RabbitPig
CowDog
ElephantOpossum
ChickenZebrafish
144 bp murine insertion
HbF enrichment
HbF enrichment
DHS +55 HMM
DHS +58 HMM
Primate
Nonprimate
Motifs
SNPs
PhyloP
PhastCons
Primate
Nonprimate
MotifsSNPs
PhyloP
PhastCons
Primate
Nonprimate
HbF enrichment
Motifs
PhyloP
PhastCons
DHS +62 HMM
HbF indel enrichmentMin Max
1
0
GC
GT
ARTICLE RESEARCH
G2015 Macmillan Publishers Limited. All rights reserved

Extended Data Figure 5 | Functional cores of the BCL11A enhancer.a–c, 200 bp at the functional cores of DHSs h155, h158 and h162 defined byHMM states (active, red; repressive, green). HbF enrichment scores are shownby grey lines and circles. HbF indel enrichment per nucleotide based onamplicon genomic sequencing of sorted cells exposed to either sgRNA-1617(top) or -1621 (bottom) is shown. Common SNPs (MAF . 1%) are shown withdotted lines with HbF-low allele in blue and HbF-high allele in red; nocommon SNPs are present at the h158 region. JASPAR motifs (P , 1024) aredepicted in black except for those with allele-specific significance depictedby allelic colour. Selected motifs annotated by transcription factor on the basis
of known erythroid-specific function or genomic position. Motif LOGOs at keypositions with motif scores P , 1023 as described in text. Dotted boxesshow regions of highest HbF enrichment score at each core with underlyingpredicted motifs. Orthologous sequences are listed from representativeprimates and nonprimates of distributed phylogeny. PhyloP (scale from 24.5to 4.88) and PhastCons (from 0 to 1) estimates of evolutionary conservationamong 100 vertebrates are shown. An arrow indicates a 144 bp insertion inthe mouse genome relative to the human reference adjacent to the orthologousGATA1 motif at h158.
RESEARCH ARTICLE
G2015 Macmillan Publishers Limited. All rights reserved

c
Hbb-yEndogenous locus
Targeting construct
Targeted DSB
mCherryNeo
Hbb-yHomology-directed repair product mCherryNeo
Hbb-yCre recombination product mCherry
e
0 25 50 75 1000
20
40
200
Gap between adjacent cleavages (bp)
sgR
NA
num
ber
NGGMedian (4 bp)90th percentile (18 bp)
NAGMedian (4 bp)90th percentile (13 bp)
0 25 50 75 100
248 super-enhancers,747 genes
H3K
27ac
sig
nal i
nten
sity
600K
400K
200K
00 60003000
Bcl11a
ba
1 2 3
Rep
licat
e
Replicate
4
2
3
k
f
0 1000 20000
500
1000
1500
Sequence reads
sgR
NA
(no.
)
i
5.19 5.14
εy:mCherry
Cou
nt
1010
50
100
150
102 103 104 105
g h
εy:mCherry100 101 102 103 104
0
20
40
60
80
100
Nor
mal
ized
cou
nt (%
)
Bcl11a exon 2Nontargeting
50 kbChr11: 24,000,000
Bcl11a
H3K27ac
H3K27ac
d
Distance to Bcl11a TSS (bp)
1 kb
8500
53000
55750
59250
Exon 2
DHS +55
DHS +58
DHS +62
Plus strandMinus strand
NAG
NAGNGG
NGG
NAGNGG
NAGNGG
200K
100K
00 120006000
Ranked enhancers
Bcl11a#124/1064
1064 super-enhancers,4613 genes
-4
-2
0
2
4
εy:m
Che
rry e
nric
hmen
t (lo
g 2)
Non-targeting
Bcl11aexon 2NGG
Bcl11aexon 2NAG
********
j
BCL11A DHS orthologs
Composite enhancer
Super-enhancer
DNase I
3989
624
123
368 (29.0)385 (30.3)307 (24.2)
91 (7.2) 120 (9.4) n (%)
1,271
512 (40.3) 639 (50.3)
120 (9.4)n (%)
1,271
DHS +55 homolog (1,046 bp)DHS +58 homolog (1,341 bp)DHS +62 homolog (1,216 bp)
Exon-2 (330 bp)Nontargeting
Total
NGG PAMNAG PAM
Nontargeting
Total
ARTICLE RESEARCH
G2015 Macmillan Publishers Limited. All rights reserved

Extended Data Figure 6 | Tiled pooled in situ CRISPR-Cas9 Bcl11aenhancer screen. a, Schematic of the mouse Bcl11a locus (mm9, transcriptionfrom left to right) with erythroid chromatin marks (top, dark blue H3K27acfrom ref. 55; middle, light blue H3K27ac from ref. 56; and bottom, blackDNase I from ref. 28) and regions of primary sequence homology to the humanDHSs displayed. y axes for H3K27ac tracks are both scaled to maximum 3.5reads per million. Composite enhancer as previously defined28. b, Rankedenhancers in mouse erythroid precursors by H3K27ac signal intensity55,56, withsuper-enhancers shaded. Super-enhancer associated genes are indicated byVenn diagram. c, Strategy to knock-in by homology-directed repair thefluorescent protein mCherry into the mouse embryonic globin Hbb-y locus(encoding the ey embryonic globin chain). d, Distribution of NGG and NAGPAM sgRNAs mapped to genomic cleavage position with vertical lines
representing cleavage sites for sgRNAs mapped to plus and minus strands.e, Distance to adjacent genomic cleavage position for NGG (left) and NAG(right) PAM sgRNAs. f, Representation of the 1,271 NGG and NAG sgRNAswithin the plasmid pool by deep sequencing. The median was 735 normalizedreads and the 10th and 90th percentiles (indicated by the vertical dottedlines) ranged from 393 to 1,240 normalized reads. g, Library composition bytarget sequence and PAM restriction. h, mCherry expression upon exposure toCas9 and an individual NGG sgRNA targeting Bcl11a exon 2 in MELey:mCherry reporter cells. i, ey:mCherry sort of library transduced cells.j, Control sgRNA enrichment. Boxes demonstrate 25th, median and 75thpercentiles and whiskers minimum and maximum values. ****P , 0.0001.k, Enrichment scores of NGG sgRNAs between four biological replicates.
RESEARCH ARTICLE
G2015 Macmillan Publishers Limited. All rights reserved

a bNontargeting Exon 2 DHS +55 DHS +58 DHS +62
1 16 256 4096Plasmid
Cel
ls
1
16
256
4096
1 16 256 40961
Low εy:mCherry
Hig
h εy
:mC
herry
16
256
4096
-3 0 3-3
0
3
Sam
ple
DHS +55
-3 0 3
DHS +62
-3 0 3
DHS +58
Theoretical
c
dExon 2Nontargeting DHS +55 DHS +58 DHS +62
Dro
pout
(log
2)
-2 0 2 4-4
-2
0
2
r = 0.0007P = 0.9939
-2 0 2 4
r = –0.2911P = 0.0382
-2 0 2 4
r = –0.3997P < 0.0001
-2 0 2 4
r = –0.292P = 0.0002
-2 0 2 4
r = –0.3463P = 0.0001
Enrichment (log2)
Exon 2Nontargeting DHS +55 DHS +58 DHS +62
Relative distance to TSS (kb)
Dro
pout
(log
2)
58 597 8 51 52 54 55
-8
-4
0
4
Repetitive elements
Extended Data Figure 7 | Bcl11a enhancer screen analyses. a, NGG sgRNArepresentation in plasmid pool and cells at conclusion of experiment (left), andin ey:mCherry-high and ey:mCherry-low pools (right), with dotted lines atx 5 y and x 5 8y. b, Quantile–quantile plots of NGG sgRNA ey enrichment
scores. c, Cellular dropout scores of NGG sgRNAs relative to genomic cleavageposition and repetitive elements. Non-targeting sgRNAs are pseudo-mappedwith 5 bp spacing. d, Correlation between cellular dropout and eyenrichment scores.
ARTICLE RESEARCH
G2015 Macmillan Publishers Limited. All rights reserved

a
b
1 kb24,029,500
1 kb24,032,500
0
-1
Chr11:DNase I
DHS +55 HMM
PhyloPPhastCons
Chr11:
DNase IDHS +58 HMM
PhyloP
PhastCons
HbF
enr
ichm
ent
HbF
enr
ichm
ent 1
0
-1
c
d
DNase IChr11: 1 kb24,036,000
PhyloPPhastCons
DHS +62 HMM
HbF
enr
ichm
ent
2
0
ActiveNeutral
States
NeutralStates
ActiveRepressiveNeutral
States
Bcl
11a
expr
essi
on
10
1
0.1
0.1
1
24,036,000
Genomic position (mm9, chr11)24,036,500
RESEARCH ARTICLE
G2015 Macmillan Publishers Limited. All rights reserved

Extended Data Figure 8 | Functional sequences at the Bcl11a erythroidenhancer. a–c, HMM segmentation of active functional states at m155, m158and m162 orthologues. HbF enrichment scores are shown as grey lines andcircles with the blue line representing smoothed enrichment score. DNase Isequencing from mouse fetal liver erythroid precursors28. PhyloP (scalefrom 23.3 to 2.1) and PhastCons (from 0 to 1) estimates of evolutionaryconservation among 30 vertebrates are shown. d, Top: Bcl11a expressiondetermined by RT–qPCR displayed as a heat map in 108 hemizygous m162
orthologue deletion clones ordered by genomic position of deletion midpoint.Each bar demonstrates the genomic position of the deletion breakpoints andthe associated colour demonstrates the level of Bcl11a expression. Bottom:Bcl11a expression determined by RT–qPCR in 108 hemizygous m162orthologue deletion clones. Per nucleotide mean effect size was calculated asthe mean fold change in Bcl11a expression from all clones in which thatnucleotide was deleted. Grey shading represents one s.d. The Bcl11a expressiondata are shown with same x axis as in panel c immediately above.
ARTICLE RESEARCH
G2015 Macmillan Publishers Limited. All rights reserved

Chr11:--->
GapsMouseHuman
PPARG
ESR2
RESTKlf1
Nkx2-5
Myb SP2
SP1
TAL1::GATA1 Myb Gata1
100 bp24,036,300
CATCACTCAAATGTGGTCTAGGTGGCCTATAAAGTTCACACTGGCTCTTCCCTGGGTGTGGATGGAGTGGCTGTTGAAAGAGGGTGGGCATTAATGCTAATCTCTGTGTAGCATAACATGTAACTGCCACTCGCCGCTTTTTATCTGGGAGTTCAAACAGATATCGGACTGGGACTGTTTGTGGTAACTAAGAAGGTTAA
12 5CATCACTCAAATGTGGTCTAGGTGGCCTATAAAGTTCACACTGGCTCTTCCCTGGGTGTGGATGGAGTGGCTGTTGAAAGAGGGTGGGCATTAATGCTAATCTCTGTGTAGCATAACATGTAACTGCCACTCGCCGCTTTTTATCTGGGAGTTCAAACAGATATCGGACTGGGACTGTTTGTGGTAACTAAGAAGGTTAAT.C. .AC.TGGCACA. . . .G.T. . . .AC. . . . .C. . . . . .T .T. . . . . . . . .A. . . . . . . .G- - - - . . . . . . . . .T . . . . . . . . . . .AT. . .C. . . . . . . . . . T . . . . . . . . . . . . . . . . .T . . . . .A. . .T . . -TT. . . . . . . . . .AA . . . . . . .GT. . . . . . .A. .AG. .A.A . . . . . . . . .GTG. . . . . . . . . . . . .
PhyloP
PhastCons
718
109
635
42
DHS +62 HMM
2
0
HbF
enr
ichm
ent
1Deletion clone (no.)
C 2 3 4 5 6 7 8
BCL11A
GAPDH
9 10
Extended Data Figure 9 | Evaluation of the m162 functional core. 200 bpat the functional core of the m162 orthologue defined by HMM state.Enrichment scores are shown as grey lines and circles with the blue linerepresenting smoothed enrichment score. JASPAR motifs (P , 1024) aredepicted with selected motifs annotated by transcription factor name on thebasis of known erythroid-specific function or genomic position. Orthologous
human sequences are listed. PhyloP (scale from 23.3 to 2.1) and PhastCons(from 0 to 1) estimates of evolutionary conservation among 30 vertebrates areshown. Individual numbered hemizygous deletion clones with indicatedbreakpoints were evaluated by BCL11A immunoblot (C, control). Clones 9 and10 encompass the entire m162 orthologue.
RESEARCH ARTICLE
G2015 Macmillan Publishers Limited. All rights reserved

a
Genotype
+62 +/+ 11 14.5 (25)
+62 +/Δ 45 59.2 (50)
+62 Δ/Δ 20 26.3 (25)
Total 76 100 (100)
Progeny (no.) Percentage (expected)
d
+62 +
/+
+62 +/Δ
+62 Δ/Δ
B cell
+62 +
/+
+62 +/Δ
+62 Δ/Δ
Erythroblast
*
+62 +
/+
+62 +/Δ
+62 Δ/Δ
Brain
0
0.04
0.08
0.12
Bcl
11a
expr
essi
on
b
Pre-
/pro
-B c
ells
(%)
+62 +
/+
+62 +/Δ
+62 Δ/Δ
0
2
4
6
8c
0
20
40
60
Freq
uenc
y (%
)
B cells
Erythro
id
Myeloi
d
NK cells
T cells
+62 +/+
+62 +/Δ
+62 Δ/Δ
Extended Data Figure 10 | Requirement of Bcl11a erythroid enhancerduring murine ontogeny. a, Progeny of heterozygous Bcl11a m162orthologue deletion intercrosses as compared to expected Mendelian ratio.b, Fraction of fetal liver comprised of B-cell progenitors at E16.5 from variousgenotypes. c, Peripheral blood analysis from 4-week-old mice to examine the
frequency of various circulating haematopoietic lineages in Bcl11a m162orthologue deletion wild-type, heterozygous, and homozygous mice. d, Bcl11aexpression in b-YAC/162 deletion mice (each symbol represents the meanexpression from technical replicates from an individual mouse). *P , 0.05;error bars represent s.e.m.
ARTICLE RESEARCH
G2015 Macmillan Publishers Limited. All rights reserved