BCG's Biopharmaceutical Partnering Survey – 2012...
20
BCG's Biopharmaceutical Partnering Survey – 2012 Results 2012 Results "Partnering in a rapidly changing market" November 2012
Transcript of BCG's Biopharmaceutical Partnering Survey – 2012...

BCG's Biopharmaceutical Partnering Survey –2012 Results2012 Results"Partnering in a rapidly changing market"
November 2012

Purpose of this document
This presentation is intended to give a "state of the world" overview to the worldwide biopharma licensing and business development environment, as perceived by those active in that area
This presentation reflects BCG's multi-year investment in studying the relationships between the demand and supply side in the market for biopharma licensing
• This 2012 survey edition, following-up on 2003, 2006, 2008 and 2010 editions, had three key objectives– Explore some key trends in biopharmaceutical partnering– Share issues on the minds of BD execs in sell-side companies
– "Sell-side" means companies licensing out ("licensors") to other (typically larger) companies ("licensees")
– "Buy-side" means companies licensing in ("licensees") from other (typically smaller) companies ("licensors")
– Assess perceived performance of individual buy-side companies along key characteristics• We sent the survey to ~750 CEOs and heads of BD at sell-side firms in July/August 2012, with 160
responses
Questions regarding these materials should be directed to Dirk Calcoen, BCG Partner, San Francisco -Email: [email protected]; Phone: +1 415 732 8010
BCG Licensing 2012 - GENERAL - vFinal.pptx 1

Executive summary
Against backdrop of continued challenging partnering environment ...• While overall licensing transaction volumes and values are relatively steady, top pharma companies have
engaged in fewer transactions over past few years and now represent a minority of transactions• Despite a well-publicized need to fill late stage pipelines, most transactions continue to be in early (pre-
Phase II) stage assets• While capital situation improved versus 2010, we observe continued issues with access to capital for most
smaller biopharma companies (impacting the buy/sell side dynamic)
... BCG survey indicates evolving expectations of "sell-side" companies looking to out-license• "Sell-side" looking for a partner who can add value to their product, have partnering skills to close the deal,
have dependable clinical development capabilities and who can deliver internationally• "Sell-side" looking less for a partner who can bring certain capabilities (commercial, regulatory, access /
reimbursement) that are seen as "table stakes"
Overall, sell-side is both less positive and more negative about the buy-side• On average, a decline of perceived performance relative to 2010• In addition, we note a narrowed range between best and worst performers, - despite a clear set of highly
regarded big pharma partners and evidence of some smaller "up and coming" companies• Deteriorating perceptions of some companies especially among those respondents familiar with them
BCG Licensing 2012 - GENERAL - vFinal.pptx 2
These results indicate that there are clear opportunities for improvement and that companies who want to be perceived as great partners cannot be complacent

While total number of licensing deals and values are holding steady ...
Average deal value1Number of total deals1
Average deal values ($ M)250
Total bio-pharma licensing deals 1,000
Average deal valueNumber of total deals
225
,
600
800
175
200
400
600
175
2008 2011201020091500
2011201020092008
200
BCG Licensing 2012 - GENERAL - vFinal.pptx 3
Note: Number of deals and average deal value is based off of total deals in the industry (not top 10 firms)1. Average deal value and number of deals has been obtained from the EvaluatePharma deals database – defined as 'deal value' by EvaluatePharmaSource: EvaluatePharma Licensing deals pull from 2008 to 2012

... Top 10 firms1 have recently engaged in fewer licensing dealswith limited proportion in late stage
No of deals
Sharp decline in number of licensing deals by top 10 pharma1
-25%
138
160
80
109
77
115120
80
-39%-32%-12%-38%
40
Stage CAGR 2009-
201120102008
-17%
-23%
02009
2011
BCG Licensing 2012 - GENERAL - vFinal.pptx 4
201120102008 2009
1. Top 10 Pharma companies as defined by highest sales in 2011 include Abbott, AstraZeneca, Eli Lilly, GSK, J&J, Merck, Novartis, Pfizer, Roche, SanofiSource: EvaluatePharma Licensing deals pull from 2008 to 2012
Filing/MarketedPhase IIIPhase IIPhase IPreclinicalR&D

While financial health in biopharma has improved significantly, still significant risk of default, impacting licensing dynamics
5 year cumulative default risk (2010) 5 year cumulative default risk (2012)
00
5 year cumulative default risk (2010) 5 year cumulative default risk (2012)
rice/
book
5050
rice/
book
P
00
P
100%70%30%0%70% 100%0% 30%
36 2972Companies15 102 67
BCG Licensing 2012 - GENERAL - vFinal.pptx 5
1. 'Medium to high default risk' includes all companies with 30% or higher 5 yr cumulative default riskNote: Default risk based on CreditGrade™ Sample is all biotech and pharma companies with $10M-$10B Market Cap. CX creditgrade based off ADRSource: CreditGrades.com, Global Vantage, Reuters, BCG ValueScience Center.
36
$4B
29
$5B
72
$95B
Companies
Capitalization
15
$6B
102
$53B
67
$19B

Against this backdrop, we launched fifth edition of BCGlicensing survey in the summer of 2012
Survey targeted representative sample of ~750 biopharma "sell side" companies yielding 65 responses in 2003 51 responses in 2006 88 in 2008 95 in 2010 and 160 inyielding 65 responses in 2003, 51 responses in 2006, 88 in 2008, 95 in 2010, and 160 in 2012
• Data from multiple editions allows identification of trends
Respondents were geographically diverseRespondents were geographically diverse• North America: US, Canada• Europe: Netherlands, Denmark, Finland, Belgium, France, Germany, Italy• Asia: India, China, Japan
Respondents were senior level executives involved in licensing or business development
• President, CEO, VP / Director of Business Development
Key objectives of survey• Determine most important characteristics in selecting a licensing partner• Determine perceived performance of specific buy-side companies
BCG Licensing 2012 - GENERAL - vFinal.pptx 6

We surveyed a broad cross-section of biopharma ...
High proportion of small firms in 2012 survey Products are across therapeutic areas1
% respondents% respondents30
20
10
% respondents% respondents80
60
40
2012201020082006 2012201020082006
10
0PsychReproRespGIHemeCVOtherIDNeuroEndoInfOnc
20
0>1,000501-1,000301-500101-30051-1001-50
# employees
In 2012, respondents have fewer deals under their belt Mix of early and late stage projects
% respondents % respondents100
Late stageMid stageEarly stage
100
1-23–56–10> 10
5050
BCG Licensing 2012 - GENERAL - vFinal.pptx 7
1. Onc = oncology, Inf = inflammation, ID = infectious disease, Neuro = neurology, CV = cardiovascular, Resp = Respiratory, GI = gastroenterology, Heme = hematology, Psych = Psychiatry, Nephr = Nephrology, Repro = Reproductive HealthSource: BCG survey of Biotech CEOs and Licensing Executives, 2012
02012201020082006
02012201020082006

... and expanded the number of companies surveyed in 2008, 2010 and 2012 for comprehensive coverage
Analyses use core or full set of companies Core
companiesAdded in 2008/2010 Added in 2012
• Abbott• Amgen• AstraZeneca• Bayer
• Astellas• Biogen• Celgene• Daiichi
• Shire• Teva
Analyses of trends across years use core companies
• E.g., comparison of average performance over 4 survey editions• Bayer
• BMS• Boehringer
Ingelheim• GSK
• Daiichi-Sankyo
• Eisai• Gilead• Merck Serono
over 4 survey editions
Other analyses use full company sample • E.g., importance of attributes, dispersion
in perceived performance,...• J&J• Lilly• Merck• Novartis• Pfizer
• Mitsubishi Tanabe
• Novo Nordisk• Takeda• UCB
Clearly indicated on each analysis whether only core set vs. full set of companies used
Pfizer• Roche• Sanofi
UCB
Whil l i i l ti l ll
BCG Licensing 2012 - GENERAL - vFinal.pptx 8
While survey sample size is relatively small, we feel the results reflect perceived reality

What a "sell-side" partner is looking for – value creation expertise but also core partnering skills to close a deal
Ability to add value to your TA of interest
Average
Whil l ti till
Partnering Culture Capability attributes
Executive leadership committed to partneringResponsiveness during deal negotiation
Clinical capabilityCreativity and flexibility on deal terms
b ty to add a ue to you o te est While value creation still highest on list, key to
win are core partnering skills during
negotiations as well as core clinical skills
Pricing access and reimbursement capabilityGlobal / international reachSales / marketing capability
Regulatory capabilityAllows partners to develop and prosper
core clinical skills
Licensors view Commercial, Regulatory,
and pricing / access capabilities as table
k hil l b l
Willingness to pay the highest priceBD/licensing group is easy to access
Pricing, access and reimbursement capability
Fit with corporate cultureAlliance Management
Lower importance of t d l i t ti
stakes while global reach increasingly
important
Research capabilitiesAllows partners to retain control in devpt
p
Manufacturing expertise
5 04 54 03 53 0
post- deal interactions (incl. alliance mgmt),
and cultural fit
BCG Licensing 2012 - GENERAL - vFinal.pptx 9
5.04.54.03.53.0
Source: BCG survey of Biotech CEOs and Licensing Executives, 2012; BCG analysis; see appendix 1 for format of survey questionnaire
Very Important
IndifferentAbsolute change from 2010 Survey results

Perceived industry performance has slipped slightly from 2010 levels ...Percent of respondents agreeing that median company1 exhibits the associated criteria
1002006 201220102008
Analysis of core companies only
80
6060
40
20
0
CulturePartnering Capabilities
Regulatory capability
Clinical capability
TAs of interest
Fit with corporate
culture
Allow retained control
Alliance mgmt
Pay highest
price
BD/ Licensing
group access
Develop and
Prosper
Executive leadership
ResponsiveFlexibility on deal terms
0Mfrg.
expertiseResearch
capabilitiesPricing/ access
capability
Global / int. reach
Sales / marketing capability
BCG Licensing 2012 - GENERAL - vFinal.pptx 10
More important Less important More important Less important
1. Values are calculated as median of "Agree and Strongly agree responses" only for core companies – see slide 13 for list of core companiesNote: The chart has been updated to reflect 2012's importance scales and individual attributes – the trend line is broken where attributes didn't exist in previous editions, Source: BCG survey of Biotech CEOs and Licensing Executives, 2012

...with respondents from larger sell-side companies more critical of performance across all dimensions
100
Sell-side companies >=101 employeesSell-side companies <100 employeesSell-side, all companies
Percent of respondents agreeing that median company1 exhibits the associated criteria
Analysis of core companies only
80
6060
40
20
0
CulturePartnering Capabilities
Fit with corporate
culture
Allow retained control
Alliance mgmt
Pay highest
price
BD/ Licensing
group access
Develop and
Prosper
Executive leadership
ResponsiveFlexibility on deal terms
0Mfrg.
expertiseResearch
capabilitiesPricing/ access
capability
Global / int. reach
Sales / marketing capability
Regulatory capability
Clinical capability
TAs of interest
BCG Licensing 2012 - GENERAL - vFinal.pptx 11
More important Less important More important Less important
1. Values are calculated as median of "Agree and Strongly agree responses" only for core companies – see slide 13 for list of core companies Note: The chart has been updated to reflect 2012's importance scales and individual attributes – the trend line is broken where attributes didn't exist in previous editionsSource: BCG survey of Biotech CEOs and Licensing Executives, 2012

While performance across top companies has slipped from 2010, the range within the core group has tightened
Partnering Culture / Capabilities
Analysis of core companies only
100
Respondents agreeing that company exhibitspartnering characteristics (%)1
100
Respondents agreeing that company exhibitsculture/capabilities characteristic (%)1
High (mean of first-place company)
Median of company means (2012)
50
75
50
75Low (mean of last-place company)
g ( ea o st p ace co pa y)
25
50
25
50
02006 2008 2010 2012
02006 2008 2010 2012
BCG Licensing 2012 - GENERAL - vFinal.pptx 12
1. Calculated as high, median and low of averaged scores on partnering characteristics. High and low indicates an individual company's average partnering score across eight partnering parameters. Similar calculation for culture/capabilities. Note: Analysis conducted using core companiesSource: BCG survey of Biotech CEOs and Licensing Executives, 2012, BCG Analysis

In 2012, GSK getting many of the highest marks in partnering attributes among core companies
100%
Low (last place company)1
High (first place company)1
Industry Median (2012)1Percentage of respondents agreeing that company exhibits the associated criteria
Analysis of core companies only
75%
25%
50%
0%
y on
dea
l rm
s
spon
sive
eade
rshi
p
d Pr
ospe
r
ng g
roup
es
s
hest
pric
e
nage
men
t
d co
ntro
l
corp
orat
e tu
re
of in
tere
st
capa
bilit
y
capa
bilit
y
mar
ketin
g ab
ility
erna
tiona
l h g/
acc
ess
pabi
lity
pabi
litie
s
fact
urin
g pe
rtis
e
Flex
ibili
tyte
r
Res
Exec
utiv
e le
Dev
elop
and
BD
/Lic
ensi
acce
Pay
high
Allia
nce
man
Allo
w re
tain
e
Fit w
ith c
cult
TAs
o
Clin
ical
c
Reg
ulat
ory
c
Sale
s / m
capa
Glo
bal /
inte
reac
Pric
ing
cap
Res
earc
h ca
p
Man
uex
p
Partnering C lt re Capabilities
BCG Licensing 2012 - GENERAL - vFinal.pptx 13
More importantPartnering
Less importantCulture Capabilities
More important Less important
Note: scores calculated as percent of respondents who agree with statements associated with each company;1. Median, high and low scores calculated across core set of companies onlySource: BCG survey of Biotech CEOs and Licensing Executives, 2012; see appendix 2 for format of survey questionnaire

When including all companies, smaller ones like Celgene and Novo Nordisk are outperforming bigger ones on partnering ...
100%
Low (last place company)
High (first place company)
Industry Median (2012)Percentage of respondents agreeing that company exhibits the associated criteria
Analysis of all companies
75%
25%
50%
0%
y on
dea
l rm
s
spon
sive
eade
rshi
p
d Pr
ospe
r
ng g
roup
es
s
hest
pric
e
nage
men
t
d co
ntro
l
corp
orat
e tu
re
of in
tere
st
capa
bilit
y
capa
bilit
y
mar
ketin
g ab
ility
erna
tiona
l h g/
acc
ess
pabi
lity
pabi
litie
s
fact
urin
g pe
rtis
e
Flex
ibili
tyte
r
Res
Exec
utiv
e le
Dev
elop
and
BD
/Lic
ensi
acce
Pay
high
Allia
nce
man
Allo
w re
tain
e
Fit w
ith c
cult
TAs
o
Clin
ical
c
Reg
ulat
ory
c
Sale
s / m
capa
Glo
bal /
inte
reac
Pric
ing
cap
Res
earc
h ca
p
Man
uex
p
Partnering C lt re Capabilities
BCG Licensing 2012 - GENERAL - vFinal.pptx 14
More importantPartnering
Less importantCulture Capabilities
More important Less important
Note: scores calculated as percent of respondents who agree with statements associated with each company;Source: BCG survey of Biotech CEOs and Licensing Executives, 2012; see appendix 2 for format of survey questionnaire

... reflected in the overall rankings for 2012: Novo Nordisk and Celgene included among top tier in 2 of 3 rankings ...
Highest proportion of respondents that have a positive impression3
Highest average score across all attributes1
Most nominations as a "top partner"2
Roche CelgeneMerck & Co.
Analysis of all companies
CelgeneAstraZenecaMerck & Co.
GSKNovo Nordisk
Roche
AstraZenecaMerck & Co.
RocheGSK
Novo NordiskCelgene
BMSNovartis
AstraZenecaRoche
GSKMerck & Co.
Me
Me
4 03 53 02 5 6040200151050 2520
edian
edian
BCG Licensing 2012 - GENERAL - vFinal.pptx 15
Average Rating1
4.03.53.02.5
Proportion agreeing (%)
6040200151050
Share of best-in-class votes (%)
2520
1. Mean score across all partnering attributes and capability scores 2. Share of times mentioned as one of best two companies to partner with 3. Proportion of respondents agreeing that company demonstrates positive partnering attributes. Weighs each response equally. Source: BCG survey of Biotech CEOs and Licensing Executives, 2012

... leading to reshuffle of top six firms with only GSK, Merck and Roche being constants across three most recent editions
Highest proportion of respondents that have a positive impression3
Highest average score across all attributes1
Most nominations as a "top partner"2
AstraZenecaMerck
GSKNovo Nordisk
Roche
MerckRoche
GSKNovo Nordisk
Celgene
NovartisAstraZeneca
RocheGSK
Merck
2012
4.03.53.02.5
Celgene
6040200
AstraZeneca
2520151050
BMS
GSKMerckRoche
CelgeneRocheMerck
MerckGSK
Roche
10
4.03.53.02.5
PfizerEli Lilly
Novartis
6040200
NovartisGSK
Eli Lilly
2520151050
Eli LillyPfizer
Novartis20
GSK GSKRoche
2008
4 03 53 0
PfizerJ&J
RocheMerck
Novartis
2 5 6040200
Eli LillyJ&J
MerckNovartis
Roche
151050 25
J&JEli Lilly
NovartisMerck
GSK
20
BCG Licensing 2012 - GENERAL - vFinal.pptx 16
1. Mean score across all partnering attributes and capability scores 2. Share of times mentioned as one of best two companies to partner with 3. Proportion of respondents agreeing that company demonstrates positive partnering attributes. Weighs each response equally. Note: Companies that have remained at the top over three editions have been labeled in boldSource: BCG survey of Biotech CEOs and Licensing Executives, 2012, 2010 and 2008 editions
Average Rating1
4.03.53.02.5
Proportion agreeing (%)6040200
Share of best-in-class votes (%)151050 2520
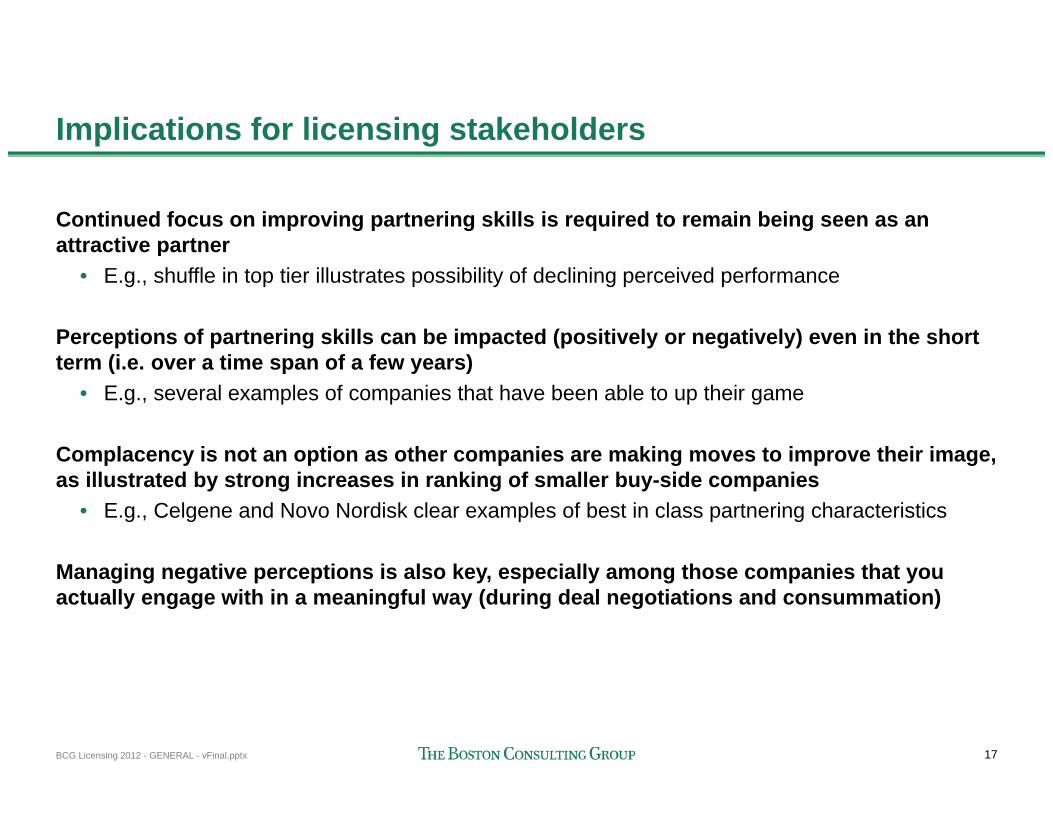
Implications for licensing stakeholders
Continued focus on improving partnering skills is required to remain being seen as an attractive partnerp
• E.g., shuffle in top tier illustrates possibility of declining perceived performance
Perceptions of partnering skills can be impacted (positively or negatively) even in the short t (i ti f f )term (i.e. over a time span of a few years)
• E.g., several examples of companies that have been able to up their game
Complacency is not an option as other companies are making moves to improve their imageComplacency is not an option as other companies are making moves to improve their image, as illustrated by strong increases in ranking of smaller buy-side companies
• E.g., Celgene and Novo Nordisk clear examples of best in class partnering characteristics
Managing negative perceptions is also key, especially among those companies that you actually engage with in a meaningful way (during deal negotiations and consummation)
BCG Licensing 2012 - GENERAL - vFinal.pptx 17

Appendix 1: 2012 partnering survey questionnaire: importance of attributes
What attributes do you look for in a partner? Please rate each attribute from "extremely important" to"extremely unimportant"
Extremely Somewhat Somewhat ExtremelyExtremely important
Somewhat important Indifferent
Somewhat unimportant
Extremely unimportant
Ability to add value to your compound/TA of interestResearch capabilityClinical capabilityRegulatory capabilitySales/marketing capabilityPricing, access and reimbursement capabilityGlobal/international reachManufacturing capabilityFit with corporate cultureResponsiveness during the deal negotiation processWillingness to pay the highest priceCreativity and flexibility on deal terms and structuresAlliance management capabilityAlliance management capabilityExecutive leadership committed to partneringBusiness development/licensing groupis easy to accessAllows partners to develop and prosper / commitment to partners' long term success
BCG Licensing 2012 - GENERAL - vFinal.pptx 18
gAllows partners to retain control in developmentand/or commercialization

Appendix 2: 2012 partnering survey questionnaire: assessment of individual company by attribute
Please indicate the degree to which you agree or disagree that [company] possesses the following attributes
Strongly Somewhat Somewhat StronglyStrongly agree
Somewhat agree Neutral
Somewhat disagree
Strongly disagree
Ability to add value to your compound/TA of interest
Research capability
Clinical capability
Regulatory capability
Sales/marketing capability
Pricing, access and reimbursement capability
Global/international reach
Manufacturing capability
Fit with corporate culture
Responsiveness during the deal negotiation process
Willingness to pay the highest price
Creativity and flexibility on deal terms and structuresCreativity and flexibility on deal terms and structures
Alliance management capability
Executive leadership committed to partnering
Business development/licensing groupis easy to accessAll t t d l d ( b i
BCG Licensing 2012 - GENERAL - vFinal.pptx 19
Allows partners to develop and prosper (e.g. bears in mind long-term success of partner)Allows partners to retain control in developmentand/or commercialization


![Review Viral clearance for biopharmaceutical downstream ... · Viral clearance for biopharmaceutical downstream processes ... [13]. Hence a panel of ... Viral clearance for biopharmaceutical](https://static.fdocuments.us/doc/165x107/5ad5f65c7f8b9a5d058dd2b7/review-viral-clearance-for-biopharmaceutical-downstream-clearance-for-biopharmaceutical.jpg)