BCFS Annual Report 2013-2014
116
ANNUAL REPORT 2013–2014 BRITISH COLUMBIA FERRY SERVICES INC.
-
Upload
blair-stoddart -
Category
Documents
-
view
7 -
download
2
description
wooo annual report
Transcript of BCFS Annual Report 2013-2014

A N N UA L R E P O R T 2 0 1 3 – 2 0 1 4B R I T I S H C O L U M B I A F E R RY S E RV I C E S I N C .

“I have been with BC Ferries for 20 years and I am currently a Ticketing Supervisor, but I’m versatile and work in numerous positions including Terminal Manager. I truly enjoy my jobs and the versatility, camaraderie, as it feels like a second family.”
— c a l f r o s t , t i c k e t i n g s u p e r v i s o r

This report contains certain “forward looking statements”. These statements relate to future events or future performance and reflect management’s expectations regarding our growth, results of operations, performance, business prospects and opportunities and industry performance and trends. They reflect management’s current internal projections, expectations or beliefs and are based on information currently available to management. Some of the market conditions and factors that have been considered in formulating the assumptions upon which forward looking statements are based include traffic, the Canadian Dollar relative to the US Dollar, fuel costs, construction costs, the state of the local economy, fluctuating financial markets, demographics, tax changes, and the requirements of the Coastal Ferry Services Contract.
Forward looking statements included in this document include statements with respect to:• our short-term and long-range business plans;• our asset renewal programs for vessels and terminals;• our customer service program, vessel replacement program for the Queen of Burnaby and the
Queen of Nanaimo, cable ferry initiative, and liquefied natural gas plans;• our fourth performance term submission; and• service level reductions and a long-term vision for connecting coastal communities.
In some cases, forward looking statements can be identified by terminology such as “may”, “will”, “should”, “expect”, “plan”, “anticipate”, “believe”, “estimate”, “predict”, “potential”, “continue” or the negative of these terms or other comparable terminology.
A number of factors could cause actual events or results to differ materially from the results discussed in the forward looking statements. In evaluating these statements, prospective investors should specifically consider various factors including, but not limited to, the risks and uncertainties associated with traffic volume and tariff revenue risk, safety and security, asset risk, accident risk, tax risk, environmental risk, regulatory risk, labour disruption risk, risk of default under material contracts and aboriginal land claims.
Actual results may differ materially from any forward looking statement. Although management believes that the forward looking statements contained in this report are based upon reasonable assumptions, investors cannot be assured that actual results will be consistent with these forward looking statements. These forward looking statements are made as of the date of this report, and British Columbia Ferry Services Inc. assumes no obligation to update or revise them to reflect new events or circumstances except as may be required by applicable law.
In addition to providing measures prepared in accordance with IFRS, we present certain supplemental non-IFRS measures. These include, but are not limited to, vehicle and passenger traffic, on-time performance, fleet reliability scores, employee and passenger safety scores, and customer satisfaction ratings. These measures do not have any standardized meaning prescribed by IFRS and therefore are unlikely to be comparable to similar measures presented by other companies. These supplemental non-IFRS measures are provided to assist readers in determining our ability to generate cash from operations and improve the comparability of our results from one period to another. We believe these measures are useful in assessing operating performance of our ongoing business on an overall basis.
B R I T I S H C O L U M B I A F E R R Y S E R V I C E S I N C .
Corporate Profile 2
Message from the Chair 4
Message from the President & CEO 5
Key Accomplishments 6
Performance Measures 12
Key Cost Drivers 13
Management’s Discussion and Analysis of Financial Condition
and Results of Operations 15
Consolidated Financial Statements 81
Corporate Directory 113
1BRITISH COLUMBIA FERRY SERVICES INC.

C O R P O R A T E P R O F I L E BC Ferries is one of the largest ferry operators in the world, providing year-round vehicle and passenger service on 24 routes to 47 terminals, with a fleet of 35 vessels. We are an essential transportation link that connects coastal communities and facilitates the movement of people, goods and services. In fiscal 2014, we carried 19.7 million passengers and 7.6 million vehicles throughout coastal British Columbia.
OUR VISION To provide a continuously improving west coast travel experience that consistently exceeds customer expectations and reflects the innovation and pride of our employees.
OUR MISSION To provide safe, reliable and efficient marine transportation services which consistently exceed the expectations of our customers, employees and communities, while creating enterprise value.
OUR VALUES Safety: Ensure that the safety and security of our customers and staff is a primary concern in all aspects of doing business.
Quality: Be motivated by customer expectations in providing quality facilities and services.
Integrity: Be accountable for all our actions and ensure we demonstrate integrity in our business relations, utilization of resources, treatment of our customers and staff, and in the general conduct of our business.
Partnerships: Work openly and constructively with our various business and community stakeholders to exceed the expectations of our customers and advance each other’s interests.
Environment: Ensure that environmental standards are maintained.
Employees: Always deal from a position of honesty, integrity and mutual respect, and ensure that our employees develop to their full potential.
OUR GOALS In support of our vision, we are focused on five key goals, none more important than safety.
1. Safety: To protect our customers and employees by continuously improving the safety of our operations, inclusive of vessels, terminals and facilities.
2. Operational Reliability: To continuously improve the operational reliability of vessels, terminals and facilities.
3. Continuous Improvement: To be better at everything we do.
4. Value For Money: To continuously improve value to our customers at every point along the customer experience chain.
5. Financial Integrity: To achieve key financial targets, ensuring that sufficient capital and retained earnings are available to revitalize our fleet, facilities and infrastructure.
2 ANNUAL REPORT 2013–2014

“A seagoing career is interesting when you have traffic, are close to land, and about to dock. At BC Ferries this is the normal work environment. The best part of any seagoing job is to have a good crew, a sound ship, and interesting scenery—and I have that too.”
— c a p t a i n d a v e w o o d m a n , m a s t e r
3BRITISH COLUMBIA FERRY SERVICES INC.

On behalf of the Board of Directors of British Columbia Ferry Services Inc.,
I applaud the employees of BC Ferries for their continued dedication to
safety and excellence in customer service.
As I reflect on the previous year, there are many highlights that come
to mind such as a customer satisfaction rating of 87.0 per cent, fleet
reliability rating of 99.7 per cent and an on-time performance rating
of 91.5 per cent. BC Ferries won the Lloyd’s List North America Safety
Award in the Training category for improvements in navigation safety
as a result of the new Bridge Simulation Training program. In addition,
the company won the Lattitude Productions UK International Safety
Award for motivating and inspiring employees to reach for world-class
safety performance.
Our focus today is on the need to renew our terminals and vessels;
address a challenging market with a largely fixed cost system; and
provide a safe, reliable high quality customer experience delivered
efficiently and effectively.
Our focus on the future requires continual investment in both our people
and our infrastructure. We need to replace some of the minor and
intermediate size vessels that, in some instances, are over 40 years old
and nearing the end of their lifecycle. Our investment in information
technology to replace aging and outdated systems will improve the
customer experience and provide fare flexibility. Together, these
investments in our operations will ensure that customers will be well
served for decades to come.
We have four new ships on the horizon which will allow for the retirement
of some older vessels while reducing our operating costs. The three
new intermediate class ferries will be dual-fuel vessels, which will allow
us to operate on liquefied natural gas with the potential to reduce our
fuel costs by up to 50 per cent and reduce our environmental impact.
The new cable ferry will also be very cost effective to build and operate,
helping us reduce upward pressure on fares.
BC Ferries has a responsibility as the steward of reliable, safe and
sustainable marine transportation on the west coast and we are integral
to the province’s economic success and well-being. We focus on
providing outstanding customer service to nearly 20 million passengers
each year. We facilitate the delivery of a range of commercial goods
critical to residents and local economies. The Board’s continued focus
is to make BC Ferries a world class transportation system with a bright
future ahead.
DOnalD P. HayES
Chair of the Board of Directors
British Columbia Ferry Services Inc.
4 ANNUAL REPORT 2013–2014
M E S S A G E F R O MT H E C H A I R O F T H E B O A R D O F D I R E C T O R S

At BC Ferries, our job is to provide a safe, efficient and reliable marine
transportation system along coastal British Columbia under contract to the
Province. We play a critical part in connecting communities, commerce and
tourism, and we take great pride in delivering this important service.
As I look back on the past year, I’m proud of the many accomplishments
we’ve achieved. We provided over 183,000 sailings for almost 20 million
passengers delivering them safely to their destinations while reducing
employee injuries by 22 per cent and achieving WorkSafeBC’s Certificate
of Recognition.
During fiscal 2014, we invested $108 million in our fleet. Of this amount, there
were capital projects totalling $69 million, including the $20 million multi-year
life-extension project on the MV Tachek and the $3.0 million three-quarter life
upgrade on the MV Kwuna. In addition, we had one of our biggest years ever
for refits and vessel maintenance, spending $39 million. All of this provided
significant work at local shipyards and our own refit facility.
On the shore side, we invested over $40 million in capital projects and
$22 million in maintenance projects at our terminals to ensure the
continuity of ship to shore interface with our 35 vessels. Two notable
terminal projects were the complete rebuilds of the marine structures at
Powell River and Comox, which resulted in a nearly $30 million investment
into these communities to ensure reliable service for up to 40 more years.
These projects required complex alternate service arrangements during
the temporary dock closures and the many months of pre-planning and
consulting with the communities was time well spent.
In an effort to keep fares as low as possible, innovation and diversification
of our operations has resulted in profitable initiatives such as the creation
of a commercial services division, BC Ferries Vacations Centre, and the
expansion of catering and retail services. These non-traditional revenue
sources continue to show strong results and improve our bottom line.
As the service provider, we work closely with the provincial government,
which sets our service levels as a matter of public policy, and the BC Ferries
Commissioner. The Commissioner, independent of both government and
BC Ferries, regulates our fares by balancing the interests of customers and
taxpayers, while protecting the long term sustainability of the company.
Last year, the Province announced service level reductions on our northern
and minor routes to ensure BC Ferries is a strong, viable company to serve
residents and tourists for years to come. We worked with the affected
communities to develop optimal schedules that still address the net savings
outlined by the government. We thank the communities for their valuable
and constructive input into this process.
We understand the vital role we play in maintaining the quality of life of
people who live, work and play in British Columbia, so we will stay focused
on what we do best and what we can control: serving our customers,
maintaining a safe, reliable and efficient fleet, and in the process, provide a
high quality customer experience, be a place where employees can build a
meaningful career and be a company worthy of the public’s trust.
MICHaEl J. CORRIGan
President & Chief Executive Officer
British Columbia Ferry Services Inc.
M E S S A G E F R O M T H E P R E S I D E N T & C E O
5BRITISH COLUMBIA FERRY SERVICES INC.
IMPROVING THE TRAVEL EXPERIENCE…
• Achieved a vessel reliability index of 99.7 per cent.
• Generated $79 million in ancillary revenue in food and retail sales. While we impress shoppers and diners with new products, these services contribute valuable non-tariff revenue to our bottom line, which helps reduce pressure on fares.
• Continued to invest in the future through our customer-facing information technology program, which is a multi-year integrated business solution to improve the end-to-end customer experience. This program will deliver enhanced value for our customers by enabling a greater selection of fare options, improve certainty of travel and consolidate customer information.
• In partnership with Parks Canada, implemented the 8th season of our Coastal Naturalist program on the Tsawwassen – Swartz Bay and Horseshoe Bay – Departure Bay routes for the summer months.
• Released the results of our 2013 Customer Satisfaction Tracking surveys which indicated that 87 per cent of customers surveyed reported being satisfied with their overall trip experience.
• Generated $3.3 million in revenue from BC Ferries Vacations in fiscal 2014 and served over 35,000 customers since it opened in downtown Vancouver four years ago.
• Expanded the popular White Spot menu offerings on vessels servicing the Metro Vancouver – Vancouver Island and Horseshoe Bay – Langdale routes. Introduced menu refresh for food outlets on the northern vessels and implemented a new outdoor BBQ service on the Northern Expedition.
• Introduced recyclable paper hot beverage cups, in place of foam cups, throughout the fleet to improve the customer experience and reduce our environmental footprint.
• Developed and installed new terminal wayfinding signs at Swartz Bay terminal, allowing for clear and effective directional information for customers.
• Developed a customer service enhancement program based on customer feedback.
K E Y A C C O M P L I S H M E N T S
6 ANNUAL REPORT 2013–2014

7 BRITISH COLUMBIA FERRY SERVICES INC.
K E Y A C C O M P L I S H M E N T S
INVESTING IN OUR VESSELS & TERMINALS…
• Invested $129.9 million in capital expenditures for vessel upgrades and modifications, terminals and information technology.
• Conducted 13 drydockings and 24 refits on our fleet of 35 ships this year.
• Awarded a $15 million contract to Seaspan’s Vancouver Shipyards to build a cable ferry for the Buckley Bay – Denman Island route.
• Awarded two contracts totalling $15 million for the construction of the Buckley Bay and Denman West cable ferry berths.
• Completed a $9 million project at Little River terminal to replace the ramp, ramp abutment and towers with active life hydraulics and replaced the wingwalls and dolphin. This project will provide safe and reliable service for up to another 40 years.
• Completed an $18 million project at Westview terminal to replace the existing marine structures to provide safe and reliable service for up to another 40 years.
• Conducted a $3 million three-quarter life upgrade on the MV Kwuna at Allied Shipbuilders in North Vancouver.
• Completed a project to life-extend the upper transfer deck at Horseshoe Bay terminal for another seven years.
• Concluded a $20 million project at Point Hope Maritime in Victoria to extend the life of the MV Tachek by an additional 15 years until retirement in 2029.
• Issued a Request for Proposals to five pre-qualified shipyards, including one Canadian proponent, to build three intermediate class ferries to replace the 49-year-old Queen of Burnaby and the 50-year-old Queen of Nanaimo.
• Substantially completed an $8 million project at Alert Bay to upgrade wingwalls, towers and aprons and ramp.
• Replaced the double-sided floating lead at Village Bay terminal.
• Completed a $1 million project to improve the C-Class vessel propulsion systems by installing new controllable pitch propeller hub systems on the Queen of Coquitlam and the Queen of Cowichan.
• Credit rating agency Standard & Poors’ raised our long-term and senior unsecured debt ratings to ‘AA-’ from ‘A+’ with a stable outlook.

8 ANNUAL REPORT 2013–2014
“I have been working at BC Ferries since 1992. What I like about my job is the challenge that comes when I come to work everyday.”
— i s m a e l j a m e l a r i n , t h i r d e n g i n e e r

BUILDING A BETTER BC FERRIES…
• Completed Phase III of SailSafe, a joint safety initiative with the BC Ferry & Marine Workers’ Union and increased the size of the SailSafe ambassador group from 337 to 426 employees.
• Received WorkSafeBC’s Certificate of Recognition (COR) for successfully implementing and maintaining an occupational health and safety management system that exceeds the regulatory requirements of the Workers’ Compensation Act and the Occupational Health & Safety Regulations by taking a best practices approach to implementing health, safety and return to work programs.
• Completed the redemption of all $140 million of the outstanding Series 08-02 Bonds on July 24, 2013, formerly due on December 19, 2013. This debt management initiative to reduce interest costs in the short term was funded with $55 million from cash on hand and $88 million in draws on our credit facility. Due to this early redemption, BC Ferries saved approximately $0.3 million in interest costs.
• Completed a private placement of $200 million of 30-year senior secured bonds with accredited investors on October 25, 2013. These bonds bear interest at a rate of 4.702% per annum, payable semi-annually. This issuance was partially related to the early redemption of our $140 million Series 08-2 Bonds. The net proceeds of this new issue were used to repay indebtedness under our credit facility, fund the debt service reserve related to these bonds, and will partially fund capital expenditures, and provide funding for general corporate purposes. These bonds were rated “A” (DBRS) and “A+” Standard & Poor’s (S&P).
• Held 29 “Town Hall” sessions with over 400 employees to collaborate and brainstorm different avenues for improving workplace safety.
• Completed the safety management system (SMS) integration project including the creation of SMS dashboards offering all employees access to near real time safety data.
• Received the Lattitude Productions UK International Award for Inspiring Safety.
• Reduced employee time-loss injuries by 22 per cent and days lost to injuries by 19 per cent over the previous year.
• Won the Lloyd’s list North America Safety Award in the Training category for improvements in navigation safety as a result of the new bridge simulation training program.
• Continued to develop and invest in our people through extensive technical training and orientation, succession planning and sponsored development for our officers and significant leadership training for our managers and supervisors.
K E Y A C C O M P L I S H M E N T S
9BRITISH COLUMBIA FERRY SERVICES INC.

10 ANNUAL REPORT 2013–2014
BUILDING A BETTER BC FERRIES (cont ’d)…
• Delivered over 15,500 personal training days to our employees.
• Expanded the new operational readiness exercise process to the Horseshoe Bay – Departure Bay and Horseshoe Bay – Langdale routes.
• Completed the roll out of the standardized education and assessment (SEA) program to over 70 per cent of operational positions identified for training.
• Increased the total number of qualified trainers in the company to over 300 and expect to grow the training team to 400 by the time SEA is fully implemented by March 2015.
• Marked a major milestone in our commercial services division by carrying our 100,000th drop trailer this year.
• Completed a private placement of $200 million of 30-year senior secured bonds with accredited investors on April 28, 2014. These bonds bear interest at a rate of 4.289% per annum, payable semi-annually. The net proceeds of this new issue, together with additional cash on hand, were used to repay our $250 million bond Series 04-1, which matured on May 27, 2014, and to fund the debt service reserve related to these bonds. These bonds were rated “A” (DBRS) and “AA-” (S&P). The effective rate of this issue, net of hedging, is 4.50 per cent, the lowest effective bond interest rate in the 11-year history of the company.
K E Y A C C O M P L I S H M E N T S

11BRITISH COLUMBIA FERRY SERVICES INC.
K E Y A C C O M P L I S H M E N T S
CONNECTING WITH THE COMMUNITIES WE SERVE…
• Performed 18 marine rescues throughout coastal British Columbia including the May 20, 2013 rescue of two people from a capsized pleasure craft by the crew of the MV Klitsa.
• Raised $50,000 for Community Living Victoria, which supports people with developmental disabilities together with their families, through the BC Ferries Media Charity Golf Classic. Over the past eight years, these tournaments have raised over $500,000 to support various programs.
• Provided technical support for a government-led consultation and engagement process regarding the immediate challenges and long-term vision for the coastal ferry service. Followed up this process with BC Ferries-led schedule refinement meetings with the affected communities in order to mitigate the impact of service reductions through schedule adjustments.
• Pledged over $50,000 in employee contributions in the 2013 United Way Campaign.
• Consulted regularly with our 13 Ferry Advisory Committees.
• For the 10th consecutive year, BC Ferries’ employees raised money to donate to a local food bank through the annual BC Ferries’ employees golf tournament. The 2013 tournament raised $3,060 which was divided amongst food banks on Salt Spring Island, Gabriola Island and Quadra Island.
• Conducted over 80 extra ambulance runs to transport people requiring urgent care from smaller island communities to emergency medical treatment.
• Sponsored the Powell River Kings Junior “A” Hockey Club, the BC Bike Race, ViaSport, and the Victoria Highlanders Football Club.
• Held community open houses in Powell River and Little River to work with communities on alternate service delivery during dock closures for construction. After the projects were complete, held customer appreciation events to thank customers for their patience while the multi-million dollar dock upgrades were underway.
• Completed the Langdale master plan after extensive public and employee stakeholder consultation. This master plan provides a long term development framework to guide the Langdale terminal development over the next 20 years.
• Held public information sessions in the Southern Gulf Islands and Northern Sunshine Coast regarding the new intermediate class ferry build program.

12 ANNUAL REPORT 2013–2014
P E R F O R M A N C E M E A S U R E S
In support of our vision, mission, and key business goals, the Board of Directors and management of BC Ferries have implemented comprehensive long-term operational performance measures to monitor the progress of the business and its ongoing commitment to continuous improvement. These and other measures are described more fully in the company’s Business Plan, which is available at http://www.bcferries.com/investors/business_plans.html
The safety of our passengers and employees is our primary focus:
1 Employee Safety (employee injury frequency rate X severity rate divided by 1000)
2 Passenger Safety (number of passenger injuries per one million passengers)
Fiscal 2012 Fiscal 2013 Fiscal 2014 Fiscal 2015
actual Target actual Target actual Target Target
Employee Safety 1.341 1.31 1.04 1.22 0.67 0.90 0.55
Passenger Safety 15.31 18.11 13.28 15.45 13.28 13.49 10.73
Other important areas of focus include:
3 Reliability (actual round trips divided by scheduled round trips, less weather, medical or rescue related cancellations)
4 Customer Satisfaction Rating
Fiscal 2012 Fiscal 2013 Fiscal 2014 Fiscal 2015
actual Target actual Target actual Target Target
Reliability Index 99.76% 99.4 – 99.59% 99.75% 99.5 – 99.69% 99.71% 99.5 – 99.69% 99.5 – 99.74%
Customer Satisfaction 88% 83% 88% 88% 87% 88% 88%
1 Restated

13BRITISH COLUMBIA FERRY SERVICES INC.
Over the past 11 years, since being established as an independent company in April 2003, we have maintained a strong focus on providing a safe, reliable and efficient marine transportation service.
We have continuously sought to improve this service, as witnessed by our performance measures. A significant portion of this effort has been directed to the replacement of many aged assets, resulting in more than $2 billion worth of investments over the past 11 years. We have brought seven new vessels into service, upgraded 19 others, made numerous improvements to terminals and marine structures, upgraded security, and implemented sewage pump-ashore and waste water treatment systems. These significant and necessary capital expenditures have resulted in a significant increase in net financing and amortization costs.
During fiscal 2014, we managed 169 active projects including the successful completion of 24 vessel refits, upgrades to the Tachek and Kwuna, and extensive upgrades at the Westview, Little River, and McLoughlin Bay terminals.
With the global economic downturn in 2008, we began to experience significant erosion in our traffic. This erosion, combined with significant increases in the price of fuel (150% since 2004), insurance premiums, property taxes, environmental and security regulations, utilities, benefit program rates and labour agreements has placed considerable pressure on earnings.
Without compromising safety, we have remained responsive to these challenges and maintained our focus on ensuring financial integrity. Since 2004 we have made significant improvements in our fuel consumption, which has resulted in an overall decrease in our annual consumption of 4.8%, a savings of 5.8 million litres from fiscal 2004 (a reduction of over 8.3 million litres from fiscal 2003). Over the same period, we have contained our administrative costs in absolute terms to the amount spent in 2004. When taking inflation into account, administration costs have been reduced by 17%.
($ millions) Fiscal 2004 Fiscal 2004 Fiscal 2014 actual2 Restated actual in 2014 Dollars3
Operations Costs
Labour 202 236 269
Fuel 4 50 58 126
Materials, Supplies,
Contracted Services and Other 33 39 37
Insurance 5, Property Tax,
Utilities and Credit Card Fees 10 12 21
Maintenance Expenses 84 98 636
Administration Expenses 32 37 32
Net Financing and Amortization 7 68 79 205
2 The fiscal 2004 figures for operations, maintenance and administration (OM&A) expenses have been adjusted from those figures previously reported to reflect classifications of expenses used in fiscal 2014. Total OM&A expenses for fiscal 2004 are identical to those previously reported.
3 Fiscal 2004 figures have been restated in 2014 dollars on the basis of BC CPI.
4 Fuel reflects the total cost of fuel net of fuel price hedging, gains or losses.
5 Insurance includes gains or losses from our subsidiary, BCF Captive Insurance Company Ltd.
6 Vessel major overhauls and inspections (MOI) were previously expensed as maintenance; under IFRS, they are capitalized and expensed over their expected life through amortization. For fiscal 2014, under previous GAAP, $39 million in MOI would have been expensed to maintenance increasing total maintenance to $102 million.
7 Net financing includes financing for the Kuper owned by our subsidiary Pacific Marine Leasing Inc.
Looking forward, we will continue to pursue opportunities to minimize costs and work towards replacing or life-extending 11 of our aged vessels over the next 10 years. These replacements present us with the opportunity to build standardized vessels to provide interoperability and design optimization. Complementing these initiatives is the opportunity to incorporate new technologies, such as liquefied natural gas engines. Liquefied natural gas is not only currently over 50% cheaper than marine diesel, it is also better for the environment.
During fiscal 2015, we will be providing the British Columbia Ferries Commissioner (the Commissioner) with our fourth performance term submission. This submission will inform the Commissioner of the operating and capital investments required to ensure ongoing safe and reliable service. This will include several efficiency strategies we anticipate implementing in the coming years. Pursuant to the Coastal Ferry Act, the Commissioner will be seeking public comment on our submission.
We will also continue to work with the Province on service level adjustments and a long term vision for connecting coastal communities. This work will assist with us with decision making as we work towards replacement of our vessels and marine structures, terminal improvements and information system investments.
K E Y C O S T D R I V E R S

14 ANNUAL REPORT 2013–2014
HIGHLIGHTS• Overall Customer Satisfaction Rating of 87 per cent • Carried almost 22 million passengers on 183,000 sailings • Reduced employee injuries by 22 per cent • Conducted 15,500 Personal Training Days
MANAGEMENT’S DISCUSSION & ANALYSIS
Management’s Discussion & Analysis of Financial Condition and Results of Operations 16
Consolidated Financial Statements 81
Corporate Directory 113
15BRITISH COLUMBIA FERRY SERVICES INC.

M A N A G E M E N T ’ S D I S C U S S I O N & A N A L Y S I S
Significant events during or subsequent to fiscal 2014 include
the following:
• On July 24, 2013, we completed the redemption of all
$140 million of our outstanding Series 08-2 Bonds, formerly due
December 19, 2013. This debt management initiative to reduce
our interest costs in the short term was funded with $55 million
from cash on hand and $88 million in draws on our credit facility.
Due to this early redemption, we saved approximately $0.3 million
in net interest costs in fiscal 2014.
• On October 25, 2013, we completed a private placement of
$200 million of 30-year senior secured bonds with accredited
investors. These bonds bear interest at a rate of 4.702% per
annum, payable semi-annually. This issuance was partially related
to the early redemption of our $140 million Series 08-2 Bonds.
The net proceeds of this new issue were used to repay indebtedness
under our credit facility, fund the debt service reserve related
to these bonds, and will partially fund capital expenditures, and
provide funding for general corporate purposes. These bonds
were rated “A” (DBRS) and “A+” Standard & Poor’s (S&P).
• On January 17, 2014, due to the rising cost of fuel, we
implemented a fuel surcharge of 3.5% on average on our
Major Routes and our regulated Other Routes. No surcharges
were put in place on our unregulated or Northern Routes.
• On February 20, 2014, in response to our December 20, 2013
application, we received a decision from the British Columbia
Ferries Commissioner (the Commissioner) confirming that the
proposed expenditures to implement the cable ferry system on the
route connecting Buckley Bay and Denman Island are reasonable
and prudent. This decision included reasonable conditions which
we are confident we will be able to meet. (See “Outlook – Asset
Renewal Program” below for more detail.)
DATED JUNE 20, 2014The following is our discussion and analysis of the financial condition
and financial performance for British Columbia Ferry Services Inc.
(BC Ferries) as of June 20, 2014. This discussion and analysis should
be read in conjunction with our audited consolidated financial
statements and related notes for the years ended March 31, 2014
(fiscal 2014) and March 31, 2013 (fiscal 2013). These documents are
available on SEDAR at www.sedar.com and on our investor webpage
at http://www.bcferries.com/investors/financial_reports.html.
Except where indicated, all financial information herein is expressed
in Canadian dollars and determined on the basis of International
Financial Reporting Standards (IFRS).
BUSINESS OVERVIEWBritish Columbia Ferry Services Inc. is an independent company
providing passenger and vehicle ferry services on the west coast of
British Columbia. We operate one of the largest and most complex
ferry systems in the world. In fiscal 2014, we provided frequent
year-round transportation service with 35 vessels operating on
25 routes out of 47 terminals spread over 1,000 miles of coastline.
We also manage ferry transportation services on other remote
routes through contracts with independent operators.
Our service is an integral part of British Columbia’s coastal
transportation system and has been designated by the Province of
British Columbia (the Province) as an essential service for purposes
of the provincial Labour Relations Code. This designation means our
services are considered necessary for the protection of the health,
safety and welfare of the residents of British Columbia.
We provide a wide range of ferry services for our customers.
During the year ended March 31, 2014, we provided over 183,000
sailings, carrying 19.7 million passengers and 7.6 million vehicles.
We experienced a 1.3% decline in vehicle traffic and a 1.1% decline in
passenger traffic in fiscal 2014 compared to the prior year. However,
we believe that after adjusting for the timing of the Easter holiday,
fiscal 2014 traffic levels were generally flat compared to fiscal 2013.
For a discussion of our traffic levels see “Financial and Operational
Overview” and “Outlook – Traffic Levels” below.
Management’s Discussion & Analysis of Financial Condition and Financial Performance for the fiscal year ended March 31, 2014
16 ANNUAL REPORT 2013–2014
M A N A G E M E N T ’ S D I S C U S S I O N & A N A L Y S I S
• On February 26, 2014, we awarded Seaspan’s Vancouver Shipyards
of North Vancouver a $15 million contract for the construction
of a new cable ferry to service Buckley Bay – Denman Island
and on March 19, 2014, we announced the award of contracts
totalling $15 million for construction of the Buckley Bay and
Denman West cable ferry berths. These contracts include an award
to Vancouver Pile Driving Ltd. for supply of two concrete floating
pontoons and an award to Ruskin Construction Ltd. of Victoria for
construction of two berths, expansion of Denman West holding
compound and all associated upland development. (See “Outlook -
Asset Renewal Program” below for more detail.)
• On April 1, 2014, we implemented average tariff increases
in accordance with the Commissioner’s Order 12-02 dated
September 30, 2012. Tariff increases were 4.2% on average on
our Major and regulated Other Routes. On the Northern Routes,
we increased fares by less than 2% on average and eliminated
the incremental tariff for over-height vehicles. These increases are
directly associated with increased operating costs, notably fuel,
capital replacement and labour.
• On April 28, 2014, we completed a private placement of
$200 million of 30-year senior secured bonds with accredited
investors. These bonds bear interest at a rate of 4.289% per
annum, payable semi-annually. The net proceeds of this new issue,
together with additional cash on hand, were used to repay our
$250 million bond Series 04-1, which matured on May 27, 2014,
and to fund the debt service reserve related to these bonds.
These bonds were rated “A” (DBRS) and “AA-” (S&P). We secured
a favourable interest rate by entering into interest rate hedges.
The effective rate of this issue, net of hedging, is 4.5%, the lowest
effective bond interest rate in the 11-year history of our company.
• On April 28, 2014, after six weeks of community consultation,
feedback and further analysis of schedule refinement options,
we implemented new schedules for the Northern and Other
Routes to achieve a net savings of $14 million over the remainder
of performance term three (PT3), which ends March 31, 2016.
These new schedules relate to the service reductions outlined by
the Province to better align service levels to demand, and to ensure
the coastal ferry system is affordable, efficient and sustainable.
In accordance with the Province’s decision, we also implemented
a reduction of the 100% passenger fare discount for BC seniors
travelling Monday to Thursday to 50% on the Major and
Other Routes effective April 1, 2014. (See “Corporate Structure –
Economic Regulatory Environment” below for more detail.)
CORPORATE STRUCTURE
Coastal Ferry serviCes ContraCt
We operate ferry services under a regulatory regime established by
the Coastal Ferry Act (the Act), and under the terms set out in the
Coastal Ferry Services Contract (CFSC) between BC Ferries and the
Province. This 60-year services contract with the Province, which
commenced April 1, 2003, stipulates, among other things, the number
of round trips that must be provided for each regulated ferry service
route in exchange for specified fees (ferry transportation fees).
The CFSC has been amended from time to time. (See discussion below).
Under the terms of the CFSC, we also receive an annual amount
from the Province based on its agreement with the Government of
Canada to fulfill the obligation of providing ferry services to coastal
British Columbia. The amount of this payment is adjusted annually
based on the Consumer Price Index (CPI) (Vancouver).
eConomiC regulatory environment
The office of the Commissioner was created under the Act, enacted
by the Province on April 1, 2003. The Commissioner establishes price
caps for designated ferry route groups for the purpose of regulating our
tariffs. The Commissioner is also responsible for regulating the reduction
of service, discontinuance of routes and certain other matters.
17BRITISH COLUMBIA FERRY SERVICES INC.

M A N A G E M E N T ’ S D I S C U S S I O N & A N A L Y S I S
PT3 Preliminary Price caP increases
In March 2011, the Commissioner set preliminary price cap increases
for each of the four years of PT3 of 4.15% on the three Major Routes
and 8.23% on all other regulated routes, effective April 1, 2012.
In making these determinations, the Commissioner excluded certain
forecasted costs and incorporated a productivity challenge effectively
further reducing our allowed costs.
Bill 14
On June 2, 2011, the Coastal Ferry Amendment Act, 2011 (Bill 14)
was enacted. Effective April 1, 2012, for the first year of PT3, Bill 14
established a price cap increase for each route group of 4.15% from
the weighted average of the tariffs in place at March 31, 2012 as
established by the Commissioner. The Province agreed to compensate
us for the reduction in the price cap set forth in the Commissioner’s
preliminary price cap order. The value of this price cap change was
$11.5 million, which the Province agreed to provide as part of the
$21.5 million increase in transportation fees for fiscal 2013 detailed
below. In response to the price cap increases, we implemented tariff
increases up to the new levels authorized. Bill 14 also provided that
the Commissioner establish price caps for the balance of PT3.
Bill 14 also provided the Commissioner with the mandate to conduct
a review of the Act before issuance of his final decision on price caps
for the balance of PT3.
commissioner’s review of The acT
On January 24, 2012, the Commissioner issued a report to the
Province as to how the Act could be amended to balance the interests
of ferry users with the financial sustainability of our company.
The report states:
“Amongst the publicly-owned [ferry] systems, BC Ferries appears
to be relatively efficient based on the analysis. Indeed, many ferry
operators appear to want to emulate some of BC Ferries’ practices.
The company compares well with farebox recovery and ancillary
revenue. Costs appear to be reasonable based on a number of
independent reviews and on substantial improvement in several
areas since 2003.”
The Commissioner’s report made 24 substantive recommendations
covering a wide range of ferry related issues and is available on the
Commissioner’s website at www.bcferrycommission.com.
Bill 20
On June 24, 2010, the Province enacted Miscellaneous Statutes
Amendment Act (No. 3), 2010 (Bill 20), amending several statutes
including the Act. The amendments responded to the Comptroller
General’s Report on Review of Transportation Governance Models
released November 6, 2009 and included changes to the governance
and regulatory framework within which we operate.
Among other things, Bill 20 amendments to the Act changed the
mandate of the B.C. Ferry Authority (the Authority) to include:
responsibility for the compensation plans of our directors and certain
executive officers, such compensation plans to be comparable to
public sector organizations; a requirement that a director of the
Authority cannot also be a director of BC Ferries; and the subjection
of the records of the Authority and BC Ferries to the Freedom of
Information and Protection of Privacy Act.
The amendments also expanded the regulatory responsibilities of the
Commissioner to include: consideration of the interests of ferry users;
regulation of our reservation fees; approval and public disclosure
of our process for handling customer complaints; and review and
public disclosure of our ten year capital plan, our plan for improving
efficiency in the next performance term, and our methodology for
allocating costs among the regulated routes. These amendments also
broadened the Commissioner’s role in regulating ferry transportation
services where the Commissioner determines that we have an unfair
competitive advantage. The amendments have also modified the
process by which the Commissioner regulates our activities in seeking
additional or alternative service providers on our regulated routes and
require the Commissioner to issue an opinion on our performance
and that of the Authority in carrying out our respective legislated
responsibilities, as well as our performance in relation to the CFSC.
PT2 Price caP increase
On April 1, 2011, during the final year of PT2, the price cap authorized
by the Commissioner increased by 2.7% plus 0.49 times the latest
reported annual change in the CPI (British Columbia) on the three
Major Routes connecting Metro Vancouver with mid and southern
Vancouver Island and 5.7% plus 0.73 times the change in the CPI
(British Columbia) on all other regulated routes. This translated into
a price cap increase of 3.38% on those three Major Routes and
6.71% on all other regulated routes. These price cap increases
reflected a change in the CPI (British Columbia) of 1.39% applied
April 1, 2011.
18 ANNUAL REPORT 2013–2014

M A N A G E M E N T ’ S D I S C U S S I O N & A N A L Y S I S
Bill 47
In May 2012 and in response to the Commissioner’s report, the
Province enacted Bill 47. The amendments to the Act set forth in
Bill 47 were designed to move toward striking a balance among the
interests of ferry users, the interests of taxpayers and the sustainability
of the ferry operator. The changes cover a wide range of ferry related
issues including:
• Allowing cross subsidization from the Major Routes to other routes;
• Changing the primary responsibility of the Commissioner from
priority placed on the financial sustainability of the ferry operations
to responsibility to protect the interests of ferry users, the interests
of taxpayers, and the financial sustainability of the ferry operator;
• Expanding the Commissioner’s authority and responsibilities,
to include:
– The authority to permanently reduce service in a manner
and to a level consistent with the CFSC;
– The authority to order a temporary or permanent service
reduction and/or deferral of a planned capital expenditure
in response to an extraordinary situation, in addition to or
instead of an approval of extraordinary price cap increases;
– The ability to require us to seek the Commissioner’s approval
in advance of making certain capital expenditures;
– The responsibility to set price caps sufficient to enable us to
meet our debt obligations and maintain access to borrowing
rates that in the opinion of the Commissioner are reasonable;
– Specific legislative authority to establish the deferred fuel cost
accounts and the terms and conditions for their use, including
fuel surcharges or rebates; and
– The authority to conduct routine performance reviews
and to require us to review our policies and undertake
public consultation.
ferry TransPorTaTion fees
Together with the introduction of amendments to the Act contained
in Bill 47, the Province announced additional payments totalling
$79.5 million in order to reduce the pressure for future fare and
price cap increases. The first payment of $25.0 million, approved on
March 30, 2012, was received on April 20, 2012 as a contribution
to our equity, leaving a balance of $54.5 million to be received
throughout PT3. In fiscal 2013, we received $21.5 million (which
included $11.5 million as compensation for price cap adjustments
as detailed above) and in fiscal 2014, we received $10.5 million.
A further $11.0 million will be received in fiscal 2015 and $11.5 million
in fiscal 2016.
cfsc amendmenTs
Amendments to the CFSC, agreed to with the Province and effective
April 1, 2012, included:
• Grouping our route connecting Horseshoe Bay and Langdale
with the three Major Routes connecting Metro Vancouver with
mid and southern Vancouver Island;
• A reduction of up to 400 round trips in the minimum service
requirement on our Major Routes as well as principles and targets
for further service level reductions system wide;
• Implementation of principle-based service adjustments to achieve
$30 million in net savings over PT3. These are detailed below
and included:
– Reductions in round trips already identified on three of our
Major Routes reflecting a net savings of $4 million; and
– Service adjustments to be determined on regulated routes to
achieve an additional $26 million in net savings over PT3; and
• Ferry transportation fee enhancements of $54.5 million through
PT3 as detailed above.
19BRITISH COLUMBIA FERRY SERVICES INC.

M A N A G E M E N T ’ S D I S C U S S I O N & A N A L Y S I S
In response to the agreed reduction in the minimum service
requirement on our Major Routes identified above, we implemented
reductions in round trips on three of our Major Routes where the
traffic levels no longer warranted extra service or where service
was significantly under-utilized. Over PT3, these reductions are
expected to result in $4 million in operating cost reductions from fuel
savings and reduced requirements for casual employees during the
off-season. There will be no reduction in our regular workforce.
These identified reductions equate to 1% of our annual round trips
on these routes. Further adjustments to service levels, as identified
above, were required in order to attain the total objective of
$30 million in net savings and these adjustments have resulted from
the Province’s consultation process discussed below.
PuBlic consulTaTion
In May 2012, the Province announced that it would conduct public
consultation with ferry dependent communities about adjustments
to service levels and trade-offs between service adjustments, fare
increases and potential community contributions. The Province also
announced that it would seek public input to develop strategies to
support a long-term vision for connecting coastal communities.
This process concluded on December 21, 2012 and on March 5, 2013,
the Province released its report summarizing the input it received
during this consultation and engagement process. The report can be
found at www.coastalferriesengagement.ca. We provided technical
assistance and subject matter support throughout this process.
On November 18, 2013, the Province announced its service level
reduction plan to better align service levels with demand and on
February 5, 2014, after further public consultation, the Province
confirmed implementation of this plan, designed to achieve the
remaining $18.9 million (see CFSC amendments below) in net savings
over the remainder of PT3. The plan included the elimination of
approximately 6,900 round trips over 15 routes, including a significant
adjustment in how summer service is provided to mid-coast
destinations. The Province also confirmed its intention to reduce the
100% passenger fare discount for BC seniors travelling Monday to
Thursday to 50% on the Major and Other Routes as of April 1, 2014
and its proposal to proceed with a gaming pilot project on one of our
Major Routes.
furTher cfsc amendmenTs
On March 31, 2013, we reached an agreement with the Province
to amend the CFSC to consolidate all regulated routes into a single
group effective April 1, 2013. This revised grouping will be in effect
until March 31, 2016. In the absence of any further amendments,
on April 1, 2016, the route group structure in the CFSC will revert
back to the structure at March 31, 2013.
On April 3, 2013, an amendment to the CFSC extended the deadline
for identifying service level adjustments for the remainder of PT3 in
order to provide sufficient time to complete its consultation process
discussed above. As compensation for the delay in identifying service
level adjustments, the Province also agreed to pay us $7.1 million in
ferry transportation fees in 9 equal monthly instalments commencing
July 2013. The balance of the $26 million in service reductions
required over the remainder of the performance term ($18.9 million)
was to be determined by March 31, 2014.
On March 31, 2014, an amendment to the CFSC removed the
Northern Route that provided supplementary service to mid-coast
destinations, resulting in a significant adjustment in how summer
service is provided. The amendment also confirmed the net savings
of $30 million over PT3 of which:
• $4.0 million were reductions in annual round trips on three
of the Major Routes;
• $7.1 million received from the Province as a result of the
extended deadline;
• $14.0 million in reductions in annual round trips on Northern
and Other Routes; and
• $4.9 million in further reductions in annual round trips on three
of the Major Routes.
The amendment confirmed the 100% discount for BC seniors
travelling Monday to Thursday is reduced to 50% on the Major and
Other Routes effective April 1, 2014. In respect of the corresponding
reduction in social program funding and to reduce the magnitude of
future tariff increases, the amendment also confirmed a maximum
increase in ferry transportation fees of $18.0 million in fiscal 2015
and $19.3 million in fiscal 2016. The discount for BC seniors on the
Northern Routes remains unchanged at 33% every day.
20 ANNUAL REPORT 2013–2014

M A N A G E M E N T ’ S D I S C U S S I O N & A N A L Y S I S
commissioner’s orders
On September 30, 2012, the Commissioner issued Order 12-02 which
established the final price caps for the remaining three years of PT3.
Increases for each route group were: 4.1% at April 1, 2013; 4.0% at
April 1, 2014; and 3.9% at April 1, 2015, averaging 4.0% per annum.
The order states “… the commissioner has established price caps with
the intention of allowing the ferry operator to achieve by the end of
the third performance term equity not lower than 17.5 per cent of
total capitalization and a Debt Service Coverage Ratio (“DSCR”) of 2.5
or higher.”
In addition, the Commissioner reset the price caps for each route
group to an index level of 100 as of April 1, 2012 based on
the weighted average tariffs that existed as of March 31, 2012.
The established price caps incorporate efficiency targets of
$54.2 million, over and above the benefits associated with any service
level adjustments, to be achieved by us over the four years of PT3.
In his order, the Commissioner stated “The price caps have
been determined based on the expectation that the CFSC will be
amended by June 30, 2013 to implement service level adjustments
to achieve net savings of $30 million during PT3. If the CFSC is
not amended by June 30, 2013, or the amendments will not enable
BC Ferries to achieve the target of $30 million in net savings,
BC Ferries may apply for relief under section 42 of the Act.”
On April 15, 2013, the Commissioner issued Order 12-02A, reducing
the service level adjustments to achieve a total of $22.9 million in
net savings during the remainder of PT3, to reflect the $7.1 million
received from the Province. He also acknowledged the reduction
of $4 million in service reductions already implemented with
$18.9 million yet to be identified.
On September 30, 2012, the Commissioner issued Order 12-03
establishing the terms and conditions for the continued use of fuel
price deferral accounts including the per litre cost of fuel included
in the determination of price caps (the set price) for PT3. This was in
response to our application filed in June 2012 seeking approval to
establish a new fuel cost deferral mechanism under section 41.1 of
the amended Act. On February 28, 2013, Order 12-03A was issued
to extend the submission date for annual fuel reports to no later than
90 days after the end of the fiscal year.
On September 30, 2012, the Commissioner also issued Order 12-04
establishing the criteria for determining major capital expenditures
which require advance approval from the Commissioner.
On July 19, 2013, the Commissioner approved our application to
construct three new intermediate class vessels to replace the 49-year-old
Queen of Burnaby and the 50-year-old Queen of Nanaimo. Both of
these vessels are scheduled for retirement in 2016. (See “Outlook –
Asset Renewal Program” below for more detail.)
On February 20, 2014, in response to our December 20, 2013
application, the Commissioner confirmed that the proposed
expenditures to implement the cable ferry system on our route
connecting Buckley Bay and Denman Island are reasonable and
prudent. This decision included reasonable conditions which we are
confident we will be able to meet. (See “Outlook – Asset Renewal
Program” below for more detail.)
On March 20, 2014, the Commissioner approved a one-time transfer
of the March 31, 2014 balance of tariffs in excess of price cap to
reduce the deferred fuel cost account balance. (See “The Effect of
Rate Regulation” below for more detail.)
The Commissioner’s orders can be viewed at www.bcferrycommission.com.
21BRITISH COLUMBIA FERRY SERVICES INC.

M A N A G E M E N T ’ S D I S C U S S I O N & A N A L Y S I S
the eFFeCt oF rate regulation
We are regulated by the Commissioner to ensure, among other things, that our tariffs are fair and reasonable. Under the terms of the Act, the
tariffs we charge our customers over a performance term are subject to price caps set by the Commissioner. The Commissioner may, under certain
circumstances, allow increases in price caps over the set levels. Certain decisions and orders of the Commissioner may give rise to assets or liabilities.
Regulatory assets generally represent incurred costs that are probable of future recovery in tariffs or fuel surcharges. Regulatory liabilities represent
obligations to customers which will be settled through future tariff reductions or fuel rebates.
IFRS does not have a standard for rate-regulated activities and, therefore, does not permit us to report in our financial statements, the assets and
liabilities that result from the regulated price cap setting process, such as our deferred fuel cost accounts. Rather than being charged to regulatory asset
accounts on our Statements of Financial Position, fuel surcharges collected or rebates granted are included in revenue, and increases or decreases in fuel
prices from those approved in price caps are included in operating expenses. These items are treated as assets and liabilities for regulatory purposes.
We continually assess whether our regulatory assets are probable of future recovery by considering such factors as applicable regulatory changes.
We believe the regulatory assets at March 31, 2014 are probable of future recovery and that the obligations as represented by the regulatory liabilities
will be settled through future tariff reductions. These regulatory assets and regulatory liabilities are detailed in note 20 to our audited consolidated
financial statements.
If IFRS permitted us to report regulatory assets and liabilities in our financial statements, the effect on our Statements of Comprehensive (Loss) Income
for the quarter and year ended March 31, 2014 and 2013 would be as follows:
Three months ended year ended
march 31 march 31
($ millions) 2014 2013 2014 2013
Total comprehensive (loss) income (43.3) (36.0) 13.1 16.6
regulatory asset or liability statement line item
Deferred fuel costs(a)
Fuel costs incurred Operations expense 4.7 3.0 14.5 11.3
Fuel surcharges collected Fuel surcharge revenue (2.7) – (2.7) (11.5)
Payments from the Province Ferry transportation fees (0.8) (0.9) (3.0) (2.5)
1.2 2.1 8.8 (2.7)
Tariffs in excess of price cap(b)
Obligation settled (incurred) during the period Tariff revenue 0.5 – (1.2) 2.5
Performance term submission costs(c) Amortization expense – – (0.1) (0.1)
increase (decrease) in total comprehensive income 1.7 2.1 7.5 (0.3)
adjusted total comprehensive (loss) income (41.6) (33.9) 20.6 16.3
(a) Deferred fuel costs: As prescribed by regulatory order, we defer differences between actual fuel costs and approved fuel costs which were used to develop the regulated price caps. The difference between the approved fuel costs and the actual fuel costs (including fuel hedge gains and losses) is deferred for settlement in future tariffs. Also, as prescribed by regulatory order, we collect fuel surcharges or provide fuel rebates from time to time which are applied against deferred fuel cost account balances.
(b) Tariffs in excess of price cap: The Act contains provisions which ensure that, if tariffs we charge exceed established price caps, the excess amounts collected will be returned to customers through future tariffs.
(c) Performance term submission costs: Costs for incremental contracted services relating to PT3. Our regulator has approved recovery of these costs over PT3.
On March 20, 2014, the Commissioner approved a one-time transfer of the March 31, 2014 balance of tariffs in excess of price cap
to reduce the deferred fuel cost account balance.
22 ANNUAL REPORT 2013–2014

M A N A G E M E N T ’ S D I S C U S S I O N & A N A L Y S I S
FINANCIAL AND OPERATIONAL OVERVIEWThis section provides an overview of our financial and operational performance for the past three fiscal years.
years ended march 31 ($ millions) 2014 2013 2012
Total revenue 800.2 786.4 753.8
% increase 1.8% 4.3% n/a*
Operating expenses 714.3 701.6 693.0
Operating profit 85.9 84.8 60.8
Net finance and other 67.9 69.3 69.8
net earnings (loss) 18.0 15.5 (9.0)
Other comprehensive (loss) income (4.9) 1.1 2.2
Total comprehensive income (loss) 13.1 16.6 (6.8)
as at march 31 2014 2013 2012
Total assets 1,885.2 1,824.3 1,836.7
Total long-term financial liabilities 1,127.3 1,199.8 1,349.6
Dividends on preferred shares 6.0 6.0 6.0
*We commenced reporting our financial position and financial performance under IFRS as of April 1, 2012 and comparable results are not available for fiscal 2011.
Our total comprehensive income in fiscal 2014 was $3.5 million lower and net earnings were $2.5 million higher than in fiscal 2013. The increase in
fiscal 2014 net earnings reflect the effects of increased fares and lower financing costs, partially offset by lower traffic levels and lower transportation
fees, while maintaining our cost containing initiatives. The other comprehensive loss in fiscal 2014 reflects a $5.0 million unrealized hedge loss as at
March 31, 2014 on interest rate forward contracts related to our April 28, 2014 issuance of $200 million of senior secured bonds. (See “Liquidity and
Capital Resources – Long-Term Debt” below for more detail.)
Our total comprehensive income in fiscal 2013 was $23.4 million higher and net earnings were $24.5 million higher than in fiscal 2012. The increase
in fiscal 2013 net earnings reflect the effects of increased fares and higher ferry transportation fees, partially offset by lower traffic levels, while
maintaining our cost containing initiatives.
23BRITISH COLUMBIA FERRY SERVICES INC.

M A N A G E M E N T ’ S D I S C U S S I O N & A N A L Y S I S
traFFiC
Prior to fiscal 2009, our traffic levels were relatively stable. However,
the long-term traffic trend-line shifted significantly during fiscal 2009,
when vehicle and passenger traffic were lower than the prior year
by 5.2% and 4.9%, respectively. In fiscal 2009, the Canadian and
world economies experienced turbulence in the financial markets,
followed by a lengthy recessionary period. These economic conditions
negatively impacted our commercial and discretionary travel markets.
In fiscal years 2010 through 2013, we experienced an overall general
decline in traffic due in part to these economic conditions.
In fiscal 2014, we experienced a 1.3% decline in vehicle traffic and a
1.1% decline in passenger traffic compared to fiscal 2013. We believe
that fiscal 2014 traffic was negatively impacted by the timing of the
Easter holiday. Fiscal 2014 included one day of the Easter holiday
weekends (April 1, 2013), while fiscal 2013 included seven days of
Easter holiday weekends (April 6 through 9, 2012 and March 29
through 31, 2013). We believe that, adjusting for the timing of the
Easter holiday, fiscal 2014 traffic levels were generally flat compared
to fiscal 2013.
The following graph illustrates our annual vehicle and passenger
traffic levels from fiscal 2010 through fiscal 2014:
0
5,000
10,000
15,000
20,000
25,000
TRA
FFIC
VO
LUM
E (T
HO
USA
ND
S)
FISCAL YEAR
2010 2011 2012 2013 2014
VEHICLES PASSENGERS
Cost Containment
In response to the decline in traffic levels and resulting revenues that
began in fiscal 2009, we determined the need to restructure our
business to align expenses with reduced revenues while continuing
to ensure that safety remains our top priority. We carried out this
restructuring in addition to deferral of filling staff vacancies and
a hiring freeze for all non-essential positions, a two-year wage
and salary freeze for exempt employees, reduced use of outside
contractors and consultants, and reduction of discretionary
expenditures. We have continued many of these cost containment
measures, managing our costs as prudently as possible without
compromising safe operations. Our operating expenses, excluding
fuel costs, were $13.3 million below previously planned levels as
published in our annual Business Plan for fiscal 2014.
To better align service levels to demand, the CFSC was amended
in fiscal 2014 to reduce the number of annual round trips required
on our Major Routes which, over PT3, is expected to result in
$4 million in operating cost reductions from fuel savings and reduced
requirements for casual employees during the off-season. Further
amendments to sailing schedules on the Northern and Other Routes
have been implemented in fiscal 2015 and additional amendments
on the Major Routes are planned for fiscal 2016. In total, service level
changes are expected to result in $22.9 million in cost reductions
over PT3. In addition to these service level adjustments, our
established price caps incorporate efficiency targets of $54.2 million
over PT3. We are currently on pace to meet these targets.
(See “Corporate Structure – Economic Regulatory Environment”
above for more detail.)
24 ANNUAL REPORT 2013–2014

M A N A G E M E N T ’ S D I S C U S S I O N & A N A L Y S I S
Specific areas of focus remain as:
• Reinforcing the role of safety committees;
• Continuous improvement in the process to report a potential
hazard or situation which could cause injury or harm to a person,
damage to equipment, or damage to the environment. These
reports are referred to as ALERTs, which is an acronym for “All
Learning Events Reported Today”;
• Building and maintaining awareness of safety through communication;
• Developing strong safety teams; and
• Monitoring action plans previously implemented.
In fiscal 2014, we received the Certificate of Recognition (COR)
from WorkSafeBC. A COR recognizes companies that go beyond
the legal requirements of the Workers’ Compensation Act and the
Occupational Health & Safety Regulations by taking a best practices
approach to implementing health, safety and return to work
programs. Strengths and weaknesses in nine specific areas were
audited, revealing a 90% score in Health and Safety and 91% in Injury
Management. We were also provided with 31 recommendations
which we are in the process of reviewing and implementing, with
a view toward continual improvement. In June 2014, WorkSafeBC
provided us with a $600,000 rebate on our 2013 assessed premiums.
Besides confirming our workforce is safer and healthier, we expect
this COR will result in on-going premium savings in the order of
$500,000 annually.
In fiscal 2014, we also received other awards including the
International Award for Inspiring Safety from Lattitude Productions
in the United Kingdom and a Lloyd’s List Safety Training award for
our training programs (see below). In addition, we were also a finalist
in the Lloyd’s List Safety and Technical Innovation award categories.
saFety
Overall, injuries to employees and passengers continue to decline
and we are experiencing the benefits of our investments in safety
and security. In fiscal 2014, time loss injuries declined by 22%
compared to fiscal 2013. Since 2007, the number of time loss injuries
we experienced each year has dropped from over 360 to just over
140 and the number of days lost due to injury has declined from over
12,000 per year to under 5,500 per year. The results for fiscal years
2007 through 2014 are illustrated below:
emPloyee safeTy Performance
0
50
100
150
200
250
300
350
400
450
500 15,000
13,500
12,000
10,500
9,000
7,500
6,000
4,500
3,000
1,500
0
NU
MB
ER O
F TI
ME
LOSS
INJU
RIE
S
NU
MB
ER O
F D
AY
S LO
ST
TIME LOSS INJURIES DAYS LOST
2007 2008 2009 2010 2011 2012 2013 2014
FISCAL YEAR
In addition, this commitment has resulted in close to a 40% reduction
in the number of passenger injuries in the past four years.
Our SailSafe program, which is designed to achieve world class
safety performance, is in the sustainment phase. It transitioned at
the beginning of fiscal 2013, from the implementation of a safety
program to embodying safety as a normal part of all business
activities and an integral part of our culture. The ultimate goal of
SailSafe is for the program itself to no longer be necessary, as safety
becomes completely ingrained in every activity undertaken, every day,
throughout our business.
25BRITISH COLUMBIA FERRY SERVICES INC.

M A N A G E M E N T ’ S D I S C U S S I O N & A N A L Y S I S
training
In fiscal 2014, 15,500 personal training days (PTDs) were conducted,
inclusive of operational training, Bridge Team Simulation (BTS)
training, and Standardized Education and Assessment (SEA) training.
This is significantly higher than the 11,477 PTDs conducted in fiscal
2013, mainly due to the rollout of several new SEA programs.
A portion of the increase in PTDs is also a result of the transition
from on-the-job training to our formalized training programs.
Our SEA program replaces the traditional job-shadowing approach
to vessel and terminal familiarization training with a blended learning
approach being delivered by dedicated SEA trainers. The program
leverages technology and e-learning to enhance hands-on training
in a phased, auditable and sustainable manner. This program is an
innovative, award-winning approach that is transforming training
in the marine industry through the use of technology. Fiscal 2014
focused on enhancements to existing programs as well as the
development and roll-out of several new programs. Since inception
of the SEA project, programs have been developed and rolled out
for 23 of the 32 operational positions identified for SEA training.
Programs for the remaining nine positions will be implemented over
the next two fiscal years. We also delivered 20 trainer workshops
in fiscal 2014 to assist trainers preparing to deliver SEA training.
The operational training centre at our fleet maintenance unit is fully
functioning and over the last year provided training facilities for over
300 days of requisite Rescue Boat and Survival Craft training, in
addition to providing facilities for other training events and meetings.
The more than 60 operational training programs continue to focus on
preparing new and existing employees to be successful in their jobs,
and to provide requisite skills and knowledge to our employees.
In fiscal 2014, the specific areas of training which targeted the largest
numbers of employees included first aid, ship safety, passenger
safety and specialized training for the fleet’s various evacuation
systems. Safety education continues through various other programs
including safe food handling and prevention of workplace violence.
Our instructors are employees who lead courses in their area
of expertise. To support these instructors, we provide education,
including the first level of the Provincial Instructor’s program, an
on-line trainer forum, and other initiatives.
Our BTS program is delivering enhanced bridge team skills training
and continues to receive praise from participants. We received
international recognition of our signature course, Bridge Operations
Skills and Systems (BOSS) 2, which received a Lloyd’s List Safety
Training award for outstanding commitment in training our employees
ashore and at sea. Building on BOSS 1 principles, BOSS 2 focuses on
gaining, maintaining and enhancing shared bridge team situational
awareness. BOSS 2 includes a blended approach of simulation
and classroom learning over three days and culminates in a team
assessment to assist with students’ learning transfer back to the fleet.
As of March 31, 2014, 85% of deck officers in the fleet have received
BOSS 1 training and 26% of deck officers in the fleet have received
BOSS 2 training. Post training support vessel visits by BTS instructors
continue to assess the degree of learning transfer of BOSS principles
into the workplace. In addition, seminars on communication and
teamwork have been delivered to several departments.
Customer serviCe
In fiscal 2014, our on-time performance rate was 91.5% with a fleet
reliability score of 99.7%. This reliability score means that only 0.3%
of sailings in fiscal 2014 were cancelled due to mechanical issues
related to the vessels or terminals or crew availability. Improvements in
on-time departure rates and reliability scores over the past few years
were reflected in the results of our 2013 Customer Service Satisfaction
Tracking Surveys which indicated that 87% of customers surveyed
reported being satisfied with their overall trip experience. This rating
has remained stable from the 2011 results and is several points higher
than the 82% rating received in 2003. Ratings remain high in all areas
except for those relating to customer satisfaction with value received
relative to the associated cost. A copy of the full report for each year
is available at http://www.bcferries.com/about/cst_archive.html.
fleeT on Time Performance
70
75
80
85
90
95
100
% OF SAILINGS WITHIN 10 MINUTES OF SCHEDULED SAILING TIME
20072006 2008 2009 2010 2011 2012 2013 2014
FISCAL YEAR
26 ANNUAL REPORT 2013–2014
M A N A G E M E N T ’ S D I S C U S S I O N & A N A L Y S I S
REVENUEThe following discussions of revenue are based on IFRS results with reference to the impacts
of rate regulation. Results throughout reflect the amended CFSC which, effective April 1, 2012,
includes the route connecting Horseshoe Bay and Langdale with the Major Routes and, as
a consequence, this route has been removed from Other Routes and included in Major Routes
in our discussions below for all years shown.
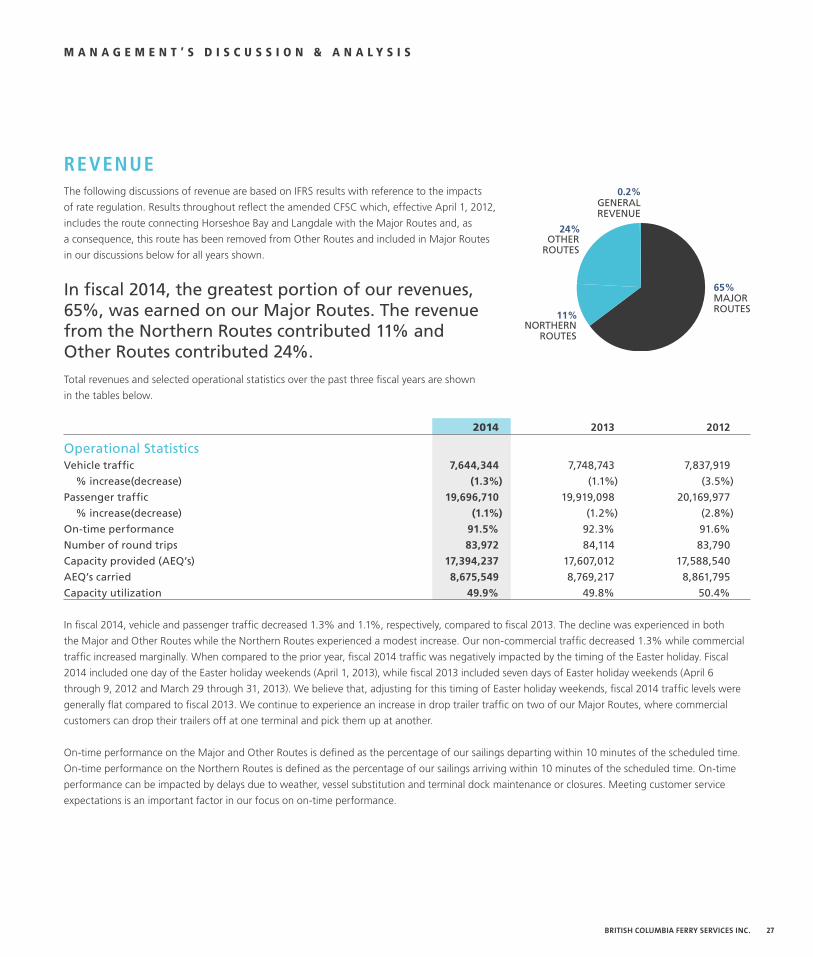
In fiscal 2014, the greatest portion of our revenues, 65%, was earned on our Major Routes. The revenue from the Northern Routes contributed 11% and Other Routes contributed 24%.Total revenues and selected operational statistics over the past three fiscal years are shown
in the tables below.
2014 2013 2012
Operational StatisticsVehicle traffic 7,644,344 7,748,743 7,837,919
% increase(decrease) (1.3%) (1.1%) (3.5%)
Passenger traffic 19,696,710 19,919,098 20,169,977
% increase(decrease) (1.1%) (1.2%) (2.8%)
On-time performance 91.5% 92.3% 91.6%
Number of round trips 83,972 84,114 83,790
Capacity provided (AEQ’s) 17,394,237 17,607,012 17,588,540
AEQ’s carried 8,675,549 8,769,217 8,861,795
Capacity utilization 49.9% 49.8% 50.4%
In fiscal 2014, vehicle and passenger traffic decreased 1.3% and 1.1%, respectively, compared to fiscal 2013. The decline was experienced in both
the Major and Other Routes while the Northern Routes experienced a modest increase. Our non-commercial traffic decreased 1.3% while commercial
traffic increased marginally. When compared to the prior year, fiscal 2014 traffic was negatively impacted by the timing of the Easter holiday. Fiscal
2014 included one day of the Easter holiday weekends (April 1, 2013), while fiscal 2013 included seven days of Easter holiday weekends (April 6
through 9, 2012 and March 29 through 31, 2013). We believe that, adjusting for this timing of Easter holiday weekends, fiscal 2014 traffic levels were
generally flat compared to fiscal 2013. We continue to experience an increase in drop trailer traffic on two of our Major Routes, where commercial
customers can drop their trailers off at one terminal and pick them up at another.
On-time performance on the Major and Other Routes is defined as the percentage of our sailings departing within 10 minutes of the scheduled time.
On-time performance on the Northern Routes is defined as the percentage of our sailings arriving within 10 minutes of the scheduled time. On-time
performance can be impacted by delays due to weather, vessel substitution and terminal dock maintenance or closures. Meeting customer service
expectations is an important factor in our focus on on-time performance.
MAJORROUTES
0.2%
65%
11%NORTHERN
ROUTES
GENERALREVENUE
OTHERROUTES
24%
27BRITISH COLUMBIA FERRY SERVICES INC.
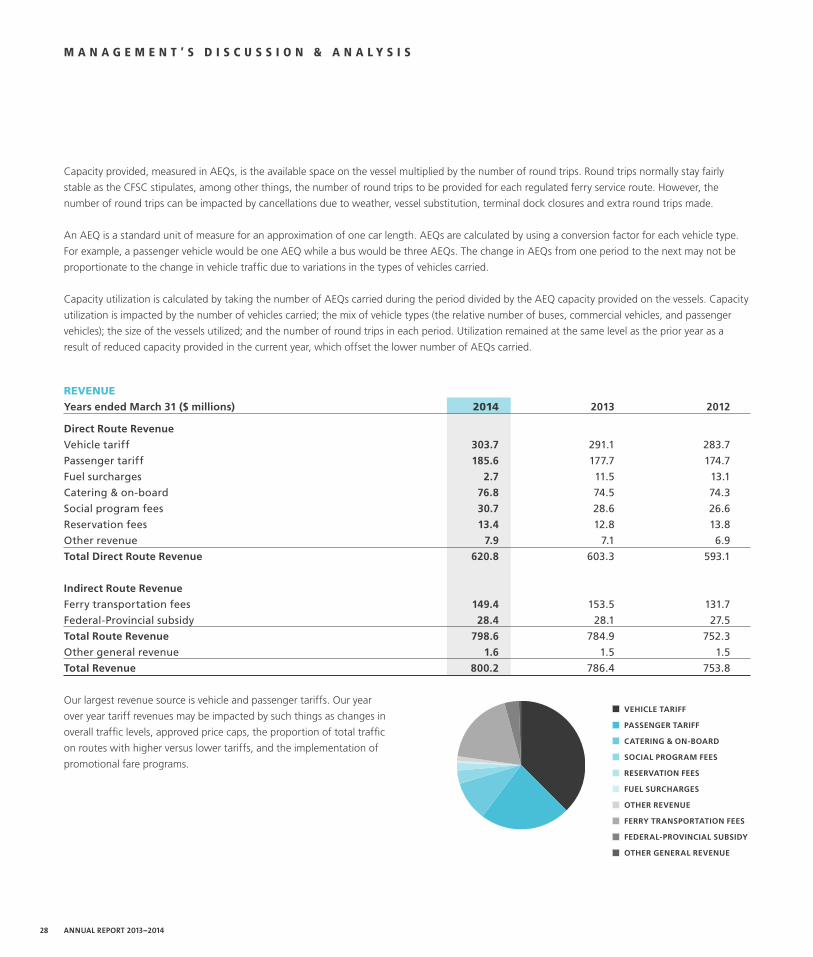
M A N A G E M E N T ’ S D I S C U S S I O N & A N A L Y S I S
Capacity provided, measured in AEQs, is the available space on the vessel multiplied by the number of round trips. Round trips normally stay fairly
stable as the CFSC stipulates, among other things, the number of round trips to be provided for each regulated ferry service route. However, the
number of round trips can be impacted by cancellations due to weather, vessel substitution, terminal dock closures and extra round trips made.
An AEQ is a standard unit of measure for an approximation of one car length. AEQs are calculated by using a conversion factor for each vehicle type.
For example, a passenger vehicle would be one AEQ while a bus would be three AEQs. The change in AEQs from one period to the next may not be
proportionate to the change in vehicle traffic due to variations in the types of vehicles carried.
Capacity utilization is calculated by taking the number of AEQs carried during the period divided by the AEQ capacity provided on the vessels. Capacity
utilization is impacted by the number of vehicles carried; the mix of vehicle types (the relative number of buses, commercial vehicles, and passenger
vehicles); the size of the vessels utilized; and the number of round trips in each period. Utilization remained at the same level as the prior year as a
result of reduced capacity provided in the current year, which offset the lower number of AEQs carried.
revenueyears ended march 31 ($ millions) 2014 2013 2012
direct route revenue
Vehicle tariff 303.7 291.1 283.7
Passenger tariff 185.6 177.7 174.7
Fuel surcharges 2.7 11.5 13.1
Catering & on-board 76.8 74.5 74.3
Social program fees 30.7 28.6 26.6
Reservation fees 13.4 12.8 13.8
Other revenue 7.9 7.1 6.9
Total direct route revenue 620.8 603.3 593.1
indirect route revenue
Ferry transportation fees 149.4 153.5 131.7
Federal-Provincial subsidy 28.4 28.1 27.5
Total route revenue 798.6 784.9 752.3
Other general revenue 1.6 1.5 1.5
Total revenue 800.2 786.4 753.8
Our largest revenue source is vehicle and passenger tariffs. Our year
over year tariff revenues may be impacted by such things as changes in
overall traffic levels, approved price caps, the proportion of total traffic
on routes with higher versus lower tariffs, and the implementation of
promotional fare programs.
vehicle Tariff
Passenger Tariff
caTering & on-Board
social Program fees
reservaTion fees
fuel surcharges
oTher revenue
ferry TransPorTaTion fees
federal-Provincial suBsidy
oTher general revenue
28 ANNUAL REPORT 2013–2014

M A N A G E M E N T ’ S D I S C U S S I O N & A N A L Y S I S
The Commissioner authorized a price cap increase for each route group of 4.1% effective April 1, 2013 and, in response, we implemented
average tariff increases up to the new level authorized. These fares are directly associated with increased operating costs, notably fuel, capital
replacement and labour.
Surcharges and/or rebates are implemented as a direct result of rising and declining fuel prices. On January 17, 2014, due to the rising cost of fuel,
we implemented a fuel surcharge of 3.5% on average on our Major Routes and our regulated Other Routes. No surcharges were put in place on
our unregulated or Northern Routes. A history of fuel surcharges in effect for fiscal 2012 through fiscal 2014 is below:
date range % surcharge applicable routes
April 1, 2012 – July 19, 2012 2.5% Horseshoe Bay-Langdale Route
5.0% All other regulated routes*
July 20, 2012 – November 29, 2012 2.0% All regulated routes*
November 30, 2012 – January 16, 2014 0.0% All regulated routes
January 17, 2014 – March 31, 2014 3.5% All regulated routes*
*with the exception of the Northern Routes
For the purpose of rate regulation, surcharges and/or rebates are applied to our deferred fuel cost accounts. (See “The Effect of Rate Regulation”
above for more detail.)
From time to time, we utilize promotional fares designed to stimulate growth in traffic or direct traffic towards our less busy sailings while ensuring
compliance with approved price cap orders. In calculating the price cap, vehicle and passenger tariffs, as well as reservation fees, are combined.
The utilization of promotional fare incentives and the effects of being over or under the price cap may cause the average vehicle and passenger tariff
rate to be under or over the allowed increase in any one period.
Year to year changes for the past two fiscal years for the Major, Northern and Other Routes are discussed separately below.
29BRITISH COLUMBIA FERRY SERVICES INC.
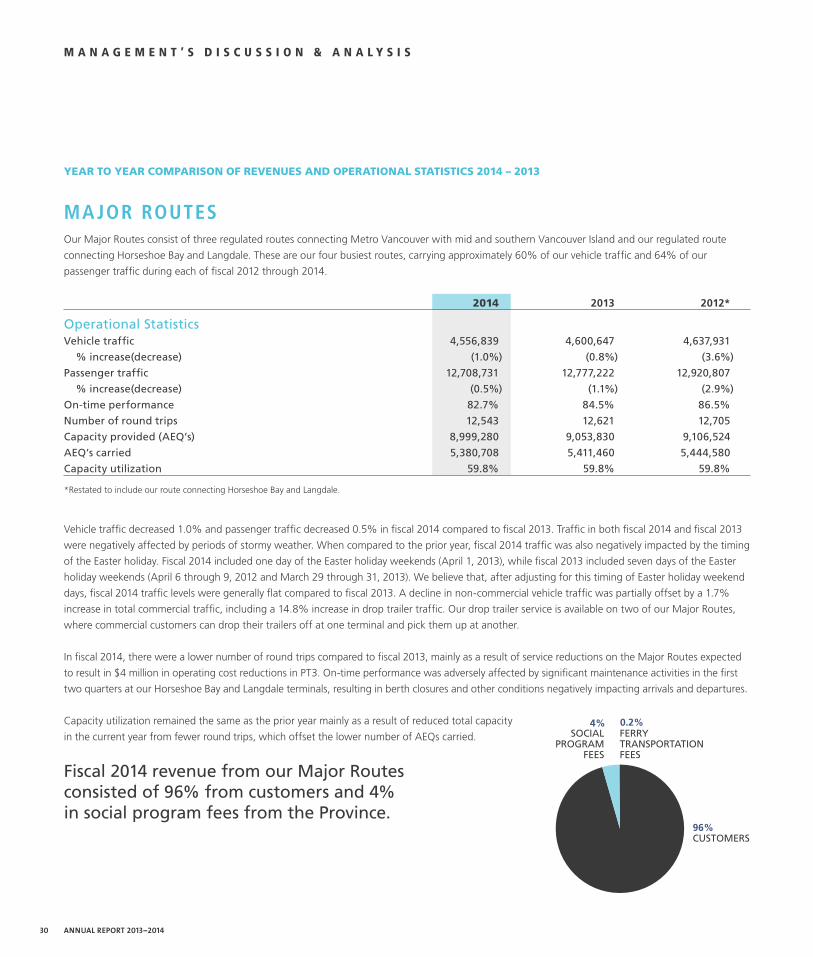
M A N A G E M E N T ’ S D I S C U S S I O N & A N A L Y S I S
year to year Comparison oF revenues and operational statistiCs 2014 – 2013
MA JOR ROUTESOur Major Routes consist of three regulated routes connecting Metro Vancouver with mid and southern Vancouver Island and our regulated route
connecting Horseshoe Bay and Langdale. These are our four busiest routes, carrying approximately 60% of our vehicle traffic and 64% of our
passenger traffic during each of fiscal 2012 through 2014.
2014 2013 2012*
Operational StatisticsVehicle traffic 4,556,839 4,600,647 4,637,931
% increase(decrease) (1.0%) (0.8%) (3.6%)
Passenger traffic 12,708,731 12,777,222 12,920,807
% increase(decrease) (0.5%) (1.1%) (2.9%)
On-time performance 82.7% 84.5% 86.5%
Number of round trips 12,543 12,621 12,705
Capacity provided (AEQ’s) 8,999,280 9,053,830 9,106,524
AEQ’s carried 5,380,708 5,411,460 5,444,580
Capacity utilization 59.8% 59.8% 59.8%
*Restated to include our route connecting Horseshoe Bay and Langdale.
Vehicle traffic decreased 1.0% and passenger traffic decreased 0.5% in fiscal 2014 compared to fiscal 2013. Traffic in both fiscal 2014 and fiscal 2013
were negatively affected by periods of stormy weather. When compared to the prior year, fiscal 2014 traffic was also negatively impacted by the timing
of the Easter holiday. Fiscal 2014 included one day of the Easter holiday weekends (April 1, 2013), while fiscal 2013 included seven days of the Easter
holiday weekends (April 6 through 9, 2012 and March 29 through 31, 2013). We believe that, after adjusting for this timing of Easter holiday weekend
days, fiscal 2014 traffic levels were generally flat compared to fiscal 2013. A decline in non-commercial vehicle traffic was partially offset by a 1.7%
increase in total commercial traffic, including a 14.8% increase in drop trailer traffic. Our drop trailer service is available on two of our Major Routes,
where commercial customers can drop their trailers off at one terminal and pick them up at another.
In fiscal 2014, there were a lower number of round trips compared to fiscal 2013, mainly as a result of service reductions on the Major Routes expected
to result in $4 million in operating cost reductions in PT3. On-time performance was adversely affected by significant maintenance activities in the first
two quarters at our Horseshoe Bay and Langdale terminals, resulting in berth closures and other conditions negatively impacting arrivals and departures.
Capacity utilization remained the same as the prior year mainly as a result of reduced total capacity
in the current year from fewer round trips, which offset the lower number of AEQs carried.
Fiscal 2014 revenue from our Major Routes consisted of 96% from customers and 4% in social program fees from the Province.
CUSTOMERS
0.2%
96%
FERRY TRANSPORTATIONFEES
SOCIALPROGRAM
FEES
4%
30 ANNUAL REPORT 2013–2014

M A N A G E M E N T ’ S D I S C U S S I O N & A N A L Y S I S
years ended march 31 ($ thousands) 2014 2013 increase (decrease)
Direct Route RevenueVehicle tariff 253,707 241,893 11,814 4.9%
Passenger tariff 150,351 142,363 7,988 5.6%
Fuel surcharges 2,268 9,481 (7,213) (76.1%)
Catering & on-board 69,500 67,240 2,260 3.4%
Social program fees 18,954 17,381 1,573 9.1%
Reservation fees 13,196 12,600 596 4.7%
Parking 4,217 3,714 503 13.5%
Other revenue 3,403 3,086 317 10.3%
Total direct route revenue 515,596 497,758 17,838 3.6%
Indirect Route RevenueFerry transportation fees 1,045 3,391 (2,346) (69.2%)
Total route revenue 516,641 501,149 15,492 3.1%
Average tariff revenue per vehicle increased $3.10 or 5.9% in fiscal 2014 compared to the prior year. Average tariff revenue per passenger increased
$0.69 or 6.2%. The increase in average tariff revenues in fiscal 2014 reflects the increases authorized by the Commissioner and the “CoastSaver”
promotion in the first quarter of the prior year. “CoastSaver” price discounts of approximately 40% from regular passenger and passenger vehicle
fares for Friday through Monday of each week were in effect from May 25 through June 25, 2012. Higher average fares more than offset the traffic
decline, resulting in an increase in tariff revenue of $19.8 million.
Fuel surcharges collected in fiscal 2014 were $7.2 million lower than in the prior year. No surcharges were in place during fiscal 2014 until
January 17, 2014, when due to the continuing high cost of fuel, we implemented a fuel surcharge of 3.5% on average on our Major Routes.
In fiscal 2013, surcharges of 2.5% of tariffs on average were in place on our Horseshoe Bay – Langdale route and 5.0% on our three other
Major Routes connecting Metro Vancouver with mid and southern Vancouver Island through July 19, 2012. At that time, due to declining fuel
prices, all surcharges were reduced to 2.0% and, on November 30, 2012, all surcharges were eliminated. For regulatory purposes, these amounts
are applied to our deferred fuel cost accounts. (See “The Effect of Rate Regulation” above for more detail.)
All vessels that provide service on our Major Routes have a gift shop and options for food service. Catering and on-board sales increased 3.4%
in fiscal 2014 compared to the prior fiscal year reflecting higher average sales per passenger partially offset by lower passenger traffic levels.
Areas of growth include sales of quality apparel which increased 14.7%; and sales of children’s products which increased 9.3%. Sales of books,
magazines and newspapers have declined 5.4%, following industry trends.
Social program fees are reimbursements from the Province of discounts provided on fares for BC seniors, students travelling to and from school,
persons with disabilities and persons travelling under the Ministry of Health Travel Assistance Program (MTAP). These fees increased in fiscal 2014
as a result of higher fares and higher usage of all programs. The most significant increases are a $0.9 million or 8.3% increase in the number of
seniors travelling and a $0.5 million or 1.3% increase in the number of individuals travelling with vehicles under the MTAP program.
Reservation fees increased as a result of higher usage, partially offset by lower traffic levels.
Revenue from parking increased as a result of higher usage of our parking facilities.
Other revenue increased mainly as a result of an increase in hostling fees from our drop trailer service and additional retail space rentals.
Ferry transportation fees decreased $2.3 million in fiscal 2014 due to the elimination of fees in support of services provided on our Horseshoe Bay –
Langdale route, effective April 1, 2013. Funds received from the Province related to the import duty remission on one of our foreign-built vessels
remained at a similar level. For the purpose of rate regulation, the funds related to the import duty remission are applied to our deferred fuel cost
accounts. (See “The Effect of Rate Regulation” above for more detail.)
31BRITISH COLUMBIA FERRY SERVICES INC.

M A N A G E M E N T ’ S D I S C U S S I O N & A N A L Y S I S
NORThERN ROUTESOur Northern Routes consist of three regulated routes operating on the British Columbia coast north of Port Hardy on Vancouver Island. Effective
April 1, 2014, the shortest of these routes, which only operated during the summer months, was eliminated and service to the mid-coast destinations
has been significantly adjusted.
2014 2013 2012
Operational StatisticsVehicle traffic 28,366 27,811 27,573
% increase(decrease) 2.0% 0.9% (6.1%)
Passenger traffic 81,100 80,848 80,642
% increase(decrease) 0.3% 0.3% (6.2%)
On-time performance 91.6% 91.9% 90.6%
Number of round trips 348 347 345
Capacity provided (AEQ’s) 83,450 84,677 85,100
AEQ’s carried 34,238 33,623 33,677
Capacity utilization 41.0% 39.7% 39.6%
In fiscal 2014, the Northern Routes experienced a modest increase in traffic. Vehicle traffic increased 2.0% and passenger traffic increased 0.3%,
compared to the previous year.
Utilization on these routes is higher than the prior year as a result of a higher number of AEQs carried in the current year, and the decreased capacity
provided. The decreased capacity reflects variations in vessels servicing the routes.
Fiscal 2014 revenue from our Northern Routes consisted of 22% from customers and 78% from the Province (1% social program fees, 68% ferry transportation fees, and 9% from payments under the Federal-Provincial subsidy agreement).
FERRYTRANSPORTATION
FEES
1%
68%
9%FEDERAL-PROVINCIAL
SUBSIDY
SOCIAL PROGRAM FEES
CUSTOMERS22%
32 ANNUAL REPORT 2013–2014

M A N A G E M E N T ’ S D I S C U S S I O N & A N A L Y S I S
years ended march 31 ($ thousands) 2014 2013 increase (decrease)
Direct Route RevenueVehicle tariff 8,126 7,785 341 4.4%
Passenger tariff 6,859 6,917 (58) (0.8%)
Social program fees 1,181 1,042 139 13.3%
Catering & on-board 2,064 2,007 57 2.8%
Stateroom rental 1,259 1,092 167 15.3%
Hostling & other 227 201 26 12.9%
Total direct route revenue 19,716 19,044 672 3.5%
Indirect Route RevenueFerry transportation fees 58,039 58,439 (400) (0.7%)
Federal-Provincial subsidy 7,280 7,204 76 1.1%
Total route revenue 85,035 84,687 348 0.4%
Average tariff revenue per vehicle increased $6.55 or 2.3% in fiscal 2014 compared to the prior fiscal year. Average tariff revenue per passenger
decreased $0.98 or 1.2%. The increase in average tariff revenues reflect the increases authorized by the Commissioner and changes year over year
in the proportionate amount of traffic on the shorter routes with lower fares versus the amount of traffic on the longer routes with higher fares.
The changes in traffic levels and in average fares resulted in a total tariff revenue increase of $0.3 million.
There were no fuel surcharges or rebates in place on our Northern Routes.
Reimbursements from the Province for social program fees increased primarily as a result of higher usage of MTAP and other programs, as well as
higher fares.
Revenue from catering and on-board services increased mainly as a result of higher average sales per passenger.
Stateroom rental increased due to higher usage, partly a result of the marginal increase in passenger traffic.
Hostling and other revenues increased as a result of increased use of parking facilities and hostling services, partially offset by lower use of reservations.
Ferry transportation fees in fiscal 2014 were $0.4 million lower than the prior year, reflecting:
• $1.0 million reduction as a result of lower total ferry transportation fees received under the CFSC, partially offset by an increase in the percentage
of these fees allocated by the Province to the Northern Routes; partially offset by:
• $0.6 million increase for fees received from the Province related to the price of fuel. For regulatory purposes, these amounts are applied to our
deferred fuel cost accounts. (See “The Effect of Rate Regulation” above for more detail).
The Federal-Provincial subsidy has increased by the change in the annual Consumer Price Index (CPI) (Vancouver).
33BRITISH COLUMBIA FERRY SERVICES INC.

M A N A G E M E N T ’ S D I S C U S S I O N & A N A L Y S I S
OThER ROUTESOur Other Routes consist of 18 regulated routes and eight small unregulated routes primarily serving the northern and southern Gulf Islands and the
Sunshine Coast. One of the regulated routes and all of the unregulated routes are operated under contract by alternative service providers. We receive
fees from the Province for the provision of contracted services on these routes, which are included in the ferry transportation fees in the table below.
2014 2013 2012*
Operational StatisticsVehicle traffic 3,059,139 3,120,285 3,172,415
% increase(decrease) (2.0%) (1.6%) (3.3%)
Passenger traffic 6,906,879 7,061,028 7,168,528
% increase(decrease) (2.2%) (1.5%) (2.5%)
On-time performance 92.9% 93.6% 92.4%
Number of round trips 71,081 71,146 70,741
Capacity provided (AEQ’s) 8,311,507 8,468,505 8,396,916
AEQ’s carried 3,260,603 3,324,134 3,383,538
Capacity utilization 39.2% 39.3% 40.3%
*Restated to exclude our route connecting Horseshoe Bay and Langdale.
Vehicle traffic decreased 2.0% and passenger traffic decreased 2.2%, compared to the prior year. We believe this decrease was partially due
to the timing of the Easter holiday weekends and service alterations to accommodate upgrades at some of our terminals.
Capacity utilization on these routes was marginally lower in fiscal 2014 compared to the prior year mainly as a result of lower AEQs carried
in the current year, partially offset by lower capacity provided.
Fiscal 2014 revenue from our Other Routes consisted of 38% from customers and 62% from the Province (5% social program fees, 46% ferry transportation fees, and 11% from payments under the Federal-Provincial subsidy agreement).
FERRYTRANSPORTATION
FEES
5%46%
11%FEDERAL-
PROVINCIALSUBSIDY
SOCIAL PROGRAM FEES
CUSTOMERS38%
34 ANNUAL REPORT 2013–2014

M A N A G E M E N T ’ S D I S C U S S I O N & A N A L Y S I S
years ended march 31 ($ thousands) 2014 2013 increase (decrease)
Direct Route RevenueVehicle tariff 41,879 41,418 461 1.1%
Passenger tariff 28,382 28,404 (22) (0.1%)
Fuel surcharges 422 1,988 (1,566) (78.8%)
Social program fees 10,559 10,180 379 3.7%
Catering & on-board 3,941 4,153 (212) (5.1%)
Reservation fees 228 208 20 9.6%
Parking & other 100 114 (14) (12.3%)
Total direct route revenue 85,511 86,465 (954) (1.1%)
Indirect Route RevenueFerry transportation fees 90,298 91,667 (1,369) (1.5%)
Federal-Provincial subsidy 21,093 20,873 220 1.1%
Total route revenue 196,902 199,005 (2,103) (1.1%)
The average tariff revenue per vehicle increased $0.42 or 3.1% in fiscal 2014 compared to the prior year, while the average tariff revenue
per passenger increased $0.09 or 2.2%. The increase in average fares, partially offset by the reduction in traffic, resulted in a total tariff revenue
increase of $0.4 million.
Fuel surcharges collected in fiscal 2014 were $1.6 million lower than in the prior year. No surcharges were in place during fiscal 2014 until
January 17, 2014, when, due to the rising cost of fuel, we implemented a fuel surcharge of 3.5% on average on our Other Routes. In fiscal 2013,
surcharges of 5% of tariffs on average were in place until July 20, 2012. At that time, due to declining fuel prices, all surcharges were reduced
to 2% and, on November 30, 2012, all surcharges were eliminated. For regulatory purposes, these amounts are applied to our deferred fuel cost
accounts. (See “The Effect of Rate Regulation” above for more detail.)
Reimbursements from the Province for social program fees increased in fiscal 2014 as a result of higher program usage and higher fares. The most
significant increase was a $0.3 million or 7.7% increase in the number of seniors travelling.
Decreases in revenue from catering and on-board services reflect the lower traffic levels on the routes where those services are offered and lower
average spending per passenger.
Fees for reservations increased as a result of higher usage, partially offset by lower traffic levels.
Parking and other revenues were lower in fiscal 2014 than in the prior year, mainly due to a reduction in usage of our parking facilities.
Ferry transportation fees decreased $1.4 million reflecting the reduction in fees received under the CFSC for the 18 regulated routes. Funds received
from the Province related to the import duty remission on one of our foreign-built vessels remained at a similar level, as did fees from the Province
for the provision of contracted services.
The Federal-Provincial subsidy has increased by the change in the annual CPI (Vancouver).
35BRITISH COLUMBIA FERRY SERVICES INC.

M A N A G E M E N T ’ S D I S C U S S I O N & A N A L Y S I S
year to year Comparison oF revenues and operational statistiCs 2013 – 2012
MA JOR ROUTESVehicle traffic decreased 0.8% and passenger traffic decreased 1.1% in fiscal 2013 compared to fiscal 2012. Traffic was negatively impacted
by a period of stormy weather with high winds that resulted in numerous sailing cancellations in and around the December 2012 holiday season.
The general decline in vehicle traffic was partially offset by a 33.5% increase in drop trailer traffic on two of our Major Routes, where commercial
customers can drop their trailers off at one terminal and pick them up at another.
Fiscal 2013 revenue from our Major Routes consisted of 96% from customers and 4% from the Province (3% social program fees and 1% ferry transportation fees in support of our route connecting Horseshoe Bay and Langdale).
years ended march 31 ($ thousands) 2013 2012* increase (decrease)
Direct Route Revenue Vehicle tariff 241,893 234,483 7,410 3.2%
Passenger tariff 142,363 139,666 2,697 1.9%
Fuel surcharges 9,481 9,768 (287) (2.9%)
Catering & on-board 67,240 66,957 283 0.4%
Social program fees 17,381 16,124 1,257 7.8%
Reservation fees 12,600 13,499 (899) (6.7%)
Parking 3,714 3,750 (36) (1.0%)
Other revenue 3,086 2,943 143 4.9%
Total direct route revenue 497,758 487,190 10,568 2.2%
Indirect Route RevenueFerry transportation fees 3,391 3,965 (574) (14.5%)
Federal-Provincial subsidy – 986 (986) (100.0%)
Total route revenue 501,149 492,141 9,008 1.8%
* Restated to include our route connecting Horseshoe Bay and Langdale.
CUSTOMERS
3%
96%
SOCIAL PROGRAMFEES
FERRYTRANSPORTATION
FEES
1%
36 ANNUAL REPORT 2013–2014

M A N A G E M E N T ’ S D I S C U S S I O N & A N A L Y S I S
Average tariff revenue per vehicle in fiscal 2013 increased $2.02 or 4.0% compared to the prior year. Average tariff revenue per passenger increased
$0.33 or 3.1%. Higher average fares more than offset the traffic decline, resulting in an increase in tariff revenue of $10.1 million.
Fuel surcharges collected in fiscal 2013 were $0.3 million lower than the prior year. Surcharges were eliminated on November 30, 2012 as a result
of declining fuel prices. Surcharges of 2.0% of tariffs on average had been in place since July 20, 2012. These surcharges had been decreased from
2.5% on our Horseshoe Bay – Langdale route and 5.0% on our three other Major Routes connecting Metro Vancouver with mid and southern
Vancouver Island. These surcharges had been in place since December 12, 2011.
Revenue from catering and on-board sales increased marginally in fiscal 2013 compared to the prior year, reflecting higher average sales per passenger
mainly offset by lower passenger traffic levels. Sales of quality apparel continued to grow in fiscal 2013, increasing by 14.4% compared to the prior
year. Sales of magazines, comics and newspapers continued to decline following industry trend.
Social program fees increased as a result of higher program usage and higher fares. The most significant increases were a $1.0 million or 5.6% increase
in the number of seniors travelling and a $0.3 million or 2.7% increase in the number of individuals travelling with vehicles under the MTAP program.
Reservation fees decreased as a result of the lower traffic levels and lower usage. Revenue from parking remained at a similar level as the prior year.
Other revenue increased mainly as a result of an increase in hostling fees from our drop trailer service. This service has been well received in the
commercial market place.
Ferry transportation fees decreased $0.6 million. The fees received in fiscal 2013 included:
• Ferry transportation fees received in support of services provided on our Horseshoe Bay – Langdale route, resulting in a decrease of $1.4 million
from the prior year. While total ferry transportation fees from the Province increased, a lower portion of the total fees has been allocated by
the Province to support the Horseshoe Bay – Langdale route this fiscal year.
• A re-allocation of funds received from the Province related to the import duty remission on one of our foreign-built vessels, resulting in an increase
of $0.8 million.
The allocation of the Federal-Provincial subsidy to the Horseshoe Bay – Langdale route was eliminated effective April 1, 2012, the beginning of the PT3.
These funds were reallocated to the Northern and Other Routes.
37BRITISH COLUMBIA FERRY SERVICES INC.

M A N A G E M E N T ’ S D I S C U S S I O N & A N A L Y S I S
NORThERN ROUTESIn fiscal 2013, the Northern Routes experienced a modest increase in traffic. Vehicle traffic increased 0.9% and passenger traffic increased 0.3%,
compared to the previous year.
Fiscal 2013 revenue from our Northern Routes consisted of 21% from customers and 79% from the Province (1% social program fees, 69% ferry transportation fees, and 9% from payments under the Federal-Provincial subsidy agreement).
years ended march 31 ($ thousands) 2013 2012 increase (decrease)
Direct Route RevenueVehicle tariff 7,785 7,878 (93) (1.2%)
Passenger tariff 6,917 7,075 (158) (2.2%)
Social program fees 1,042 961 81 8.4%
Catering & on-board 2,007 2,108 (101) (4.8%)
Stateroom rental 1,092 1,060 32 3.0%
Hostling & other 201 212 (11) (5.2%)
Total direct route revenue 19,044 19,294 (250) (1.3%)
Indirect Route RevenueFerry transportation fees 58,439 50,377 8,062 16.0%
Federal-Provincial subsidy 7,204 6,800 404 5.9%
Total route revenue 84,687 76,471 8,216 10.7%
CUSTOMERS
1%
21%
9%FEDERAL-
PROVINCIALSUBSIDY
SOCIAL PROGRAM FEES
FERRYTRANSPORTATION
FEES
69%
38 ANNUAL REPORT 2013–2014

M A N A G E M E N T ’ S D I S C U S S I O N & A N A L Y S I S
The average tariff revenue per vehicle decreased $5.79 or 2.0% while the average tariff revenue per passenger decreased $2.18 or 2.5%, compared
to the prior year, mainly as a result of a greater proportionate number of vehicles and passengers on the shorter routes with lower fares. These lower
average tariff rates, partially offset by higher traffic levels, resulted in a total tariff revenue decrease of $0.3 million.
There were no fuel surcharges or rebates in place on our Northern Routes.
Reimbursements from the Province for social program fees increased primarily as a result of higher usage of MTAP and higher fares, partially offset
by lower usage of other programs.
Revenue from catering and on-board services decreased as a result of a lower average spending per passenger, partially offset by a marginal increase
in passenger traffic.
Stateroom rental increased due to higher usage and a marginal increase in passenger traffic.
Hostling and other revenues decreased overall. Reservation revenue decreased while hostling and parking revenue increased marginally.
Ferry transportation fees increased $8.0 million. The fees received in fiscal 2013 included:
• Ferry transportation fees for these routes received under the CFSC. These fees increased $8.8 million as a result of additional funding from the
Province as well as a larger portion of the total fees allocated by the Province to these routes.
• Ferry transportation fees received from the Province related to the price of fuel. As a result of changes in fuel prices, these amounts were
$0.8 million lower year over year.
The Federal-Provincial subsidy has increased by the change in the annual CPI (Vancouver) and an increase in the allocation of the total subsidy
to the Northern Routes.
39BRITISH COLUMBIA FERRY SERVICES INC.

M A N A G E M E N T ’ S D I S C U S S I O N & A N A L Y S I S
OThER ROUTESVehicle traffic decreased 1.6% and passenger traffic decreased 1.5%,
compared to the prior year.
Fiscal 2013 revenue from our Other Routes consisted of 38% from customers and 62% from the Province (5% social program fees, 46% ferry transportation fees, and 11% from payments under the Federal-Provincial subsidy agreement).
years ended march 31 ($ thousands) 2013 2012* increase (decrease)
Direct Route RevenueVehicle tariff 41,418 41,323 95 0.2%
Passenger tariff 28,404 27,967 437 1.6%
Fuel surcharges 1,988 3,330 (1,342) (40.3%)
Social program fees 10,180 9,522 658 6.9%
Catering & on-board 4,153 4,205 (52) (1.2%)
Reservation fees 208 227 (19) (8.4%)
Parking & other 114 92 22 23.9%
Total direct route revenue 86,465 86,666 (201) (0.2%)
Indirect Route RevenueFerry transportation fees 91,667 77,311 14,356 18.6%
Federal-Provincial subsidy 20,873 19,702 1,171 5.9%
Total route revenue 199,005 183,679 15,326 8.3%
*Restated to exclude our route connecting Horseshoe Bay and Langdale.
CUSTOMERS
5%
38%
11%FEDERAL-
PROVINCIALSUBSIDY
SOCIAL PROGRAM FEES
FERRYTRANSPORTATION
FEES
46%
40 ANNUAL REPORT 2013–2014

M A N A G E M E N T ’ S D I S C U S S I O N & A N A L Y S I S
The average tariff revenue per vehicle in fiscal 2013 increased $0.25 or 1.9%, compared to the prior year, while the average tariff revenue per
passenger increased $0.12 or 3.1%. The increase in average fares, partially offset by the reduction in traffic, resulted in a total tariff revenue increase
of $0.5 million.
Fuel surcharges collected were $1.3 million lower in fiscal 2013 than in the prior year. Surcharges were eliminated on November 30, 2012 as a result
of declining fuel prices. Fuel surcharges on our regulated Other Routes were 2% of tariffs on average since July 20, 2012. Prior to July 20, 2012,
fuel charges of 5% had been in place since June 1, 2011.
Reimbursements from the Province for social program fees increased in fiscal 2013 as a result of higher program usage and higher fares. The most
significant increases were a $0.4 million or 7.4% increase in the number of seniors and a $0.2 million or 3.3% increase in the number of individuals
travelling with vehicles under the MTAP program.
Decreases in revenue from catering and on-board services reflect the lower traffic levels on the routes where those services are offered and lower
average spending per passenger.
Fees for reservations decreased as a result of lower usage and lower traffic levels.
Parking and other revenues are higher than the prior year, mainly due to an increase in usage of our parking facilities.
Ferry transportation fees increased $14.4 million. The fees received in fiscal 2013 included:
• Ferry transportation fees for the 18 regulated routes which increased $14.5 million as a result of additional funding from the Province as well as
a larger portion of the total fees allocated by the Province to these routes;
• Fees from the Province for the provision of contracted service on unregulated routes which increased $0.7 million; and
• Funds from the Province related to the import duty remission on one of our foreign-built vessels which were $0.8 million lower as a result of
the reallocation among the routes.
The Federal-Provincial subsidy has increased by the change in the annual CPI (Vancouver) and by an increase in the allocation of the total subsidy
to the Other Routes.
41BRITISH COLUMBIA FERRY SERVICES INC.
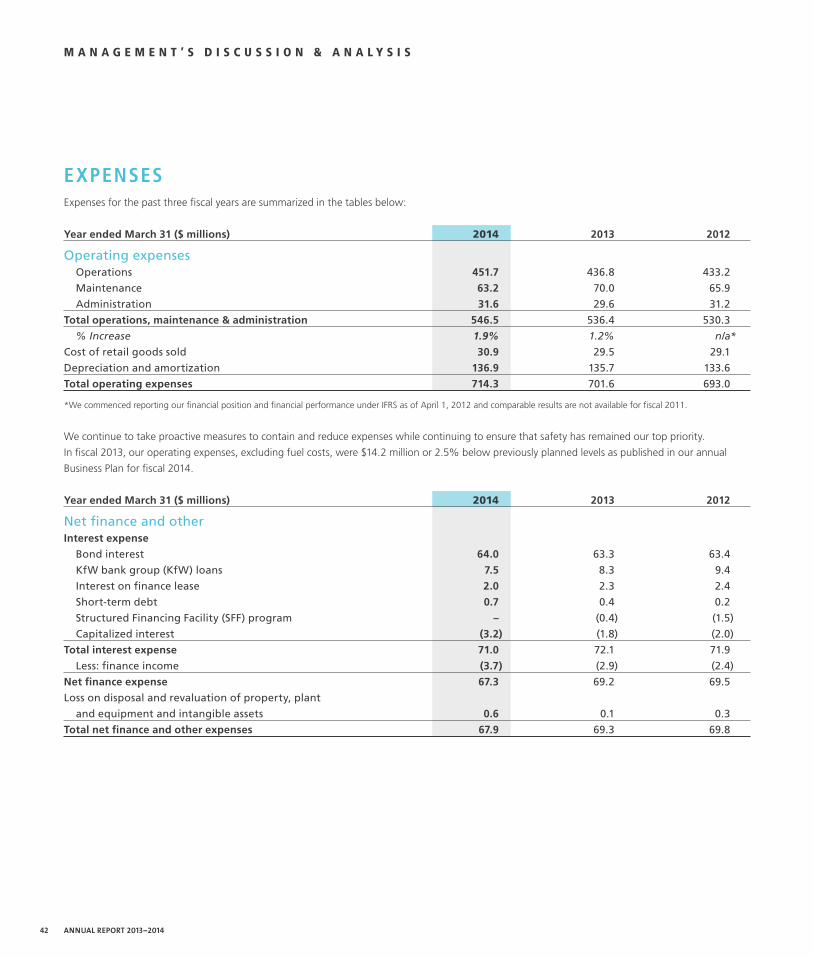
M A N A G E M E N T ’ S D I S C U S S I O N & A N A L Y S I S
ExPENSESExpenses for the past three fiscal years are summarized in the tables below:
year ended march 31 ($ millions) 2014 2013 2012
Operating expenses Operations 451.7 436.8 433.2
Maintenance 63.2 70.0 65.9
Administration 31.6 29.6 31.2
Total operations, maintenance & administration 546.5 536.4 530.3
% Increase 1.9% 1.2% n/a*
Cost of retail goods sold 30.9 29.5 29.1
Depreciation and amortization 136.9 135.7 133.6
Total operating expenses 714.3 701.6 693.0
*We commenced reporting our financial position and financial performance under IFRS as of April 1, 2012 and comparable results are not available for fiscal 2011.
We continue to take proactive measures to contain and reduce expenses while continuing to ensure that safety has remained our top priority.
In fiscal 2013, our operating expenses, excluding fuel costs, were $14.2 million or 2.5% below previously planned levels as published in our annual
Business Plan for fiscal 2014.
year ended march 31 ($ millions) 2014 2013 2012
Net finance and other interest expense
Bond interest 64.0 63.3 63.4
KfW bank group (KfW) loans 7.5 8.3 9.4
Interest on finance lease 2.0 2.3 2.4
Short-term debt 0.7 0.4 0.2
Structured Financing Facility (SFF) program – (0.4) (1.5)
Capitalized interest (3.2) (1.8) (2.0)
Total interest expense 71.0 72.1 71.9
Less: finance income (3.7) (2.9) (2.4)
net finance expense 67.3 69.2 69.5
Loss on disposal and revaluation of property, plant
and equipment and intangible assets 0.6 0.1 0.3
Total net finance and other expenses 67.9 69.3 69.8
42 ANNUAL REPORT 2013–2014

M A N A G E M E N T ’ S D I S C U S S I O N & A N A L Y S I S
year to year Comparison oF expenses 2014 – 2013
The $14.9 million increase in operations expenses for fiscal 2013
to fiscal 2014 consists of:
• $6.4 million increase in wage and benefits costs, mainly due to
wage rate increases, higher benefit costs, increased training costs
and a 7% increase in overtime partially due to service alterations
to accommodate upgrades at some of our terminals;
• $4.5 million increase in fuel expense, reflecting an increase of
$4.8 million or 1.1% due to higher fuel prices, partially offset by
a $0.3 million or 1.7% decrease in fuel consumption. While IFRS
does not permit accounting for rate-regulated entities, we are in
fact rate-regulated. For purposes of rate regulation, $14.5 million
of our fuel expense for fiscal 2014 ($11.3 million for fiscal 2013)
is recorded in deferred fuel cost accounts for future recovery.
(See “The Effect of Rate Regulation” above for more detail.);
• $0.9 million increase in travel expenses, mainly related to the service
alterations to accommodate upgrades at some of our terminals;
• $0.8 million increase in telecommunications costs, software license
fees and computer leases;
• $0.6 million increase in insurance claims costs, mainly due to
a $0.7 million claim recovery in fiscal 2013;
• $0.5 million increase in credit card processing fees;
• $0.5 million increase in materials and supplies; and
• $1.4 million increase in various other operating costs
Partially offset by:
• $0.7 million decrease in contracted services.
The $6.8 million decrease in maintenance costs results from a decrease
in vessel maintenance costs, reflecting the variations in vessel refit
scheduling, while terminal maintenance costs remained at a similar
level to the prior year.
The $2.0 million increase in administration costs is mainly due to
a $1.3 million increase in computer software fees, licenses and leases
and a $0.6 million increase in wages and benefits.
The $1.4 million increase in cost of retail goods sold reflects
the increase in overall sales and the higher cost of food and select
retail items.
Depreciation and amortization increased $1.2 million, reflecting
higher amortization resulting from the new capital assets entering
service during fiscal 2014. (See “Investing in our Capital Assets”
below for details of capital asset expenditures in fiscal 2014.)
Net finance and other expenses decreased by $1.4 million from
fiscal 2013 to fiscal 2014 due to:
• $1.4 million increase in interest capitalized;
• $0.8 million increase in finance income;
• $0.8 million decrease in interest on KfW loans, reflecting
$9.0 million in principal repayments on the 2.95% KfW loan
and lower interest rates on the Tranche B than on the Tranche A
components of the 12-year KfW loans (See “Liquidity and Capital
Resources – Long-Term Debt” below for more detail.); and
• $0.3 million decrease in interest on finance leases;
Partially offset by:
• $0.4 million year-to-date decrease in interest rate support received
through the SFF Program offered by the Government of Canada,
reflecting the completion of the funding related to the life
extension of the Quinsam;
• $0.7 million increase in bond interest, reflecting $60 million
increase in outstanding bonds ($200 million issued and
$140 million redeemed in October 2013);
• $0.5 million loss on disposal and revaluation of property, plant
and equipment and intangible assets; and
• $0.3 million increase in short-term interest.
43BRITISH COLUMBIA FERRY SERVICES INC.

M A N A G E M E N T ’ S D I S C U S S I O N & A N A L Y S I S
The $0.4 million increase in cost of retail goods sold reflects the
increase in overall sales and a change in sales mix with a decrease
in food sales with a lower cost and an increase in gift shop sales
with a higher cost.
Depreciation and amortization increased $2.1 million reflecting higher
amortization resulting from the new capital assets entering service
during fiscal 2013.
Net finance and other expenses decreased by $0.5 million from
fiscal 2012 to fiscal 2013 primarily due to:
• $1.1 million reduction in interest due to lower interest rates on
the Tranche B than on the Tranche A components of the 12-year
KfW loans and $9.0 million of principal repayments on the 2.95%
KfW loan;
• $0.5 million increase in finance income; and
• $0.2 million reduction in losses on disposal and revaluation
of property, plant and equipment;
Partially offset by:
• $1.1 million in lower interest rate support through the SFF program
offered by the Government of Canada, reflecting the completion
of the funding related to the life extension of the Quinsam; and
• $0.2 million less interest capitalized.
year to year Comparison oF expenses 2013 – 2012
The $3.6 million increase in operations expenses from fiscal 2012
to fiscal 2013 consists of:
• $5.0 million increase in wage and benefits costs, mainly due to
wage rate increases and higher benefit costs;
• $1.3 million increase in fuel expense, reflecting an increase of
$3.3 million or 1.1% due to higher fuel prices, partially offset by
a $2.0 million or 1.7% decrease in fuel consumption. While IFRS
does not permit accounting for rate-regulated entities, we are in
fact rate-regulated. For purposes of rate regulation, $11.3 million
of our fuel expense for fiscal 2013 ($19.4 million for fiscal 2012) is
recorded in deferred fuel cost accounts for future recovery. (See
“The Effect of Rate Regulation” above for more detail.);
Partially offset by:
• $1.2 million decrease in materials, supplies and contracted services;
• $0.9 million decrease in insurance premiums and claims, mainly
due to a $0.7 million claim recovery in fiscal 2013; and
• $0.6 million decrease in several other operational areas including
rental and lease expenses, telecommunications costs, and
advertising and public relations costs.
The $4.1 million increase in maintenance costs results from an
increase in vessel maintenance, reflecting the variations in vessel refit
scheduling and an increase in terminal maintenance.
The $1.6 million decrease in administration expenses is mainly due
to lower wages and benefits, including lower executive compensation
which is due to a reduced number of senior executive positions and
a lower average compensation per executive position.
44 ANNUAL REPORT 2013–2014

M A N A G E M E N T ’ S D I S C U S S I O N & A N A L Y S I S
LIQUIDITY AND CAPITAL RESOURCES
liquidity and Capital resourCes
We fund our operations and capital acquisitions with cash flow
generated from operations, as well as bank financing and debt issues.
Over the last five years, our capital expenditures averaged $112 million
annually. Over the next five years, we expect the average to increase
to approximately $275 million annually as we proceed with the
replacement of our aged minor and intermediate-sized vessels and
make significant improvements at our terminals serving our Major
Routes. Over the next few years, we expect our cash requirements
will be met through operating cash flows and by accessing our credit
facility from time to time. At March 31, 2014, our unrestricted cash
and cash equivalents and other short-term investments totalled
$71 million and $81 million, respectively.
On July 24, 2013, we completed the redemption of all $140 million of
the outstanding Series 08-2 Bonds, formerly due December 19, 2013.
This debt management initiative to reduce our interest costs in the
short term was funded with $55 million cash on hand and $88 million
in draws on our credit facility. Due to this early redemption, we saved
approximately $0.3 million in net interest costs in fiscal 2014.
On October 25, 2013, we completed a private placement of
$200 million of 30-year senior secured bonds with accredited
investors. These bonds bear interest at a rate of 4.702% per annum,
payable semi-annually. This issuance was partially related to the
early redemption of our $140 million Series 08-2 Bonds. The net
proceeds of this new issue repaid our credit facility, funded the debt
service reserve related to these funds and will partially fund capital
expenditures and provide funding for general corporate purposes.
These bonds were rated “A” (DBRS) and “A+” (S&P).
On April 28, 2014, we completed a private placement of $200 million
of 30-year senior secured bonds with accredited investors.
These bonds bear interest at a rate of 4.289% per annum, payable
semi-annually. The net proceeds of this new issue, together with
additional cash on hand, was used to repay our $250 million bond
Series 04-1, which matured on May 27, 2014 and to fund the debt
service reserve related to these bonds. These bonds were rated
“A” (DBRS) and “AA-” (S&P). We managed our interest rate risk
and secured a favourable interest rate by entering into interest rate
hedges. The effective rate of this issue, net of hedging, is 4.5%,
the lowest effective bond interest rate in the 11-year history of
our company.
Our $155 million credit facility was amended on March 12, 2014 to
extend the maturity date of the facility from April 2018 to April 2019
as well as to add a new pricing grid category of “>A+”. The facility
is available to fund capital expenditures and other general corporate
purposes. At March 31, 2014, there were no draws on this credit facility.
We target maintaining a strong investment-grade credit rating
to allow capital market access at reasonable interest rates.
On March 17, 2014, S&P announced that, based on its decision
to apply revised rating criteria, it raised our rating from “A+” to
“AA-“. Our credit ratings at March 31, 2014, were “A” (DBRS)
with a stable trend and “AA-” (S&P) with a stable outlook.
On September 30, 2012, the Commissioner issued Order 12-02, which
established price cap increases for the balance of PT3. These price
cap increases are sufficient to enable us to meet our debt obligations
and maintain access to borrowing rates that, in the opinion of
the Commissioner, are reasonable. The order indicated that the
Commissioner had established the price caps with the intention
of allowing us to achieve, by the end of PT3, equity not less than
17.5% of total capitalization and a DSCR of 2.5 or greater.
45BRITISH COLUMBIA FERRY SERVICES INC.
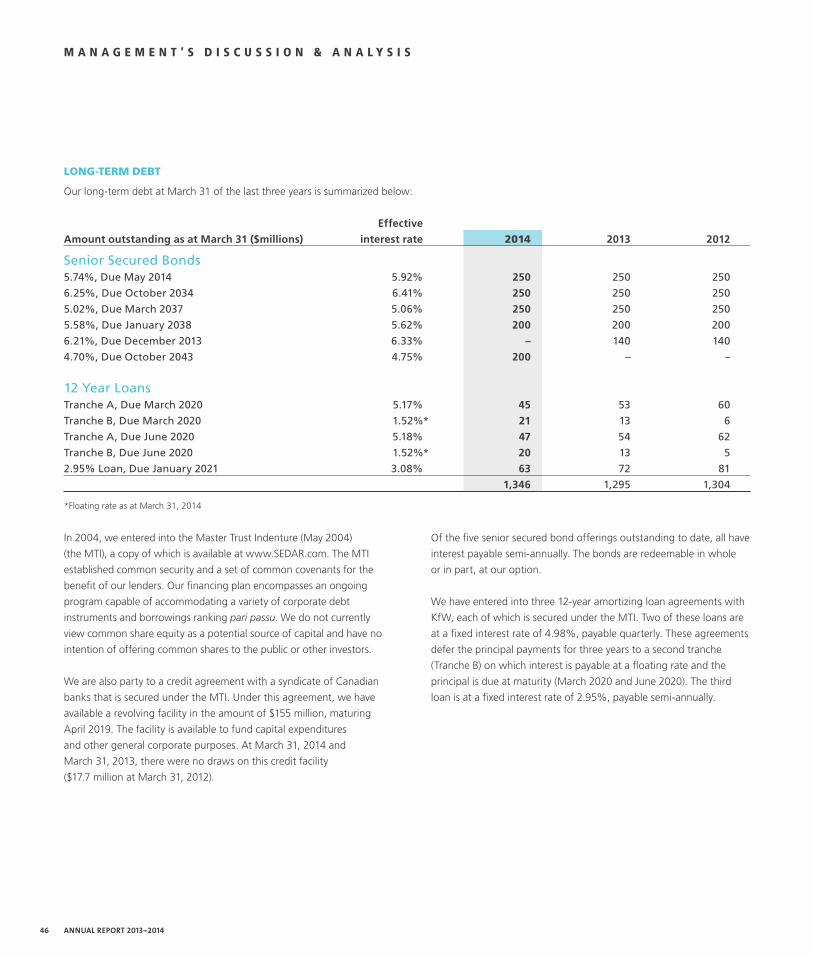
M A N A G E M E N T ’ S D I S C U S S I O N & A N A L Y S I S
long-term debt
Our long-term debt at March 31 of the last three years is summarized below:
effective
amount outstanding as at march 31 ($millions) interest rate 2014 2013 2012
Senior Secured Bonds5.74%, Due May 2014 5.92% 250 250 250
6.25%, Due October 2034 6.41% 250 250 250
5.02%, Due March 2037 5.06% 250 250 250
5.58%, Due January 2038 5.62% 200 200 200
6.21%, Due December 2013 6.33% – 140 140
4.70%, Due October 2043 4.75% 200 – –
12 Year LoansTranche A, Due March 2020 5.17% 45 53 60
Tranche B, Due March 2020 1.52%* 21 13 6
Tranche A, Due June 2020 5.18% 47 54 62
Tranche B, Due June 2020 1.52%* 20 13 5
2.95% Loan, Due January 2021 3.08% 63 72 81
1,346 1,295 1,304
*Floating rate as at March 31, 2014
In 2004, we entered into the Master Trust Indenture (May 2004)
(the MTI), a copy of which is available at www.SEDAR.com. The MTI
established common security and a set of common covenants for the
benefit of our lenders. Our financing plan encompasses an ongoing
program capable of accommodating a variety of corporate debt
instruments and borrowings ranking pari passu. We do not currently
view common share equity as a potential source of capital and have no
intention of offering common shares to the public or other investors.
We are also party to a credit agreement with a syndicate of Canadian
banks that is secured under the MTI. Under this agreement, we have
available a revolving facility in the amount of $155 million, maturing
April 2019. The facility is available to fund capital expenditures
and other general corporate purposes. At March 31, 2014 and
March 31, 2013, there were no draws on this credit facility
($17.7 million at March 31, 2012).
Of the five senior secured bond offerings outstanding to date, all have
interest payable semi-annually. The bonds are redeemable in whole
or in part, at our option.
We have entered into three 12-year amortizing loan agreements with
KfW, each of which is secured under the MTI. Two of these loans are
at a fixed interest rate of 4.98%, payable quarterly. These agreements
defer the principal payments for three years to a second tranche
(Tranche B) on which interest is payable at a floating rate and the
principal is due at maturity (March 2020 and June 2020). The third
loan is at a fixed interest rate of 2.95%, payable semi-annually.
46 ANNUAL REPORT 2013–2014
M A N A G E M E N T ’ S D I S C U S S I O N & A N A L Y S I S
terminal leases
We entered into a master agreement with the BC Transportation
Financing Authority (BCTFA) effective March 31, 2003, as part of the
restructuring of our company. In return for the transfer of ownership
interest in all ferry terminals from the former British Columbia Ferry
Corporation to the BCTFA at the time of the corporate restructuring,
we received recognition of prepayment of rent under terminal leases.
The leases grant us exclusive access and use of ferry terminal
properties for a period of 60 years commencing April 1, 2003.
The leases are renewable for an additional period of 20 years at a
total cost of $20 per lease provided the CFSC is renewed. We must
manage, maintain and develop the terminals at our own cost.
Since the original transfer, a total of $11.7 million of additional lands
at Horseshoe Bay, Swartz Bay and Departure Bay have been added
to the existing terminal leases in exchange for highway improvements.
If we fail to meet our obligations under the terminal leases or default
under the CFSC, the BCTFA may at its option re-enter and take
possession of the ferry terminal properties and at its option terminate
the leases. The BCTFA has entered into an acknowledgement
agreement with the Trustee under the MTI, which sets out certain
limitations on the use of this option.
FinanCe lease
In September 2010, agreements which constitute a finance lease for
space in our new corporate office building in downtown Victoria took
effect following the completion of construction of the new building.
The initial term of the lease was 15 years, with four renewal options
of five years each. In November 2010, we advanced $24.2 million
to the developer of the property for a term of 15 years, secured by
a second mortgage on the property. The loan agreement provides
for interest equal to one-half of the net cash flow from the property,
subject to minimum and maximum percentage rates of interest.
Over the term of the loan, interest is expected to approximate the
market rate when the loan was made. Incidental to the loan, we
were granted an option to purchase up to 50% of the owner’s
equity interest in the new building at a price of $24.2 million. Final
adjustments were made on April 15, 2011, bringing the total amount
of the loan and the purchase option to $24.5 million. The purchase
option expires at the end of the loan term.
other long-term liabilities
Other long-term liabilities consist primarily of accrued post-retirement
and post-employment benefits.
47BRITISH COLUMBIA FERRY SERVICES INC.

M A N A G E M E N T ’ S D I S C U S S I O N & A N A L Y S I S
sourCes & uses oF Cash
Our liquidity needs are met through a variety of sources, including cash generated from operations, issuance of bonds, and borrowings under our
credit facility. Our primary uses of funds are operational expenses, capital asset acquisitions and upgrades, and payments on our long-term debt.
Sources and uses of cash and cash equivalents for fiscal 2014 and 2013 are summarized in the table below:
increase
years ended march 31 ($ millions) 2014 2013 (decrease)
Cash and cash equivalents, beginning of year 36.6 7.7 28.9
Cash from operating activities:
Net earnings 18.0 15.5 3.0
Items not affecting cash 205.2 208.0 (3.3)
Changes in non-cash operating working capital (1.1) 1.6 (2.7)
Net interest paid (66.8) (70.5) 3.7
Cash generated by operating activities 155.3 154.6 0.7
Cash generated by (used in) financing activities 42.5 (8.8) 51.3
Cash used in investing activities (163.0) (116.9) (46.1)
net increase in cash and cash equivalents 34.8 28.9 5.9
cash and cash equivalents, end of year 71.4 36.6 34.8
For the year ended March 31, 2014, cash generated by operating activities increased by $0.7 million compared to the prior year, due to an increase
in net earnings and a decrease in interest paid, mainly offset by items not affecting cash and changes in non-cash operating working capital.
Cash generated by financing activities in fiscal 2014 was $42.5 million. This amount consisted of proceeds of $200 million from our October 2013 bond
issuance, partially offset by: the redemption of our $140 million bond series; $9.0 million in other long-term debt repayments; $6.0 million in dividends
paid on preferred shares; $1.4 million in bond financing costs; and $1.1 million repayment of finance lease obligations.
Cash used in financing activities in fiscal 2013 was $8.8 million. This amount consisted of $9.0 million in debt repayments on KfW loans; $17.7 million
in repayments of short-term debt; $6.0 million in dividends paid on preferred shares; and $1.0 million in repayment of finance lease obligations;
partially offset by the receipt of $25.0 million contributed surplus from the Province.
Cash used in investing activities in fiscal 2014 increased by $46.1 million compared to the prior year, mainly due to a $24.7 million increase in cash
used for capital expenditures; a $21.1 million increase in cash used for short-term investing; and a $0.3 million change in debt service reserves.
Cash used to purchase property, plant, equipment and intangible assets in fiscal 2014 totalled $125.3 million, compared to $100.6 million in the prior
year. (See “Investing in Our Capital Assets” below for detail of significant capital expenditures.)
48 ANNUAL REPORT 2013–2014

M A N A G E M E N T ’ S D I S C U S S I O N & A N A L Y S I S
FOURTh QUARTER RESULTSThe following provides an overview of our financial performance and selected operational statistics for the three months ended March 31 for each
of the past three fiscal years.
The fourth quarter reflects a seasonal reduction in traffic levels which we utilize to perform upgrades and major maintenance and refit programs
as well as to undertake mandatory inspections on the majority of our vessels.
2014 2013 2012
Operational StatisticsVehicle traffic 1,452,199 1,516,919 1,502,231
% (decrease)increase (4.3%) 1.0% (3.4%)
Passenger traffic 3,576,055 3,723,899 3,666,163
% (decrease)increase (4.0%) 1.6% (2.1%)
On-time performance 95.5% 95.4% 94.4%
Number of round trips 20,269 20,215 20,273
Capacity provided (AEQ’s) 3,959,608 4,124,740 4,080,430
AEQ’s carried 1,664,418 1,731,162 1,716,673
Capacity utilization 42.0% 42.0% 42.1%
Vehicle traffic decreased 4.3% and passenger traffic decreased 4.0% in the fourth quarter, compared to the same quarter in fiscal 2013. Vehicle traffic
decreased in both the Major and Other Routes while the Northern Routes experienced a small increase. We believe that this decrease was partially due
to the timing of the Easter holiday. The fourth quarter of fiscal 2014 did not include the Easter holiday weekend while the fourth quarter of fiscal 2013
included three days of the Easter holiday weekend. Traffic in the fourth quarter of fiscal 2014 was also negatively impacted by service alterations to
accommodate upgrades at some of our terminals, and adverse weather conditions as compared to the same period of the prior year.
Utilization in the three months ended March 31, 2014 remained at the same level as the same period in the prior year as a result of reduced capacity
resulting from a decrease in the number of round trips on the Major Routes, which offset the lower number of AEQs carried.
variance
Three months ended march 31 ($ millions) 2014 2013 $ %
Total revenue 153.9 150.5 3.4 2.3%
Operating expenses 175.2 170.7 (4.5) (2.6%)
Operating loss (21.3) (20.2) (1.1) (5.4%)
Net finance and other 17.0 16.9 (0.1) (0.6%)
net loss (38.3) (37.1) (1.2) (3.2%)
Other comprehensive (loss) income (5.0) 1.1 (6.1) (554.5%)
Total comprehensive loss (43.3) (36.0) (7.3) (20.3%)
Our total comprehensive loss in the three months ended March 31, 2014 was $7.3 million higher and the net loss was $1.2 million higher than
in the same quarter of fiscal 2013. The other comprehensive loss in fiscal 2014 reflects the $5.0 million unrealized hedge loss at March 31, 2014,
on interest rate forward contracts related to our April 28, 2014 issuance of $200 million of senior secured bonds. Fiscal 2014 net loss reflects
an increase in net operating expenses, lower traffic levels and lower ferry transportation fees, partially offset by increased fares and fuel surcharges.
49BRITISH COLUMBIA FERRY SERVICES INC.

M A N A G E M E N T ’ S D I S C U S S I O N & A N A L Y S I S
revenue
Our total revenues for the fourth quarter of fiscal 2014 increased slightly compared to the same quarter in the prior year, as shown in the following table:
increase (decrease)
Three months ended march 31 ($ millions) 2014 2013 $ %
direct route revenue
Vehicle tariff 56.3 56.2 0.1 0.2%
Passenger tariff 32.2 32.0 0.2 0.6%
Fuel surcharges 2.7 – 2.7 100.0%
Catering & on-board 13.3 13.3 – –
Social program fees 6.2 6.0 0.2 3.3%
Reservation fees 1.8 1.8 – –
Other revenue 2.0 1.7 0.3 17.6%
Total direct route revenue 114.5 111.0 3.5 3.2%
indirect route revenue
Ferry transportation fees 32.0 32.2 (0.2) (0.6%)
Federal-Provincial subsidy 7.1 7.0 0.1 1.4%
Total route revenue 153.6 150.2 3.4 2.3%
Other general revenue 0.3 0.3 – –
Total revenue 153.9 150.5 3.4 2.3%
Average tariff revenue per vehicle increased $1.72 or 4.6% in the quarter compared to the same period in the prior year and average tariff revenue per
passenger increased $0.41 or 4.8%. The higher average fares, largely offset by the decrease in traffic, resulted in a $0.3 million increase in tariff revenue.
On January 17, 2014, due to the high cost of fuel, we implemented a fuel surcharge of 3.5% on average on our Major Routes and our regulated
Other Routes. No surcharges were implemented on our unregulated or Northern Routes. There were no fuel surcharges in place in the fourth quarter
of fiscal 2013.
Catering and on-board revenues were at the same level as the fourth quarter of the prior year, due to an increase in average spending per passenger
offset by a decrease in passenger traffic on routes where these services are offered.
Social program fees increased by 3.3% as a result of a 1.9% increase in the number of seniors travelling and higher usage of the MTAP program
on our Major Routes, as well as an increase in fares. These increases were partially offset by lower usage of all programs on the Other Routes.
The increase in other revenue is mainly due to increases in parking revenue and stateroom rental.
Ferry transportation fees were lower primarily as a result of changes in funding from the Province as described above.
50 ANNUAL REPORT 2013–2014

M A N A G E M E N T ’ S D I S C U S S I O N & A N A L Y S I S
expenses
Our operating and net finance and other expenses for the fourth quarter of fiscal 2014 and fiscal 2013 are shown in the following tables:
(increase) decrease
Three months ended march 31 ($ millions) 2014 2013 $ %
Operating expensesOperations 106.6 103.1 (3.5) (3.4%)
Maintenance 18.0 20.4 2.4 11.8%
Administration 9.7 8.1 (1.6) (19.8%)
Total operations, maintenance & administration 134.3 131.6 (2.7) (2.1%)
Cost of retail goods sold 5.6 5.4 (0.2) (3.7%)
Depreciation and amortization 35.3 33.7 (1.6) (4.7%)
Total operating expenses 175.2 170.7 (4.5) (2.6%)
The increase in operations costs for the three months ended March 31, 2014, compared to the same period in the prior year, is due to a $1.9 million
increase in fuel costs as a result of higher fuel prices, a $0.7 million insurance claim recovery in the last quarter of fiscal 2013, $0.2 million in travel costs
mainly related to service alterations and various other increases, partially offset by reductions in contracted services. For purposes of rate regulation,
$4.7 million of our fuel expense for the quarter that resulted from higher prices is recorded in deferred fuel cost accounts for future recovery.
The decrease in maintenance costs reflects both decreases in terminal maintenance costs and variations in vessel refit scheduling.
The increase in administration costs is mainly due to a $0.7 million increase in computer software fees and licenses, a $0.6 million increase in wages
and benefits and increases in several other areas including materials and services and contracted charges.
Depreciation and amortization was $1.6 million higher in the quarter compared to the same period in the prior year as a result of the new capital
assets entering service.
(increase) decrease
Three months ended march 31 ($ millions) 2014 2013 $ %
Net finance and otherinterest expense
Bond interest 16.0 15.6 (0.4) (2.6%)
KfW loans 1.7 2.0 0.3 15.0%
Interest on finance lease 0.5 0.6 0.1 16.7%
Short-term debt 0.2 0.1 (0.1) (100.0%)
Capitalized interest (0.8) (0.5) 0.3 60.0%
Total interest expense 17.6 17.8 0.2 1.1%
Less: finance income (1.1) (0.9) 0.2 22.2%
net finance expense 16.5 16.9 0.4 2.4%
Loss on disposal and revaluation of property,
plant and equipment and intangible assets 0.5 – (0.5) –
Total net finance and other expenses 17.0 16.9 (0.1) (0.6%)
Net finance and other expenses in the quarter were $0.1 million higher compared to the same period in the prior year, primarily due to $0.5 million
in losses on disposal and revaluation of property, plant and equipment and intangible assets, mainly offset by $0.2 million decrease in net interest
expense and $0.2 million increase in finance income.
51BRITISH COLUMBIA FERRY SERVICES INC.

M A N A G E M E N T ’ S D I S C U S S I O N & A N A L Y S I S
SUMMARY OF QUARTERLY RESULTSThe table below compares earnings and comprehensive income by quarter for the most recent eight quarters:
Quarter ended (unaudited) ($ millions) mar 14 dec 13 sep 13 Jun 13 mar 13 dec 12 sep 12 Jun 12
Total revenue 153.9 174.8 271.5 200.0 150.5 169.6 268.6 197.7
Operating (loss) profit (21.3) 3.7 82.3 21.2 (20.2) 0.2 84.1 20.7
Net (loss) earnings (38.3) (12.3) 64.3 4.3 (37.1) (17.2) 66.5 3.3
Other comprehensive (loss) income (5.0) – 0.1 – 1.1 – – –
Total comprehensive (loss) income (43.3) (12.3) 64.4 4.3 (36.0) (17.2) 66.5 3.3
Quarterly results are affected by the seasonality of leisure travel patterns. The second quarter, covering the summer period, experiences the highest
traffic levels and the highest net earnings. The third and fourth quarters reflect a seasonal reduction in traffic. We utilize these periods to perform
upgrades and major maintenance and refit programs, as well as to undertake mandatory inspections on the majority of our vessels.
The following graph demonstrates the seasonality of our revenue and shows the relationship of traffic volume and tariff revenue over the most recent
eight quarters:
vehicle Tariff
Passenger Tariff
vehicle Traffic
Passenger Traffic
QUARTER ENDED
MAR 14 DEC 13 SEP 13 JUN 13 MAR 13 DEC 12 SEP 12 JUN 12
TAR
IFF
($ M
ILLI
ON
S)
TRA
FFIC
VO
LUM
E (M
ILLI
ON
S)
0
20
40
60
80
100
120
0
1
2
3
4
5
6
7
8
52 ANNUAL REPORT 2013–2014
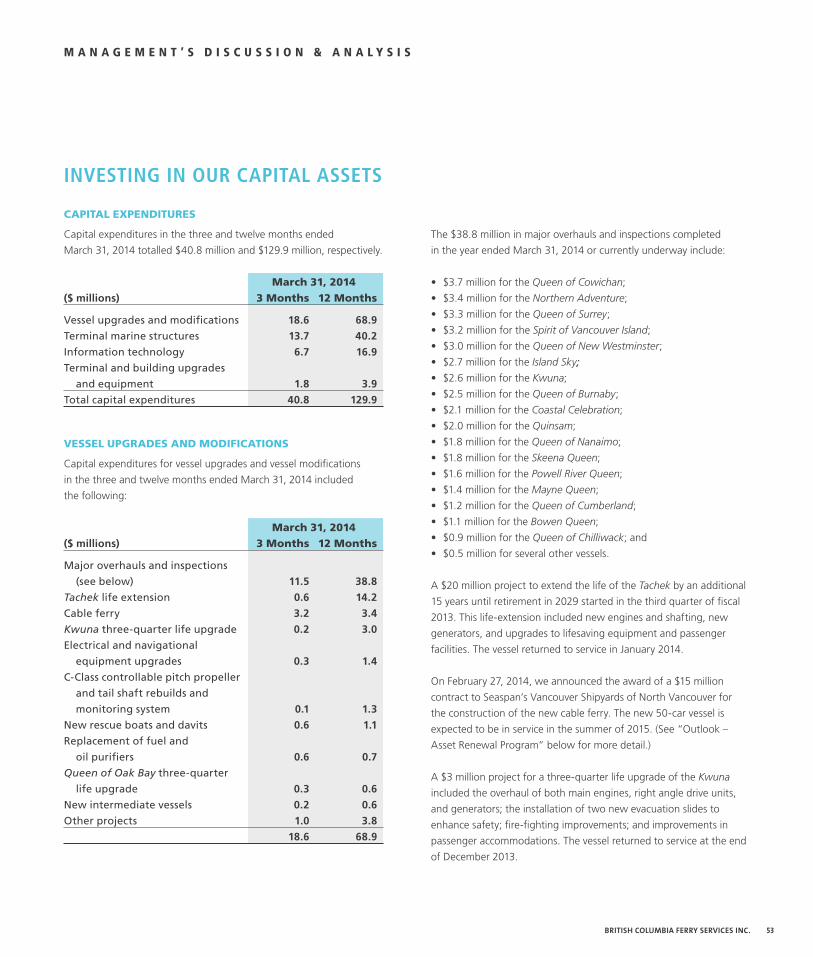
M A N A G E M E N T ’ S D I S C U S S I O N & A N A L Y S I S
The $38.8 million in major overhauls and inspections completed
in the year ended March 31, 2014 or currently underway include:
• $3.7 million for the Queen of Cowichan;
• $3.4 million for the Northern Adventure;
• $3.3 million for the Queen of Surrey;
• $3.2 million for the Spirit of Vancouver Island;
• $3.0 million for the Queen of New Westminster;
• $2.7 million for the Island Sky;
• $2.6 million for the Kwuna;
• $2.5 million for the Queen of Burnaby;
• $2.1 million for the Coastal Celebration;
• $2.0 million for the Quinsam;
• $1.8 million for the Queen of Nanaimo;
• $1.8 million for the Skeena Queen;
• $1.6 million for the Powell River Queen;
• $1.4 million for the Mayne Queen;
• $1.2 million for the Queen of Cumberland;
• $1.1 million for the Bowen Queen;
• $0.9 million for the Queen of Chilliwack; and
• $0.5 million for several other vessels.
A $20 million project to extend the life of the Tachek by an additional
15 years until retirement in 2029 started in the third quarter of fiscal
2013. This life-extension included new engines and shafting, new
generators, and upgrades to lifesaving equipment and passenger
facilities. The vessel returned to service in January 2014.
On February 27, 2014, we announced the award of a $15 million
contract to Seaspan’s Vancouver Shipyards of North Vancouver for
the construction of the new cable ferry. The new 50-car vessel is
expected to be in service in the summer of 2015. (See “Outlook –
Asset Renewal Program” below for more detail.)
A $3 million project for a three-quarter life upgrade of the Kwuna
included the overhaul of both main engines, right angle drive units,
and generators; the installation of two new evacuation slides to
enhance safety; fire-fighting improvements; and improvements in
passenger accommodations. The vessel returned to service at the end
of December 2013.
INVESTING IN OUR CAPITAL ASSETS
Capital expenditures
Capital expenditures in the three and twelve months ended
March 31, 2014 totalled $40.8 million and $129.9 million, respectively.
march 31, 2014($ millions) 3 months 12 months
Vessel upgrades and modifications 18.6 68.9
Terminal marine structures 13.7 40.2
Information technology 6.7 16.9
Terminal and building upgrades
and equipment 1.8 3.9
Total capital expenditures 40.8 129.9
vessel upgrades and modiFiCations
Capital expenditures for vessel upgrades and vessel modifications
in the three and twelve months ended March 31, 2014 included
the following:
march 31, 2014($ millions) 3 months 12 months
Major overhauls and inspections
(see below) 11.5 38.8
Tachek life extension 0.6 14.2
Cable ferry 3.2 3.4
Kwuna three-quarter life upgrade 0.2 3.0
Electrical and navigational
equipment upgrades 0.3 1.4
C-Class controllable pitch propeller
and tail shaft rebuilds and
monitoring system 0.1 1.3
New rescue boats and davits 0.6 1.1
Replacement of fuel and
oil purifiers 0.6 0.7
Queen of Oak Bay three-quarter
life upgrade 0.3 0.6
New intermediate vessels 0.2 0.6
Other projects 1.0 3.8
18.6 68.9
53BRITISH COLUMBIA FERRY SERVICES INC.

M A N A G E M E N T ’ S D I S C U S S I O N & A N A L Y S I S
A $0.7 million project to replace the original fuel and oil purifiers
on the Spirit of Vancouver Island and the Spirit of British Columbia
was substantially completed in fiscal 2014.
A $16 million project for a three-quarter life upgrade of the Queen
of Oak Bay will include significant pipe and steel renewal, upgrades
to the electrical system, replacement of the steering gear system,
upgrades to the fire protection system, standardization of the bridge
and replacing the emergency generator. The upgrade is expected
to be complete by the end of fiscal 2015.
A project to construct three new intermediate class vessels is
underway. We are currently reviewing the responses to the Request
for Proposals (RFP) we issued in December 2013. The new vessels
are expected to enter service in late 2016 through mid-2017 and will
replace the 49-year-old Queen of Burnaby and the 50-year-old Queen
of Nanaimo. The new vessels will be designed to operate as dual-fuel
capable, so they can run on LNG or marine diesel fuel. (See
“Outlook – Asset Renewal Program” below for more detail.)
Other ongoing projects include early costs for the mid-life upgrades
of the Queen of Capilano, the Spirit of Vancouver Island and the
Queen of Cumberland.
terminal marine struCtures
Capital expenditures for terminal marine structures in the three and twelve months ended March 31, 2014 included the following:
($ millions) march 31, 2014Terminal description 3 months 12 months
Westview Replacement of trestle, ramp, apron and towers 6.2 15.8
Little River Replacement of ramp, tower, wingwall and dolphin 2.3 8.1
McLoughlin Bay Berth modifications 3.3 7.2
Denman Island and Buckley Bay Modifications to accommodate the new cable ferry 0.2 1.3
Alert Bay Replacement of wingwalls, towers, ramp and aprons – 2.5
Fleet maintenance facility Dredging at Deas basin 0.6 0.8
Horseshoe Bay Transfer deck life-extension – 0.8
Various Install tie-up winches – 0.6
Port McNeill Replacement of trestle, ramp, apron and towers 0.6 1.1
Various Other projects 0.5 2.0
13.7 40.2
A $1.4 million project representing the second year of a four-year
program to upgrade 18 vessels with new electrical and navigational
equipment including searchlights, gyro compasses, depth sounders,
and radar equipment is complete. This will take us further towards
bridge standardization.
Several projects impacting our C-Class vessels (the Queen of
Cowichan, Queen of Coquitlam, Queen of Alberni, Queen of Surrey,
and the Queen of Oak Bay) either completed in fiscal 2014 or are
currently underway. Completed projects include improving vessel
propulsion systems by installing new controllable pitch propeller hub
systems on the Queen of Coquitlam and the Queen of Cowichan
and installing a vibration monitoring system of shaft bearings on all
five C-Class vessels that will reduce the operational risk of failures
to the propulsion system and provide cost savings by removing the
routine requirement to strip bearings for survey at refit. A project to
rebuild two spare tail shafts for potential use in upcoming overhauls is
expected to be complete by the end of the first quarter of fiscal 2015.
A $1.1 million project for new rescue boats and davits on the
Northern Adventure and Spirit of Vancouver Island was completed
in the fourth quarter.
54 ANNUAL REPORT 2013–2014

M A N A G E M E N T ’ S D I S C U S S I O N & A N A L Y S I S
At Westview terminal, an $18 million project to replace the existing
trestle with one with an improved approach radius, capacity to
carry heavier vehicles, two traffic lanes and a pedestrian sidewalk
was completed in the fourth quarter of fiscal 2014. The project also
included replacement of the ramp, ramp abutment, apron and towers
with active lift hydraulics and replacement of the waiting shelter.
At Little River terminal, a $9 million project to replace the ramp,
ramp abutment and towers with active lift hydraulics and replace
the wingwalls and dolphin was also completed in the fourth quarter.
At McLoughlin Bay, the $9 million project for berth modifications
includes installation of three pontoon sections and modification
of the berth to improve ship-to-shore tie-up. This project is expected
to be complete by the end of the first quarter of fiscal 2015.
Modifications at Denman Island and Buckley Bay terminals, as part
of the project for our new cable ferry service, include two contracts
totalling $15 million awarded for supply of two concrete floating
pontoons, construction of two berths, expansion of Denman West
holding compound and all associated upland development. These
modifications are expected to be complete by the end of the third
quarter of fiscal 2015. (See “Outlook – Asset Renewal Program”
below for more detail.)
At Alert Bay terminal, an $8 million project to upgrade wingwalls,
towers, aprons and ramp was substantially completed in the first
quarter of fiscal 2014, in time for the busy summer season.
At our maintenance facility in Richmond, we completed a $1 million
project for dredging Deas basin. This is done, as needed, every five
to six years to maintain the depth necessary to accommodate our
vessels in the basin.
At Horseshoe Bay terminal, a $2 million project to extend the life
of the transfer deck to provide an additional seven years of useful life
was completed in the third quarter of fiscal 2014.
A $1.8 million project for the installation of tie-up winches at Langdale,
Horseshoe Bay and Tsawwassen terminals was completed, including
final test fitting of vessels, in the fourth quarter of fiscal 2014.
At Port McNeill terminal, a $13 million project to replace the trestle,
wingwalls, ramp, apron, towers, and dolphin and reposition the new
ramp to accommodate all minor and intermediate vessels is underway.
This project is expected to be complete by the end of the third quarter
of fiscal 2015.
Other projects completed include a $0.6 million project to replace
the double-sided floating lead at Village Bay terminal, a $0.4 million
project at Crofton terminal to upgrade the ramp and life extend the
starboard wingwall and trestle and a $0.3 million project to upgrade
a ramp at Horseshoe Bay terminal.
55BRITISH COLUMBIA FERRY SERVICES INC.

M A N A G E M E N T ’ S D I S C U S S I O N & A N A L Y S I S
terminal and building upgrades and equipment
Capital expenditures for terminal and building upgrades and
equipment in the three and twelve months ended March 31, 2014
included the following:
march 31, 2014($ millions) 3 months 12 months
Vehicles and other equipment 0.5 1.3
Building improvements at
several terminals 0.4 0.9
Signage at terminals serving our
Major Routes 0.2 0.5
Terminal seismic upgrades – 0.5
Other terminal projects 0.7 0.7
1.8 3.9
Vehicles include eight additional hostling units to accommodate
the demand for our drop trailer service. Other equipment consists
primarily of items of equipment for our Richmond maintenance
facility, including marine diagnostic equipment, a turntable washer,
generator, electrical testing equipment, infrared measurement
equipment, forklifts and several other items.
Other terminal projects include construction of a new training
facility for training on life saving equipment; updating signage at
our terminals serving our Major Routes; seismic upgrades at certain
of our maintenance facilities; and a new pedestrian walkway at
Skidegate terminal.
inFormation teChnology
Capital expenditures for information technology in the three and
twelve months ended March 31, 2014 included the following:
march 31, 2014($ millions) 3 months 12 months
Customer service program 3.1 9.1
Payroll system replacement 1.2 3.1
Computer hardware upgrades 1.4 2.5
Infrastructure relocation program 0.8 1.5
Other projects 0.2 0.7
6.7 16.9
Our customer service program will replace our aged point of sale
and reservations systems and allow us to respond in a more timely
fashion to changing business needs and to support marketing,
travel services, and pricing initiatives. The main elements of this
multi-year program will be implemented in stages starting in 2015,
and are expected to be completed in 2017. We believe this program
will significantly improve our ability to efficiently respond to the
changing needs of our customers. A total of $8 million in software
and hardware is currently in service, including software to allow
customers to book their travel on-line.
Our payroll system replacement initiative will replace both our payroll
and labour distribution systems to provide added reliability and
significant processing efficiencies and flexibility. It is expected to be
complete before the end of fiscal 2015.
Computer hardware upgrades continue as we proceed through our
programs for replacement of aged computers, servers, cash registers,
printers and digital signage.
The infrastructure relocation program will relocate our prime data centre
facility to the interior of British Columbia to mitigate risk in the event of
a major incident such as an earthquake. Our secondary infrastructure
site will be expanded to house our pre-production infrastructure and
serve as our production environment for disaster recovery in the unlikely
event that the interior data centre production services are interrupted.
Completion is expected by the end of fiscal 2015.
Projects completed in fiscal 2014 include a new internal control
management system, upgrades to simplify the process for customers
making a reservation on our website and enhancements for improved
supply chain management.
56 ANNUAL REPORT 2013–2014

M A N A G E M E N T ’ S D I S C U S S I O N & A N A L Y S I S
OUTLOOK
traFFiC levels
Ferry traffic levels are affected by a number of factors, such as the economy, weather, transportation costs (including vehicle gasoline prices and
ferry fares), the value of the Canadian dollar, global security, tourism levels, disposable personal income, demographics, and population growth.
We are uncertain as to the individual or cumulative impact these items may have on our traffic levels. We are also uncertain as to the cumulative
impact that tariff rate increases and the implementation and removal of fuel surcharges or rebates may have.
A summary of vehicle and passenger traffic over the last six years is shown below and a discussion of the changes over the years is discussed above
in the “Financial and Operational Overview”.
(thousands) 2014 2013 2012 2011 2010 2009
Vehicle Traffic by fiscal yearMajor routes 4,556.8 4,600.6 4,637.9 4,811.0 4,859.0 4 796.1
Other routes 3,059.1 3,120.3 3,172.4 3,279.2 3,365.3 3,302.6
Northern routes 28.4 27.8 27.6 29.3 31.1 31.7
Total 7,644.3 7,748.7 7,837.9 8,119.5 8,255.4 8,130.4
(Decrease) increase (1.3%) (1.1%) (3.5%) (1.6%) 1.5% (5.2%)
(thousands) 2014 2013 2012 2011 2010 2009
Passenger Traffic by fiscal yearMajor routes 12,708.7 12,777.2 12,920.8 13,309.7 13,388.3 13,191.8
Other routes 6,906.9 7,061.0 7,168.5 7,350.5 7,559.1 7,441.7
Northern routes 81.1 80.9 80.7 86.0 88.2 94.0
Total 19,696.7 19,919.1 20,170.0 20,746.2 21,035.6 20,727.5
(Decrease) increase (1.1%) (1.2%) (2.8%) (1.4%) 1.5% (4.9%)
Fiscal 2014 traffic was negatively impacted by the timing of the Easter holiday. Fiscal 2014 included one day of the Easter holiday weekends
(April 1, 2013), while fiscal 2013 included seven days of Easter holiday weekends (April 6 through 9, 2012 and March 29 through 31, 2013).
We believe that, after adjusting for this timing of Easter holiday weekend, fiscal 2014 traffic levels were generally flat compared to fiscal 2013.
Fiscal 2014 traffic was also negatively impacted as a result of service alterations to accommodate upgrades at some of our terminals.
We believe the outlook for the travel industry and the US economy has improved, though not significantly. We also see signs of modestly improving
consumer confidence and spending which are especially positive for the leisure travel segment. We expect these improvements will result in a limited
recovery in discretionary traffic levels. In the near term, we anticipate no significant increase or decrease in overall traffic volume on all our routes.
market opportunities
We are constantly looking for innovative ways to serve our customers and actively pursue opportunities for growth.
Our drop trailer service, launched in March 2009, operates on two of our Major Routes. Our commercial customers on these routes can drop their
trailers off at one terminal and pick them up at another. This drop trailer service is the fastest growing segment of our market with increases in
revenue over the past three years of 15%, 34%, and 54%, respectively. The service also improves our overall productivity by utilizing otherwise unused
capacity. We expect to see modest growth in drop-trailer traffic over the next few years as general economic conditions improve and our overall
commercial market share remains relatively stable.
57BRITISH COLUMBIA FERRY SERVICES INC.

M A N A G E M E N T ’ S D I S C U S S I O N & A N A L Y S I S
In May 2010, we opened our vacations centre, which is conveniently located in the tourist sector of downtown Vancouver. Through the use of our
travel centre and an integrated marketing approach, we are able to leverage our core business to drive incremental ferry traffic as well as generate
commissions from the related services. Using a 37-foot long interactive media wall display, customers are able to view route maps, vessel schematics,
and destination images to help them choose from a variety of travel package options. In fiscal 2014, the number of vacation packages sold generated
over $3.3 million in revenue, an increase of 12.6% over the prior year. As the economy strengthens, we expect to see continuing growth, leading
to increased traffic volumes as well as incremental non-tariff revenue.
We also have opportunities for continued growth with our onboard retail gift shops. Over 40% of our gift shop sales are clothing. Sales of our quality
clothing have grown over the past three years with increases of 14.6%, 13.8%, and 14.8%, respectively.
asset renewal program
We have one of the largest fleets in the world. The average age of our assets was among the oldest of major ferry operators worldwide. To address
this, we instituted a multi-year major fleet and asset renewal program which involved upgrading and replacing a large share of our major vessels
and terminal assets.
Over a number of years, this program saw seven new vessels being added to our fleet, many other vessels significantly upgraded and numerous
improvements to our terminal assets. The entry of the new vessels into service and asset revitalization reduced the average age of our major vessels
from 33 years to 19 years and has assisted in maintaining operational reliability. The most significant portion of this asset renewal program was
completed during fiscal 2008 and 2009.
($ millions) 2014 2013 2012 2011 2010 2009 2008
Capital expenditures by fiscal yearVessel upgrades & modifications 64.9 39.9 47.6 43.8 21.5 75.7 53.7
Terminal marine structures 43.6 27.5 44.0 41.6 22.5 31.0 26.6
Information technology 16.9 20.6 18.6 17.2 15.5 14.2 15.2
Terminal & building upgrades & equipment 3.9 7.2 11.1 24.5 15.1 24.3 27.9
Total (without new vessels) 129.3 95.2 121.3 127.1 74.6 145.0 123.4
New vessels 0.6 1.4 0.9 1.6 6.8 348.7 329.1
Total (including new vessels) 129.9 96.6 122.2 128.7 81.4 493.9 452.5
In fiscal 2010, the costs for the new major vessels were finalized and design costs for new minor and intermediate sized vessels, including the cable
ferry, began. The typical life span of vessels is 40 to 45 years and our minor and intermediate sized vessels currently have an average age of 37 years.
As the identified replacement dates approach, we are reviewing these vessels to determine potential candidates for life extension rather than
replacement. Our expectation is that we will need to replace or life extend 11 of these vessels over the next 10 years and 42% of the total capital
expenditures we forecast incurring over this period are for new vessel projects.
The first of the new vessels will be a cable ferry as detailed below. When the cable ferry comes into service, it will allow us the option to retire the
50-year-old Tenaka.
Our strategy for new vessels includes design optimization, interoperability, and standardization of vessels across the fleet, to the extent possible, to
provide more flexibility to respond to changes in the market demand and traffic forecasts. We also plan to adopt LNG as a fuel source where economic.
58 ANNUAL REPORT 2013–2014

M A N A G E M E N T ’ S D I S C U S S I O N & A N A L Y S I S
In December 2013, we issued an RFP to five pre-qualified shipyards,
including one Canadian proponent, to participate further in our
procurement process to design and build three new intermediate class
vessels to replace the 48-year-old Queen of Burnaby and the 49-year-old
Queen of Nanaimo. Both of these vessels are scheduled for retirement
in 2016. We intend to replace them with three open-deck vessels;
each with the capacity to carry 145 AEQs. The RFP stipulates that
these three vessels be designed to operate as dual-fuel capable,
so they can run on LNG or marine diesel fuel. We are currently
reviewing the responses to the RFP. Two of the vessels are expected
to enter service in 2016 and the third vessel is expected to join the
fleet in 2017. These vessels will set a new standard of efficiency with
standardized bridges, engine rooms and lifesaving equipment moving
us to a higher safety standard and improving interoperability. We
are pursuing funding under incentive programs to help offset any
incremental capital costs associated with the use of LNG.
Besides new vessel projects, our 10-year capital plan includes many
vessel betterment projects, including mid-life upgrades of the Spirit of
Vancouver Island and Spirit of British Columbia and terminal upgrades,
including at our Langdale and Horseshoe Bay terminals.
Cable Ferry
After many years of studying the feasibility of a cable ferry,
performing extensive design and analysis and obtaining regulatory
approvals, the cable ferry project for service on one of our shortest
routes between Buckley Bay on Vancouver Island and Denman Island
is now underway. This is an innovative initiative and is part of our
ongoing efforts to identify and pursue opportunities that have the
potential to enhance our cost effectiveness in delivering safe, reliable
and quality ferry service.
Compared to the current service, it is projected that, over 40 years,
the cable ferry will provide over $80 million in cost savings as
well as significant environmental benefits, including: reduced fuel
consumption; lower air emissions; reduced wake; no propeller
turbulence; low anti-fouling discharge; low propeller scour; and
zero discharge to the marine environment.
On February 20, 2014, in response to our December 20, 2013
application, we received a decision from the Commissioner confirming
that the expenditures required to implement the cable ferry system on
the route connecting Buckley Bay and Denman Island are reasonable
and prudent. This decision included reasonable conditions which we
are confident we will be able to meet.
On February 27, 2014, we announced the award of a $15 million
contract to Seaspan’s Vancouver Shipyards of North Vancouver for the
construction of the new cable ferry. On March 19, 2014, we announced
the award of two contracts totalling $15.2 million for construction of
Buckley Bay and Denman Island West cable ferry berths. The berth
contracts include an award to Vancouver Pile Driving Ltd. for
supply of two concrete floating pontoons and another award to
Ruskin Construction Ltd. of Victoria for construction of two berths,
expansion of Denman West holding compound and all associated
upland development. Terminal construction is expected to be
complete by the end of the third quarter of fiscal 2015 and the new
50-car vessel is expected to be in service in the summer of 2015.
Fuel Conversion
On October 29, 2012, we submitted a fuel strategies report to the
Commissioner which included our plan for transition to alternate
fuels. Both LNG and the marine diesel we currently use meet all
current domestic and international emissions regulations as well
as the new regulations which will be effective January 1, 2015.
We have studied the feasibility of using LNG and believe that a move
to this fuel source would reduce costs and emissions. At this time,
LNG is over 50% less expensive than the ultra-low sulphur diesel
we currently use and has significantly less emissions. We believe that
LNG is a viable option for future new vessels and, as noted above,
our three new intermediate vessels will have the capability to run
on it. We are also analyzing LNG as an option for existing vessels
undergoing major retrofits and intend to pursue the option where it is
economically and technically feasible. We have several existing vessels
scheduled for mid-life upgrades beginning in fiscal 2015.
alternative serviCe providers
In an effort to reduce costs on our regulated routes, and consistent
with section 69 of the Act, from time to time we test the market
to determine if another operator, under contract to us, could provide
safe, reliable and high quality service that is more cost-effective.
regulation
On January 1, 2013, the requirement to maintain a Shipboard Energy
Efficiency Management Plan (SEEMP) came into force for all vessels
governed by International Maritime Organization (IMO) standards.
Our only vessel under IMO standards is the Northern Adventure.
The Canada Shipping Act, 2001 has adopted this IMO standard for
vessels of over 400 gross tonnage and now a SEEMP is required
59BRITISH COLUMBIA FERRY SERVICES INC.

M A N A G E M E N T ’ S D I S C U S S I O N & A N A L Y S I S
We expect positive net earnings in fiscal 2015, reflecting adjustments
to service levels, a modest increase in fares, and continued
cost management, coupled with a gradual improvement in the
overall economy.
FINANCIAL RISKS AND FINANCIAL INSTRUMENTSExposure to credit risk, liquidity risk and market risk arises in the
normal course of our business. We manage market risk arising from
the volatility in foreign currency, interest rate, and fuel price exposures
in part through the use of derivative financial instruments including
forward contracts, swaps and options. We do not utilize derivative
financial instruments for trading or speculative purposes.
Fair value estimates are made at a specific point in time, based
on relevant market information and information about the financial
instrument. These estimates cannot be determined with precision
as they are subjective in nature and involve uncertainties and matters
of judgment. Where the market prices are not available, fair values
are estimated using discounted cash flow analysis based on our
current borrowing rate for similar borrowing arrangements.
Credit risk
Our exposure to credit risk is limited to the carrying value on our
statements of financial position for cash, short-term investments,
derivative assets and trade and other receivables. There is a risk that a
third party may fail to meet its obligations under the terms of a financial
instrument, however, we do not believe that it is a significant risk.
risk mitigation: We limit our exposure to credit risk on cash and
investments by investing in liquid securities with high credit quality
counterparties, and placing limits on the tenor of investment
instruments and maximum investments per counterparty. We
manage credit exposure related to financial instruments by dealing
with high credit quality institutions, in accordance with established
policy and parameters and by an ongoing review of our exposure to
counterparties. Counterparty credit rating and exposures are subject
to approved credit limits and are monitored by us on an ongoing
basis. Counterparties with which we have significant derivative
transactions must be rated “A” or higher. We do not expect any
counterparties to default on their obligations.
for the majority of our vessels. We have completed an initial
implementation on one of our vessels and expect to have
implementation complete on each vessel prior to renewal of their
annual Air Pollution Prevention Certificates. We do not expect any
significant impact as a result of the new requirement and view this as
an opportunity to implement, evaluate and share local initiatives for
improving vessel operating efficiency.
New regulations are now in force to address air emissions from
vessels over 400 gross tonnage. The Regulations Amending the Vessel
Pollution and Dangerous Chemicals Regulations, promulgated under
the Canada Shipping Act, 2001 were published on May 8, 2013.
Among other things, the amendments implement standards for
the North American Emission Control Area (ECA). Vessels operating
inside the ECA are required to meet certain sulphur dioxide, nitrogen
dioxide and particulate levels. We are currently well below the
2015 requirements regarding sulphur dioxide, and requirements for
nitrogen dioxide levels for new vessels can be met through the use
of LNG or the installation of exhaust scrubber technology.
We expect composting bylaws banning landfill disposal of organics to be
implemented in Metro Vancouver in fiscal 2015. We are well positioned
for these new bylaws as we currently have a composting program which
we are expanding in early fiscal 2015 to a third Major Route.
The designation of marine protected areas and use of integrated
marine management is gaining momentum within the coastal waters
of British Columbia. There are currently a number of marine area
planning processes underway that will decide who has access to
marine resources and how these resources are managed. We are
paying close attention to these processes to ensure there is no impact
on our operations.
FinanCial outlook
We do not anticipate that economic conditions will materially change
although we estimate that service reductions (See “Corporate
Structure – Economic Regulatory Environment”) may result in a small
reduction in our traffic levels in the near term. We are continuing our
program of cost containment and deferrals, while maintaining safe,
reliable service. However, we have no plans to reduce our planned
refit and maintenance programs, training and safety programs or
capital programs.
60 ANNUAL REPORT 2013–2014

M A N A G E M E N T ’ S D I S C U S S I O N & A N A L Y S I S
Our credit risk from trade customers is limited by having a large and
diversified customer base and is managed through the review of
third-party credit reports, utilizing pre-authorized payment plans,
monitoring of aging of receivables, and collecting deposits and
adjusting credit terms for higher risk customers. Amounts due from
the Province and the Government of Canada are considered low credit
risk. At March 31, 2014, 52% of our trade and other receivables were
comprised of amounts due from the Province and the Government
of Canada and 100% of our trade and other receivables are current.
liquidity risk
We target a strong investment grade credit rating to maintain capital
market access at reasonable interest rates. Our financial position
could be adversely affected if we fail to arrange sufficient and cost
effective financing to fund, among other things, capital expenditures
and the repayment of maturing debt. This is subject to numerous
factors, including the results of our operations, our financial position,
conditions in the capital and bank credit markets, ratings assigned
by rating agencies and general economic conditions.
We deem liquidity risk to be low at this time as we do not foresee
the need to access the capital markets in the near term.
risk mitigation: We manage liquidity risk through daily monitoring
of cash balances, the use of long-term forecasting models and the
maintenance of a credit facility and debt service reserves. Our credit
ratings at March 31, 2014, were “A” (DBRS) with a stable trend and
“AA-” (S&P) with a stable outlook.
market risk
inTeresT raTe
Our exposure to interest rate risk is limited to interest expenses associated
with our short-term borrowings, floating rate debt and any new
long-term issues and to earnings associated with interest rate movement
beyond the term of the maturity of fixed rate short-term investments.
risk mitigation: To manage this risk, we maintain between 70%
and 100% of our debt portfolio in fixed rate debt, in aggregate.
In addition, we may enter into interest rate agreements to manage
our exposure on debt instruments. At March 31, 2014 we had entered
into interest rate forward contracts to reduce such exposure on our
April 28, 2014 bond issue. (See “Liquidity and Capital Resources”
above for more detail.) A 50 basis point change in interest rates would
not have had a significant effect on our fiscal 2014 earnings.
foreign currency
We are also exposed to risk from foreign currency prices on financial
instruments, such as accounts payable denominated in currencies
other than the Canadian dollar.
risk mitigation: To manage exposure on future purchase
commitments, we review our foreign currency denominated
commitments and hedge through derivative instruments as necessary.
With the possible exception of fuel prices (see discussion below),
a 10% change in the US dollar or Euro foreign exchange rates would
not have had a significant effect on our fiscal 2014 earnings.
fuel Price
Our exposure to fuel price risk is associated with the changes
in the Canadian market price of marine diesel fuel. Fuel costs
have fluctuated significantly over the past few years and there
is uncertainty of the cost of fuel in the future.
High levels of fuel pricing could translate into significant fuel
surcharges and result in unprecedented total tariff levels. There
is uncertainty of the impact on future ferry traffic levels if fuel
surcharges and therefore total tariff levels rise significantly. There is
a risk of a decline in ferry traffic levels as a result of increasing
customer costs resulting from the implementation of fuel surcharges.
risk mitigation: To mitigate the effect of volatility in fuel oil prices
on our earnings, we use deferred fuel cost accounts together
with fuel surcharges or rebates as required. (See “The Effect of Rate
Regulation” above for more detail.)
We may enter into hedging instruments in order to reduce fuel price
volatility and add a fixed component to the inherent floating nature
of fuel prices. Fuel price hedging instruments are used solely for the
purpose of reducing fuel price risk, not for generating trading profits.
Pursuant to our Financial Risk Management Policy, the term of the
contracts is not to extend beyond three years. This policy limits hedging
to a maximum of 95% of anticipated monthly fuel consumption for the
immediately following 12 month period, 90% of anticipated monthly
fuel consumption for the 12 month period thereafter, and to 85%
of anticipated monthly fuel consumption for the remaining 12 month
period. Fuel forward contracts are only entered into when there is a
reasonable likelihood that the hedge will result in a net procurement
cost per litre less than or equal to the set price per litre established
by the Commissioner. At March 31, 2014, we did not have any
outstanding fuel forward contracts. Gains and losses resulting from
fuel forward contracts are recognized as a component of fuel costs.
61BRITISH COLUMBIA FERRY SERVICES INC.

M A N A G E M E N T ’ S D I S C U S S I O N & A N A L Y S I S
derivaTives
We hedge our exposure to fluctuations in fuel prices, foreign currency exchange rates and interest rates from time to time through the use of
derivative instruments. At March 31, 2014 we held four foreign exchange forward contracts with a carrying and fair value liability of $7 thousand while
at March 31, 2013 we held three such contracts with a carrying and fair value liability of $12 thousand. Also, at March 31, 2014 we held four interest
rate forward contracts with a carrying and fair value liability of $5.3 million. There were no commodity derivatives in place at March 31, 2014 and no
interest rate forward contracts or commodity derivatives in place at March 31, 2013.
At March 31, 2014, with the application of hedge accounting, the $5.1 million effective portion of the unrealized loss of $5.3 million was recognized
in other comprehensive income and the $0.2 million ineffective portion was recognized in net earnings. The realized hedge gains/losses related to
these forward contracts will be included in the initial carrying amount of the bonds and will be reclassified from accumulated other comprehensive
income and recognized in net earnings over the 30-year life of the debt instruments hedged.
The fair value of commodity derivatives would reflect only the value of the commodity derivatives and not the offsetting change in value of the
underlying future purchase of fuel. The fair values would reflect the estimated amounts that we would receive or pay should the derivative contracts
e terminated at the stated dates. For regulatory purposes, any gains or losses related to fuel commodity swaps would be charged to our deferred
fuel cost accounts. (See “The Effect of Rate Regulation” above for more detail.)
non-derivaTive financial insTrumenTs
The carrying and fair values of non-derivative financial instruments at March 31, 2014, and 2013 are as follows:
2014 2013
($ millions) Carrying value Fair value carrying value fair value
Financial AssetsCash and cash equivalents 71.4 71.4 36.7 36.7
Restricted short-term investments 35.8 35.8 35.6 35.6
Other short-term investments 81.0 81.0 43.4 43.4
Trade and other receivables 16.6 16.6 18.1 18.1
Long-term loan receivable 24.5 24.5 24.5 24.5
229.3 229.3 158.3 158.3
Financial LiabilitiesAccounts payable and accrued liabilities 48.1 48.1 51.8 51.8
Interest payable on long-term debt 19.6 19.6 18.1 18.1
Provisions 51.3 51.3 50.8 50.8
Long-term debt, including current portion 1,336.8 1,515.1 1,286.2 1,486.7
1,455.8 1,634.1 1,406.9 1,607.4
The fair value of all financial instruments included above, with the exception of long-term debt, approximate their carrying amounts due to the nature
of the item and/or the short time to maturity.
The carrying value of long-term debt is measured at amortized cost using the effective interest rate method. Fair value is calculated by discounting
the future cash flow of each debt issue at the estimated yield to maturity for the same or similar issues, or by using available quoted market prices.
62 ANNUAL REPORT 2013–2014

M A N A G E M E N T ’ S D I S C U S S I O N & A N A L Y S I S
BUSINESS RISK MANAGEMENTWe continue to employ a variety of commonly accepted
methodologies to identify, assess and mitigate risks. We have
processes in place throughout our company to manage risks
that inevitably arise in the normal course of business. We have
an integrated approach to managing risk, involving our Board
of Directors through to our employees.
Our Board of Directors is responsible for ensuring that we have the
appropriate policies, procedures and systems in place to identify
and manage the principal risks of our business. Management keeps
the Board and its Committees apprised of changing risks and
the processes and systems used to mitigate them. The individual
Committees of the Board regularly consider and review internal
processes for managing those risks that are specific to the areas of
our business for which they have oversight responsibility, and obtain
assurance from management and internal audit, as appropriate,
regarding the adequacy of the associated risk management processes.
Individual business units are responsible for considering risk exposures
at all levels within their unit and also for considering the possible
impact such risks may have on other areas. To ensure we focus on
safety as our first priority, all operational meetings are expected to
start with safety as the first item on the agenda. This helps ensure
that safety and risk are always front and center for all employees.
A culture that promotes the management of risk as part of each
employee’s daily activities is integral to our program. One way we
promote this culture is through our SailSafe program. Employees are
provided with a risk-based ALERT tool that can facilitate change in
the specific task or process or within other areas of the company if
the risk is applicable to other aspects of operations. We have also
introduced an on-line operational risk register.
We do not believe that material uncertainties exist in regards to our
future. As part of our risk management strategies, we have considered
many items such as profitability levels, cash generating potential,
cash utilization requirements including debt repayment schedules and
future capital expenditures, and working capital requirements. We
have taken measures to allow us to weather the stagnant economic
environment and ensure a viable, profitable future.
The following is a list of our business risks.
Customer demand
Our vehicle and passenger traffic levels in fiscal 2014, as compared to
the prior year, declined 1.3% and 1.1%, respectively. The decline was
experienced in both the Major and Other Routes while the Northern
Routes experienced a modest increase. We believe that, after
adjusting for the timing of the Easter holiday weekend, fiscal 2014
traffic levels were generally flat compared to fiscal 2013.
Effective April 1, 2014, the Province reduced the passenger fare
discount for BC seniors travelling Monday to Thursday to 50% from
100% on the Major and Other Routes. We believe that this will have
a negative impact on our traffic levels.
Many factors affect customer demand, including current economic
conditions, the value of the Canadian dollar, levels of tourism,
demographics and population growth. The cost of transportation,
including the price of fuel at the pump and ferry fares (including the
implementation and removal of fuel surcharges or rebates), disposable
personal income, heightened global security and weather conditions
may have a negative effect on discretionary travel and levels of tourism.
We are uncertain as to the individual or cumulative impact these items
may have on our revenue. No assurance can be given as to the level
of traffic on our system and the resulting tariff revenues.
risk mitigation: We are constrained by the CFSC, which stipulates,
among other things, the number of round trips that must be provided
for each regulated ferry route. Within these constraints, we actively
manage our capacity in an efficient and effective manner to ensure
we can react quickly to changing levels of demand within the
restrictions of the CFSC.
In fiscal 2013, the CFSC was amended to allow a reduction in the
service requirement on three of our Major Routes and set targets
for further service level reductions system wide. We implemented
reductions in round trips on those Major Routes, where the traffic
levels no longer warranted extra service or where service was
significantly under-utilized. In fiscal 2014, the CFSC was again
amended to allow for further reductions in the service requirement
and effective April 28, 2014, we implemented reductions in round
trips on our Northern and Other Routes. On April 1, 2015, further
reductions will be made on three of our Major Routes.
63BRITISH COLUMBIA FERRY SERVICES INC.
M A N A G E M E N T ’ S D I S C U S S I O N & A N A L Y S I S
saFety
The safety of the public and our employees is our highest priority.
However, there is a risk to passenger and employee safety and/or
property damage as a result of the ineffectiveness of policy and
procedures, equipment, maintenance, training, supervision, facility
design and security measures.
We also have significant food and beverage sales, both on our
vessels and at our terminals, and there is a risk of a foodborne
illness contracted from contaminated products purchased from
our food services.
A significant damage, injury or illness event could have an adverse
effect on the lives of our employees and customers, our ability to
meet operational service requirements, the environment, staff morale,
our reputation and our financial position and results of operations.
risk mitigation: Our safety program, SailSafe, launched in fiscal
2008, is a joint initiative with the Union and involves all employees.
It has been successful in changing our culture of safety awareness.
The objective of the SailSafe program is to ensure that safety is kept
as the primary concern in the minds of our employees each and every
day. As part of the SailSafe program, we have upgraded our safety
management system including the introduction of an operational risk
assessment and management process.
Our food storage, handling, preparation and cooking procedures
are aligned with the hazard analysis critical control point (HACCP)
methodology which is a preventive approach to food safety. HACCP
is an industry-wide effort approved by the scientific community,
as well as by regulatory and industry practitioners.
We adhere to a program of internal and external safety audits
designed to verify our compliance with our safety management
system. In fiscal 2014, we participated in the BC Maritime Employers
Association’s Certificate of Recognition Program which takes
participating companies beyond basic safety compliance and sets
an industry standard for developing a safety management system.
The results of the audit concluded that we should receive a 90%
score on the health and safety section and a 91% score on the injury
management section, qualifying us for our first ever Certificate of
Recognition. As a result of the audit, 31 recommendations were
submitted to us that we are currently reviewing, with a view toward
continual improvement.
Vessel planning strategies are in place with the goal of
standardization so we can better respond to changes in customer
demand. We also regularly review and update our short and
long-term financial and operating plans to ensure appropriate
alignment of expenses with revenue.
seCurity
Deliberate, malicious acts could cause death, injury or property
damage. The occurrence of a major incident or mishap could
negatively affect the propensity for the public to travel, reducing
our ferry traffic levels. It could also lead to a substantial increase in
insurance and security costs. Any resulting reduction in tariff revenues
and/or increases in costs could have a material adverse effect on
our business prospects, financial condition and results of operations.
risk mitigation: Security initiatives are in place to counter intentional
attacks. Our 24-hour operations and security centre provides
enhanced situational awareness and assessments, increased security
monitoring, and a coordinated response during any incidents.
We have completed our multi-year project to upgrade security at our
terminals and maintenance facilities. The project primarily involved
fencing, gating, lighting, access controls, and closed circuit television,
as well as upgrades to foot passenger ticketing areas, baggage
screening, and the use of canine patrols. Although this major project
is complete, we continue to make improvements in the security
on our vessels and at our terminals and maintenance facilities.
We are also in the process of relocating our prime data centre facility
to the interior of British Columbia to mitigate risk in the event of a
major incident such as an earthquake. Our current infrastructure site
will be expanded to house our pre-production infrastructure and serve
as our production environment for disaster recovery in the unlikely
event that the interior data centre production services are interrupted.
We also have a sound conventional insurance program designed
to mitigate the financial impact of a major incident. However, there
can be no guarantee that the insurance coverage will be sufficient
to cover all such incidents.
64 ANNUAL REPORT 2013–2014

M A N A G E M E N T ’ S D I S C U S S I O N & A N A L Y S I S
We also have a sound conventional insurance program designed
to mitigate the financial impact of a major incident. However, there
can be no guarantee that the insurance coverage will be sufficient
to cover all such incidents.
seCurity oF inFormation
Deliberate or inadvertent release of confidential or sensitive
information, whether in paper or electronic format, could have an
adverse effect on the lives of our employees and customers as well
as negatively impact our reputation. A significant loss of confidential
management information could also negatively impact our financial
position and results of operations.
risk mitigation: Governance is in place for ensuring information privacy.
Our information security policy has been developed and implemented.
Standard procedures for access and use of private data have been
implemented. Multiple levels of technology controls are in place
and networks, websites and databases are monitored by dedicated
information technology security staff to detect potential issues.
Information technology projects are delivered using the ‘security
by design’ principle. Regular security scans by trusted and qualified
vendors are conducted on a quarterly basis.
Communication to employees of their responsibility to protect private
information is ongoing and a formal awareness and training program
is in place.
regulations – other
Our operations are subject to a wide variety of national and local laws
and regulations, all of which may change at any time.
There is the potential that the introduction of new safety or other
regulations, including new taxes, or the interpretation of existing
regulations, may impose a new, unexpected and significant cost
burden and/or result in major disruptions to our operations.
risk mitigation: We foster positive relationships with local officials
and treat recommendations and advisories with respect and due
consideration. Appeals are made to higher authorities as required.
We continue to seek reasonable and cost effective solutions for
compliance with new regulations through our planning processes
and asset renewal initiatives.
We also have the opportunity to apply to the Commissioner under
section 42 of the Act for an extraordinary price cap increase or other
relief if the introduction of new safety or other regulations impose
a new, unexpected and significant cost burden.
eConomiC regulatory environment
We cannot predict what changes the Province may make to the Act
or to other legislation, nor can we predict how the Commissioner’s
interpretation and administration of the Act may change over time.
Such changes may impact our profitability. (See “Corporate Structure –
Economic Regulatory Environment” above for more detail.)
The Commissioner has released the final price caps for the
remaining two years of performance term three, April 1, 2014 to
March 31, 2016. These price caps represent increases of 4.0% at
April 1, 2014 and 3.9% at April 1, 2015. The order indicated the
Commissioner has the intention of allowing us to achieve, by the end
of the third performance term, equity not lower than 17.5% of total
capitalization and a DSCR of 2.5 or higher. There remains uncertainty
in the Commissioner’s future price cap rulings.
risk mitigation: We strive to maintain regular and open
communications and positive relationships with the Province, the
Commissioner, the Deputy Commissioner and local Ferry Advisory
Committees that represent the interests of the communities we serve.
aCCess to Capital markets
Our ability to arrange sufficient, cost-effective and timely debt
financing could be materially adversely affected by numerous factors:
our economic regulatory environment, our results of operations and
financial position, market conditions, our credit ratings and general
economic conditions.
Any failure or inability to borrow on satisfactory terms when required
could impair our ability to repay maturing debt, fund necessary capital
expenditures and meet other obligations and requirements and, as a
result, could have a material adverse effect on our ongoing operations.
65BRITISH COLUMBIA FERRY SERVICES INC.

M A N A G E M E N T ’ S D I S C U S S I O N & A N A L Y S I S
We are also actively pursuing LNG options for new vessels and vessels
undergoing major retrofits because we believe that a move to this
fuel source would reduce emissions as well as costs. Both LNG and
the marine diesel we currently use meet all current domestic and
international emissions regulations as well as regulations that will
be effective January 1, 2015.
We have programs in place to protect the environment and reduce
GHG. Besides using biodegradable hydraulic oils, we recycle beverage
containers, cardboard, newsprint, plastics, wood, metal, spent
fluorescent tubes, batteries, aerosol spray cans, old upholstery foam
and used cooking oil. We also have a composting program which
we are in the process of expanding. We are currently in the process
of transitioning from Styrofoam cups to paper cups which can be
recycled or composted. In fiscal 2014, we diverted approximately
200 tonnes of compostable material on two of our Major Routes,
doubling the amount diverted in the prior year. We continue to
replace chemical products with more environmentally friendly
solutions and have replaced gasoline powered terminal vehicles with
electric vehicles and gasoline powered baggage vans with propane
powered tugger units. We also reduce GHG levels by transferring
vessels to shore-power while berthed overnight at several of our
terminals, promoting anti-idling and increasing waste diversion.
We are currently expanding our shore-power program to additional
terminals by upgrading the current shore power installations and
adding new shore power installations where necessary to provide
sufficient capacity to provide power to the vessels.
We have also introduced other initiatives to further mitigate
our environmental impact. We have a sewage and waste water
treatment system that, wherever possible, the vessels convey sewage
to a terminal through pump-ashore infrastructure. Where terminal
facilities are not available, small vessels were fitted with holding
tanks, with truck pump-off. In all other cases, the vessels have been
fitted with federally compliant marine sanitation devices. We have a
treatment plant at one of our terminals while at the remaining seven;
sewage is collected and transferred to treatment plants operated by
local governments. (See “Investing in our Capital Assets” above for
more detail.)
We believe that we maintain adequate environmental insurance;
however, there can be no guarantee that the insurance coverage will
be sufficient to cover all such losses.
risk mitigation: The results of our last two bond placements
have been very positive. Our October 2013 bonds were rated “A”
(DBRS) and “A+” (S&P) and our April 2014 bonds were rated “A”
(DBRS) and “AA-” (S&P). We continue to strive to communicate to
our stakeholders the importance of our financial viability within our
economic regulatory framework and our commitment to maintaining
financial strength, in order to access these important markets.
regulations – environmental
Our operations are subject to Federal, Provincial and local environmental
laws and regulations dealing with various operations, including solid
and liquid waste management, air quality and oil spill response.
The provincial government has made a commitment to reduce
greenhouse gas emissions (GHG) by 33% by the year 2020, based on
emissions in 2007. While the reduction targets have not yet been set,
the transportation industry has been identified as a sector that will
have emission limits.
If we were to be involved in an environmental accident or be found
in material violation of applicable law and regulations, we could be
responsible for material clean-up costs, repair of property damage,
and fines or other penalties.
risk mitigation: We will continue to comply with environmental
laws and regulations and actively search for ways to improve our
environmental performance to help us become an industry leader in
environmental management. We have training programs in place that
include training our staff in first response to an oil spill and we conduct
regularly scheduled oil spill drills on our vessels and at our terminals.
We constantly look for ways to reduce fuel consumption and
emissions on our vessels. We continue to use ultra-low sulphur diesel
with a 5% biodiesel component on all of our vessels across the fleet
and we currently meet the North American Emission Control Area
standards for sulphur content that have been set for 2015. We have
implemented a wide variety of fuel saving measures ranging from
operating our vessels more efficiently to installing new, more fuel-
efficient engines on some of our vessels and fuel monitoring systems
on others and designing and building our new vessels to meet or
exceed current environmental standards.
66 ANNUAL REPORT 2013–2014

M A N A G E M E N T ’ S D I S C U S S I O N & A N A L Y S I S
perFormanCe risk
The occurrence of a major incident or mishap could result in default
under the CFSC unless such accident or mishap qualified as an event
of force majeure.
The occurrence of a default under the CFSC could have consequences,
including an adjustment to ferry transportation fees from the Province
or the forced sale of our vessels to the Province for net book value
and termination of the Terminal Leases.
risk mitigation: We have an asset renewal program for our vessels
and terminals. This program is revitalizing our fleet and upgrading
our terminals to support our ongoing operations and maintain
service reliability.
We regularly update our vessel maintenance schedules to ensure that
we provide the core service levels required under the CFSC.
We continuously monitor our operations from our 24-hour operations
and security centre. This provides enhanced situational awareness and
assessments to identify and prevent potential incidents and provides
a coordinated response to any incident that may occur.
taxes
We received an advance income tax ruling from the Canada Revenue
Agency (CRA) that, provided the facts and other statements set out
therein are accurate, we are a “Tax Exempt Corporation” described
in paragraph 149(1)(d.1) of the Income Tax Act. This ruling was
subject to a proposed amendment to subsection 149(1.3) of the
Income Tax Act announced by the Department of Finance on
December 20, 2002. The essential elements of this amendment have
now been enacted. We have received a non-binding opinion from
the CRA that amended subsection 149(1.3) will not cause us to cease
to be a Tax Exempt Corporation.
There can be no assurance that we are and will continue to be a
Tax Exempt Corporation.
risk mitigation: We have the opportunity to apply to the
Commissioner under section 42 of the Act for an extraordinary price
cap increase or other relief if the introduction of new regulations
imposes a new, unexpected and significant cost burden.
treaty negotiations
Much of British Columbia, including areas where we have operations
and real property interests, is subject to claims of aboriginal rights or
title. Canadian courts have recognized that aboriginal peoples may
enjoy constitutionally protected rights, whether or not recognized
in a treaty, in respect of lands that were used or occupied by their
ancestors. These rights vary from the right to use lands and waters to
carry out traditional activities (for example, an aboriginal right to fish)
to the right to exclusively occupy lands that are subject to aboriginal
title. What kind of right might exist depends primarily upon the nature
and extent of the prior aboriginal use and occupation at specific dates
in British Columbia’s history.
At present, many aboriginal groups, who claim that they have
un-extinguished Aboriginal rights and title, are seeking recognition of
those claimed rights in modern treaties, or in government decision-
making that may affect their traditional territories. Canadian courts
have confirmed that provincial and federal governments have a duty
to consult with and, if appropriate, accommodate aboriginal groups
when they are proposing to make a decision that could potentially
infringe asserted Aboriginal rights and title. Government approvals
and licences, such as those required to operate existing terminal
facilities or develop new ones, may trigger the government’s duty
to consult with any aboriginal groups whose claims of Aboriginal
rights and title might be adversely affected by the granting of
the licence or approval in question. Recent court decisions have
clarified that the Crown, when making decisions, does not have to
accommodate Aboriginal groups for historic infringements, though
historic infringements may be taken into consideration in addressing
proposed new infringements.
Aboriginal groups that have entered into treaties may have a right to
be consulted with respect to government actions that could adversely
affect their treaty rights. Modern treaties may also require the Crown
to consult with an Aboriginal group with respect to certain kinds of
government action in certain geographic areas, depending on the
terms of the treaty.
67BRITISH COLUMBIA FERRY SERVICES INC.

M A N A G E M E N T ’ S D I S C U S S I O N & A N A L Y S I S
An actuarial valuation of the unfinalized claims remaining to be
paid at March 31, 2013 that relate to incidents on or prior to
March 31, 2003 was received in fiscal 2014 and the accrued benefit
obligation estimated at $1.8 million. The residual liability balance
($1.9 million at March 31, 2013) was decreased during fiscal 2014 by
$0.1 million and this actuarial gain recorded in other comprehensive
income. This residual liability is drawn down as claims are paid.
The balance at March 31, 2014 of $1.4 million ($1.9 million at
March 31, 2013) is included in accrued employee future benefits
in our financial statements.
PuBlic service Pension Plan
Our employees are members of the Public Service Pension Plan
(the Plan), a defined benefit and multiemployer pension plan. The Plan
is exempt from the requirements under the provincial Pension Benefits
Standards Act to use the “solvency” method in conjunction with the
“going concern” method for valuation purposes. As such, the Plan is
currently valued solely by the going concern method. The most recent
valuation, as at March 31, 2011, indicated an unfunded liability of
$275 million across the total Plan.
Effective April 1, 2012, the Public Service Pension Board of Trustees
increased contribution rates to the basic account for plan members
and employers from 7.78% to 8.18% of pensionable earnings
each, primarily due to the change in the investment return and
demographic assumptions. The contribution rates to the inflation
adjustment account for members and employers changed from
1.50% and 2.50% to 1.25% and 2.75%, respectively.
reTiremenT Bonus liaBiliTy
We sponsor a plan that provides a post-retirement benefit for eligible
long service employees. The valuation of this plan is estimated based
on complex actuarial calculations using several assumptions. These
assumptions are determined by management with significant input
from our actuary. The valuation of the obligation depends on such
assumptions as discount rate, projected salary increases, retirement
age and termination rates. An actuarial valuation of the plan at
March 31, 2011, was obtained and the accrued benefit obligation
estimated at $13.8 million. The liability included in accrued employee
future benefits in our financial statements at March 31, 2014, was
$14.2 million ($13.9 million at March 31, 2013). With our adoption
on April 1, 2013 of the amended IAS 19 Employee Benefits, actuarial
gains and losses resulting from valuations of obligations under this
plan are immediately recognized in other comprehensive income.
(See “Adoption of New Accounting Standards” below.)
risk mitigation: Under the master agreement, the Province retains
its liability, to the extent any exists, for the acts and omissions of the
Province that occurred prior to our possession of the ferry terminal
properties leased under the Terminal Leases and will reimburse us
for any damages we suffer as a result. The Province will reimburse
us for damages suffered if there is a final court decision or a treaty
settlement that recognizes or confers upon an aboriginal group a
proprietary or other interest in the ferry terminal properties should
that right or interest interfere with our quiet enjoyment of the ferry
terminal properties as set out in the Terminal Leases.
ACCOUNTING PRACTICES
CritiCal aCCounting poliCies and estimates
Our discussion and analysis of our financial condition and financial
performance is based upon our consolidated financial statements,
which have been prepared in accordance with IFRS.
Our significant accounting policies are contained in note 1 to our
consolidated financial statements. Certain of these policies involve
critical accounting estimates because they require us to make
particularly subjective or complex judgments about matters that are
inherently uncertain and because of the likelihood that materially
different amounts could be reported under different conditions
or using different assumptions. These judgements, estimates and
assumptions are subject to change as new events occur, as more
experience is acquired, as additional information is obtained and as
the general operating environment changes.
We believe the following are the most critical accounting policies,
estimates, and judgements that we have used in the preparation
of our financial statements:
workers’ comPensaTion claims liaBiliTy
Our financial statements include an estimate of residual liability
for workers’ compensation claims arising from the Workers’
Compensation Board deposit class coverage system, in which our
predecessor entity participated on or prior to March 31, 2003.
68 ANNUAL REPORT 2013–2014
M A N A G E M E N T ’ S D I S C U S S I O N & A N A L Y S I S
dePreciaTion and amorTizaTion exPense
Our capital assets, including assets under finance leases, are
depreciated or amortized on a straight-line basis at varying rates.
Depreciation and amortization rates require the use of estimates
of the useful lives of the assets and of salvage value to be realized
upon asset retirement.
We annually review asset lives in conjunction with our longer term
asset deployment, replacement and upgrade strategies. When we
determine that asset lives do not reflect the expected remaining
period of benefit, we make prospective changes to the remaining
period over which they are depreciated or amortized. There are a
number of uncertainties inherent in estimating our asset lives and
changes in these assumptions could result in material adjustments
to our financial statements.
As disclosed in note 1 to our financial statements, we review
and evaluate our long-lived assets for impairment when events
or changes in circumstances indicate that the related amounts
may not be recoverable.
hedging relaTionshiPs
We utilize derivative financial instruments to manage market risk
against the volatility in foreign currency, interest rate, and fuel price
exposures. We do not utilize derivative financial instruments for
trading or speculative purposes. At the inception of each hedge,
we determine whether or not to apply hedge accounting.
When applying hedge accounting, we document all relationships
between hedging instruments and hedged items, as well as our
risk management objectives and strategy for undertaking various
hedge transactions. This process includes linking all derivatives to
specific assets and liabilities on the balance sheet or to specific firm
commitments or forecasted transactions. We also assess, both at the
hedge inception and on an ongoing basis, whether the derivatives
that are used in hedging transactions are effective in offsetting
changes in fair values or cash flows of hedged items. Realized and
unrealized gains or losses associated with derivative instruments
which have been terminated or cease to be effective prior to maturity
are recognized in net earnings in the period in which they have been
terminated or cease to be effective.
asseT reTiremenT oBligaTions
When it can be reasonably determined, we recognize the fair value
of a liability for any legal obligations associated with the retirement of
long-lived assets when those obligations result from the acquisition,
construction, development or normal operation of the assets.
A corresponding asset retirement cost is added to the carrying
amount of the related asset and depreciated or amortized to expense
on a systematic and rational basis.
Certain of our vessels contain undetermined amounts of asbestos.
Under certain circumstances, we may be required to handle and
dispose of the asbestos in a manner required by regulations. It is our
intention to sell decommissioned vessels into world markets to buyers
who will keep them in active service. Under these circumstances
asbestos remediation would become the responsibility of the
new owner.
No amount has been recorded for asset retirement obligations
relating to these assets as it is not possible to make a reasonable
estimate of the fair value of any such liability due to the indeterminate
magnitude, likelihood, or financial impact, if any, of this issue.
In addition, as our operations are regulated, there is a reasonable
expectation that any significant asset retirement costs would be
recoverable through future tariffs.
adoption oF new aCCounting standards
The following is a discussion of mandatory accounting changes
that were effective for us April 1, 2013:
International Accounting Standard (IAS) 19 Employee Benefits
• has been amended, and, as a result of the amendments, actuarial
gains and losses of defined benefit plans will be immediately
recognized in other comprehensive income rather than net earnings
and the option to use the corridor approach to recognize these
costs over time is no longer available. The amendments also
introduce the net interest approach where the discount rate used
to measure the obligation is applied to the net defined benefit
liability (asset). In addition, the amendments change the definition
of both short-term and long-term employee benefits so it is
clear that the distinction between the two depends on when we
expect the benefits to become due to be settled. The retrospective
application of this amended standard did not have an impact on our
consolidated financial statements. During fiscal 2014, we recognized
actuarial gains of $0.1 million in other comprehensive income.
69BRITISH COLUMBIA FERRY SERVICES INC.
M A N A G E M E N T ’ S D I S C U S S I O N & A N A L Y S I S
• In November 2013, the International Accounting Standards
Board issued amendments to IFRS 9. The amendments include
changes which will align hedge accounting more closely with risk
management. Although the amendments do not fundamentally
change the types of hedging relationships or the requirement to
measure and recognize ineffectiveness, more hedging strategies
used for risk management will qualify for hedge accounting.
The amendments also removed the mandatory January 1, 2015
effective date for adoption of IFRS 9. This IFRS will be effective for
us for annual periods commencing April 1, 2018, however early
adoption is permitted.
• We do not expect the application of IFRS 9, as amended, to have
any impact on our consolidated financial statements and are
considering the timing of its adoption.
CORPORATE STRUCTURE AND GOVERNANCENational Instrument 58-101 Disclosure of Corporate Governance
Practices (the “Instrument”) and a related National Policy 58-201
Corporate Governance Guidelines (the “Guidelines”) issued by
the Canadian Securities Administrators require reporting issuers
to disclose annually their approach to corporate governance with
reference to specific matters. See Schedule A for the disclosure
in accordance with this Instrument.
IFRS 13 Fair Value Measurement
• replaces the fair value measurement guidance contained in
individual IFRSs with a single source of fair value measurement
guidance. Fair value is defined as the price that would be received
to sell an asset or paid to transfer a liability in an orderly transaction
between market participants at the measurement date. We have
applied IFRS 13 prospectively effective April 1, 2013. Adoption
of this standard had no impact on our consolidated financial
statements for the year ended March 31, 2014.
IFRS 14 Regulatory Deferral Accounts
• was issued January 30, 2014 and, as a result, first-time adopters
of IFRS will be permitted to continue to recognize amounts
related to rate regulation in accordance with their previous GAAP
requirements. This standard is not applicable to those entities that
have already transitioned to IFRS, as we have.
Future aCCounting Changes
The following is a discussion of accounting changes that will be
effective for us in accounting periods after March 31, 2014:
International Financial Reporting Interpretations Committee
(IFRIC) 21 Levies:
• provides guidance on when to recognize a liability for a levy
imposed by a government. The IFRIC is effective for us for
annual periods commencing April 1, 2014 and is to be applied
retrospectively. We do not expect the amendments to have
a significant impact on our annual financial statements.
IFRS 9 Financial Instruments
• replaces the guidance in IAS 39 Financial Instruments: Recognition
and Measurement on the classification and measurement of
financial assets. Financial assets will be classified into one of two
categories on initial recognition: financial assets measured at
amortized cost; or financial assets measured at fair value.
70 ANNUAL REPORT 2013–2014

M A N A G E M E N T ’ S D I S C U S S I O N & A N A L Y S I S
FORWARD LOOKING STATEMENTSThis Management’s Discussion and Analysis contains certain “forward
looking statements”. These statements relate to future events or
future performance and reflect management’s expectations regarding
our growth, results of operations, performance, business prospects
and opportunities and industry performance and trends. They reflect
management’s current internal projections, expectations or beliefs
and are based on information currently available to management.
Some of the market conditions and factors that have been considered
in formulating the assumptions upon which forward looking
statements are based include traffic, the Canadian Dollar relative to
the US Dollar, fuel costs, construction costs, the state of the local
economy, fluctuating financial markets, demographics, tax changes,
and the requirements of the CFSC.
Forward looking statements included in this document include
statements with respect to: economic conditions, traffic levels,
and fuel prices; tariff revenue, fuel surcharges, and fiscal 2015 net
earnings; our expectations of the impact of our cost containment
program and the annual premium savings we expect as a result of
receiving the Certificate of Recognition from WorkSafe BC; whether
our regulatory assets are probable of future recovery; our short-
term and long-range business plans, capital expenditure levels, and
asset renewal programs for vessels and terminals; our customer
service program, payroll system replacement initiative, infrastructure
relocation program, vessel replacement program for the Queen
of Burnaby and the Queen of Nanaimo, cable ferry initiative, LNG
plans, and safety and training projects; our expectations regarding
vacation package sales, and growth in drop trailer traffic and onboard
retail gift shop sales; our expectations regarding our lack of need to
access capital markets in the near term; how our operational cash
requirements will be met over the next few years; the additional
payments to be received from the Province over the following two
fiscal years, and the amount of savings to be achieved through service
level adjustments; our expectations regarding the impact of new
legislation; and our expectations regarding the impact of IFRIC 21 and
IFRS 9 on our financial statements. In some cases, forward looking
statements can be identified by terminology such as “may”, “will”,
“should”, “expect”, “plan”, “anticipate”, “believe”, “estimate”,
“predict”, “potential”, “continue” or the negative of these terms
or other comparable terminology. A number of factors could cause
actual events or results to differ materially from the results discussed
in the forward looking statements. In evaluating these statements,
prospective investors should specifically consider various factors
including, but not limited to, the risks and uncertainties associated
with traffic volume and tariff revenue risk, safety and security, asset
risk, accident risk, tax risk, environmental risk, regulatory risk, labour
disruption risk, risk of default under material contracts and aboriginal
land claims.
Actual results may differ materially from any forward looking
statement. Although management believes that the forward looking
statements contained in this Management’s Discussion and Analysis
are based upon reasonable assumptions, investors cannot be assured
that actual results will be consistent with these forward looking
statements. These forward looking statements are made as of the
date of this Management’s Discussion and Analysis, and British
Columbia Ferry Services Inc. assumes no obligation to update or
revise them to reflect new events or circumstances except as may be
required by applicable law.
In addition to providing measures prepared in accordance with IFRS,
we present certain supplemental non-IFRS measures. These include,
but are not limited to, total comprehensive income adjusted for the
effect of rate regulation, customer satisfaction ratings, vehicle and
passenger traffic, on-time performance, fleet reliability score, capacity
provided and utilized, AEQs carried, number of round trips, and
average tariff revenue per vehicle and per passenger. These measures
do not have any standardized meaning prescribed by IFRS and
therefore are unlikely to be comparable to similar measures presented
by other companies. These supplemental non-IFRS measures are
provided to assist readers in determining our ability to generate
cash from operations and improve the comparability of our results
from one period to another. We believe these measures are useful
in assessing operating performance of our ongoing business on an
overall basis.
71BRITISH COLUMBIA FERRY SERVICES INC.

M A N A G E M E N T ’ S D I S C U S S I O N & A N A L Y S I S
and assess the merits of management initiatives. The Governance
& Nominating Committee has an ongoing responsibility to ensure
that the governance structures and processes continue to enable
the board to function independently.
The board and management recognize that there is a regular need
for the board to meet without management in attendance. It is
general practice to conduct a portion of every board and committee
meeting with no members of management in attendance.
The board and its committees each have the authority to retain any
outside advisor, at the Company’s expense, that it determines to
be necessary to permit it to carry out its duties.
The recruitment of directors is undertaken with the objective of
ensuring the board is composed of a majority of strong, qualified,
independent directors. The board supports the concept that the
board chair should be an independent director.
The board has adopted a definition of an independent director
for members of the Audit & Finance Committee consistent with
the definition of independence in Multilateral Instrument 52-110.
This definition, with some modification that is consistent with
Multilateral Instrument 52-110, also applies to determining the
independence of other members of the board.
The board is responsible for determining whether directors are
independent pursuant to the definition of independence adopted by
the board. To do this, the board requires members to disclose their
relationships with the Company and its subsidiaries. These disclosures
are reviewed by the corporate secretary, the chair of the Governance
& Nominating Committee, and the chair of the board. Any director
who is deemed independent, and whose circumstances change such
that he or she might be considered to no longer be an independent
director, is required to promptly advise the board of the change
in circumstances. Directors are required annually to attest to their
independence in writing.
All of the directors of the Company in the fiscal year were determined
by the board to be independent pursuant to the definition of
independence adopted by the board.
SChEDULE ACorporate struCture and governanCe
board oF direCtors
British Columbia Ferry Services Inc. (BC Ferries or the Company) is
subject to the Business Corporations Act – British Columbia and
the Coastal Ferry Act – British Columbia (CFA). The board of directors
(board) of BC Ferries is appointed by the Company’s sole voting
shareholder, B.C. Ferry Authority (BCFA or the Authority).
During the fiscal year ended March 31, 2014 the board was composed
of the following directors:
Chair: Donald P. Hayes
Members: Jane M. Bird, Holly A. Haston-Grant, John A. Horning,
Guy D. Johnson, Brian G. Kenning, Gordon R. Larkin,
Maureen V. Macarenko, P. Geoffrey Plant (vice chair),
Wayne H. Stoilen and Graham M. Wilson
Holly A. Haston-Grant and Wayne H. Stoilen ceased to be directors
effective June 27, 2013, and Guy D. Johnson ceased to be a director
effective November 22, 2013.
The directors are stewards of BC Ferries and set the strategic direction
of the Company. The board exercises its stewardship responsibilities
by overseeing the conduct of the business, supervising management,
which is responsible for the day-to-day conduct of the business, and
endeavouring to ensure that all major issues affecting the business
and affairs of the Company are given proper consideration.
The board governance manual articulates the governance framework
under which the board fulfills its stewardship responsibilities. The
manual assembles in one document the essential elements for
providing an appropriate level of governance for the organization.
It includes, among other things, terms of reference for the board,
chair, directors, committees and committee chairs, and serves
as a practical guide for the board and management in fulfilling their
respective duties and responsibilities. The governance manual is a
product and responsibility of the board.
The board is committed to the principles of independence and
accountability. The board has adopted policies and practices that
ensure it has the capacity, independent of management, to fulfill the
board’s responsibilities, make objective assessments of management,
72 ANNUAL REPORT 2013–2014

M A N A G E M E N T ’ S D I S C U S S I O N & A N A L Y S I S
direCtorships
The following are directors of a reporting issuer (or the equivalent)
in Canada or a foreign jurisdiction, other than BC Ferries:
Jane M. Bird: Director, IBI Group Inc.
Brian G. Kenning: Director, MacDonald Dettwiler & Associates Inc.
Graham M. Wilson: Director, ITRON Inc.
Director, Hardwoods Distribution Inc.
Director, Naikun Wind Energy Group Inc.
orientation and Continuing eduCation
The Company has a variety of orientation and education programs
in place for directors. These programs are aimed at increasing
the directors’ familiarity with the operation of the Company and
its governance practices.
All new directors are provided with the opportunity to participate
in an orientation program. The orientation program is tailored to
the individual director’s needs and areas of interest. The program
generally involves a half to full day session, usually held prior to a new
director attending his/her first board meeting, during which the new
director is briefed by members of senior management and receives
written information about the business and operations of BC Ferries
and board governance practices, including the duties and obligations
of directors. The board governance manual is made available to
all directors. This manual provides a comprehensive overview of
the roles and responsibilities of the board, its committees, and the
contributions expected by each director.
The board recognizes the importance of ongoing director education
and the need for each director to take personal responsibility for this
process. To facilitate ongoing education, presentations are made
to directors from time to time on matters of particular importance
or emerging significance to the Company. As well, attendance by
directors at seminars, courses or conferences of relevance to their
position as directors of the Company may be arranged. Directors are
expected to maintain ongoing familiarization with the operations of
BC Ferries through regular system-wide ferry travel. This, together with
visits to other facilities and operations of BC Ferries, serves to enhance
the directors’ ongoing knowledge and understanding of the Company.
Responsibility for ensuring that orientation and ongoing education
are provided to directors rests with the chair of the board. The
Governance & Nominating Committee has responsibility for reviewing
the orientation and education programs to ensure they are effective
and meet the needs of directors.
ethiCal business ConduCt
The board approved and adopted a Code of Business Conduct and
Ethics (code) in November 2004; the code was subsequently reviewed
and amended by the board in November 2009. Notice of adoption,
and subsequent amendment of the code as Company policy, was
communicated to the Company’s personnel by intra-Company
information bulletin and BC Ferries’ newsletter for personnel.
In addition, the code has been posted on the Company’s intranet
website for Company personnel, and on the Company’s internet
site. The code was filed on SEDAR on March 1, 2006; the amended
code was filed on November 24, 2009. The board has also adopted
a Corporate Disclosure and Securities Trading Policy and a Corporate
Communications Policy, both of which are also posted on the
Company’s intranet and internet sites.
As part of the Company’s disclosure controls process, in conjunction
with quarter-end financial reporting, appropriate managers are
required to make representations regarding compliance with the
code, the Corporate Disclosure and Securities Trading Policy and
the Corporate Communications Policy.
As part of the communication process for the reporting of
questionable accounting and auditing matters, a secure telephone line
and a secure e-mail address, each monitored by the executive director
of internal audit, as well as a secure e-mail address monitored by
the chair of the Audit & Finance Committee of the board, have been
established. This has been communicated to Company personnel by
intra-Company information bulletin and BC Ferries’ newsletter for
personnel. The contact particulars are also posted with the code on
the Company’s intranet site.
The board, through the Audit & Finance Committee, monitors
compliance with the code through review of compliance reports
received quarterly from management, the external auditors,
and the internal auditor.
73BRITISH COLUMBIA FERRY SERVICES INC.

M A N A G E M E N T ’ S D I S C U S S I O N & A N A L Y S I S
The BC Ferries board makes its decision on prospective directors
and forwards its recommendations to the board of the Authority.
The Authority board then determines the directors of BC Ferries and
causes the Authority, as the sole holder of the single issued voting
share of BC Ferries, to elect such individuals to the board of BC Ferries.
exeCutive Compensation
The Human Resources & Compensation Committee is responsible
for reviewing and making recommendations to the BC Ferries board
on executive compensation.
execuTive comPensaTion Plan
The CFA requires that the compensation of certain executive officers
of BC Ferries be set and administered within a remuneration limit
prescribed by an executive compensation plan. The Authority is
responsible under the CFA for approving an executive compensation
plan and any amendments to such plan.
In the fiscal year ended March 31, 2012, upon the recommendation
of the BC Ferries board, the Authority approved an executive
compensation plan with an effective date of October 1, 2011.
The plan describes the philosophy for executive compensation and
the maximum remuneration that individuals whose compensation is
governed by such plan can receive in any fiscal year. The remuneration
limits set out in the executive compensation plan were established
with the assistance of an independent third-party compensation
expert and with reference to the CFA, which requires that the
remuneration under an executive compensation plan be consistent
with the remuneration provided to individuals who, in organizations
in Canada that are of a similar size and scope to BC Ferries, perform
similar services or hold similar positions to that member of executive
of BC Ferries, and not be greater than the remuneration that
provincial public sector employers in British Columbia provide to
individuals who, in those organizations, perform similar services or
hold similar positions to that member of executive of BC Ferries.
Consistent with the CFA and Miscellaneous Statutes Amendment
Act No. 3 - 2010 (Bill 20), the executive compensation plan approved
by the Authority presently governs the remuneration the Company
may provide to its President & CEO, but not the remuneration of
any other current executive officer so long as that individual remains
in his current position. The plan is available for public view on the
Authority’s website (www.bcferryauthority.com).
Directors and officers review the code, and acknowledge their
support and understanding of the policy by signing an annual
disclosure statement.
The code requires that directors and officers disclose potential
conflicts of interest at the time of their appointment and immediately
upon a situation of a conflict of interest or potential conflict of
interest arising. Such disclosures are communicated to and reviewed
by the corporate secretary, the chair of the Governance & Nominating
Committee, and the chair of the board.
nomination oF direCtors
The CFA requires that when electing directors to the board of
BC Ferries, the Authority must select individuals in such a way as
to ensure that, as a group, the directors of BC Ferries are qualified
candidates, who hold all of the skills and all of the experience needed
to oversee the operation of the Company in an efficient and cost
effective manner. On the recommendation of the BC Ferries board,
the board of the Authority approves a profile setting out the skills,
experience and expertise that should be represented on the BC Ferries
board (skills profile). The board of BC Ferries nominates qualified
candidates for election as directors and recommends to the Authority
the size of the BC Ferries board.
The Governance & Nominating Committee has responsibility for the
director nomination process. The committee is composed entirely
of directors who are independent, pursuant to the definition of
independence adopted by the board of BC Ferries, and operates
under terms of reference adopted by the board.
The skills, experience, and expertise of the incumbents and any
retiring directors of BC Ferries are reviewed by the Governance &
Nominating Committee in the context of the skills profile approved
by the board of the Authority, and the ongoing governance needs
of BC Ferries. Any gaps are identified. Potential conflicts of interest
and other extenuating circumstances are also identified.
The Governance & Nominating Committee makes recommendations
to the BC Ferries board on suitable candidates for appointment to
the board. These recommendations take into consideration the talents
of the existing members of the BC Ferries board and those of the
nominees, taking the skills profile established for the board, including
knowledge of or presence in the communities served by BC Ferries,
into account.
74 ANNUAL REPORT 2013–2014

M A N A G E M E N T ’ S D I S C U S S I O N & A N A L Y S I S
In the fiscal year ended March 31, 2014, the BC Ferries board
amended the compensation framework for its executive officers,
discontinuing the short term incentive plan and implementing a
salary holdback compensation plan for these individuals effective
April 1, 2013. No amendment of the executive compensation plan
was required to effect this change in the compensation framework,
and the plan remained unchanged in the fiscal year.
execuTive comPensaTion Process
The salary holdback compensation plan, in which the executive
officers are participants, is designed to link the compensation
of participants with the achievement of specific annual operating
objectives that are important to supporting the overall business
strategy. By its nature, the plan responds to the Company’s pay-
for-performance philosophy. Under the plan, a maximum salary is
established for each participant, a portion of which is held back each
fiscal year and payable upon achievement of pre-approved objectives
and targets.
On an annual basis, the board, led by the Human Resources &
Compensation Committee sets the performance requirements
for the President & CEO and evaluates his performance against
those requirements. The amount of the salary holdback earned
by the President & CEO is determined based on the evaluation
results and the available room under the total remuneration limit
set for the position in the executive compensation plan. With the
assistance of the independent, third-party compensation expert,
the Human Resources & Compensation Committee periodically
reviews the remuneration limit set in the executive compensation
plan in conjunction with market data from appropriate comparator
organizations, and provides advice to the board on possible changes
to the plan for recommendation to the Authority. Changes in the
President & CEO’s remuneration, if any, are made in consideration
of his performance, leadership skills, retention risk, and value to
achieving corporate strategy, and in accordance with the executive
compensation plan approved by the Authority.
The board, led by the Human Resources & Compensation Committee,
evaluates each of the other executive officers annually with respect
to the achievement of annual performance objectives set by the
President & CEO. The evaluation results are used to determine the
amount of the salary holdback earned by each executive officer.
Changes, if any, to the compensation of these executive officers are
made in consideration of the individual’s performance, leadership
skills, retention risk, and value to achieving corporate strategy,
and in conjunction with market compensation data obtained by
the independent third-party compensation expert.
On an annual basis, the President & CEO formally assesses the
development of each of the other executive officers, as well as other
executive members. The President & CEO uses these assessments to
design and update succession plans for all senior executive positions,
including the position of President & CEO. These plans are reviewed
by the Human Resources & Compensation Committee on an annual
or more frequent basis. With respect to all executive officers,
succession planning is an important issue that receives ongoing
and regular attention by the board and the President & CEO.
direCtor Compensation
The CFA requires that the compensation of directors of BC Ferries
be set and administered within a remuneration limit prescribed by a
directors’ compensation plan. The Authority is responsible under the
CFA for approving a directors’ compensation plan and any amendments
to such plan. The remuneration provided under such a plan must be
consistent with the remuneration that organizations in Canada that
are of a similar size and scope to BC Ferries provide to their directors,
and not be greater than the remuneration that provincial public sector
organizations in British Columbia provide to their directors.
In the fiscal year ended March 31, 2011, upon the recommendation
of the BC Ferries board, the Authority approved a directors’
compensation plan with an effective date of October 1, 2010.
The plan was developed with the assistance of an independent
third-party compensation expert and describes the philosophy for
the compensation of BC Ferries’ directors and the remuneration that
can be provided to them. Remuneration for directors of BC Ferries
was amended and set by the Authority effective October 1, 2010,
in accordance with the approved directors’ compensation plan.
The plan is available for public view on the Authority’s website.
The Governance & Nominating Committee reviews director
compensation regularly and provides advice to the board on any
amendments to the directors’ compensation plan to be recommended
to the Authority.
protoCol agreement
The Authority and BC Ferries have entered into a protocol agreement
which clarifies and confirms their respective roles and responsibilities
in relation to the authority of BCFA as shareholder of BC Ferries and
the matters set forth in the CFA respecting the appointment and
remuneration of BC Ferries’ directors and the remuneration of certain
executive officers of the Company.
75BRITISH COLUMBIA FERRY SERVICES INC.

M A N A G E M E N T ’ S D I S C U S S I O N & A N A L Y S I S
• assess the qualifications and independence of the external auditors,
and recommend to the board the nominations of the external
auditors and the compensation to be paid to the external auditors.
The committee has the authority to conduct any investigation
appropriate to fulfilling its responsibilities, and it has direct access
to the external auditors as well as anyone in the organization.
The committee has the authority to retain special legal, accounting,
and other advisors or experts it deems necessary in the performance
of its duties.
Each of the members of the committee has been determined by
the board to be independent, that is, without any direct or indirect
relationship with the company that could reasonably interfere
with the exercise of the member’s independent judgment.
All members of the committee are financially literate within the
meaning of Multilateral Instrument 52-110, that is, each has the
ability to read and understand a set of financial statements that
present a breadth and level of complexity of accounting issues that
are generally comparable to the breadth and complexity of the issues
that can reasonably be expected to be raised by the Company’s
financial statements.
Since April 2, 2003, all recommendations of the committee to
nominate or compensate an external auditor have been adopted
by the board.
The aggregate fees billed by the Company’s external auditor in each
of the last two fiscal years were:
year ended march 31
($ thousands) 2014 2013
External Auditor billings Audit and audit related 176.5 173.5
Tax services 2.8 2.2
IFRS advisory services – 7.1
Accounting advisory and forensic
data analytics – 1.2
179.3 184.0
board Committees
The board has developed guidelines for the establishment and
operation of committees of the board. Each committee operates
according to a specific mandate approved by the board.
The committee structure is set out below. The board chair is
an ex-officio (non-voting) member of each of the Committees.
audiT & finance commiTTee:
Members during the fiscal year ended March 31, 2014:
Chair: Brian G. Kenning
Members: John A. Horning, Guy D. Johnson, P. Geoffrey Plant
and Graham M. Wilson
John A. Horning was appointed a member of the committee effective
June 22, 2013, and Guy D. Johnson ceased to be a director and a
member of the committee effective November 22, 2013.
The Audit & Finance Committee is appointed by the board to assist
the board in fulfilling its oversight responsibilities. The committee
has the mandate to:
• review the financial reports and other financial information
provided by the Company to its security holders;
• review the annual operating and capital budgets, modifications
thereto, and details of any proposed financing;
• monitor the integrity of the financial reporting process and the
system of internal controls that the board and management have
established;
• monitor the management of the principal risks that could impact
the financial reporting of the Company, and the Company’s
compliance with legal and regulatory requirements as they relate to
the Company’s financial statements;
• review and approve the audit plan, process, results, and
performance of the Company’s external auditors and the internal
audit department (the internal auditor) while providing an open
avenue of communication between the board, management,
external auditors, and the internal auditor; and
76 ANNUAL REPORT 2013–2014

M A N A G E M E N T ’ S D I S C U S S I O N & A N A L Y S I S
Pursuant to its terms of reference, the committee must pre-approve
retaining the external auditors for any non-audit service to be
provided to the Company or its subsidiaries, provided that no approval
shall be provided for any service that is prohibited under the rules
of the Canadian Public Accountability Board or the Public Company
Accounting Oversight Board, or the Independence Standards of
the Canadian Institute of Chartered Accountants.
Before retaining the external auditors for any non-audit service,
the committee must consider the compatibility of the service with the
external auditors’ independence. The committee may pre-approve
retaining the external auditors for the engagement of any non-audit
services by establishing policies and procedures to be followed prior
to the appointment of the external auditors for the provision of
such services. To date, no such policies and procedures have been
established. In addition, the committee may delegate to one or more
members the authority to pre-approve retaining the external auditors
for any non-audit services to the extent permitted by applicable law.
safeTy, healTh, environmenT & securiTy commiTTee:
Members during the fiscal year ended March 31, 2014:
Chair: Jane M. Bird (current); Wayne H. Stoilen (former)
Members: Holly A. Haston-Grant, Gordon R. Larkin
and Maureen V. Macarenko
Effective June 22, 2013, Jane M. Bird was appointed a member
and chair of the committee, Wayne H. Stoilen ceased to be a member
and chair of the committee, and Holly Haston-Grant ceased to be
a member of the committee.
The Safety, Health, Environment & Security Committee is
appointed by the board to assist the board in fulfilling its oversight
responsibilities. The committee has the mandate to:
• exercise due diligence over the safety, health, environmental
and security operations of the Company;
• develop, review, and make recommendations, as required, on
matters related to the Company’s safety, health, environmental
and security policies and practices; and
• monitor compliance with government regulations and with
the Company’s commitment to excellence on these issues.
governance & nominaTing commiTTee:
Members during the fiscal year ended March 31, 2014:
Chair: P. Geoffrey Plant
Members: Jane M. Bird, Gordon R. Larkin and Wayne H. Stoilen
Effective June 22, 2013, Jane M. Bird was appointed a member
of the committee and Wayne H. Stoilen ceased to be member
of the committee.
The Governance & Nominating Committee is appointed by the board
to assist the board in fulfilling its oversight responsibilities with respect
to ensuring that the corporate governance system of BC Ferries is
effective. The committee has the mandate to:
• review, assess, and make recommendations regarding the
effectiveness of the policies and practices of the board;
• ensure the board’s continuing ability to fulfill its legislative mandate;
• implement effective due diligence over the operations of
the Company;
• make recommendations on the skills, experience and expertise
that board members collectively and individually should have
in order to oversee the operation of BC Ferries in an efficient
and cost effective manner;
• establish and implement effective processes for identifying and
recommending suitable candidates for appointment as directors
of BC Ferries; and
• make recommendations on the remuneration of directors of
BC Ferries.
77BRITISH COLUMBIA FERRY SERVICES INC.

M A N A G E M E N T ’ S D I S C U S S I O N & A N A L Y S I S
assessments
As part of its dedication to best governance practices, the board
is committed to regular assessments of the effectiveness of the
board, the board chair, committees, committee chairs, and individual
directors. The Governance & Nominating Committee annually reviews
and makes recommendations to the board on the method and
content for these assessments.
In the prior fiscal year, the board engaged an independent consultant
to coordinate the board evaluation. The consultant obtained the
directors’ views on matters related to the effectiveness of the
board through the use of questionnaires and individual discussions
with each director. The evaluation included an assessment of the
performance of the board as a whole with respect to best practices
in board governance, as well as a director self-assessment and peer
review related to best practices for board directors. The peer review
results for each director were shared with the respective director
and the chairs of the board and the Governance & Nominating
Committee, and discussions on the results were held between the
individual directors and the board chair. The results of the board
evaluation, including the results of the peer reviews, were provided
to the board, together with the consultant’s recommendations for
action. The results and the recommendations arising from the board
evaluation informed the deliberations and decisions of the board on
various matters respecting board governance and succession in the
fiscal year ended March 31, 2014.
The performance of the board as a whole, and the performance
of individual directors, is assessed regularly throughout the year.
This occurs primarily through discussions between the individual
directors and the board chair.
human resources & comPensaTion commiTTee:
Members during the fiscal year ended March 31, 2014:
Chair: Graham M. Wilson
Members: Holly A. Haston-Grant, John A. Horning, Guy D. Johnson,
Brian G. Kenning and Maureen V. Macarenko
Effective June 22, 2013, John A. Horning was appointed a member
of the committee and Holly A. Haston-Grant ceased to be a member
of the committee. Guy D. Johnson ceased to be a director and a
member of the committee effective November 22, 2013.
The Human Resources & Compensation Committee is appointed by
the board to assist the board in fulfilling its oversight responsibilities
regarding the human resources and compensation strategies
and policies of BC Ferries. The committee has the mandate to:
• regularly review, at a strategic level, the approach taken to manage
the Company’s human resources, including the recruitment,
retention, motivation, and engagement of employees in the
interests and success of the Company;
• regularly review the succession and development plans for the
President & CEO and executive management; and
• review and recommend to the board a total compensation
philosophy for the President & CEO and executive management
that, subject to the CFA, attracts and retains executives, links
total compensation to financial and operational performance,
and provides competitive total compensation opportunities at a
reasonable cost, while enhancing the ability to fulfill the Company’s
overall business strategies and objectives.
78 ANNUAL REPORT 2013–2014
m a n a g e m e n t ’ s r e p o r t
BC Ferries management is responsible for presentation and preparation of the annual consolidated financial
statements, management’s discussion and analysis (MD&A) and all other information in this annual report.
The accompanying consolidated financial statements have been prepared in accordance with International
Financial Reporting Standards. The consolidated financial statements and information in the MD&A necessarily
include amounts based on management’s informed judgements and best estimates. The financial information
presented elsewhere in this annual report is consistent with that in the consolidated financial statements.
To meet its responsibility for reliable and accurate financial statements, management has established systems of
internal control that are designed to provide reasonable assurance that assets are safeguarded from loss and that
reliable financial records are maintained. These systems are monitored by management and by internal auditors.
In addition, the internal auditors perform appropriate tests and related audit procedures.
The consolidated financial statements have been examined by KPMG LLP, independent chartered accountants.
The external auditors’ responsibility is to express a professional opinion on the fairness of management’s
consolidated financial statements. The auditors’ report outlines the scope of their examination and sets forth
their opinion.
The Board of Directors, through its Audit & Finance Committee, oversees management’s responsibilities for
financial reporting and internal control. The Audit & Finance Committee meets with the internal auditors, the
independent auditors and management to discuss auditing and financial matters and to review the consolidated
financial statements and the independent auditors’ report. The Audit & Finance Committee reports its findings
to the Board for consideration in approving the consolidated financial statements for issuance.
michael J. corrigan robert P. clarke, cga
President & Chief Executive Officer Executive Vice-President & Chief Financial Officer
June 20, 2014
Victoria, Canada
79BRITISH COLUMBIA FERRY SERVICES INC.

i n d e p e n d e n t a u d i t o r s ’ r e p o r t
TO ThE ShAREhOLDERS OF BRITISh COLUMBIA FERRY SERVICES INC .We have audited the accompanying consolidated financial statements of British Columbia Ferry Services Inc., which comprise the consolidated
statements of financial position as at March 31, 2014 and March 31, 2013, the consolidated statements of comprehensive income, changes in equity
and cash flows for the years then ended, and notes, comprising a summary of significant accounting policies and other explanatory information.
MANAGEMENT’S RESPONSIBILITY FOR ThE CONSOLIDATED FINANCIAL STATEMENTSManagement is responsible for the preparation and fair presentation of these consolidated financial statements in accordance with International
Financial Reporting Standards, and for such internal control as management determines is necessary to enable the preparation of consolidated financial
statements that are free from material misstatement, whether due to fraud or error.
AUDITORS’ RESPONSIBILITYOur responsibility is to express an opinion on these consolidated financial statements based on our audits. We conducted our audits in accordance
with Canadian generally accepted auditing standards. Those standards require that we comply with ethical requirements and plan and perform the
audit to obtain reasonable assurance about whether the consolidated financial statements are free from material misstatement.
An audit involves performing procedures to obtain audit evidence about the amounts and disclosures in the consolidated financial statements.
The procedures selected depend on our judgment, including the assessment of the risks of material misstatement of the consolidated financial
statements, whether due to fraud or error. In making those risk assessments, we consider internal control relevant to the entity’s preparation and
fair presentation of the consolidated financial statements in order to design audit procedures that are appropriate in the circumstances, but not
for the purpose of expressing an opinion on the effectiveness of the entity’s internal control. An audit also includes evaluating the appropriateness
of accounting policies used and the reasonableness of accounting estimates made by management, as well as evaluating the overall presentation
of the consolidated financial statements.
We believe that the audit evidence we have obtained in our audits is sufficient and appropriate to provide a basis for our audit opinion.
OPINIONIn our opinion, the consolidated financial statements present fairly, in all material respects, the consolidated financial position of
British Columbia Ferry Services Inc. as at March 31, 2014 and March 31, 2013, and its consolidated financial performance and its consolidated
cash flows for the years then ended in accordance with International Financial Reporting Standards.
Chartered Accountants
June 20, 2014
Victoria, Canada
80 ANNUAL REPORT 2013–2014
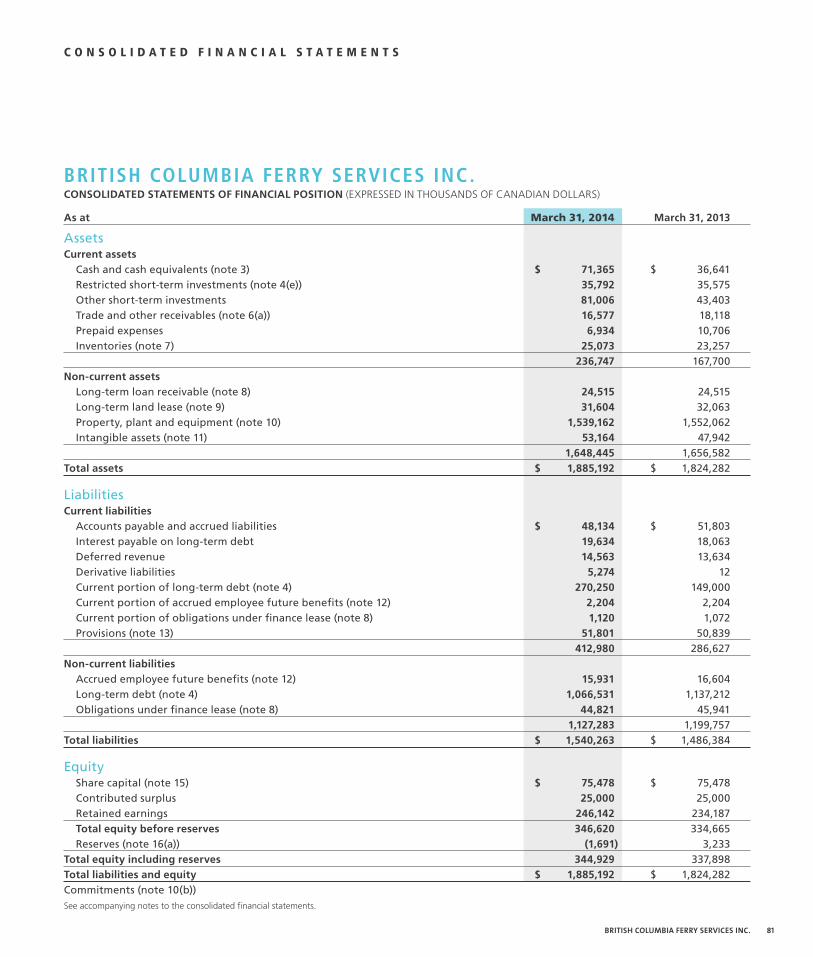
c o n s o l i d a t e d f i n a n c i a l s t a t e m e n t s
BRITISh COLUMBIA FERRY SERVICES INC .consolidaTed sTaTemenTs of financial PosiTion (ExPRESSED IN THOUSANDS OF CANADIAN DOLLARS)
as at march 31, 2014 march 31, 2013
Assetscurrent assets Cash and cash equivalents (note 3) $ 71,365 $ 36,641 Restricted short-term investments (note 4(e)) 35,792 35,575 Other short-term investments 81,006 43,403 Trade and other receivables (note 6(a)) 16,577 18,118 Prepaid expenses 6,934 10,706 Inventories (note 7) 25,073 23,257 236,747 167,700non-current assets Long-term loan receivable (note 8) 24,515 24,515 Long-term land lease (note 9) 31,604 32,063 Property, plant and equipment (note 10) 1,539,162 1,552,062 Intangible assets (note 11) 53,164 47,942 1,648,445 1,656,582Total assets $ 1,885,192 $ 1,824,282
Liabilitiescurrent liabilities Accounts payable and accrued liabilities $ 48,134 $ 51,803 Interest payable on long-term debt 19,634 18,063 Deferred revenue 14,563 13,634 Derivative liabilities 5,274 12 Current portion of long-term debt (note 4) 270,250 149,000 Current portion of accrued employee future benefits (note 12) 2,204 2,204 Current portion of obligations under finance lease (note 8) 1,120 1,072 Provisions (note 13) 51,801 50,839 412,980 286,627non-current liabilities Accrued employee future benefits (note 12) 15,931 16,604 Long-term debt (note 4) 1,066,531 1,137,212 Obligations under finance lease (note 8) 44,821 45,941 1,127,283 1,199,757Total liabilities $ 1,540,263 $ 1,486,384
Equity Share capital (note 15) $ 75,478 $ 75,478 Contributed surplus 25,000 25,000 Retained earnings 246,142 234,187 Total equity before reserves 346,620 334,665 Reserves (note 16(a)) (1,691) 3,233Total equity including reserves 344,929 337,898Total liabilities and equity $ 1,885,192 $ 1,824,282Commitments (note 10(b))See accompanying notes to the consolidated financial statements.
81BRITISH COLUMBIA FERRY SERVICES INC.

c o n s o l i d a t e d f i n a n c i a l s t a t e m e n t s
consolidaTed sTaTemenTs of comPrehensive income (ExPRESSED IN THOUSANDS OF CANADIAN DOLLARS)
years ended march 31 2014 2013
revenue
Vehicle and passenger fares $ 489,305 $ 468,780
Ferry service fees (note 17) 180,076 182,100
Retail 78,932 76,496
Federal-Provincial Subsidy Agreement (note 18) 28,373 28,078
Fuel surcharges 2,689 11,469
Regulated other income (note 19) 13,458 12,848
Other income 7,328 6,602
Total revenue 800,161 786,373
expenses
Operations 451,670 436,812
Maintenance 63,240 69,938
Administration 31,636 29,632
Cost of retail goods sold 30,860 29,500
Depreciation and amortization 136,896 135,675
Total operating expenses 714,302 701,557
operating profit 85,859 84,816
net finance and other expenses
Net finance expenses (note 21)
Finance income 3,721 2,922
Finance expenses (71,030) (72,076)
Total net finance expenses (67,309) (69,154)
Loss on disposal and revaluation of property, plant and equipment and intangible assets (557) (154)
Total net finance and other expenses (67,866) (69,308)
net earnings 17,993 15,508
other comprehensive (loss) income (note 16(b))
Items not to be reclassified to net earnings 116 1,056
Items to be reclassified to net earnings (5,040) –
Total other comprehensive (loss) income (4,924) 1,056
Total comprehensive income $ 13,069 $ 16,564
See accompanying notes to the consolidated financial statements.
82 ANNUAL REPORT 2013–2014

c o n s o l i d a t e d f i n a n c i a l s t a t e m e n t s
consolidaTed sTaTemenTs of cash flows (ExPRESSED IN THOUSANDS OF CANADIAN DOLLARS)
years ended march 31 2014 2013
cash flows from operating activities
Net earnings $ 17,993 $ 15,508
Items not affecting cash Net finance costs recognized in net earnings 67,309 69,154 Depreciation and amortization of non-current assets 136,896 135,675 Loss on disposal and revaluation of property, plant and equipment and intangible assets 557 154 Other non-cash adjustments to property, plant and equipment 523 (791) Change in derivative liabilities recognized in net earnings 222 – Changes in Long-term accrued employee future benefits (569) (757) Provisions 962 3,817 Long-term land lease 459 458 Accrued interest costs (1,110) 246Total non-cash items 205,249 207,956
Movements in operating working capital Trade and other receivables 1,541 24,223 Prepaid expenses 3,772 (3,981) Inventories (1,816) (1,241) Accounts payable and accrued liabilities (3,669) 1,095 Deferred revenue 929 (150) Change in non-cash working capital 757 19,946 Change attributable to capital asset acquisitions (1,908) 6,653 Change attributable to contributed surplus – (25,000) Change in non-cash operating working capital (1,151) 1,599
cash generated from operating activities 222,091 225,063 Interest rate support received (note 21(a)) – 742 Interest received 4,554 2,268 Interest paid (71,402) (73,471)Net cash generated by operating activities $ 155,243 $ 154,602
cash flows from financing activitiesProceeds from issuance of bonds $ 200,000 $ –Repayment of long-term debt (149,000) (9,000)Repayment of short-term debt – (17,737)Repayment of finance lease obligations (1,072) (974)Contributed surplus payment from Province – 25,000Dividends paid on preferred shares (6,038) (6,038)Deferred financing costs incurred (1,390) –Net cash generated by (used in) financing activities $ 42,500 $ (8,749)
cash flows from investing activitiesProceeds from disposal of property, plant and equipment $ 53 $ 120Purchase of property, plant and equipment and intangible assets (125,252) (100,639)(Increase) decrease of debt service reserve (217) 130Purchase of short-term investments (37,603) (16,523)Net cash used in investing activities (163,019) (116,912)Net increase in cash and cash equivalents 34,724 28,941Cash and cash equivalents, beginning of year 36,641 7,700cash and cash equivalents, end of year $ 71,365 $ 36,641
See accompanying notes to the consolidated financial statements.83BRITISH COLUMBIA FERRY SERVICES INC.

c o n s o l i d a t e d f i n a n c i a l s t a t e m e n t s
consolidaTed sTaTemenTs of changes in eQuiTy (ExPRESSED IN THOUSANDS OF CANADIAN DOLLARS)
Total Total
equity equity
share contributed retained before reserves including
capital surplus earnings reserves (note 16 (a)) reserves
Balance as at April 1, 2012 $ 75,478 $ 25,000 $ 224,717 $ 325,195 $ 2,177 $ 327,372
Net earnings for the year
ended March 31, 2013 – – 15,508 15,508 – 15,508
Other comprehensive income for
the year ended March 31, 2013 – – – – 1,056 1,056
Preferred share dividends – – (6,038) (6,038) – (6,038)
Balance as at March 31, 2013 $ 75,478 $ 25,000 $ 234,187 $ 334,665 $ 3,233 $ 337,898
Net earnings for the year ended
March 31, 2014 – – 17,993 17,993 – 17,993
Other comprehensive loss for the year
ended March 31, 2014 – – – – (4,924) (4,924)
Preferred share dividends – – (6,038) (6,038) – (6,038)
Balance as at March 31, 2014 $ 75,478 $ 25,000 $ 246,142 $ 346,620 $ (1,691) $ 344,929
See accompanying notes to the consolidated financial statements.
84 ANNUAL REPORT 2013–2014

n o t e s t o t h e c o n s o l i d a t e d f i n a n c i a l s t a t e m e n t s
(c) Basis of measurement:
These consolidated financial statements have been prepared
using the historical cost method, with the exception of the
following assets and liabilities which are measured at fair value:
land, derivatives, financial instruments held for trading and
available-for-sale financial assets.
(d) functional and presentation currency:
These consolidated financial statements are presented in
Canadian dollars (“Cdn”) which is the Group’s functional
currency. All financial data is presented in Canadian dollars
rounded to the nearest thousand.
(e) use of estimates and judgements:
The preparation of consolidated financial statements in
accordance with IFRS requires management to make judgements,
estimates and assumptions that affect the application of
accounting methods and the amounts recognized in the financial
statements. These estimates and the underlying assumptions
are established and reviewed continuously on the basis of past
experience and other factors considered reasonable in the
circumstances. They therefore serve as the basis for making
judgements about the carrying value of assets and liabilities that
are not readily apparent from other sources. Actual results may
differ from the estimates.
Significant estimates relate to:
(i) Property, plant and equipment and intangible assets
The calculation of depreciation and amortization involves
estimates concerning the economic life and salvage value
of property, plant and equipment and intangible assets.
(ii) Future employee benefits
Accounting for the costs of future employee benefits is
based on actuarial valuations, relying on key estimates for
discount rates, future salary increases, employee turnover
rates and mortality tables.
(iii) Interest rate agreements
The calculation of the effectiveness of interest rate
agreement(s) that have been designated for hedge
accounting is based on key estimates for interest rates
and discount rates.
years ended march 31, 2014 and 2013
(Columnar dollars expressed in thousands of Canadian dollars)
British Columbia Ferry Services Inc. (the “Company”) was incorporated
under the Company Act (British Columbia) by way of conversion on
April 2, 2003, and now validly exists under the Business Corporations
Act (British Columbia). The Company’s primary business activity is the
provision of coastal ferry services in British Columbia.
The Company is subject to the Coastal Ferry Act (the “Act”) as
amended, which came into force on April 1, 2003. Its common share
is held by the B.C. Ferry Authority (the “Authority”), a corporation
without share capital, and it is regulated by the British Columbia Ferries
Commissioner (the “Commissioner”) to ensure that rates are fair and
reasonable and to monitor service levels.
The Company’s business is seasonal in nature, with the highest activity
in the summer (second quarter) and the lowest activity in the winter
(fourth quarter), due to the high number of leisure travellers and
their preference to travel during the summer months. The Company
also takes advantage of the low activity during the winter months to
perform a significant portion of the required annual maintenance on
vessels and terminals.
1. aCCounting poliCies:
(a) Basis of preparation:
British Columbia Ferry Services Inc. is a company domiciled
in Canada. The address of the Company’s registered office is
Suite 500, 1321 Blanshard Street, Victoria, BC Canada, V8W 0B7.
These consolidated financial statements of the Company as at
and for the years ended March 31, 2014 and 2013 comprise the
Company and its subsidiaries (together referred to as the “Group”).
(b) statement of compliance:
These consolidated financial statements represent the annual
statements of the Group prepared in accordance with
International Financial Reporting Standards (“IFRS”), as issued
by the International Accounting Standards Board (“IASB”).
In accordance with IFRS, the Group has provided comparative
financial information and applied the same accounting policies
throughout all periods presented.
These consolidated financial statements were approved by the
Board of Directors on June 20, 2014.
85BRITISH COLUMBIA FERRY SERVICES INC.

n o t e s t o t h e c o n s o l i d a t e d f i n a n c i a l s t a t e m e n t s
The cost of self-constructed assets includes expenditures
on materials, direct labour, financing costs and an allocated
proportion of project overheads. When parts of an item
of property, plant and equipment have different estimated
useful lives, they are accounted for as separate items (major
components) of property, plant and equipment. The cost of
replacing an item of property, plant and equipment is recognized
in the carrying amount of the item if it is probable that the future
economic benefits embodied within the item will flow to the
Group, and its cost can be measured reliably. The carrying amount
of the replaced part is derecognized. Gains and losses on disposal
of an item of property, plant and equipment are determined by
comparing the proceeds from disposal with the carrying amount
of the item of property, plant and equipment and are recognized
in net earnings or loss. The costs of the day-to-day servicing of
items of property, plant and equipment are recognized in net
earnings or loss as incurred.
Where components of an asset have different estimated useful
lives, depreciation is calculated on each separate component.
Depreciation commences when an asset is available for use.
Estimates of remaining useful lives and residual values are
reviewed annually and adjusted if appropriate. Property, plant and
equipment, including assets under finance leases, are depreciated
on a straight-line basis over the estimated useful lives of the assets
at the following rates:
asset class estimated useful life
Vessel hulls 3 to 40 years
Vessel propulsion and utility systems 3 to 30 years
Marine structures 20 to 40 years
Buildings 20 to 40 years
Equipment and other 3 to 20 years
(i) intangible assets:
Intangible assets consist of acquired computer software and
licenses and rights of use as well as internally developed computer
software and website. These assets are valued at their acquisition
cost plus direct overhead and financing costs, less amortization
and impairment.
Significant judgments relate to the provision for contingencies,
including asset retirement obligations. In forming these
judgments, the Group is required to consider the probability
of future payments.
(f) Basis of consolidation – subsidiaries:
A subsidiary is an entity controlled by the Group. Control exists
when the Group has the power to manage, either directly or
indirectly, the entity’s financial and operational policies in order
to obtain benefits from its activities. The financial statements
of subsidiaries are included in the consolidated financial
statements from the date that control commences until the
date that control ceases.
The financial statements of all subsidiaries are prepared
to the same reporting date as the Group using consistent
accounting policies.
The subsidiary holdings of the Group as at March 31, 2014 are:
• PacificMarineLeasingInc.
• BCFCaptiveInsuranceCompanyLtd.
All inter-Group transactions, balances and any unrealized
income and expenses on inter-Group transactions are eliminated
on consolidation.
(g) foreign currency transactions:
Transactions denominated in foreign currencies are translated
by applying the exchange rate prevailing on the date of the
transaction. At each reporting date, all monetary assets and
liabilities denominated in foreign currencies are translated into
Cdn at the closing exchange rate. Any resulting translation
adjustments are recorded in net earnings or loss.
(h) Property, plant and equipment:
Property, plant and equipment, excluding land assets, are valued
at cost plus direct overhead and financing costs, less depreciation
and impairment. Land is valued at fair value at each year-end
using the annual assessed values for property tax purposes as
being representative of the fair values of these assets.
86 ANNUAL REPORT 2013–2014
n o t e s t o t h e c o n s o l i d a t e d f i n a n c i a l s t a t e m e n t s
Defined contribution plan accounting is applied to the Group’s
multi-employer defined benefit pension and long-term disability
plans. These multi-employer plans are administered by external
parties and the Group does not have sufficient information to
apply defined benefit plan accounting. The cost of these benefits
is charged to net earnings or loss as contributions are made to
the plans.
The actuarial determination of the accrued benefit obligations for
retirement benefits uses the projected benefit method prorated
on service (which incorporates management’s best estimate
of future salary levels, other cost escalation, retirement ages
of employees and other actuarial factors). Under the projected
benefit method, the cost of these benefits is charged to net
earnings or loss so as to spread the regular cost over the service
lives of employees in accordance with the advice of qualified
actuaries who carry out a full valuation of the plans on a regularly
scheduled basis. The pension obligation is measured as the
present value of estimated future cash outflows using interest
rates based on the yield of long-term high quality corporate
bonds with maturities matching the pension obligation.
Assets are valued at fair value for the purpose of calculating the
expected return on plan assets.
Actuarial gains (losses) arise from the difference between the
actual long-term rate of return on plan assets for a period and the
expected long-term rate of return on plan assets for that period
and from changes in actuarial assumptions used to determine the
accrued benefit obligation. For the Group’s retirement bonus and
death benefit plans, the actuarial gain (loss) is recognized in other
comprehensive income. The average remaining service period of
the active employees covered by the retirement bonus and death
benefit plans was 7.0 years as at March 31, 2011, the date of the
most recent actuarial valuation.
Past service costs arising from plan amendments are recognized
immediately to the extent that the benefits are already vested
but are deferred and amortized on a straight-line basis over the
average remaining service period of employees active at the date
of amendment where the benefits are not already vested. The full
liability for all plan deficits is recorded, as adjusted for any past
service costs still to be amortized.
Software costs are capitalized if it is probable that the asset
created will generate future economic benefits, the costs can
be reliably measured, the product is technically feasible and
the Group intends to, and has sufficient resources to, complete
development and use the asset. Website costs are capitalized
where the expenditure is incurred on developing an income
generating website. Software and website costs capitalized
include materials, direct labour and financing costs. Subsequent
expenditure is capitalized only if it increases the future economic
benefits embodied in the specific asset to which it relates.
All other expenditure, including expenditure on internally
generated goodwill and brands, is recognized in net earnings
or loss as incurred.
Intangible assets with finite useful lives are amortized on a
straight line basis over their estimated useful lives (3 to 7 years)
since this most closely reflects the expected pattern of
consumption of future economic benefits embodied in the asset.
Rights of use intangible assets are amortized on a straight-
line basis over their estimated useful lives of 10 to 30 years.
Amortization is recognized in net earnings or loss from the date
that intangible assets are available for use. The amortization
methods and estimated remaining lives are reviewed annually.
(j) inventories:
Inventories are measured at the lower of cost and net realizable
value. Net realizable value represents the estimated selling
price for inventories less all estimated costs of completion and
costs necessary to make the sale. No amounts are carried at net
realizable value.
The cost of general and catering inventories is accounted for using
the weighted average formula, while the cost of fuel inventories
is based on the first-in–first-out principle. The cost of inventories
includes expenditures incurred in acquiring the inventories and
other direct costs incurred in bringing them to their existing
location and condition.
(k) employee benefits:
The Group has a number of defined benefit pension and post-
retirement plans. The plans are generally funded by payments
from employees and by the Group, taking into account the
recommendations of independent qualified actuaries.
87BRITISH COLUMBIA FERRY SERVICES INC.

n o t e s t o t h e c o n s o l i d a t e d f i n a n c i a l s t a t e m e n t s
(n) finance leases:
Assets held under finance leases are initially recognized as assets
of the Group at their fair value at the inception of the lease or, if
lower, at the present value of the minimum lease payments.
Lease payments are apportioned between finance expenses and
reduction of the lease obligation so as to produce a constant
periodic rate of interest on the remaining balance of the liability.
(o) operating leases:
Operating lease payments are recognized as an expense on a
straight-line basis over the lease term, except where another
systematic basis is more representative of the time pattern in
which economic benefits from the leased asset are consumed.
(p) Taxes:
The Group is a “Tax Exempt Corporation” as described in the
Income Tax Act and as such is exempt from federal and provincial
income taxes.
The provision of vehicle and passenger ferry services is an exempt
supply under the Excise Tax Act for HST/GST purposes.
(q) impairment of non-financial assets:
Non-financial assets with finite lives, including property, plant and
equipment and intangible assets, are tested for impairment when
events or changes in circumstances indicate that their carrying
amounts may not be recoverable.
The impairment charged to net earnings or loss is the excess of
the carrying value over the recoverable amount. The recoverable
amount is the higher of an asset’s fair value less cost to sell or its
value in use.
For the purpose of assessing impairment, assets are grouped at the
lowest levels for which there are separately identifiable cash flows
(cash-generating units). The Group defines a cash-generating unit
as a route group. Price caps for each route group, as defined in the
Coastal Ferry Services Contract with the Province of British Columbia
(the “Province”), are set by the Commissioner based on the
principle that the costs necessary to provide service system-wide
are recovered.
When the restructuring of a benefit plan gives rise to both
a curtailment and a settlement of obligations, the curtailment
is accounted for prior to the settlement.
(l) Provisions:
A provision is recorded when:
• theGrouphasacurrentobligation(legalorconstructive)
resulting from a past event; and
• itislikelythatanoutflowofresourcesrepresentingeconomic
benefits will be required to settle the obligation; and
• theamountoftheobligationcanbemeasuredreliably.
If these conditions are not met, no provision is recorded.
Provisions are determined by discounting the expected future
cash flows at a rate that reflects current market assessments
of the time value of money and the risks specific to the liability.
The unwinding of the discount is recognized as a finance expense.
(m) revenues:
Tariff revenue is recognized when transportation is provided.
The value of fares sold for which payment is received in advance
of providing transportation is included in the statement of
financial position as deferred revenue. These advance payments
include prepaid vehicle and passenger fares, assured loading
tickets and other reservation fees.
Retail revenue consists primarily of food services and gift shop
sales. Parking revenues are received from both owned and
subcontracted parking facilities and are recognized when service
is provided. Revenue is generated from various advertising
contracts and recognized according to the individual agreement.
Construction contract revenue is recognized using the percentage
of completion method. At each reporting period, an estimate
is made of the total profit or loss expected for the contract and
the percentage of work completed. These estimates are used
to measure the fair value of the consideration receivable for the
contract and the amount of costs to be recognized in the period.
If contract costs are not probable of being recovered they are
immediately expensed.
88 ANNUAL REPORT 2013–2014

n o t e s t o t h e c o n s o l i d a t e d f i n a n c i a l s t a t e m e n t s
(ii) Loans and advances
When initially recognized, loans and advances are measured
at fair value. These financial assets are then carried at
amortized cost using the effective interest rate method.
Loans and advances are subject to recoverable value tests,
carried out whenever there are objective indicators that the
recoverable value of these assets would be lower than the
carrying value and, at the very least, on each statement of
financial position date.
(iii) Trade and other receivables
Trade and other receivables are recorded at fair value (in most
cases the same as nominal value) minus any loss of value
recorded in a special impairment account. As receivables are
due in less than one year, they are not discounted. If there is
any indication that these assets may be impaired, they will
be subject to an analysis based primarily on the following
criteria: age of the receivable, the debtor’s financial position
and negotiation of a payment schedule. The difference
between the carrying amount and the recoverable value is
recorded as a provision in net earnings or loss. Impairment
may be reversed if the asset regains its value in future
periods and the reversal is booked in the same item as the
initial provision. Impairment is deemed permanent when
the receivable itself is considered to be permanently
non-recoverable and written off.
(iv) Cash and cash equivalents
Cash and cash equivalents include cash on hand and
demand deposits, with a maturity of less than three months,
are held to maturity and measured at amortized cost.
Due to the nature of these financial instruments and/or
short-term maturity of these financial instruments, carrying
value approximates fair value. The instruments held in this
category can be liquidated or sold on short notice, and do
not bear any significant risk of loss in value.
The Group evaluates impairment losses for potential reversals when
events or changes warrant such consideration. An impairment
is reversed only to the extent that the asset’s carrying amount
does not exceed the carrying amount that would have been
determined had no impairment been recognized. A reversal
of impairment is charged to net earnings or loss.
(r) financial assets and liabilities:
Financial assets include trade receivables, loan receivables,
derivatives with a positive market value, investment in securities
and cash.
Financial liabilities include bank borrowings, bonds, obligations
related to lease contracts, derivatives with a negative market value
and trade payables.
Financial assets and liabilities presented are “non-current”
except those with a maturity of less than twelve months from
the period-end date. Those with maturities of less than twelve
months are presented as “current assets” or “cash equivalents”
depending on the circumstances.
(i) Recognition and measurement of financial assets
(excluding derivatives)
In accordance with IAS 39, Financial Instruments:
Recognition and Measurement, financial assets are classified
into one of four categories:
• assetsheld-to-maturity(securitiesgivingentitlementto
fixed or fixable payments on set dates, and which the
Group is able and intending to hold to maturity);
• loansandreceivables(non-derivativefinancialassets
subject to fixed or fixable payments, and which are not
quoted on an active market);
• assetsheld-for-trading(investmentsandsecuritiesbought
and held primarily with a view to a short-term resale); and
• assetsheldforsale(allfinancialassetsnotrecognizedin
one of the three previous categories).
Classification depends on the nature and objective of each
financial asset and is determined when first recognized.
89BRITISH COLUMBIA FERRY SERVICES INC.

n o t e s t o t h e c o n s o l i d a t e d f i n a n c i a l s t a t e m e n t s
(s) Borrowing costs:
The Group capitalizes borrowing costs that are directly
attributable to the acquisition, construction or production of
qualifying assets, as a part of the cost of those assets, until such
time as the assets are substantially ready for their intended use.
The Group identifies a qualifying asset as one that necessarily
takes six months or more to get ready for its intended use.
To the extent that funds are borrowed specifically for the
purpose of obtaining a qualifying asset, the Group capitalizes
the actual borrowing costs incurred on that borrowing during
the period less any investment income on the temporary
investment of these borrowings.
To the extent that the obtaining of a qualifying asset is funded by
general borrowings, the Group determines the borrowing costs
eligible for capitalization by applying the weighted average cost of
borrowings for the period to the expenditures on that asset.
All other borrowing costs are recognized in net earnings or loss in
the period in which they are incurred.
(t) hedging relationships:
Derivative financial instruments are utilized by the Group to
manage market risk against the volatility in foreign currency,
interest rate, and fuel price exposures. The Group does not
utilize derivative financial instruments for trading or speculative
purposes. At the inception of each hedge the Group determines
whether it will or will not apply hedge accounting.
When applying hedge accounting, the Group documents all
relationships between hedging instruments and hedged items,
as well as its risk management objectives and strategy for
undertaking various hedge transactions. This process includes
linking all derivatives to specific assets and liabilities on the
statements of financial position or to specific firm commitments
or forecasted transactions. The Group also assesses, both at the
hedge inception and on an ongoing basis, whether the derivatives
that are used in hedging transactions are effective in offsetting
changes in fair values or cash flows of hedged items.
(v) Borrowings and other financial liabilities
Trade and other debts are initially recorded at fair value,
which is generally the same as nominal value. Bank
borrowings and other financial liabilities are subsequently
measured at amortized cost calculated using the effective
interest rate method. Interest accrued on borrowings is
included in “accounts payable and accrued liabilities” on the
statement of financial position. Cash flows linked to
short-term payable amounts are not discounted. Long-term
cash flows are discounted whenever the impact is significant.
(vi) Recognition and measurement of financial derivatives
Financial derivatives are held from time to time to manage
exposure to fuel price, interest rate and foreign exchange
risks. Derivatives are initially recorded at fair value and
associated transaction costs are recognized in net earnings
or loss when incurred. After initial recognition, derivatives
are measured at fair value based on market prices at each
statement of financial position date. Changes in the fair
value of these instruments are recorded in net earnings or
loss. The Group derecognizes a financial liability when its
contractual obligations are discharged, cancelled or expired.
In estimating fair value, the Group uses quoted market prices
when available. Models incorporating observable market data
along with transaction specific factors are also used in estimating
fair value. Financial assets and liabilities are classified in the fair
value hierarchy according to the lowest level of observability
of inputs that are significant to the fair value measurement.
Assessment of the significance of a particular input to the fair
value measurement requires judgment and may affect placement
within the following fair value hierarchy levels:
– level 1 – quoted prices in active markets for identical assets
or liabilities,
– level 2 – techniques (other than quoted prices included in
level 1) that are observable for the asset or liability, either
directly (as prices), or indirectly (as derived from prices), and
– level 3 – techniques which use inputs which have a
significant effect on recorded fair values for the asset or
liability that are not based on observable market data
(unobservable inputs).
90 ANNUAL REPORT 2013–2014

n o t e s t o t h e c o n s o l i d a t e d f i n a n c i a l s t a t e m e n t s
No amount has been recorded for asset retirement obligations
relating to these assets as it is not possible to make a reasonable
estimate of the fair value of any such liability due to the
indeterminate magnitude, likelihood or financial impact,
if any, of this issue.
(w) interest rate support:
The Group receives interest rate support from the Government
of Canada for eligible new Canadian built vessels or major
refurbishment of vessels. Amounts receivable in regard to
capitalized interest are recognized as a reduction of capitalized
interest upon completion of the project. Amounts receivable
in regard to post-completion debt service costs are recognized
as a reduction to interest expense.
(x) comprehensive income:
The Group recognizes increases in the fair values of land assets
in other comprehensive income except to the extent that such an
increase represents a reversal of a decrease for the same asset
that was previously recognized in net earnings or loss. A decrease
in the fair values of land assets is recognized in net earnings or
loss to the extent the decrease exceeds the balance, if any, held in
the land revaluation reserve relating to a previous revaluation.
The Group recognizes actuarial gains and losses on employee
future benefits in other comprehensive income and does not
reclassify these to net earnings or loss in subsequent periods.
(y) segment reporting:
The Group operates within a single industry and within a
single geographical area. All review of operating results and
decisions about resources to be allocated are done at a corporate
level. Accordingly no segment reporting is presented in these
consolidated financial statements.
Realized and unrealized gains or losses associated with derivative
instruments which have been terminated or cease to be effective
prior to maturity are recognized in net earnings or loss in the
period in which they have been terminated or cease to be
effective. Realized hedge gains or losses related to non-financial
assets or liabilities are reclassified from other comprehensive
income and are included in the initial carrying amount of the
non-financial asset or liability acquired.
(u) debt transaction costs:
Legal and financing costs incurred for arranging long-term debt
are capitalized. Once the debt is issued these costs are reclassified
from deferred costs to long-term debt which is measured using
the effective interest rate method.
(v) asset retirement obligations:
In the period when it can be reasonably determined, the Group
recognizes a liability at its fair value for any legal obligations
associated with the retirement of long-lived assets when those
obligations result from the acquisition, construction, development
or normal operation of the assets. A corresponding asset
retirement cost is added to the carrying amount of the related
asset and amortized to expense on a systematic and rational basis.
It is possible that the Group’s estimates of its ultimate asset
retirement obligations could change as a result of changes in
regulations, changes in the extent of environmental remediation
required, changes in the means of reclamation or changes in cost
estimates. Changes in estimates are accounted for prospectively
from the period the estimate is revised.
The Group’s long-lived assets include certain vessels which
contain undetermined amounts of asbestos. Under certain
circumstances the Group may be required to handle and dispose
of the asbestos in a manner required by regulations. It is the
Group’s intention to sell decommissioned vessels into world
markets for continued use in providing commercial ferry service.
Under these circumstances asbestos remediation would become
the responsibility of the new owner.
91BRITISH COLUMBIA FERRY SERVICES INC.

n o t e s t o t h e c o n s o l i d a t e d f i n a n c i a l s t a t e m e n t s
2. Future aCCounting Changes:
Certain pronouncements were issued by the IASB that are
mandatory for accounting periods after March 31, 2014.
(a) ifrs 9 Financial Instruments:
This standard replaces the guidance in IAS 39 Financial Instruments:
Recognition and Measurement, on the classification and
measurement of financial assets. The Standard eliminates the
existing IAS 39 categories of held-to-maturity, available-for-sale
and loans and receivables. Financial assets will be classified into one
of two categories on initial recognition: financial assets measured
at amortized cost; or financial assets measured at fair value.
In November 2013, the International Accounting Standards
Board issued amendments to IFRS 9. The amendments include
changes which will align hedge accounting more closely with
risk management activities. Although the amendments do not
fundamentally change the types of hedging relationships or the
requirement to measure and recognize ineffectiveness; more
hedging strategies used for risk management will qualify for
hedge accounting. The amendments removed the mandatory
effective date of January 1, 2015 for adoption of IFRS 9 with a
new date to follow. In February 2014, the IASB decided on a
mandatory effective date for IFRS 9 of January 1, 2018. Early
adoption of IFRS 9 is permitted. The Group does not expect
the application of IFRS 9 to have any impact on its consolidated
financial statements and is considering the timing of its adoption.
(b) international financial reporting interpretations
committee (ifric) 21 Levies:
IFRIC 21, Levies provides guidance on when to recognize a liability
for a levy imposed by a government. IFRIC 21 is to be applied
retrospectively and is effective for the Group on April 1, 2014.
The Group does not expect this guidance to have a significant
impact on its annual consolidated financial statements.
(z) adoption of new accounting standards:
Employee benefits:
Effective April 1, 2013, the Group adopted IAS 19 Employee
Benefits (amended). The amendments to this standard make
certain changes to the recognition, presentation and disclosure of
defined benefit plans. As a result of these amendments, actuarial
gains and losses of defined benefit plans will be immediately
recognized in other comprehensive income instead of net earnings
or loss. The option to use the corridor approach to recognize these
costs over time is no longer available. In addition, the amendments
change the definition of both short-term and long-term employee
benefits so it is clear that the distinction between the two depends
on when the entity expects the benefits to become due to be
settled. As at April 1, 2013, there were no unrecognized actuarial
gains or losses of the Group’s defined benefit plans. During the
year ended March 31, 2014, the Group recognized actuarial gains
of $0.1 million in other comprehensive income.
Fair value measurements:
Effective April 1, 2013, the Group adopted IFRS 13 Fair Value
Measurement. This standard replaces the fair value measurement
guidance contained in individual IFRSs with a single source of
fair value measurement guidance. It defines fair value as the
price that would be received to sell an asset or paid to transfer a
liability in an orderly transaction between market participants at
the measurement date. The adoption of this new standard has
not had any impact on the Group’s March 31, 2014 consolidated
financial statements.
92 ANNUAL REPORT 2013–2014

n o t e s t o t h e c o n s o l i d a t e d f i n a n c i a l s t a t e m e n t s
3. Cash and Cash equivalents:
as at march 31 2014 2013
Cash 11,783 19,043
Cash equivalents:
Held-for-trading investments 3 93
Held-to-maturity investments 59,579 17,505
Total 71,365 36,641
4. loans:
as at march 31 2014 2013
Long-term debt:5.74% Senior Secured Bonds, Series 04-1, due May 2014
(effective interest rate of 5.92%) 250,000 250,000
6.25% Senior Secured Bonds, Series 04-4, due October 2034
(effective interest rate of 6.41%) 250,000 250,000
5.02% Senior Secured Bonds, Series 07-1, due March 2037
(effective interest rate of 5.06%) 250,000 250,000
5.58% Senior Secured Bonds, Series 08-1, due January 2038
(effective interest rate of 5.62%) 200,000 200,000
6.21% Senior Secured Bonds, Series 08-2, due December 2013
(effective interest rate of 6.33%) – 140,000
4.70% Senior Secured Bonds, Series 13-1, due October 2043
(effective interest rate of 4.75%) 200,000 –
12 Year Loan, maturing March 2020
Tranche A (effective interest rate of 5.17%) 45,000 52,500
Tranche B (floating interest rate of 1.52% at March 31, 2014) 20,625 13,125
12 Year Loan, maturing June 2020
Tranche A (effective interest rate of 5.18%) 46,875 54,375
Tranche B (floating interest rate of 1.52% at March 31, 2014) 20,625 13,125
2.95% Loan, maturing January 2021 (effective interest rate of 3.08%) 63,000 72,000
1,346,125 1,295,125
Less: Deferred financing costs and unamortized bond discounts (9,344) (8,913)
Current portion (270,250) (149,000)
Total 1,066,531 1,137,212
In May 2004, the Group entered into a master trust indenture which established common security and a set of common covenants for the benefit
of all lenders under the Group’s financing plan. The financing plan encompasses an ongoing program capable of accommodating a variety of
corporate debt instruments and borrowings, ranking pari passu.
The Group has issued six series of obligation bonds under the Master Trust Indenture (“MTI”) and entered into a credit facility agreement.
In addition, the Group has entered into loan agreements which provided $288 million to partially finance the Group’s purchase of two Super ‘C’
class vessels and one northern vessel. These funds were released to coincide with the conditional acceptance of the vessels in February 2008,
May 2008 and January 2009.
93BRITISH COLUMBIA FERRY SERVICES INC.

n o t e s t o t h e c o n s o l i d a t e d f i n a n c i a l s t a t e m e n t s
These loan agreements deferred the principal payments for the
first three years to a second tranche (Tranche B) on which interest
only is paid in periods ranging from one to six months at the
option of the Group, with the principal balance due when the
loan matures. The interest rates on Tranche B are reset at floating
rates of CAD LIBOR plus 30 bps (effective June 2013, CDOR
plus 30 bps), which will vary depending on the interest payment
period. During the quarter ended September 30, 2011, the Group
entered into amendments to the two loan agreements. These
amendments allowed for the continuance of Tranche B for three
years provided that the outstanding balance of Tranche B was
fully prepaid. The Group fully prepaid the outstanding Tranche
B balances of both loans ($22.5 million each); consequently, the
Tranche A principal payments will be financed by draws under
Tranche B until June 2014.
(c) 2.95% loan:
Proceeds of $108.0 million were received in January 2009 and
applied toward the purchase of the Northern Expedition to
coincide with conditional acceptance from the shipyard. Equal
semi-annual principal payments plus interest are due in January
and July each year of the 12 year term of the loan.
(d) credit facility:
The Group has a credit facility with a syndicate of Canadian
banks, secured by pledged bonds. This revolving facility, in the
amount of $155.0 million, was amended on March 12, 2014 to
extend the maturity date to April 2019. There were no draws on
this credit facility as at March 31, 2014 and as at March 31, 2013.
Interest expensed during the year ended March 31, 2014, was
$0.3 million (2013: less than $0.1 million). Letters of credit
outstanding against this facility at March 31, 2014 totalled
$0.1 million (March 31, 2013: $0.1 million).
(e) debt service reserves:
The Group is required to maintain debt service reserves for the
Series 04-1, 04-4, 07-1, 08-1 and 13-1 bonds equal to not less
than six months forecast debt service, to be increased under
certain conditions. Further debt service reserves are required to be
maintained for the 12 year loans and the 2.95% loan equal to not
less than six months forecast debt service, to be increased under
certain conditions.
(a) Bonds:
Bonds are issued under supplemental indentures either as
obligation bonds or as pledged bonds. The bonds are secured by a
registered first mortgage and charge over vessels, an unregistered
first mortgage and charge over ferry terminal leases, and by a
general security agreement on property and contracts. The bonds
are redeemable in whole or in part at the option of the Group.
The following table shows the semi-annual interest payment dates
for the obligation bonds each year through to maturity.
Bonds interest payment dates
Series 04-1 May 27 November 27
Series 04-4 April 13 October 13
Series 07-1 March 20 September 20
Series 08-1 January 11 July 11
Series 08-2 December 19 June 19
Series 13-1 April 23 October 23
On July 24, 2013, the Group exercised its right to redeem the
Series 08-2 Bonds. In accordance with the provisions of the MTI,
the Group paid to the registered holders of the bonds a total of
$143.2 million which reflects a redemption price of $1,016.70 per
$1,000 together with unpaid interest accrued to the redemption
date. The redemption was funded with draws on the credit facility
of $88.0 million and cash on hand of $55.2 million. The bond
redemption premium paid of $2.3 million was recognized in
finance expense.
On October 25, 2013, the Group issued $200 million of senior
secured bonds. The Series 13-1 bonds bear interest at 4.702% per
annum, payable semi-annually and will mature October 23, 2043.
A debt service reserve for these bonds has been established in the
amount of $4.7 million. The bond issue is partially related to the
early redemption in July 2013 of the $140 million bond Series 08-2.
The net proceeds from the sale of the bonds was used to repay
outstanding draws on the credit facility and to fund the reserve
account, and will be used to partially fund capital expenditures
and provide funding for general corporate purposes.
(b) 12 year loans:
Proceeds of $90.0 million were received in each of February
2008 and May 2008 for the partial financing of the purchase of
the Coastal Inspiration and the Coastal Celebration to coincide
with conditional acceptance of these vessels from the shipyard.
Quarterly payments are due in March, June, September and
December each year of the term of the loans.
94 ANNUAL REPORT 2013–2014

n o t e s t o t h e c o n s o l i d a t e d f i n a n c i a l s t a t e m e n t s
As a result of their redemption on July 24, 2013, the Group is no longer required to maintain a debt service reserve for the Series 08-2 bonds.
As at March 31, 2014, debt service reserves of $35.8 million were held in short-term investments and have been classified as restricted short-term
investments on the balance sheet (March 31, 2013: $35.6 million).
5. FinanCial instruments:
The carrying and fair values of the Group’s financial instruments are as follows:
2014 2013
as at march 31 Carrying value approx Fair value carrying value approx fair value
Available for sale1
Cash 11,783 11,783 19,043 19,043
Financial assets/liabilities at fair value
through net earnings or loss2
Cash equivalents 3 3 93 93
Derivative liabilities 7 7 12 12
Financial assets/liabilities at fair value
through other comprehensive income3
Derivative liabilities 5,267 5,267 – –
Held-to-maturity4
Cash equivalents 59,579 59,579 17,505 17,505
Restricted short-term investments 35,792 35,792 35,575 35,575
Other short-term investments 81,006 81,006 43,403 43,403
Loans and receivables4
Trade and other receivables 16,577 16,577 18,118 18,118
Long-term loan receivable5 24,515 24,515 24,515 24,515
Other financial liabilities4
Accounts payable and accrued liabilities 48,134 48,134 51,803 51,803
Interest payable on long-term debt 19,634 19,634 18,063 18,063
Provisions 51,801 51,801 50,839 50,839
Long-term debt, including current portion6,7 1,336,781 1,515,137 1,286,212 1,486,749
1 Measured at fair value with revaluation gains and losses included in other comprehensive income until the asset is removed from the statement of financial position. Due to the nature of this financial instrument, carrying value approximates fair value.
2 Measured at fair value with all gains and losses included in net earnings in the period in which they arise. Fair values for the derivative liabilities have been estimated using period-end market rates. These fair values approximate the amount that the Group would pay to settle the contract at the date of the statement of financial position.
3 If the hedge is effective, measured at fair value with all gains and losses initially included in other comprehensive income in the period in which they arise and subsequently in net earnings or loss when realized or when the hedge ceases to be effective. If the hedge is ineffective, measured at fair value with all gains and losses recognized in net earnings or loss. Fair values for the derivative liabilities have been estimated using period-end market rates. These fair values approximate the amount that the Group would pay to settle the contract at the date of the statement of financial position.
4 Measured at amortized cost. Due to the nature of these financial instruments and/or short-term maturity of these financial instruments, carrying value approximates fair value except as noted.
5 Measured at amortized cost. Carrying value approximates fair value as the rate of return is variable and is expected to return a market rate of interest.
6 Carrying value is measured at amortized cost using the effective interest rate method.
7 Fair value is calculated by discounting the future cash flows of each debt issue at the estimated yield to maturity for the same or similar issues at the date of the statement of financial position, or by using available quoted market prices.
95BRITISH COLUMBIA FERRY SERVICES INC.

n o t e s t o t h e c o n s o l i d a t e d f i n a n c i a l s t a t e m e n t s
The following items shown in the consolidated statement of financial position at March 31, 2014 and March 31, 2013 are measured at fair value
on a recurring basis using level 1 or 2 inputs. The fair value of the financial assets and liabilities at March 31, 2014 and at March 31, 2013, using
level 3 inputs, was $nil.
2014 2013
as at march 31 level 1 level 2 level 1 level 2
Asset (liability):
Cash1 11,783 – 19,043 –
Cash equivalents1 3 – 93 –
Derivatives2 – (5,274) – (12)
Long-term debt, including current portion2 – (1,515,137) – (1,486,749)
11,786 (1,520,411) 19,136 (1,486,761)
1 Classified in level 1 as the measurement inputs are derived from observable, unadjusted quoted prices in active markets for identical assets.
2 Classified in level 2 as the significant measurement inputs used in the valuation models are indirectly observable in active markets (derived from prices).
Fair value estimates are made at a specific point in time, based on relevant market information and information about the financial instrument.
These estimates cannot be determined with precision as they are subjective in nature and involve uncertainties and matters of judgment.
Where market prices are not available, fair values are estimated using discounted cash flow analysis based on the Group’s current borrowing
rate for similar borrowing arrangements.
No amounts have been reclassified into or out of fair value classifications in the year ended March 31, 2014. Financial assets have been pledged
as security for liabilities under the MTI (note 4). The Group does not hold any multiple embedded derivative financial assets or liabilities.
The ineffective portion of an unrealized hedge loss on an interest rate forward contract of $0.2 million was recognized in net earnings during
the year ended March 31, 2014 (note 6(c)).
As at March 31, 2014, all available for sale and held-for-trading financial instruments are classified as level 1 in the fair value hierarchy with
quoted prices in active markets.
During the year ended March 31, 2014, no profits resulting from the use of valuation techniques used to measure level 2 or 3 instruments in
the fair value hierarchy (i.e. those with no active market price) have been recognized.
The Group may use derivative instruments to hedge its exposure to fluctuations in fuel prices, interest rates and foreign currency exchange
rates. The fair value of commodity derivatives reflects only the value of the commodity derivatives and not the offsetting change in value of the
underlying future purchase of fuel. These fair values reflect the estimated amounts that the Group would receive or pay should the derivative
contracts be terminated at the stated dates.
6. FinanCial risk management:
Exposure to credit risk, liquidity risk, and market risk arises in the normal course of the Group’s business. The Group manages market risk arising
from the volatility in foreign currency, interest rate, and fuel price exposures in part through the use of derivative financial instruments including
forward contracts, swaps and options. The Group does not utilize derivative financial instruments for trading or speculative purposes. At the
inception of each hedge the Group determines whether it will or will not apply hedge accounting. As at March 31, 2014 the Group has entered
into four interest rate forward contracts (note 6 (c)) and has applied hedge accounting to these contracts (2013: nil).
96 ANNUAL REPORT 2013–2014

n o t e s t o t h e c o n s o l i d a t e d f i n a n c i a l s t a t e m e n t s
(a) credit risk:
Credit risk is the risk that a third party to a financial instrument might fail to meet its obligations under the terms of the financial instrument.
For cash and cash equivalents, short-term investments, derivative assets and trade and other receivables the Group’s credit risk is limited to the
carrying value on the statements of financial position. Management does not believe that the Group is subject to any significant concentration
of credit risk.
The Group limits its exposure to credit risk on cash and cash equivalents and investments by investing in liquid securities with high credit quality
counter parties, placing limits on tenor of investment instruments and instituting maximum investment values per counter party.
Accounts receivable by source are as follows:
2014 2013
as at march 31 $ % $ %
Trade customers and miscellaneous 8,010 48.3% 8,305 45.8%
Federal and Provincial governments 8,567 51.7% 9,813 54.2%
Total 16,577 100.0% 18,118 100.0%
Accounts receivable from trade customers are primarily due from commercial customers and transportation operators. Credit risk is reduced
by a large and diversified customer base and is managed through the review of third party credit reports on customers both before extending
credit and during the business relationship. The Group manages its exposure to credit risk associated with all customers through the monitoring
of aging of receivables, by collecting deposits from and adjusting credit terms for higher risk customers and customers who are not on a
pre-authorized payment plan. Amounts due from tickets sold to passengers through the use of major credit cards are settled shortly after sale
and are classified as cash and cash equivalents on the balance sheet.
Accounts receivable from trade customers are generally due in 30 days. As at March 31, 2014, 100% of trade receivables are current.
As at March 31, 2014, the provision for credit losses was $0.1 million (2013: $0.1 million) and reflects management’s estimate of uncollectible
receivables from trade customers based on past experience and analysis of customer accounts.
Amounts due from the Government of Canada and the Province are considered low credit risk.
The Group is exposed to credit risk in the event that a counter party to an investment contract or a derivative contract defaults on its obligation,
including fuel commodity swaps and foreign exchange and interest rate forward contracts. The Group manages the credit exposure related to
financial instruments by dealing with high credit quality institutions, in accordance with established investment parameters, and by an ongoing
review of its exposure to counter parties. Counter party credit rating and exposures are monitored by management on an ongoing basis, and
are subject to approved credit limits. The counter parties with which the Group has significant derivative transactions must be rated single A or
higher. The Group does not expect any counter parties to default on their obligations.
97BRITISH COLUMBIA FERRY SERVICES INC.

n o t e s t o t h e c o n s o l i d a t e d f i n a n c i a l s t a t e m e n t s
(b) liquidity risk:
Liquidity risk is the risk that an entity will not be able to meet its obligations associated with its financial liabilities. The Group’s financial position
could be adversely affected if it fails to arrange sufficient and cost effective financing to fund, among other things, capital expenditures and the
repayment of maturing debt. The ability to arrange sufficient and cost effective financing is subject to numerous factors, including the results of
operations and financial position of the Group, conditions in the capital and bank credit markets, ratings assigned by rating agencies and general
economic conditions.
The Group manages liquidity risk through daily monitoring of cash balances, the use of long-term forecasting models, maintaining access to a
credit facility and the maintenance of debt service reserves (note 4). The Group targets a strong investment grade credit rating to maintain capital
market access at reasonable interest rates. As at March 31, 2014 the Group’s credit ratings were as follows:
dBrs standard & Poor’s
British Columbia Ferry Services Inc.:
Senior secured long-term debt A (March 31, 2013: A) AA- (March 31, 2013: A+)
The following is an analysis of the contractual maturities of the Group’s financial liabilities as at March 31, 2014:
< 1 year 2-3 years 4-5 years > 5 years Total
Financial liabilitiesAccounts payable and accrued liabilities 48,134 – – – 48,134
Interest payable on long-term debt 19,634 – – – 19,634
Derivative liabilities 5,274 – – – 5,274
Provisions 51,801 – – – 51,801
Obligations under finance lease,
including current portion 1,120 2,825 3,234 38,762 45,941
Long-term debt, including current
portion (excluding deferred costs)1 270,250 48,000 48,000 979,875 1,346,125
Total financial liabilities – principal only 396,213 50,825 51,234 1,018,637 1,516,909
Interest payable – long-term debt2 61,989 106,639 102,590 911,822 1,183,040
Interest payable – obligations under
finance lease 1,979 3,793 3,526 9,125 18,423
Total financial liabilities, including
interest payable 460,181 161,257 157,350 1,939,584 2,718,372
1 Carrying value at March 31, 2014, excludes unamortized deferred financing costs of $9.3 million. The majority of the Group’s long-term debt relates to acquisition of property, plant and equipment and intangible assets.
2 Interest payable on long-term debt excludes the variable rate interest payable on Tranche B of the 12 Year loans (note 4(b)).
98 ANNUAL REPORT 2013–2014

n o t e s t o t h e c o n s o l i d a t e d f i n a n c i a l s t a t e m e n t s
Foreign currency price risk:
The Group is exposed to risk from foreign currency prices
on financial instruments, such as accounts payable and future
purchase commitments denominated in currencies other than
the Canadian dollar. To manage exposure on future purchase
commitments, the Group reviews foreign currency denominated
commitments and hedges through derivative instruments
as necessary. As at March 31, 2014, the Group has foreign
currency forward contracts of $1.2 million (2013: $1.0 million).
A 10 per cent change in foreign exchange rates would not have
had a significant effect on earnings for the twelve months
ended March 31, 2014.
Fuel price risk:
The Group is exposed to risks associated with changes in the
market price of marine diesel fuel. The Group may manage
its exposure to fuel price volatility by entering into hedging
instruments with certain financial intermediaries in order to
reduce price volatility and add a fixed component to the inherent
floating nature of fuel prices. Fuel price hedging instruments
are used solely for the purpose of reducing fuel price risk, not
for generating trading profits. Gains and losses resulting from
fuel forward contracts are recognized as a component of fuel
costs. Pursuant to the Group’s Financial Risk Management Policy,
the term of the contracts is not to extend beyond three years.
This policy limits hedging, to a maximum of 95% of anticipated
monthly fuel consumption for the immediately following
12 month period; 90% of anticipated monthly fuel consumption
for the 12 month period thereafter and to 85% of anticipated
monthly fuel consumption for the remaining 12 month period.
The Group is also allowed by regulatory order to use deferred
fuel cost accounts to mitigate the impact of changes in fuel price
on its earnings.
(c) market risk:
Market risk is the risk that the fair value or future cash flows of
a financial instrument will fluctuate due to changes in market
interest rates, foreign currency prices or fuel prices.
Interest rate risk:
The Group is exposed to interest rate risk associated with
short-term borrowings, floating rate debt and the pricing of
future issues of long-term debt. As at March 31, 2014, the
Group’s cash equivalents and short-term investments include fixed
rate instruments with maturities of 185 days or less. Accordingly,
the Group has exposure to interest rate movement that occurs
beyond the term of the maturity of the fixed rate investments.
The Group’s credit facility and the second tranche of each of the
two 12 year loans are at variable rates and are subject to interest
rate risk. To manage this risk, the Group maintains between
70% and 100% of its debt portfolio in fixed rate debt, in
aggregate. As at March 31, 2014, the Group had approximately
three per cent of total debt in variable rate instruments. A 50 basis
point change in interest rates would not have had a significant
effect on earnings for the twelve months ended March 31, 2014.
Subsequent to March 31, 2014, the Group refinanced a portion
of the Series 04-1 Bonds which matured in May 2014 by issuing
a 30 year Cdn denominated fixed-rate bullet bond (note 26).
The interest on the new bonds is based on the Government of
Canada (“GoC”) 30 year Cdn bond plus an applicable corporate
spread. As at March 31, 2014, the Group has entered into interest
rate forward contracts with a total notional value of $160 million
to reduce its exposure to changes in the GoC 30 year Cdn bond
benchmark interest rate and has applied hedge accounting.
These agreements settle in April 2014 and the impact on net
earnings or loss will occur over the next 30 years as the interest on
the bond is expensed. During the quarter ended March 31, 2014
the unrealized hedge loss on these contracts was $5.3 million.
The effective portion of this unrealized loss of $5.1 million has been
recognized in other comprehensive income and the ineffective
portion of $0.2 million has been recognized in net earnings.
99BRITISH COLUMBIA FERRY SERVICES INC.

n o t e s t o t h e c o n s o l i d a t e d f i n a n c i a l s t a t e m e n t s
Commencing June 25, 2012, the regulatory deferred fuel cost
accounts operate as follows:
Any differences between the per litre cost of fuel purchased and
consumed (including hedge gains or losses) and the per litre cost
of fuel included in the determination of price caps are:
i) for those routes comprising the Northern Route Group;
a. the first 5 cents per litre of difference is recorded in
deferral accounts for recovery or settlement through
future tariffs to customers (note 20(a)).
b. any difference beyond 5 cents per litre is recorded in
accounts receivable or payable for subsequent recovery
from or payment to the Province, and
ii) for all other routes;
a. recorded in deferral accounts for recovery or settlement
through future tariffs to customers (note 20(a)).
If the Group was permitted under IFRS to recognize the effects
of rate regulation, there would be no effect on comprehensive
income from changes in fuel prices.
During the year ended March 31, 2014, the amounts receivable
from the Province in relation to fuel cost differences totalled
$1.7 million (2013: $1.0 million receivable from the Province).
7. inventories:
as at march 31 2014 2013
Food and retail inventories 4,052 3,436
Fuel inventories 4,433 4,140
Consumable parts and supplies 16,588 15,681
Total 25,073 23,257
Prior to June 25, 2012, the regulatory deferred fuel cost accounts
operated as follows:
Any differences between the per litre cost of fuel purchased and
consumed (including hedge gains or losses) and the per litre cost
of fuel included in the determination of price caps were:
i) for those routes comprising the Northern Route Group;
a. one-half of the first 5 cents per litre of difference was
recorded in expense for the period with the remaining
one-half of the first 5 cents per litre of difference
recorded in deferral accounts for recovery or settlement
through future tariffs to customers (note 20(a)), and
b. any difference beyond 5 cents per litre was recorded in
accounts receivable or payable for subsequent recovery
from or payment to the Province, and
ii) for all other routes;
a. one-half of the first 5 cents per litre of difference was
recorded in expense for the period with all remaining
differences per litre recorded in deferral accounts
for recovery or settlement through future tariffs to
customers (note 20(a)).
100 ANNUAL REPORT 2013–2014

n o t e s t o t h e c o n s o l i d a t e d f i n a n c i a l s t a t e m e n t s
8. obligations under FinanCe lease:
During the year ended March 31, 2011, agreements which constitute a finance lease for space in a new downtown Victoria, BC head office
building took effect following the completion of construction of the new building. The initial term of the new building lease is for fifteen years,
with four renewal options of five years each. The lease agreement includes payment of building operating costs and property taxes based on
the Group’s proportion of total rentable area.
Loan and purchase option:
The Group has advanced funds to, and has a loan receivable from, the developer of the new head office property in the amount at $24.5 million.
The term of the loan is fifteen years, secured by a second mortgage on the property. The loan agreement provides for interest equal to one-half of
the net cash flow from the property, subject to minimum and maximum percentage rates of interest. Over the term of the loan, interest is expected
to approximate the market rate when the loan was made. Incidental to the loan, the Group was granted an option to purchase up to fifty percent
of the owner’s equity interest in the new building at a price of $24.5 million. The purchase option expires at the end of the loan term.
Future minimum lease payments and obligations under the head office and other capital leases are as follows:
minimum executory imputed
lease payments costs interest (4.44%) obligation
Less than one year 4,799 1,700 1,979 1,120
Between one and five years 20,527 7,149 7,319 6,059
Later than five years 36,798 13,426 9,125 14,247
Purchase option 24,515 – – 24,515
Total 86,639 22,275 18,423 45,941
Current portion (1,120)
Non-current portion 44,821
9. long-term land lease:
On April 1, 2003, the Group’s land and structures comprising its terminals were transferred by the Group to the BC Transportation Financing
Authority (“BCTFA”), a British Columbia Crown Corporation and related party at the time of the transaction. In exchange, the Group received
recognition of a prepayment for leases of the transferred terminal structures and land. The structures, having lives of less than the lease term, are
considered a capital lease and as such have been capitalized and included with capital assets and are amortized in accordance with the Group’s
amortization policy.
The land, having an indefinite useful life, is considered an operating lease. The prepayment of the land lease has been deferred and will be
amortized on a straight-line basis over eighty years, being the initial sixty year lease period plus an additional twenty year bargain renewal option.
The transaction was initially recorded at the carrying values of the transferred terminal structures and land.
Since April 1, 2003, the Group has entered into various agreements with BCTFA to add lands to the existing terminal leases. During the years
ended March 31, 2014 and March 31, 2013, no new land costs were added to the terminal leases.
101BRITISH COLUMBIA FERRY SERVICES INC.
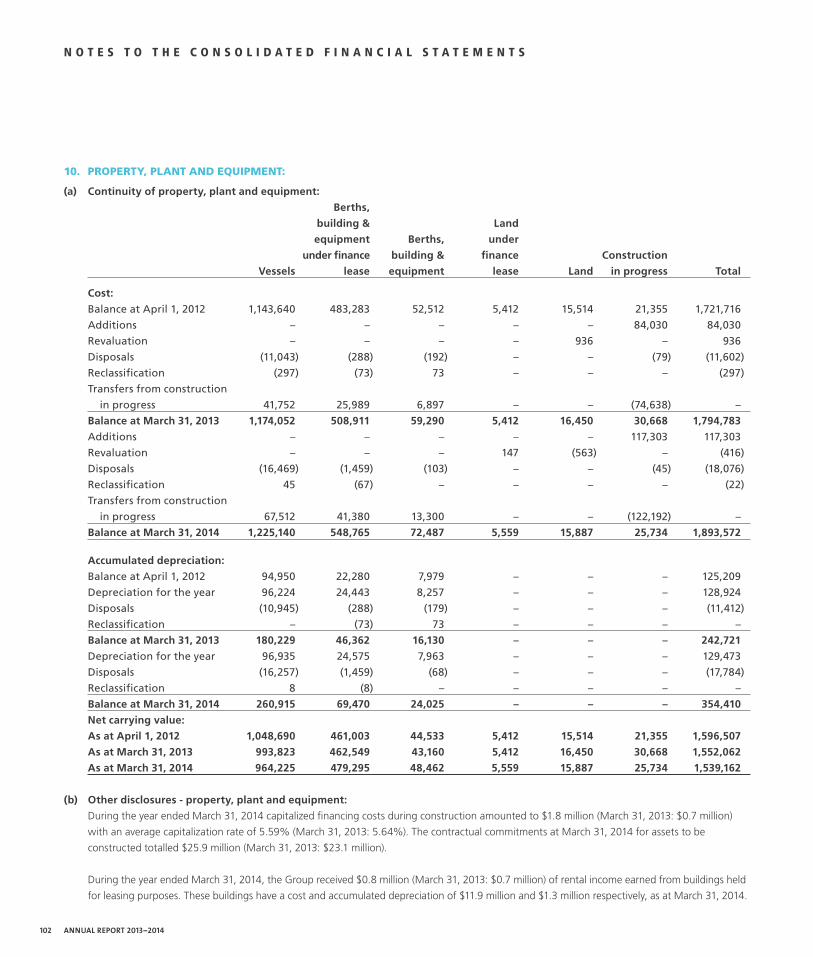
n o t e s t o t h e c o n s o l i d a t e d f i n a n c i a l s t a t e m e n t s
10. property, plant and equipment:
(a) continuity of property, plant and equipment:
Berths,
building & land
equipment Berths, under
under finance building & finance construction
vessels lease equipment lease land in progress Total
cost:
Balance at April 1, 2012 1,143,640 483,283 52,512 5,412 15,514 21,355 1,721,716
Additions – – – – – 84,030 84,030
Revaluation – – – – 936 – 936
Disposals (11,043) (288) (192) – – (79) (11,602)
Reclassification (297) (73) 73 – – – (297)
Transfers from construction
in progress 41,752 25,989 6,897 – – (74,638) –
Balance at march 31, 2013 1,174,052 508,911 59,290 5,412 16,450 30,668 1,794,783
Additions – – – – – 117,303 117,303
Revaluation – – – 147 (563) – (416)
Disposals (16,469) (1,459) (103) – – (45) (18,076)
Reclassification 45 (67) – – – – (22)
Transfers from construction
in progress 67,512 41,380 13,300 – – (122,192) –
Balance at march 31, 2014 1,225,140 548,765 72,487 5,559 15,887 25,734 1,893,572
accumulated depreciation:
Balance at April 1, 2012 94,950 22,280 7,979 – – – 125,209
Depreciation for the year 96,224 24,443 8,257 – – – 128,924
Disposals (10,945) (288) (179) – – – (11,412)
Reclassification – (73) 73 – – – –
Balance at march 31, 2013 180,229 46,362 16,130 – – – 242,721
Depreciation for the year 96,935 24,575 7,963 – – – 129,473
Disposals (16,257) (1,459) (68) – – – (17,784)
Reclassification 8 (8) – – – – –
Balance at march 31, 2014 260,915 69,470 24,025 – – – 354,410
net carrying value:
as at april 1, 2012 1,048,690 461,003 44,533 5,412 15,514 21,355 1,596,507
as at march 31, 2013 993,823 462,549 43,160 5,412 16,450 30,668 1,552,062
as at march 31, 2014 964,225 479,295 48,462 5,559 15,887 25,734 1,539,162
(b) other disclosures - property, plant and equipment:
During the year ended March 31, 2014 capitalized financing costs during construction amounted to $1.8 million (March 31, 2013: $0.7 million)
with an average capitalization rate of 5.59% (March 31, 2013: 5.64%). The contractual commitments at March 31, 2014 for assets to be
constructed totalled $25.9 million (March 31, 2013: $23.1 million).
During the year ended March 31, 2014, the Group received $0.8 million (March 31, 2013: $0.7 million) of rental income earned from buildings held
for leasing purposes. These buildings have a cost and accumulated depreciation of $11.9 million and $1.3 million respectively, as at March 31, 2014.
102 ANNUAL REPORT 2013–2014

n o t e s t o t h e c o n s o l i d a t e d f i n a n c i a l s t a t e m e n t s
11. intangible assets:
(a) continuity of intangible assets:
acquired internally
software, developed
licenses & software & assets under
rights website development Total
cost:
Balance at April 1, 2012 22,785 10,779 14,477 48,041
Additions – – 12,935 12,935
Disposals (357) – – (357)
Transfers from assets under development 1,941 32 (1,973) –
Balance at march 31, 2013 24,369 10,811 25,439 60,619
Additions – – 12,701 12,701
Disposals (152) – (56) (208)
Transfers from assets under development 7,156 705 (7,861) –
Balance at march 31, 2014 31,373 11,516 30,223 73,112
accumulated amortization and impairment:
Balance at April 1, 2012 4,050 2,233 – 6,283
Amortization for the year 4,509 2,242 – 6,751
Disposals (357) – – (357)
Balance at march 31, 2013 8,202 4,475 – 12,677
Amortization for the year 4,852 2,571 – 7,423
Disposals (152) – – (152)
Balance at march 31, 2014 12,902 7,046 – 19,948
net carrying value:
as at april 1, 2012 18,735 8,546 14,477 41,758
as at march 31, 2013 16,167 6,336 25,439 47,942
as at march 31, 2014 18,471 4,470 30,223 53,164
(b) other disclosures – intangible assets:
There was no impairment of intangible assets during the year ended March 31, 2014 or the year ended March 31, 2013.
Capitalized financing costs during construction for intangible assets for the year ended March 31, 2014 totalled $1.4 million (March 31, 2013:
$1.1 million).
During the year ended March 31, 2014, intangible assets totalling $12.6 million (March 31, 2013: $12.4 million) were acquired and $0.1 million
(March 31, 2013: $0.5 million) were internally developed.
103BRITISH COLUMBIA FERRY SERVICES INC.

n o t e s t o t h e c o n s o l i d a t e d f i n a n c i a l s t a t e m e n t s
12. aCCrued employee Future beneFits:
(a) description of benefit plans:
funding status administrator Plan type Basis of accounting
Public Service Pension funded Third Party Multi-employer Defined
defined benefit contribution
Retirement bonus unfunded Group Defined benefit Defined benefit
Death benefit unfunded Group Defined benefit Defined benefit
Long-term disability funded Third Party Multi-employer Defined
defined benefit contribution
Supplemental executive retirement plan unfunded Group Defined benefit Defined benefit
Sick Bank obligation unfunded Group Defined benefit Defined benefit
WCB obligation unfunded Third Party Defined benefit Defined benefit
The Group and its employees contribute to the Public Service Pension Plan (the “Plan”). The Pension Corporation of the Province of British Columbia
administers the Plan, including the payment of retirement and post-employment benefits on behalf of employers. The Plan is a multi-employer
defined benefit pension plan. Under joint trusteeship, which became effective January 1, 2001, the risk and reward associated with the Plan’s
unfunded liability or surplus is shared between the employers and the plan members and will be reflected in their future contributions. Sufficient
information is not available for this plan to be accounted for as a defined benefit plan.
In addition, eligible employees are entitled to other retirement and future benefits as provided for under the collective agreement and terms of
employment. A retirement bonus and a death benefit, both unfunded defined benefit plans and both administered by the Group, are based on
years of service and final average salary. A funded long-term disability multi-employer plan provides disability income benefits after employment,
but before retirement. Sufficient information is not available for this plan to be accounted for as a defined benefit plan.
The Group administers an unfunded supplemental executive retirement plan which encourages continued retention and provides additional
pension compensation.
The Group also administers an unfunded accumulated sick leave bank (“Sick Bank obligation”) consisting of unused sick time credits earned
prior to the discontinuation of the sick leave accumulation benefit in 1979. Accumulated sick leave may be drawn down at 100% or paid out
at 50%. Benefits are paid out at current salary rates. No new credits are accumulated to this bank.
The Group’s employees may also receive compensation benefits arising from claims prior to March 31, 2003, administered by the Workers’
Compensation Board (“WCB obligation”). Prior to March 31, 2003, the Group participated in the Workers’ Compensation Board deposit class
coverage system. Subsequent to March 31, 2003, the Group has been covered under the Workers’ Compensation Board rate system. The change
to the rate system resulted in a residual liability from the deposit class system that has been valued by actuarial assumptions as appropriate for
a closed plan. Currently this obligation is unfunded.
(b) Total cash payments:
Total cash payments for employee future benefits for the year ended March 31, 2014, consisting of cash contributed by the Group to its
multi-employer defined benefit plans, cash payments directly to beneficiaries for its unfunded other benefit plans, and cash contributed to
a third party administrator of an unfunded plan, was $29.0 million (2013: $28.9 million).
104 ANNUAL REPORT 2013–2014

n o t e s t o t h e c o n s o l i d a t e d f i n a n c i a l s t a t e m e n t s
(c) defined benefit plans:
All of the Group’s defined benefit plans, except its multi-employer plans, are currently unfunded. The most recent actuarial valuation of
the retirement bonus and death benefit plans is as at March 31, 2011. A plan amendment at December 31, 2007 restricts exempt employees
from joining the retirement bonus and death benefit plans. As part of an implementation plan to assist with the transition of certain shipboard
management to excluded positions, a further plan amendment was made during the year ended March 31, 2011. This amendment allows
bargaining unit employees transferring to excluded positions to continue to be eligible for the retirement bonus, provided the transfer happened
on or before December 31, 2013. The most recent actuarial valuations of the WCB obligation, the supplemental executive retirement plan and
the Sick Bank obligation are as at March 31, 2013, March 31, 2014 and March 31, 2001, respectively.
During the year ended March 31, 2014, a gain of $0.1 million was recognized in other comprehensive income to reflect the actuarial valuation
of the residual liability at March 31, 2013 for workers’ compensation claims arising from the Workers’ Compensation Board deposit class
coverage system.
2014 2013
Other benefit plansaccrued benefit obligations
Balance, beginning of year 18,808 19,565
Current service cost 689 648
Interest cost 760 801
Benefits paid (2,018) (2,200)
Actuarial gains (104) (6)
Balance, end of year 18,135 18,808
2014 2013
Other benefit plansreconciliation of funded status of the benefit plans to the amounts
recorded in the financial statements
Fair value of plan assets – –
Accrued benefit obligation 18,135 18,808
Funded status of plans – deficit (18,135) (18,808)
Accrued benefit liability (18,135) (18,808)
Current portion of accrued employee future benefits 2,204 2,204
Accrued employee future benefits (15,931) (16,604)
2014 2013
Other benefit planselements of defined benefit costs recognized in the year
Current service cost 689 648
Interest cost 760 801
Actuarial gains (104) (6)
Defined benefit costs recognized 1,345 1,443
105BRITISH COLUMBIA FERRY SERVICES INC.

n o t e s t o t h e c o n s o l i d a t e d f i n a n c i a l s t a t e m e n t s
Significant assumptions
The significant assumptions used are as follows (weighted average):
2014 2013
accrued benefit obligation as of march 31:
Discount rate 5.1% 5.0%
Rate of compensation increase 1.7% 1.9%
Annual employee retention rate 96.2% 96.0%
Employees with eligible dependents at pre-retirement death 43.0% 43.0%
Benefit cost for years ended march 31:
Discount rate 5.1% 5.0%
Rate of compensation increase 1.7% 1.9%
Annual employee retention rate 96.2% 96.0%
Employees with eligible dependents at pre-retirement death 43.0% 43.0%
Average remaining service period of active employees (years) 7.0 7.0
(d) multi-employer plans:
The total cost recognized for the Group’s multi-employer plans is as follows:
2014 2013
Public Service Pension Plan contributions (i) 22,129 21,269
Long-term disability plan contributions 4,879 5,477
Long-term disability plan amortization of surplus (ii) – 64
Total 27,008 26,810
i) The March 31, 2011 actuarial valuation report for the Public Service Pension Plan was received by the Public Service Pension Board of
Trustees on December 6, 2011. This report indicated that the pension fund has a deficit of $275 million. Under the terms of the plan’s
joint trust agreement, plan members and employers share in any increase or decrease in contribution rates. Effective April 1, 2012
the plan trustees increased the member and employer contribution rates to the basic account from 7.78% to 8.18% of pensionable
earnings. This increase is primarily due to changes in the investment return and demographic assumptions. The contribution rates to the
inflation adjustment account decreased for members from 1.50% to 1.25% and increased for employers from 2.5% to 2.75%, effective
April 1, 2012. The next valuation, expected to be received during the fiscal year ended March 31, 2015, will be as at March 31, 2014.
ii) Contribution rates for the long-term disability plan are actuarially determined every three years as a percentage of covered payroll.
The most recent valuation, as at March 31, 2011, determined an overall fund surplus. The funding policy for this plan calls for amortization
of individual participating employer deficits and surpluses over 5 years and a 110% funding target for each participant in 5 years. As a result
the employer contribution rate was increased from 3.09% to 3.5% of covered payroll effective April 1, 2012. The next scheduled valuation,
expected to be received during the fiscal year ended March 31, 2015, will be as at March 31, 2014.
106 ANNUAL REPORT 2013–2014
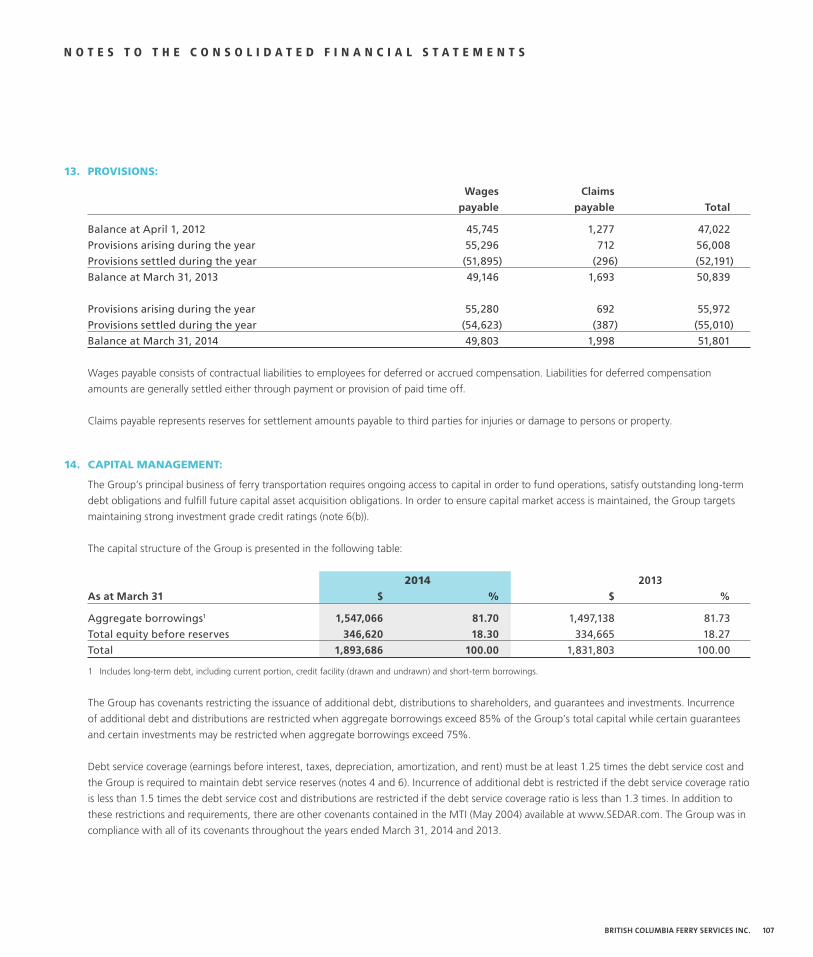
n o t e s t o t h e c o n s o l i d a t e d f i n a n c i a l s t a t e m e n t s
13. provisions:
wages claims
payable payable Total
Balance at April 1, 2012 45,745 1,277 47,022
Provisions arising during the year 55,296 712 56,008
Provisions settled during the year (51,895) (296) (52,191)
Balance at March 31, 2013 49,146 1,693 50,839
Provisions arising during the year 55,280 692 55,972
Provisions settled during the year (54,623) (387) (55,010)
Balance at March 31, 2014 49,803 1,998 51,801
Wages payable consists of contractual liabilities to employees for deferred or accrued compensation. Liabilities for deferred compensation
amounts are generally settled either through payment or provision of paid time off.
Claims payable represents reserves for settlement amounts payable to third parties for injuries or damage to persons or property.
14. Capital management:
The Group’s principal business of ferry transportation requires ongoing access to capital in order to fund operations, satisfy outstanding long-term
debt obligations and fulfill future capital asset acquisition obligations. In order to ensure capital market access is maintained, the Group targets
maintaining strong investment grade credit ratings (note 6(b)).
The capital structure of the Group is presented in the following table:
2014 2013
as at march 31 $ % $ %
Aggregate borrowings1 1,547,066 81.70 1,497,138 81.73
Total equity before reserves 346,620 18.30 334,665 18.27
Total 1,893,686 100.00 1,831,803 100.00
1 Includes long-term debt, including current portion, credit facility (drawn and undrawn) and short-term borrowings.
The Group has covenants restricting the issuance of additional debt, distributions to shareholders, and guarantees and investments. Incurrence
of additional debt and distributions are restricted when aggregate borrowings exceed 85% of the Group’s total capital while certain guarantees
and certain investments may be restricted when aggregate borrowings exceed 75%.
Debt service coverage (earnings before interest, taxes, depreciation, amortization, and rent) must be at least 1.25 times the debt service cost and
the Group is required to maintain debt service reserves (notes 4 and 6). Incurrence of additional debt is restricted if the debt service coverage ratio
is less than 1.5 times the debt service cost and distributions are restricted if the debt service coverage ratio is less than 1.3 times. In addition to
these restrictions and requirements, there are other covenants contained in the MTI (May 2004) available at www.SEDAR.com. The Group was in
compliance with all of its covenants throughout the years ended March 31, 2014 and 2013.
107BRITISH COLUMBIA FERRY SERVICES INC.

n o t e s t o t h e c o n s o l i d a t e d f i n a n c i a l s t a t e m e n t s
15. share Capital:
(a) authorized:
1,000,000 Class A voting common shares, without par value
1 Class B voting common share, without par value
80,000 Class C non-voting, 8% cumulative preferred shares, with a par value of $1,000 per share, convertible to Class A shares upon
the sale of the outstanding Class B share by the initial shareholder. Special rights attached to the Class C shares restrict the Group’s
ability to issue shares and to declare dividends.
(b) issued and outstanding:
2014 2013
number amount number amount
as at march 31 of shares $ of shares $
Class B, common 1 1 1 1
Class C, preferred 75,477 75,477 75,477 75,477
75,478 75,478
(c) dividends:
Dividends on the Class C cumulative preferred shares, if declared, are payable annually on March 31 of each year. All dividend entitlements
to date have been paid.
16. other Comprehensive (loss) inCome:
(a) continuity of reserves:
employee
future
land benefit
revaluation revaluation hedging
reserves1 reserves reserves Total
Balance at april 1, 2012 2,177 – – 2,177
Land revaluation 1,056 – – 1,056
Balance at march 31, 2013 3,233 – – 3,233
Land revaluation 12 – – 12
Actuarial gains on defined benefit
plans (note 12 (c)) – 104 – 104
Hedge losses on interest rate forward
contracts (note 6 (c)) – – (5,040) (5,040)
Balance at march 31, 2014 3,245 104 (5,040) (1,691)
1 Land revaluation reserves represent the cumulative surplus resulting from changes in fair value of land assets. Land reserve increases during the years ended March 31, 2013 and March 31, 2014, are shown above. During the year ended March 31, 2014 $0.4 million (March 31, 2013: $0.2 million) was recognized in net earnings reflecting a reduction in the fair value of land for which either a reserve had not been established or the balance in the reserve was less than the reduction in fair value.
108 ANNUAL REPORT 2013–2014
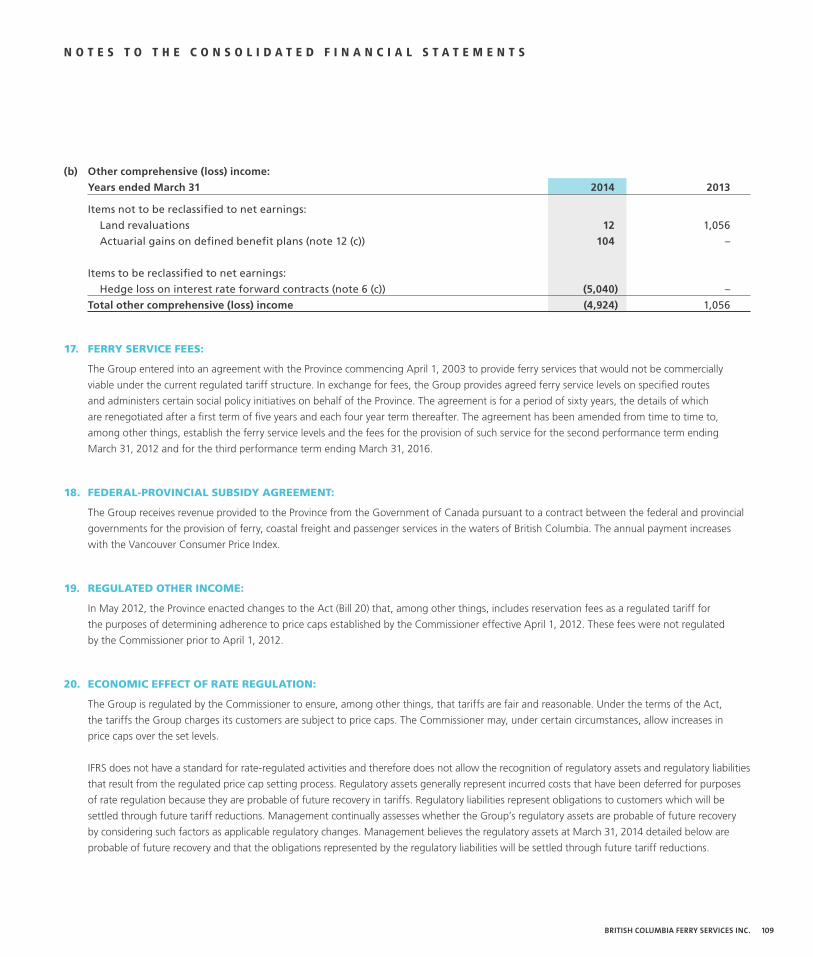
n o t e s t o t h e c o n s o l i d a t e d f i n a n c i a l s t a t e m e n t s
(b) other comprehensive (loss) income:
years ended march 31 2014 2013
Items not to be reclassified to net earnings:
Land revaluations 12 1,056
Actuarial gains on defined benefit plans (note 12 (c)) 104 –
Items to be reclassified to net earnings:
Hedge loss on interest rate forward contracts (note 6 (c)) (5,040) –
Total other comprehensive (loss) income (4,924) 1,056
17. Ferry serviCe Fees:
The Group entered into an agreement with the Province commencing April 1, 2003 to provide ferry services that would not be commercially
viable under the current regulated tariff structure. In exchange for fees, the Group provides agreed ferry service levels on specified routes
and administers certain social policy initiatives on behalf of the Province. The agreement is for a period of sixty years, the details of which
are renegotiated after a first term of five years and each four year term thereafter. The agreement has been amended from time to time to,
among other things, establish the ferry service levels and the fees for the provision of such service for the second performance term ending
March 31, 2012 and for the third performance term ending March 31, 2016.
18. Federal-provinCial subsidy agreement:
The Group receives revenue provided to the Province from the Government of Canada pursuant to a contract between the federal and provincial
governments for the provision of ferry, coastal freight and passenger services in the waters of British Columbia. The annual payment increases
with the Vancouver Consumer Price Index.
19. regulated other inCome:
In May 2012, the Province enacted changes to the Act (Bill 20) that, among other things, includes reservation fees as a regulated tariff for
the purposes of determining adherence to price caps established by the Commissioner effective April 1, 2012. These fees were not regulated
by the Commissioner prior to April 1, 2012.
20. eConomiC eFFeCt oF rate regulation:
The Group is regulated by the Commissioner to ensure, among other things, that tariffs are fair and reasonable. Under the terms of the Act,
the tariffs the Group charges its customers are subject to price caps. The Commissioner may, under certain circumstances, allow increases in
price caps over the set levels.
IFRS does not have a standard for rate-regulated activities and therefore does not allow the recognition of regulatory assets and regulatory liabilities
that result from the regulated price cap setting process. Regulatory assets generally represent incurred costs that have been deferred for purposes
of rate regulation because they are probable of future recovery in tariffs. Regulatory liabilities represent obligations to customers which will be
settled through future tariff reductions. Management continually assesses whether the Group’s regulatory assets are probable of future recovery
by considering such factors as applicable regulatory changes. Management believes the regulatory assets at March 31, 2014 detailed below are
probable of future recovery and that the obligations represented by the regulatory liabilities will be settled through future tariff reductions.
109BRITISH COLUMBIA FERRY SERVICES INC.

n o t e s t o t h e c o n s o l i d a t e d f i n a n c i a l s t a t e m e n t s
If the Group was permitted under IFRS to recognize the effects of rate regulation, the following regulatory assets and regulatory liabilities would
be shown on the consolidated statement of financial position:
as at march 31 2014 2013
regulatory accounts
Deferred fuel costs (a):
Balance – beginning of year (1,415) 1,256
Fuel costs deferred 14,521 11,266
Surcharges collected (2,690) (11,469)
Fuel price risk recoveries from the Province (1,675) (1,023)
Other payments from the Province (1,396) (1,449)
Interest receivable (payable) – 4
Tariffs in excess of price cap (b) (1,195) –
Balance – end of year 6,150 (1,415)
Performance term submission costs (c) 163 245
Total of regulatory accounts 6,313 (1,170)
Total regulatory assets (liabilities) 6,313 (1,170)
current regulatory assets 82 82
Total long term regulatory assets (liabilities) 6,231 (1,252)
(a) deferred fuel costs:
As prescribed by regulatory order, the Group defers differences between actual fuel costs and approved fuel costs which were used to develop
the regulated price caps. The difference between the approved fuel costs and the actual fuel costs (including fuel hedge gains and losses) is
deferred for settlement in future tariffs. Also prescribed by regulatory order, the Group collects fuel surcharges or provides fuel rebates from time
to time which are applied against deferred fuel cost account balances and has included interest in the amount to be recovered from or returned
to customers.
During the year ended March 31, 2014, the Province agreed to pay $1.4 million, to be applied against the balance of deferred fuel costs
(2013: $1.5 million).
(b) Tariffs in excess of price cap:
The Act contains provisions which ensure that if tariffs charged by the Group exceed established price caps, the excess amounts collected will
be returned to customers through future tariffs. At March 31, 2014, tariffs charged to customers exceeded the price cap by $1.2 million.
In accordance with the Commissioner’s Memorandum 45, this $1.2 million has been applied to reduce the deferred fuel costs account balance.
Tariffs charged to customers on all route groups were below established price caps at March 31, 2013.
110 ANNUAL REPORT 2013–2014
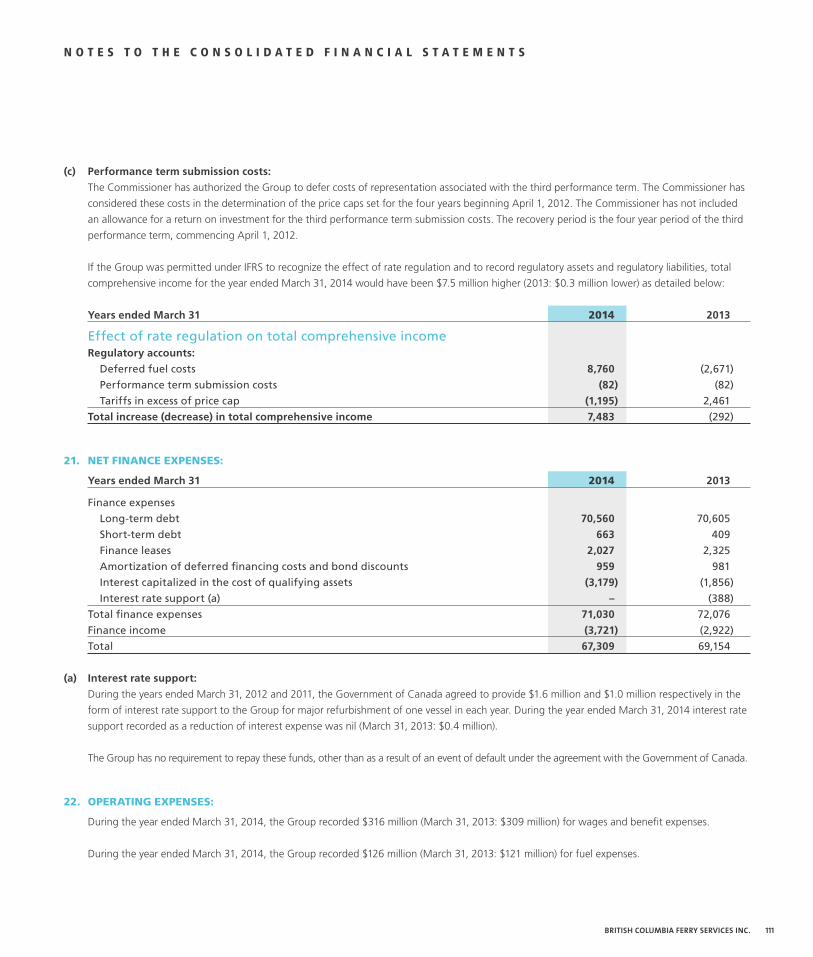
n o t e s t o t h e c o n s o l i d a t e d f i n a n c i a l s t a t e m e n t s
(c) Performance term submission costs:
The Commissioner has authorized the Group to defer costs of representation associated with the third performance term. The Commissioner has
considered these costs in the determination of the price caps set for the four years beginning April 1, 2012. The Commissioner has not included
an allowance for a return on investment for the third performance term submission costs. The recovery period is the four year period of the third
performance term, commencing April 1, 2012.
If the Group was permitted under IFRS to recognize the effect of rate regulation and to record regulatory assets and regulatory liabilities, total
comprehensive income for the year ended March 31, 2014 would have been $7.5 million higher (2013: $0.3 million lower) as detailed below:
years ended march 31 2014 2013
Effect of rate regulation on total comprehensive incomeregulatory accounts:
Deferred fuel costs 8,760 (2,671)
Performance term submission costs (82) (82)
Tariffs in excess of price cap (1,195) 2,461
Total increase (decrease) in total comprehensive income 7,483 (292)
21. net FinanCe expenses:
years ended march 31 2014 2013
Finance expenses
Long-term debt 70,560 70,605
Short-term debt 663 409
Finance leases 2,027 2,325
Amortization of deferred financing costs and bond discounts 959 981
Interest capitalized in the cost of qualifying assets (3,179) (1,856)
Interest rate support (a) – (388)
Total finance expenses 71,030 72,076
Finance income (3,721) (2,922)
Total 67,309 69,154
(a) interest rate support:
During the years ended March 31, 2012 and 2011, the Government of Canada agreed to provide $1.6 million and $1.0 million respectively in the
form of interest rate support to the Group for major refurbishment of one vessel in each year. During the year ended March 31, 2014 interest rate
support recorded as a reduction of interest expense was nil (March 31, 2013: $0.4 million).
The Group has no requirement to repay these funds, other than as a result of an event of default under the agreement with the Government of Canada.
22. operating expenses:
During the year ended March 31, 2014, the Group recorded $316 million (March 31, 2013: $309 million) for wages and benefit expenses.
During the year ended March 31, 2014, the Group recorded $126 million (March 31, 2013: $121 million) for fuel expenses.
111BRITISH COLUMBIA FERRY SERVICES INC.

n o t e s t o t h e c o n s o l i d a t e d f i n a n c i a l s t a t e m e n t s
23. related party transaCtions:
(a) management compensation:
The compensation of the Group’s directors and key executive officers during the year is as follows:
years ended march 31 2014 2013
Short-term benefits 1,822 1,731
Post-employment benefits 341 290
Total 2,163 2,021
(b) B.c. ferry authority:
In accordance with the Act, the Group is responsible for paying any expenses that are incurred by the Authority, without charge. During the
year ended March 31, 2014, the Group paid $175, 218 (March 31, 2013: $165,265) of such expenses.
The Province owns the Group’s 75,477 non-voting preferred shares, but has no voting interest in either the Group or the Authority.
24. other Commitments:
The Group has entered into operating leases for certain building spaces, land and equipment. Lease payments charged to expense during the
year ended March 31, 2014 were $0.9 million (2013: $1.1 million).
Future minimum lease payments are as follows:
Less than one year 667
Between one and five years 1,138
More than five years 18
Total 1,823
25. Contingent liabilities:
The Group, in conducting its usual business activities, is involved in various legal proceedings and litigation, the outcome of which is
indeterminable. It is the Group’s policy to carry adequate insurance to minimize the financial risk associated with such matters. Management is
of the opinion that the aggregate net liability, if any, of these proceedings and litigation would not be significant to the Group. Any additional
future costs or recoveries which differ from the accrued amounts will be recognized in net earnings as determined.
26. subsequent event:
On April 28, 2014, the Group issued $200 million of senior secured bonds. The Series 14-1 bonds bear interest at 4.289% per annum, payable
semi-annually and will mature April 28, 2044. A debt service reserve for these bonds has been established in the amount of $2.3 million.
The net proceeds from the sale of these bonds were, together with additional cash on hand, used to repay the $250 million Series 04-1 bonds,
which matured May 27, 2014 and to fund the related debt service reserve.
112 ANNUAL REPORT 2013–2014

BOARD OF DIRECTORS During the fiscal year ended March 31, 2014, the board was
composed of the following directors:
Donald P. Hayes
Chair
Jane M. Bird
Holly A. Haston-Grant [ceased to be a director effective June 27, 2013]
John A. Horning
Guy D. Johnson [ceased to be a director effective November 22, 2013]
Brian G. Kenning
Gordon R. Larkin
Maureen V. Macarenko
P. Geoffrey Plant, QC
Wayne H. Stoilen [ceased to be a director effective June 27, 2013]
Graham M. Wilson
SENIOR OFFICERS OF THE COMPANY (effective April 1, 2013)
Michael J. Corrigan
President & Chief Executive Officer
Robert P. Clarke, CPA, CGA
Executive Vice President & Chief Financial Officer
Glen N. Schwartz
Executive Vice President, Human Resources &
Corporate Development
OFFICERS OF THE COMPANY (effective April 1, 2013)
Janet E. Carson
Vice President, Marketing & Travel Services
M. Alana Gallagher
Treasurer
Cynthia M. Lukaitis
Vice President & Corporate Secretary
Captain D.W. James Marshall
Vice President, Fleet Operations
Corrine E. Storey
Vice President, Customer Services
Pierre Vorster
Vice President & Chief Information Officer
Mark C. Wilson
Vice President, Engineering
C O R P O R A T E D I R E C T O R YB R I T I S H C O L U M B I A F E R R Y S E R V I C E S I N C .
113BRITISH COLUMBIA FERRY SERVICES INC.
B R I T I S H C O L U M B I A F E R RY S E RV I C E S I N C .5 0 0 – 1 3 2 1 B L A N S H A R D S T. , V I C TO R I AB R I T I S H C O L U M B I A V 8 W 0 B 7
W W W. B C F E R R I E S. C O MW W W. B C F E R RYAU T H O R I T Y. C O M