BCA South East Asia Seminar 2015| Singapore, 2 July … South East Asia Seminar 2015| Singapore, 2...
28
invest © 2014 by Indonesian Investment Coordinating Board. All rights reserved Ricky Kusmayadi Director BCA South East Asia Seminar 2015| Singapore, 2 July 2015 INDONESIA’S CONSTRUCTION 2015 ; THE NEW ADMINISTRATION INDONESIA INVESTMENT PROMOTION CENTRE - SINGAPORE
Transcript of BCA South East Asia Seminar 2015| Singapore, 2 July … South East Asia Seminar 2015| Singapore, 2...
INDONESIA INVESTMENT COORDINATING BOARD
invest
© 2014 by Indonesian Investment Coordinating Board. All rights reserved
Ricky KusmayadiDirector
BCA South East Asia Seminar 2015| Singapore, 2 July 2015
INDONESIA’S CONSTRUCTION 2015 ; THE NEW ADMINISTRATION
INDONESIA INVESTMENT PROMOTION CENTRE - SINGAPORE
The Investment Coordinating Board of the Republic of Indonesia
2
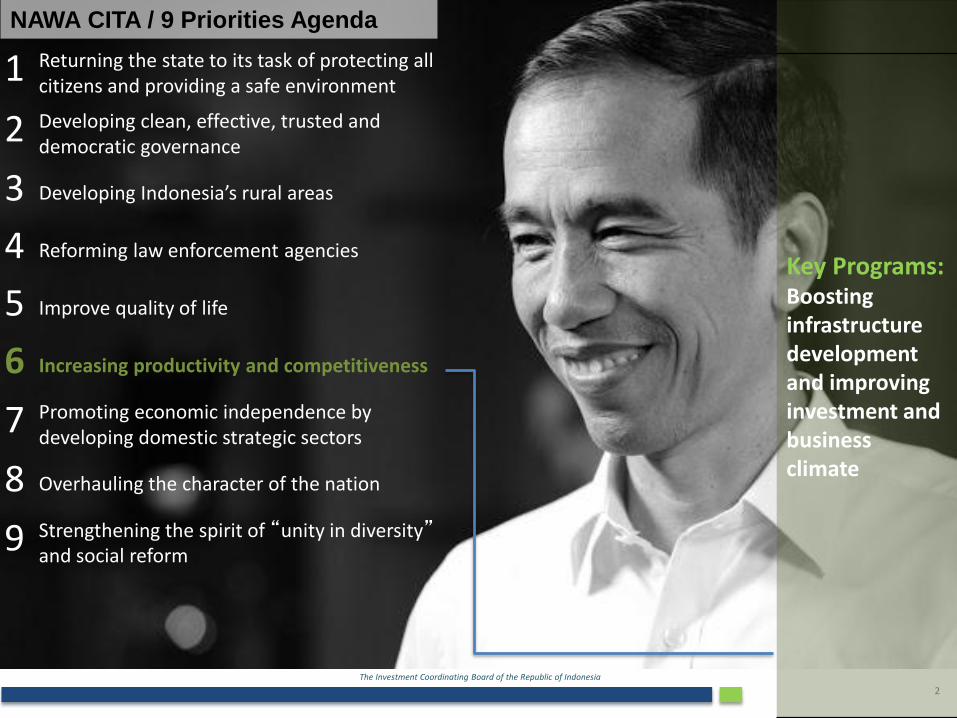
1 Returning the state to its task of protecting all citizens and providing a safe environment
2 Developing clean, effective, trusted and democratic governance
3 Developing Indonesia’s rural areas
4 Reforming law enforcement agencies
5 Improve quality of life
6 Increasing productivity and competitiveness
7 Promoting economic independence by developing domestic strategic sectors
8 Overhauling the character of the nation
9 Strengthening the spirit of “unity in diversity”and social reform
Key Programs:Boosting infrastructure development and improving investment and business climate
NAWA CITA / 9 Priorities Agenda

The Investment Coordinating Board of the Republic of Indonesia
3
Indonesia remains on the top five destinations for the first time.
(Results from UNCTAD’s World Investment Prospects Survey 2013-2015 which polls TNC executives on their investment plans)
Top-4 Most Prospective Host Economies for 2013-2015
United Nations Conference on Trade and
Development
TNC’s top 10 prospective host economies for 2013-2015(Percentage of respondents selecting economy as a top destination
Indonesia’s Economic and Investment Performances

The Investment Coordinating Board of the Republic of Indonesia
4Source: The Schroders Global Invetsment Trends Report 2015
Confidence Heat Map by Country -Desire to Invest

The Investment Coordinating Board of the Republic of Indonesia
5
Investor Expectation to See Strongest Growth in 2015
Source: The Schroders Global Invetsment Trends Report 2014

The Investment Coordinating Board of the Republic of Indonesia
6
Data for companies investing in Indonesia in the construction cluster between January 2010 and April 2015.
Year Projects Capex Avg Capex Jobs Created Avg Jobs Companies
2015 2 451.0 225.5 2,712 1,356 2
2014 15 2,505.5 167.0 7,303 486 10
2013 7 794.2 113.5 3,145 449 7
2012 8 2,359.3 294.9 9,516 1,189 4
2011 7 1,297.6 185.4 2,004 286 4
2010 5 797.6 159.5 3,246 649 5
Total 44 8,205.2 186.5 27,926 634 28
Notes:
1) © fDi Intelligence, from the Financial Times Ltd 2015. Data subject to terms and conditions of use
2) All Capex figures shown in the table are in USD - United States Dollar millions
3) Capex data includes estimated values Financial Times Ltd takes no responsibility for the accuracy or otherwise of this data.
4) Jobs data includes estimated values Financial Times Ltd takes no responsibility for the accuracy or otherwise of this data.
The Investment Coordinating Board of the Republic of Indonesia
7
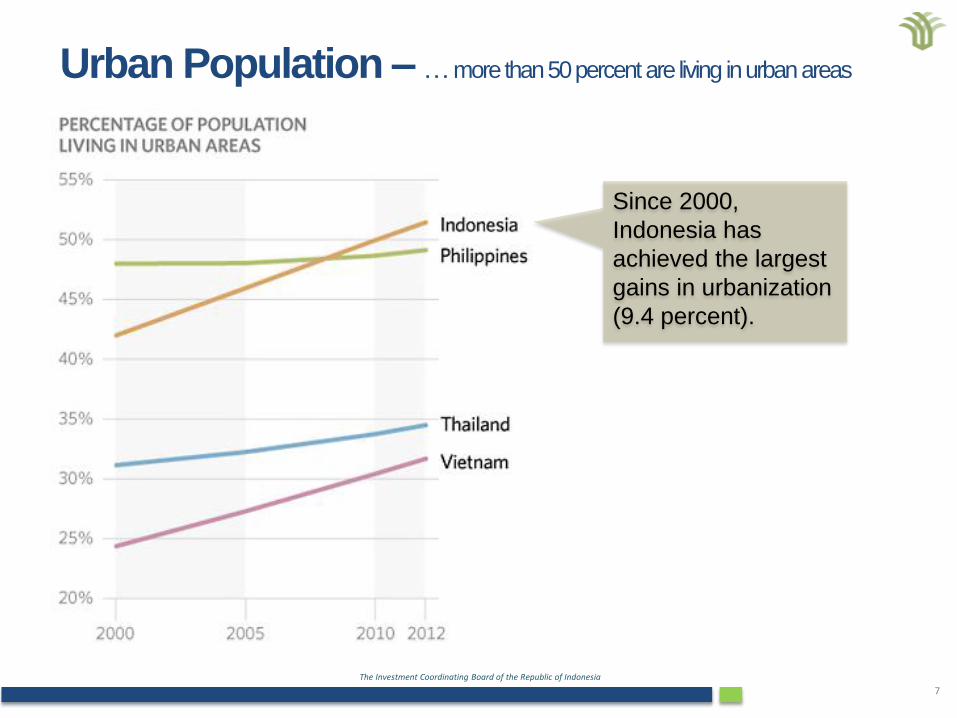
Urban Population –… more than 50 percent are living in urban areas
Since 2000,
Indonesia has
achieved the largest
gains in urbanization
(9.4 percent).

The Investment Coordinating Board of the Republic of Indonesia
8
Rank CountryInvestment
ValueProject
1 Singapore 5,832,129.3 1,302
2 Japan 2,705,131.3 1,009
3 Malaysia 1,776,320.2 448
4 Netherland 1,726,338.0 181
5 UK 1,587,955.7 182
6 US 1,299,543.7 178
7 South Korea 1,126,618.7 1,054
8 People Rep. of China 800,029.3 501
9 Hong Kong, PRC 657,256.6 196
10 Australia 647,273.5 226
Total (all countries) 18,158,596.3 5277
Indonesia’s Investment Performance
Top-10 Foreign Direct Investors (FDI) 2014Based on Investment Value (USD Million) Excl. oil, gas, and financial sectors
Source: BKPM, 2014
0.0
1,000,000.0
2,000,000.0
3,000,000.0
4,000,000.0
5,000,000.0
6,000,000.0
7,000,000.0
2010 2011 2012 2013 2014
Singapore
Japan
Malaysia
Netherland
UK
32.12%
14.90%
9.78%
9.51%
8.74%

The Investment Coordinating Board of the Republic of Indonesia
9
Top Five Foreign Direct Investment by Country (in thousand USD) Q1 2015
1,234,596.3
1,207,604.3
633,975.0
357,322.5
292,062.0
Singapore
Japan
South Korea
UK
USA

The Investment Coordinating Board of the Republic of Indonesia
10
Credit Growth in Construction
2012; 79,83 billion USD *2013; 96,36 billion USD *2014; 117,76 billion USD *2015 ; 33,48 billion USD *
* based on current currency
Credit Channeling of Commercial/Private Banks (Billion Rp)
327 billion USDCredit Channelling ofCommercial Banks to Non BankThird Party Based on BusinessSector and non Business Sector ofCredit Channelling Beneficiary
Source: Bank Indonesia
0
20,000
40,000
60,000
80,000
100,000
120,000
140,000
160,000
180,000
Feb
Mar
Ap
r
May Jun
Jul
Au
g
Sep
Oct
No
v
De
c
Jan
Feb
Mar
Ap
r
May Ju
n
Jul
Au
g
Sep
Oct
No
v
De
c
Jan
Feb
Mar
Ap
r
May
Jun
e
July
Au
g
Sep
Oct
No
v
De
c
Jan
Feb
Mar
2012 2013 2014 2015
The Investment Coordinating Board of the Republic of Indonesia
11
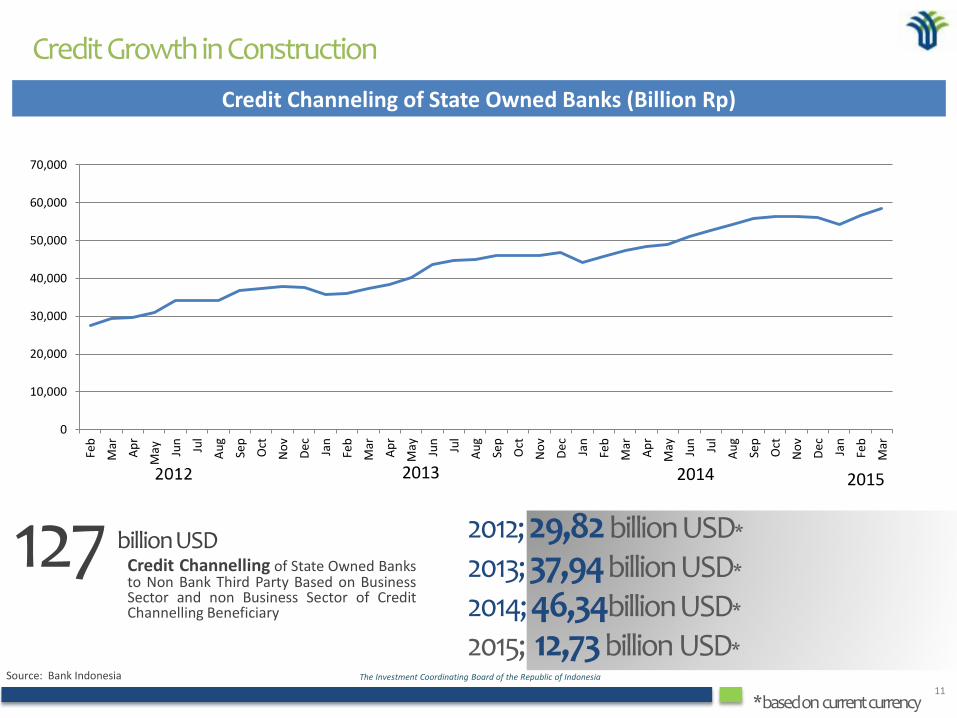
Credit Growth in Construction
2012; 29,82 billion USD*
2013; 37,94billion USD*
2014; 46,34billion USD*
2015; 12,73 billion USD*
Credit Channeling of State Owned Banks (Billion Rp)
127 billion USDCredit Channelling of State Owned Banksto Non Bank Third Party Based on BusinessSector and non Business Sector of CreditChannelling Beneficiary
Source: Bank Indonesia
0
10,000
20,000
30,000
40,000
50,000
60,000
70,000
Feb
Mar
Ap
r
May Ju
n
Jul
Au
g
Sep
Oct
No
v
De
c
Jan
Feb
Mar
Ap
r
May Jun
Jul
Au
g
Sep
Oct
No
v
De
c
Jan
Feb
Mar
Ap
r
May Jun
Jul
Au
g
Sep
Oct
No
v
De
c
Jan
Feb
Mar
2013 2014 2015
* based on current currency

The Investment Coordinating Board of the Republic of Indonesia
12
Credit Growth in Construction
2012; 34,28billion USD*
2013; 38,36 billion USD*
2014; 46,83billion USD*
2015; 14,73 billion USD*
Credit Channeling of Foreign Exchange Commercial Banks (Billion Rp)
134 billion USDCredit Channelling of Foreign ExchangeCommercial Banks to Non Bank Third PartyBased on Business Sector and non BusinessSector of Credit Channelling Beneficiary
Source: Bank Indonesia
0
10,000
20,000
30,000
40,000
50,000
60,000
70,000
80,000
Jan
Feb
Mar
Ap
r
May Ju
n
Jul
Au
g
Sep
Oct
No
v
De
c
Jan
Feb
Mar
Ap
r
May Jun
Jul
Au
g
Sep
Oct
No
v
De
c
Jan
Feb
Mar
Ap
r
May Jun
Jul
Au
g
Sep
Oct
No
v
De
c
Jan
Feb
Mar
2013 2014 2015
* based on current currency

The Investment Coordinating Board of the Republic of Indonesia
13
Credit Growth in Construction
2012; 1,48billion USD*
2013; 1,9 7 billion USD*
2014; 2,82billion USD*
2015; 950million USD*
Credit Channeling of Non-Foreign Exchange Commercial Banks (Billion Rp)
7 billion USDCredit Channelling of Non-Foreign ExchangeCommercial Banks to Non Bank Third Party Based onBusiness Sector and non Business Sector of CreditChannelling Beneficiary
Source: Bank Indonesia
* based on current currency
0
500
1,000
1,500
2,000
2,500
3,000
3,500
4,000
4,500
5,000
Jan
Feb
Mar
Ap
r
May Ju
n
Jul
Au
g
Sep
Oct
No
v
De
c
Jan
Feb
Mar
Ap
r
May Jun
Jul
Au
g
Sep
Oct
No
v
De
c
Jan
Feb
Mar
Ap
r
May Jun
Jul
Au
g
Sep
Oct
No
v
De
c
Jan
Feb
Mar
2013 2014 2015

The Investment Coordinating Board of the Republic of Indonesia
14
Credit Growth in Construction
2012; 10,03billion USD*
2013; 12,12 billion USD*
2014 ; 14,6 billion USD*
2015 ; 1,1 billion USD*
Credit Channeling of Regional Development Banks (Billion Rp)
38 billion USDCredit Channelling of RegionalDevelopment Banks to Non Bank Third PartyBased on Business Sector and non BusinessSector of Credit Channelling Beneficiary
Source: Bank Indonesia
* based on current currency
0
5,000
10,000
15,000
20,000
25,000
Jan
Feb
Mar
Ap
r
May Ju
n
Jul
Au
g
Sep
Oct
No
v
De
c
Jan
Feb
Mar
Ap
r
May Jun
Jul
Au
g
Sep
Oct
No
v
De
c
Jan
Feb
Mar
Ap
r
May Jun
Jul
Au
g
Sep
Oct
No
v
De
c
Jan
Feb
Mar
2013 2014 2015

The Investment Coordinating Board of the Republic of Indonesia
15
Credit Growth in Construction
2012 ; 2,67billion USD*
2013 ; 3,53 billion USD*
2014 ; 3,0 billion USD*
2015 ; 570 million USD*
Credit Channeling of Join Venture Banks (Billion Rp)
10 billion USDCredit Channelling of Regional DevelopmentBanks to Non Bank Third Party Based on BusinessSector and non Business Sector of CreditChannelling Beneficiary
Source: Bank Indonesia
0
500
1,000
1,500
2,000
2,500
3,000
3,500
4,000
4,500
5,000
Jan
Feb
Mar
Ap
r
May Ju
n
Jul
Au
g
Sep
Oct
No
v
De
c
Jan
Feb
Mar
Ap
r
May Jun
Jul
Au
g
Sep
Oct
No
v
De
c
Jan
Feb
Mar
Ap
r
May Jun
Jul
Au
g
Sep
Oct
No
v
De
c
Jan
Feb
Mar
* based on current currency
2013 2014 2015
The Investment Coordinating Board of the Republic of Indonesia
16
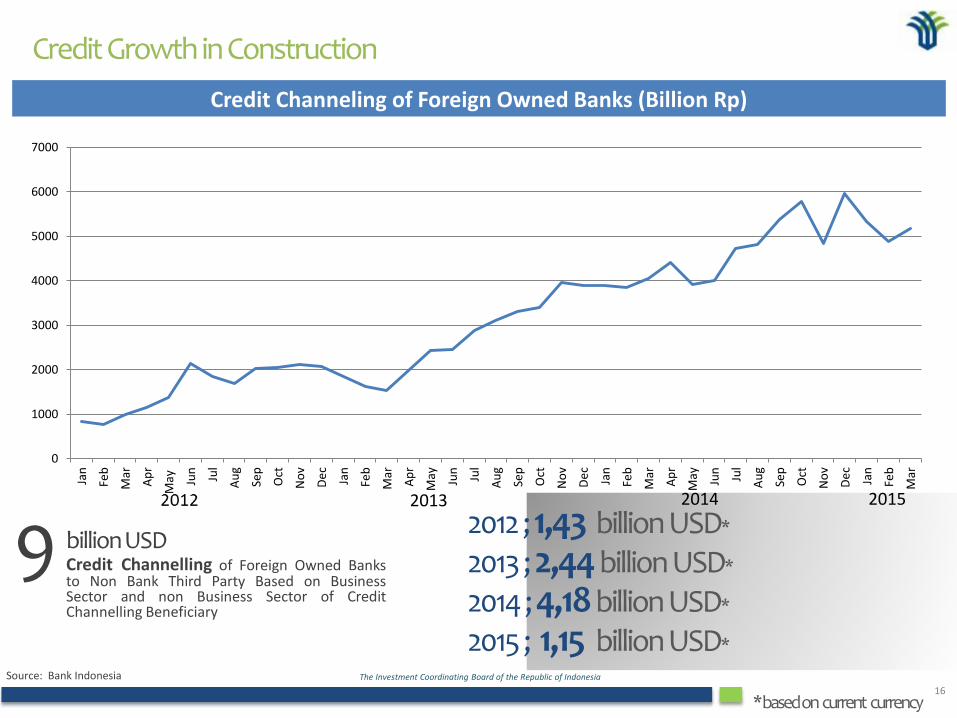
Credit Growth in Construction
2012 ; 1,43 billion USD*
2013 ; 2,44 billion USD*
2014 ; 4,18 billion USD*
2015 ; 1,15 billion USD*
Credit Channeling of Foreign Owned Banks (Billion Rp)
9 billion USDCredit Channelling of Foreign Owned Banksto Non Bank Third Party Based on BusinessSector and non Business Sector of CreditChannelling Beneficiary
Source: Bank Indonesia
* based on current currency
0
1000
2000
3000
4000
5000
6000
7000
Jan
Feb
Mar
Ap
r
May Ju
n
Jul
Au
g
Sep
Oct
No
v
De
c
Jan
Feb
Mar
Ap
r
May Jun
Jul
Au
g
Sep
Oct
No
v
De
c
Jan
Feb
Mar
Ap
r
May Jun
Jul
Au
g
Sep
Oct
No
v
De
c
Jan
Feb
Mar
2013 2014 2015
The Investment Coordinating Board of the Republic of Indonesia
17
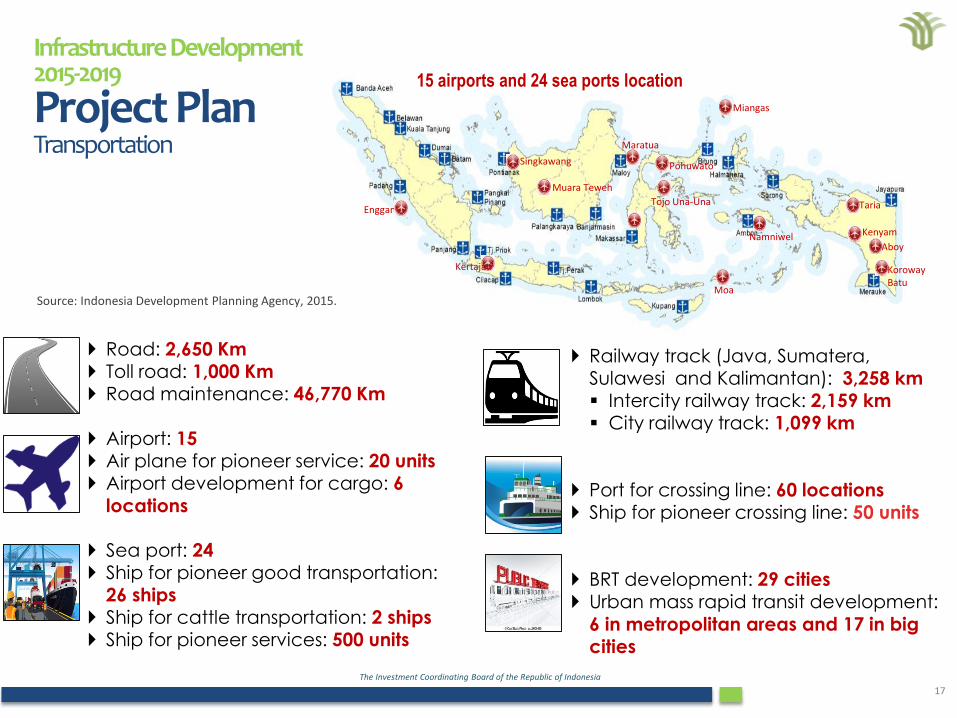
Transport Infrastructure Development (2015-2019)
Enggano
Kertajati
Singkawang
Muara Teweh
Miangas
Maratua
Tojo Una-Una
Pohuwato
Moa
Namniwel
Taria
Kenyam
Aboy
KorowayBatu
Road: 2,650 Km Toll road: 1,000 Km Road maintenance: 46,770 Km
Airport: 15 Air plane for pioneer service: 20 units Airport development for cargo: 6
locations
Sea port: 24 Ship for pioneer good transportation:
26 ships Ship for cattle transportation: 2 ships Ship for pioneer services: 500 units
Railway track (Java, Sumatera, Sulawesi and Kalimantan): 3,258 km Intercity railway track: 2,159 km City railway track: 1,099 km
Port for crossing line: 60 locations Ship for pioneer crossing line: 50 units
BRT development: 29 cities Urban mass rapid transit development:
6 in metropolitan areas and 17 in big cities
15 airports and 24 sea ports location
Infrastructure Development 2015-2019
Project PlanTransportation
Source: Indonesia Development Planning Agency, 2015.

The Investment Coordinating Board of the Republic of Indonesia
18
Dam: 49 dams and 33 PLTA Building/improving irrigation network: 1
million Ha Rehabilitation of irrigation network: 3
million Ha
Oil refinary: 2 units (2x300,000 barrel) Floating storage regasification
unit (FSRU): 5 locations (West Java,
Jakarta, Central Java, East Java, North and Lampung)
Urban household gas network: 90
thousand houshehold network Natural gas fueling station: 75 units Electrification ratio: 96.6% Electricity generation: 35,000 MW Natural gas: 600,000 of fishermen
Broadband coverage: 100%
urban/rural E-government index: 3.4 (scale 4,0) E-procurement, e-health, e-education
and e-logistics cs development
Social rented housing: 5,257 twin blocks
(515,711 households) Subsidy of social housing: 5.5 million
households Alleviation of slum areas: 37,407 Ha Credit facility for low income household:
2.5 million households
Development of urban clean water coverage: 21.4 million households
(268,680 litre/second) Development of rural clean water
coverage: 11.1 million household
(22,647 rurals)
Development community-based waste water treatment: 227 urban/rural
Development centered-based waste water treatment: 430 urban/rural
Development sanitary landfill for solid waste disposal facilities: 341 urban/rural
Development 3R facilities: 294
urban/rural Reduction of watershed in urban areas:
22,500 Ha
Infrastructure Development 2015-2019
Project PlanSource: Indonesia Development Planning Agency, 2015.
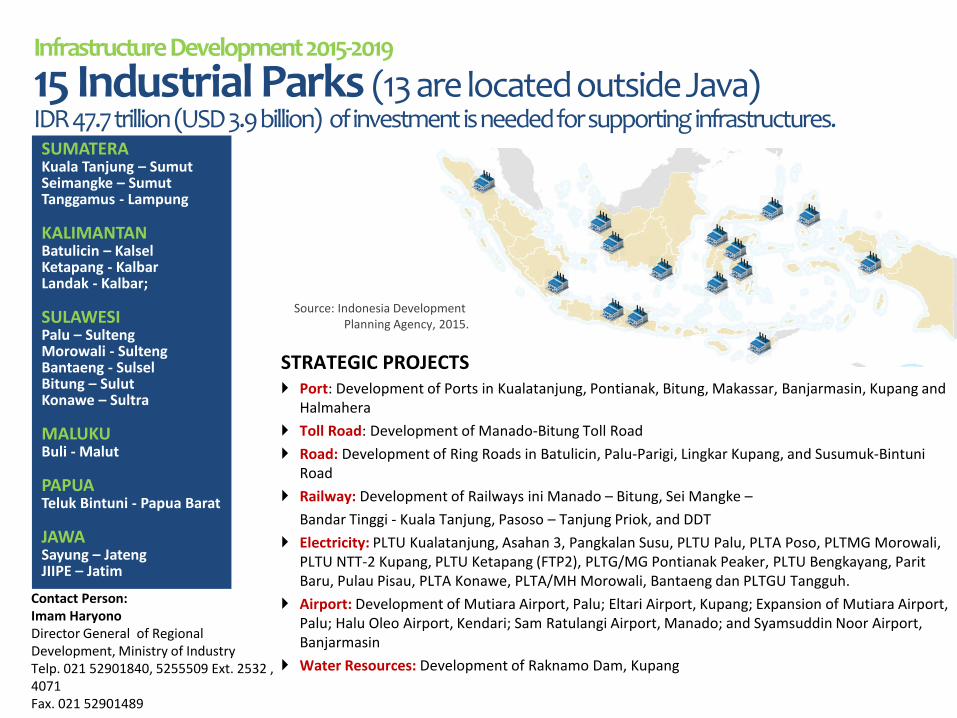
STRATEGIC PROJECTS Port: Development of Ports in Kualatanjung, Pontianak, Bitung, Makassar, Banjarmasin, Kupang and
Halmahera
Toll Road: Development of Manado-Bitung Toll Road
Road: Development of Ring Roads in Batulicin, Palu-Parigi, Lingkar Kupang, and Susumuk-Bintuni Road
Railway: Development of Railways ini Manado – Bitung, Sei Mangke –
Bandar Tinggi - Kuala Tanjung, Pasoso – Tanjung Priok, and DDT
Electricity: PLTU Kualatanjung, Asahan 3, Pangkalan Susu, PLTU Palu, PLTA Poso, PLTMG Morowali, PLTU NTT-2 Kupang, PLTU Ketapang (FTP2), PLTG/MG Pontianak Peaker, PLTU Bengkayang, ParitBaru, Pulau Pisau, PLTA Konawe, PLTA/MH Morowali, Bantaeng dan PLTGU Tangguh.
Airport: Development of Mutiara Airport, Palu; Eltari Airport, Kupang; Expansion of Mutiara Airport, Palu; Halu Oleo Airport, Kendari; Sam Ratulangi Airport, Manado; and Syamsuddin Noor Airport, Banjarmasin
Water Resources: Development of Raknamo Dam, Kupang
Infrastructure Development 2015-2019
15 Industrial Parks (13 are located outside Java)IDR 47.7 trillion (USD 3.9 billion) of investment is needed for supporting infrastructures. SUMATERAKuala Tanjung – SumutSeimangke – SumutTanggamus - Lampung
KALIMANTANBatulicin – KalselKetapang - KalbarLandak - Kalbar;
SULAWESIPalu – SultengMorowali - SultengBantaeng - SulselBitung – SulutKonawe – Sultra
MALUKUBuli - Malut
PAPUATeluk Bintuni - Papua Barat
JAWASayung – JatengJIIPE – Jatim
Source: Indonesia Development Planning Agency, 2015.
Contact Person: Imam HaryonoDirector General of Regional Development, Ministry of IndustryTelp. 021 52901840, 5255509 Ext. 2532 , 4071Fax. 021 52901489

The Investment Coordinating Board of the Republic of Indonesia
20
Priority Business Fields For Investment: Indonesia Sea Toll Programs(24 Seaport, consist of 5 hub ports and 19 feeder ports)
MARITIME LOGISTIC SECTOR REFORM TO SUPPORT “SEA TOLL” PROGRAM:1. Port sector reform2. Shipping sector reform3. Dock yard sector reform
4. Navigation Aid sector reform5. Logistic sector reform6. Maritime education sector reform
Source: Bappenas, 2015
Contact Person: Muhammad TohirDeputy Director of Port DevelopmentMinistry of Transportation Republic of IndonesiaMobile phone: +62818 955560Email: [email protected]

The Investment Coordinating Board of the Republic of Indonesia
21
RENCANA PEMBANGUNAN BANDAR UDARA 2015-2019
Enggano
Kertajati
Singkawang
Moa
Muara Teweh
Maratua
Tojo Una-Una
Pohuwato
Miangas
Taria
Kenyam
Koroway Batu
Aboy
Namniwel
Construction and Development of Airports and Airplanes• Construction of 15 new Airports• Procurement of 20 new Exploration planes• Development of Airports for Cargo services in 6 locations
Makassar
Sumber: Bappenas, 2014
Contact Person: Agustono Soetasman
Directorate of Airport TransportationMinistry of Transportation Republic of IndonesiaMobile phone: +6285215774437Email: [email protected]

The Investment Coordinating Board of the Republic of Indonesia
22
2015 Market Sounding For Infrastructure Projects
No. PROJECTS CONTRACTING AGENCIESValue
(US$ million)*
1Soekarno – Hatta International Airport – Jakarta Railways, Banten – DKI **
Ministry of Transportation 2,570
2 Tanjung Enim-tanjung Api-api Coal Railway, South Sumatera Ministry of Transportation n/a
3Bogor & Depok Solid Waste Management and Final Disposal, West Java**
BPSR West Java 40
4 Pondok Gede Water Supply, Bekasi, West Java
National Supporting Agency for
Water Supply System
Development (BPPSPAM)
20
5 Pekanbaru Water Supply, RiauProvincial Government
Planning Agency Riaun/a
6 West Semarang Water Supply
National Supporting Agency for
Water Supply System
Development (BPPSPAM)
20
Note:*Estimation. **PQ is scheduled on 1st semester of 2015.

Indonesia Investment Coordinating Board
Soekarno – Hatta International Airport – Jakarta Railways Project
PROJECT TITLE
Soekarno-Hatta International Airport – Jakarta Railway Project
PROJECT LOCATION
DKI Jakarta and Banten Province
CONTRACTING AGENCY
Ministry of Transportation
PROJECT BACKGROUND
Currently, Jakarta population hasexceeded 10 million people and only oneaccess to the airport via the toll road.With an annual total of 51,5 millionpassengers and annual increase of 15%,it caused a need of alternativetransportation in order to respondtoward the tremendeous growth.
SCOPE OF WORK
• Design and construct the railinfrastructure, and procure the rollingstock
• Provide substantial private finance forthe initial costs
• Operate and maintain theinfrastructure and rolling stock
• Collect fare revenue and other income
PPP MODALITY
BOT (to be decided)
Estimated construction cost: US$ 2,048.2million
INVESTMENT ESTIMATED COST
TENTATIVE SCHEDULE
Finalization of Outline Business Case andProject Readiness (2013)
Final Business Case, TenderDocument, Pre-Qualification (Q1 2015)
Bidding and Evaluation (Q2 2015)
Negotiation with Preferred Bidder(Q2 2015)
Contract Award (Q2 2015)
Director of Railways Traffic and TransportationMinistry of TransportationJl. Medan Merdeka Barat No.8 , Gedung Karta lantai 11, Jakarta 10110 IndonesiaPhone: +62 21 3506526 Fax : +62 21 3506526 Email : [email protected]
CONTACT

Indonesia Investment Coordinating Board
Solid Waste Treatment and Final Disposal – Bogor & Depok, West Java
PROJECT TITLE
Solid Waste Treatment & Final Disposal – Bogor & Depok, West Java Province
PROJECT LOCATION
Bogor and Depok, West Java Province
CONTRACTING AGENCY
West Java Provincial Government
PROJECT BACKGROUND
The concept of this project is to operate asanitary landfill site which will facilitateefficient disposal of household, andcommercial waste from the district ofBogor and the cities of Depok and Bogorin final disposal site.
The final disposal site should incorporatewaste sorting, recycling and orcomposting facilities, it may alsoincorporate methane capture for flaringor secondary power generation.
SCOPE OF WORK
• Operational hours: 8 hours/day, 365 days/year• Operational capacity: 1000 ton/day• Refuse derived fuel with capacity of 1000 ton consist of
3 modules• Output target:
- Compost 45.4 ton per day- RDF 408,6 ton per day
TENTATIVE SCHEDULE
Finalization of FinalBusiness Case (H2 2013)
Pre Qualification (H1 2015)
Bidding & Evaluation (H1 2015)
Negotiation (H2 2015)
Estimated Project Value US$ 40 Million
INVESTMENT ESTIMATED COST
Contract Award (H1 2016)
CONTACT
Head of BPSR (Balai Pengelolaan SampahRegional) West Java ProvinceJl. Kawaluyaan Indah No.4 Bandung 40286,West Java INDONESIATlp : +62 22 7332078
PPP MODALITY
BOT (Build – Operate – Transfer) with 20 years of concession period)
Indonesia Investment Coordinating Board
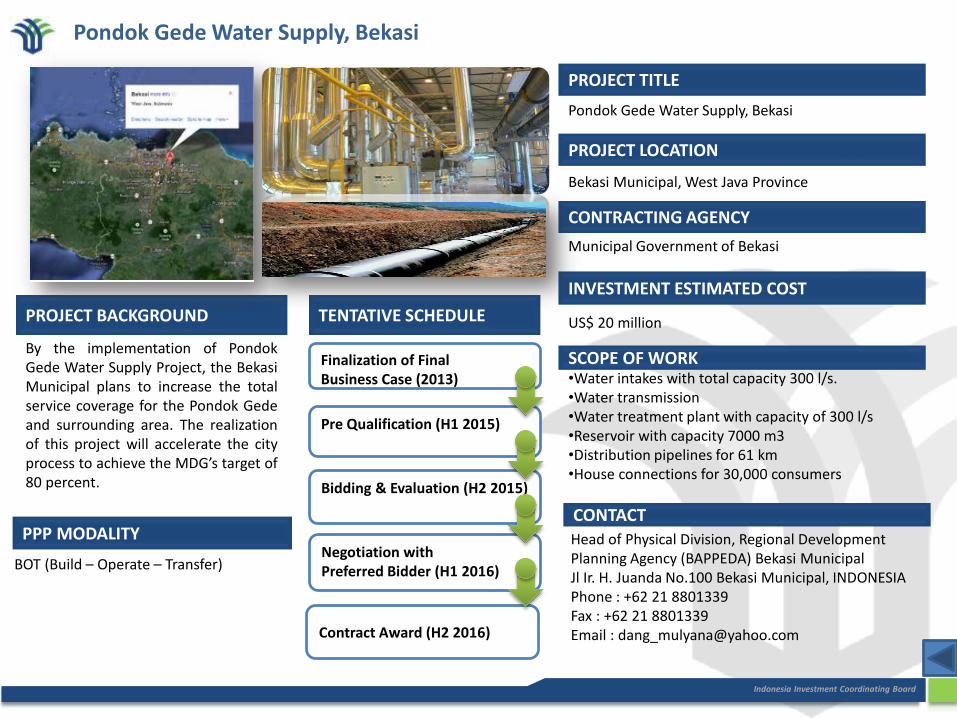
Pondok Gede Water Supply, Bekasi
PROJECT TITLE
Pondok Gede Water Supply, Bekasi
PROJECT LOCATION
Bekasi Municipal, West Java Province
CONTRACTING AGENCY
Municipal Government of Bekasi
PROJECT BACKGROUND
By the implementation of PondokGede Water Supply Project, the BekasiMunicipal plans to increase the totalservice coverage for the Pondok Gedeand surrounding area. The realizationof this project will accelerate the cityprocess to achieve the MDG’s target of80 percent.
SCOPE OF WORK•Water intakes with total capacity 300 l/s.•Water transmission•Water treatment plant with capacity of 300 l/s•Reservoir with capacity 7000 m3•Distribution pipelines for 61 km•House connections for 30,000 consumers
TENTATIVE SCHEDULE US$ 20 million
INVESTMENT ESTIMATED COST
Finalization of FinalBusiness Case (2013)
Pre Qualification (H1 2015)
Bidding & Evaluation (H2 2015)
Negotiation withPreferred Bidder (H1 2016)
Contract Award (H2 2016)
PPP MODALITY
BOT (Build – Operate – Transfer)
Head of Physical Division, Regional Development Planning Agency (BAPPEDA) Bekasi MunicipalJl Ir. H. Juanda No.100 Bekasi Municipal, INDONESIAPhone : +62 21 8801339Fax : +62 21 8801339Email : [email protected]
CONTACT
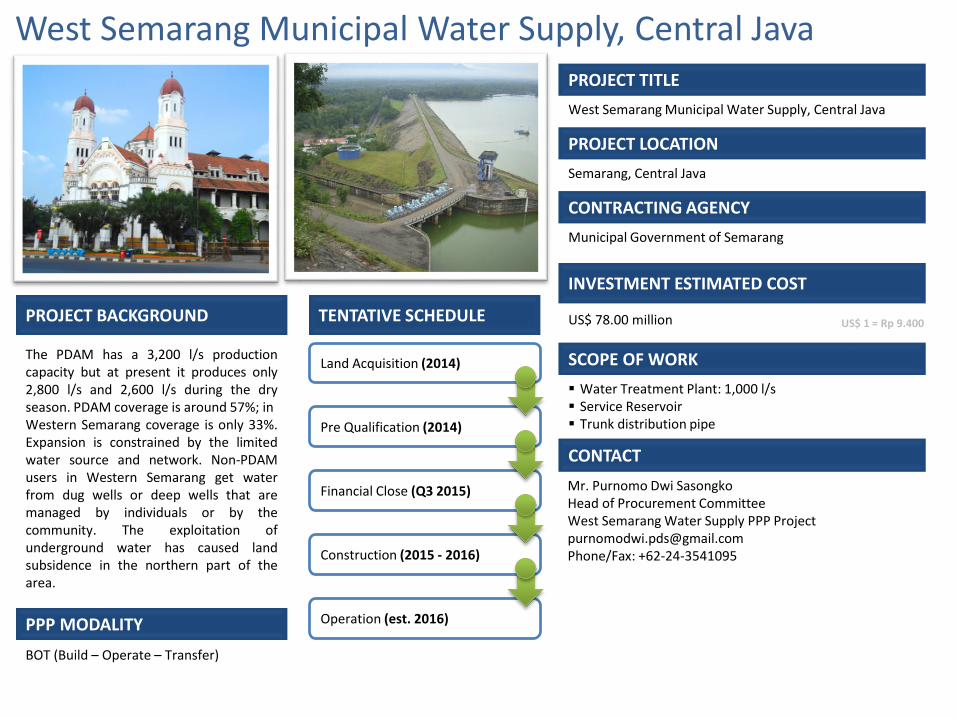
West Semarang Municipal Water Supply, Central JavaPROJECT TITLE
West Semarang Municipal Water Supply, Central Java
PROJECT LOCATION
Semarang, Central Java
CONTRACTING AGENCY
Municipal Government of Semarang
PROJECT BACKGROUND
The PDAM has a 3,200 l/s productioncapacity but at present it produces only2,800 l/s and 2,600 l/s during the dryseason. PDAM coverage is around 57%; inWestern Semarang coverage is only 33%.Expansion is constrained by the limitedwater source and network. Non-PDAMusers in Western Semarang get waterfrom dug wells or deep wells that aremanaged by individuals or by thecommunity. The exploitation ofunderground water has caused landsubsidence in the northern part of thearea.
SCOPE OF WORK
Water Treatment Plant: 1,000 l/s Service Reservoir Trunk distribution pipe
TENTATIVE SCHEDULE
Land Acquisition (2014)
Pre Qualification (2014)
Financial Close (Q3 2015)
Construction (2015 - 2016)
US$ 78.00 million
INVESTMENT ESTIMATED COST
Operation (est. 2016)
US$ 1 = Rp 9.400
CONTACT
PPP MODALITY
BOT (Build – Operate – Transfer)
Mr. Purnomo Dwi SasongkoHead of Procurement CommitteeWest Semarang Water Supply PPP [email protected]/Fax: +62-24-3541095

Indonesia Investment Coordinating Board
Pekanbaru Water Supply, Riau Province
PROJECT TITLE
Pekanbaru Water Supply, Riau Province
PROJECT LOCATION
Pekanbaru Municipal, Riau Province
CONTRACTING AGENCY
Municipal Government of Pekanbaru
PROJECT BACKGROUND
SCOPE OF WORK
TENTATIVE SCHEDULE
INVESTMENT ESTIMATED COST
Finalization of FinalBusiness Case (T.B.A)
Pre Qualification (T.B.A)
Bidding & Evaluation (T.B.A)
Negotiation withPreferred Bidder (T.B.A)
Contract Award (T.B.A)PPP MODALITY
T.B.A
CONTACT
Pekanbaru Municipal, the capital of RiauProvince, is a developing city surroundedby oil & gas fields and palm plantations.The total population is about 1,000,000people living in this flat area. Since mostof the area is swamps, the quality ofunderground water is not good. On theother hand, the service coverage of PDAMTirta Siak (Pekanbaru Municipal watercompany) is only 8% of total populationwith around 13,000 connections.Therefore, the Government of PekanbaruMunicipal has a strong commitment toimprove the water supply service in orderto achieve 32% service coverage in 2025
To be confirmed
To be confirmed
Riau Province Regional Development Planning Agency,Jl. Gajah Mada No. 200, Pekanbaru, Riau.
T: +62761-36061/36026E: [email protected]

Indonesia Investment Promotion Centre (IIPC)
Indonesia Investment Coordinating Board
8 Temasek BoulevardSuntec Tower 3, #33-03Singapore 038988
t . +65 6334 4410
f . +65 6334 4891
www.bkpm.go.id
Thank You
Terima Kasih
Indonesia Investment Promotion Centre (IIPC)