BC MUNICIPAL WATER SURVEY...
48
BC MUNICIPAL WATER SURVEY 2016 Jordi Honey-Rosés, David Gill, Claudio Pareja March 2016 WATER PLANNING LAB SCHOOL OF COMMUNITY AND REGIONAL PLANNING UNIVERSITY OF BRITISH COLUMBIA
Transcript of BC MUNICIPAL WATER SURVEY...

BC MUNICIPAL WATER SURVEY 2016
Jordi Honey-Rosés, David Gill, Claudio Pareja
March 2016
Water Planning lab
School of community and regional Planning
univerSity of britiSh columbia
Water Planning LabSchool of Community and Regional PlanningFaculty of Applied SciencesUniversity of British [email protected]
Report design: Jessica Jin
Release date: 3 March 2016
Research project approved by the Behavioural Research Ethic Board of the University of British Columbia. UBC BREB Number: H1501274
Citation
Honey-Rosés, J., Gill, D., Pareja, C. 2016. BC Municipal Water Survey 2016. Water Planning Lab. School of Community and Regional Planning, University of British Columbia. Online URL: http://hdl.handle.net/2429/57077
Open Access Data
The data has been made publically available for use by researchers and interested stakeholders. The data may be downloaded from the Abacus Dataverse Network with the following URL: http://hdl.handle.net/11272/10343
W a t e r P l a n n i n g l a b
U n i v e r s i t y o f b r i t i s h C o l U m b i a
II

B C M u n i C i p a l W a t e r S u r v e y 2 0 1 6
III
ACKNOWLEDGEMENTS
Multiple research programs at the University of British Columbia have supported the design and implementation of the BC Municipal Water Survey 2016. We recognized the support received from the Hampton Fund, the Faculty of Applied Sciences and the School of Community and Regional Planning.
We also thank those who assisted in the development of the survey, especially, Nora Angeles, Jennifer Bailey, Eugene Barsky, Oliver Brandes, Stephanie Chang, Jenna Cook, Paula Farrar, Paul Lesack, Emme Lee, Marc Parlange, Hans Schreier, Kim Stephens, Kirk Stinchcombe, Michel Villeneuve, and Daniel Ward. Most importantly, we are grateful to the municipal water managers who assisted in the completion of the survey.
W a t e r P l a n n i n g l a b
U n i v e r s i t y o f b r i t i s h C o l U m b i a
IV

TABLE OF CONTENTS
1
2
3
3
4
7
14
17
19
21
23
23
26
34
38
39
1. INTRODUCTION
2. DATA COLLECTION METHODS
3. RESULTS
3.1 Response Rate
3.2 Water Use
3.3 Water Metering
3.4 Water Pricing
3.5 Water Conservation
4. CONCLUSION
5. REFERENCES
APPENDICES
Appendix 1
Appendix 2
Appendix 3
Appendix 4
Appendix 5
B C M u n i C i p a l W a t e r S u r v e y 2 0 1 6
V

W a t e r P l a n n i n g l a b
U n i v e r s i t y o f b r i t i s h C o l U m b i a
VI

EXECUTIVE SUMMARY
The BC Municipal Water Survey 2016 presents an overview of local water use, pricing, and metering coverage in the province of British Columbia. In the summer and autumn of 2015, we contacted local governments to ask them basic questions about water use in their jurisdiction. Our survey was designed to provide continuity with Environment Canada’s Municipal Water and Wastewater Survey. We obtained responses from 45 local governments, which correspond to 66% of the population in the province and 32% of the local governments. The response rate is comparable to the last Municipal Water and Wastewater Survey released by Environment Canada in 2011 with data from 2009.
We find that water use in liters per capita per day (lpcd) continues to fall, with total water use dropping 18% to 494 lpcd, and residential water use falling 12% to 312 lpcd from 2009. If our survey results accurately estimate water use trends, the province would be on track to meet its target to improve water efficiency by 33% by 2020.
We find a metering coverage rate of 26% percent of water connections in the province. Among single family connections, the metering rate is 36%, while 18% of multifamily homes are individually metered. Notably, our metering coverage rate for single family connections is lower than the 40% that can be estimated with the data from Environment Canada (2011). Despite the low metering coverage rates reported, we find that an important number of municipalities are transitioning to universal metering, or have semi-mandatory metering programs that are gradually bringing water meters into communities throughout the province. We expect metering coverage rates to rise.
On average, local governments in BC charge residents $394 a year for water services. Two thirds of the municipal governments in our
survey still use a flat fee rate structure. The average flat fee in the province for a typical residential connection is $381. Only one third of municipal governments charge fees based on volumes of water consumed. Of these, most use a constant unit charge, rather than an increasing block rate. Assuming that an average resident consumes 25 m3
per month, residents with volumetric rate structures pay on average $418 per year. Finally, we observe that the rate charged by municipalities is highly variable throughout the province, ranging between $135 to $782.
Lastly, we inquired about water conservation programs implemented by local governments. The most common water conservation measures are educational campaigns (80%), mandatory restrictions (73%), and an active leak-detection program (58%). On the other extreme, only one municipality reported having a residential water reuse program; two reported having seasonal water pricing; and two had municipally-implemented ICI water reuse programs.
Our results present the most up to date analysis of local water use in British Columbia. Nevertheless, there remain major gaps. Therefore we call for improved collaboration among municipal planners, researchers and government officials in order to compile a comprehensive data set on municipal water use, pricing and metering coverage in the province of British Columbia.
B C M u n i C i p a l W a t e r S u r v e y 2 0 1 6
VII

1. INTRODUCTION
The Water Planning Lab of the University of British Columbia developed the BC Municipal Water Survey to fill a critical knowledge gap concerning how municipalities use water in the province. In the past, the Canadian Federal government collected information from municipal governments about how they used, measured, distributed, treated and priced water, and Environment Canada published this information in the Municipal Water and Wastewater Survey. For over a decade, the survey was repeated in order to provide a comprehensive view of how towns and cities used and managed water. The longitudinal nature of the survey allowed one to observe how trends evolved over time. The last Municipal Water and Wastewater Survey was published in 2011 with data collected in 2009 (Environment Canada 2011). In this report we cite this survey as “Environment Canada (2011)” although we may refer to the data as Environment Canada (2009).
Since the cancellation of the Municipal Water and Wastewater Survey, no other agency is collecting this information at a municipal scale. The Federal government partially addressed this data gap with a new Survey of Drinking Water Plants from Statistics Canada, which compiles information on water treatment facilities (Statistics Canada 2015). However many of the important features of the Municipal Water and Wastewater Survey remain absent. Most importantly, the data is not reported at a municipal scale in the new Survey of Drinking Water Plants.
In the absence of the Municipal Water and Wastewater Survey, the province of British Columbia has been in the dark about how municipal governments use and price water. While municipal water providers must have water licenses to supply local water users, these licenses reflect allocated water allowances, not real consumption values. The new Water Sustainability Act is likely to
include new water reporting requirements for water license holders (Brandes et al 2015), however at present, the information is not being compiled.
Collecting municipal-level data on water use and pricing is essential for wise water management. Without municipal data we cannot accurately diagnose trends and demands, nor assess if we are meeting our water efficiency targets. The BC Municipal Water Survey aims to provide insight into essential questions concerning municipal water management across the province.
We hope agencies and governments across the province will use this data to inform their decisions surrounding the management of our most critical resource.
W a t e r P l a n n i n g l a b
U n i v e r s i t y o f b r i t i s h C o l U m b i a
1

2. DATA COLLECTION METHODS
We administered the survey with the municipal water community between June and December 2015 (Appendix 1: Data Collection Methods). Municipal governments were contacted by telephone and followed up by email with approval from the Behavioural Research Ethic Board of the University of British Columbia. In our initial contact with municipal water managers, we aimed to identify the person who was able to answer our questions about municipal water use. Once we had identified the correct individual, we sent him or her a document with the critical information we sought to collect, so they could prepare in advance if necessary. We asked all respondents to provide data from 2013, although we accepted data from other years. We also allowed respondents to complete the survey on their own time and submit their response electronically if they preferred. Municipalities with a population under 10,000 were emailed the survey.
Our questions and variable names were chosen to mimic the Municipal Water and Waste Water Survey administered by Environment Canada (Appendix 2: BC Municipal Water Survey Questions and Variables). However the Environment Canada survey was considerably longer and asked detailed questions about the operations, infrastructure and treatment technologies, including wastewater. To avoid low response rates, we omitted these questions, and focused instead on water use, metering coverage, pricing and water conservation.
While we aimed to make our results as comparable as possible with the Environment Canada Survey, there are a few differences.
› We use BC Stats data for population sizes, while Environment Canada uses Stats Canada.
› Our initial contact list included Cities, District Municipalities, Towns, Villages and an Island Municipality. Regional Districts were not contacted unless specifically involved in the water system of the initial respondent.
› While we aimed to collect data for 2013, in some instances, we obtained responses from 2014.
In administering the survey, we found the section on pricing to be burdensome on respondents. We adapted by eliminating this section and instead asking for the bylaw that outlined water pricing and rates. We then compiled a detailed database on rates structures from the municipal bylaws.
In some instances, survey respondents described special circumstances, which made it difficult for them to respond, or they needed to make assumptions in order to provide a response. Therefore we report instances in which data users should be cautious about the information reported (Appendix 3: Notes on Data).
B C M u n i C i p a l W a t e r S u r v e y 2 0 1 6
2

63%66%
50%
60%
70%
80%
90%
100%
2009Enviroment Canada
2013Water Planning Lab
-‐ UBC
0
500,000
1,000,000
1,500,000
2,000,000
2,500,000
3,000,000
3,500,000
2009 Environment Canada
2013 Water Planning
Lab -‐ UBC
Population
500,000+
50,000 -‐ 499,999
5,000 -‐ 49,999
2,000 -‐ 4,999
1,000 -‐ 1,999
Less than 1,000
Figure 1. The response rate for the Environment Canada 2009 survey and BC Municipal Water Survey by the Water Planning Lab in percent population.
3. RESULTS
3.1 Response Rate
We obtained responses from 45 local governments, which corresponds to 66% of the population and 32% of the local governments surveyed. These response rates are comparable to the most recent Environment Canada survey, which obtained 63% of the population from 51% of the local governments (Figure 1).
While we obtain a sample that represents a larger number of BC residents, we obtained fewer local governments. In comparison to Environment Canada, we obtained a better response rate among larger municipalities
Figure 2. Survey response by municipal population size.
and a lower response rate among smaller municipalities, especially towns and villages with fewer than 2,000 residents. Most of the population accounted for in the BC Municipal Water Survey are from larger municipalities (Figures 2 & 3).
W a t e r P l a n n i n g l a b
U n i v e r s i t y o f b r i t i s h C o l U m b i a
3

100%
77%
29%
18%
5%
4%
100%
67%
38%
58%
44%
23%
0% 50% 100%
500,000+
50,000 -‐ 499,999
5,000 -‐ 49,999
2,000 -‐ 4,999
1,000 -‐ 1,999
Less than 1,000
Municipal Population
2009 (Environment Canada) 2013 (Water Planning Lab -‐ UBC)
Figure 3. A comparison of percent response rate for municipalities by population size.
3.2 Water Use
Total Municipal Water Use
We find that BC residents use a total of 494 litres per capita per day (lpcd). This figure is a significant drop from the 606 lpcd reported by Environment Canada (2011) (Figure 4). Total municipal water use includes all sectors including industrial, commercial, institutional, agriculture and water losses. However, this figure does not include water use from industry with separate water licenses or any other user not connected to the municipal network. Since other water uses are not included in this figure, the true
total water use per person in the province is likely to be higher that what is reported here. Nevertheless, the drop respective 2009 is notable. We find a 18% drop in total lpcd since 2009. Thus, if these results are accurate, and trends continue, the province is on track to meet its target of a 33% efficiency improvement by 2020 for municipal water use.
B C M u n i C i p a l W a t e r S u r v e y 2 0 1 6
4

Figure 4. Trends in total and residential water use in liters per capita per day (LPCD) in British Columbia.
Residential Water Use
We find that residential water use in British Columbia is 312 litres per capita daily (lpcd). This is a 12% drop from what was reported by Environment Canada (2011), and thus mirrors the downward trend in total municipal water use (Figure 4).
What Might Explain Reduced Water Use?
The observed reductions in water use raise questions about what might be driving this trend. In the residential sector, reduced water use might be explained by differences in climate between the years surveyed. We examined precipitation records from 2000 to
2014 to assess if climatic differences between 2006, 2009, 2013 and 2014 might explain the observed reductions in water use. If outdoor water use is the major component of residential water use, then we would expect lower water use in wet years, and higher water use in dry years. The data in these years do not correlate, and the downward trend in water use persists regardless of climatic conditions. However, it has been noted that drought conditions were observed in some parts of the province in 2009 (BC Provincial Government 2015), coinciding with the last year in which we have provincial wide data. Drought could increase or decrease water use, depending on assumptions made about how users would respond to dry conditions
0
100
200
300
400
500
600
700
LPCD
BC Total LPCD BC Residential LPCD
W a t e r P l a n n i n g l a b
U n i v e r s i t y o f b r i t i s h C o l U m b i a
5

0
100
200
300
400
500
600
700
800
900
0 1 2 3 4 5 6 7
Resid
ential LPCD
Municipal Categories by Population Size
Environment Canada BC Municipal Water Survey
Figure 5. Residential LPCD by municipal population size. The size of the circle represents the size of the total responding population in each survey. The categories on the X-axis (1-6) are size of the local government in which category 1 are towns with a population less than 1,000; category 2 has a population 1,001-1,999; category 3 has a population 2,000-4,999; category 4 has a population 5,000-49,999; category 5 has a population 50,000-499,999 and category 6 has a population over 500,000.
and regulatory restrictions. Thus while a more careful analysis would be needed, it is unlikely that climate conditions alone explain the drop in water use observed in our survey.
The trends could also be dictated by efficiencies made in the larger municipalities. To identify which types of local governments may be reducing water use, we looked at residential water use per capita (lpcd) by municipal size, as categorized by Statistics Canada (Figure 5). We find that smaller municipalities have higher water use, in some cases even higher than what Environment Canada reported. However, one should be cautious drawing conclusions as our response
rate was low among smaller municipalities (Figure 3). On the other hand, our response rate among larger municipalities was much higher and among this group we observe a drop in water use (Figure 5). While this drop appears small, the large number of people in this group makes a large difference in the provincial lpcd estimates. Therefore, the observed drop in residential lpcd may be due entirely to efficiency improvements in larger municipalities and cities.
B C M u n i C i p a l W a t e r S u r v e y 2 0 1 6
6

0% 20% 40% 60% 80% 100%
Metered Single Family
Unmetered Single Family
Unmetered Multifamily
Metered Multifamily
3.3 Water Metering
Water meters are essential for wise water management. The installation of water meters allows municipal governments to (1) price users based on real volumes consumed; (2) identify leaks; (3) evaluate the impact of water conservation programs; and (4) better prepare for and respond to drought. Scholars and practitioners across Canada have advocated for water metering as a best practice and a top municipal priority (Federation of Canadian Municipalities 2003, AWWA 2010, Renzetti 2009, Brandes et al 2010, BCWWA 2012).
Coverage Rates
We estimate that water meters are installed on at least 170,477 residential connections in British Columbia. This means that approximately 26% of all water connections included in the survey, regardless of housing type (single family or multifamily), have individual water meters that monitor water consumption. While multifamily units often have a meter for the entire complex, we counted multifamily homes as metered only if they lived in a municipality with a universal metering policy. Thus those multifamily
homes without individual meters were not counted as metered.
Metering rates are often reported by housing type. We find that 36% of single family homes are metered (107,595 metered connections) and 18% of multifamily homes are metered (62,882 metered connections). When viewing both housing types together, we can observe a smaller proportion of metered connections compared to unmetered connections (Figure 6).
Thus our survey finds fewer metered connections in the province than the 493,008 reported by Environment Canada in 2011. While the data from Environment Canada produced an estimate of 40% of metered single family connections, we find that only 36% of single family homes have metered connections. This smaller value is surprising, given that our survey was conducted several years later, and that large municipalities such as Richmond and Surrey are transitioning to metering. However, this difference might be explained by an underestimate in our data. It is likely that we underestimated the number of metered connections in the Victoria metropolitan area, and possibly Kelowna as well.
Figure 6. Proportion of metered and unmetered connections by single family and multifamily homes in BC
W a t e r P l a n n i n g l a b
U n i v e r s i t y o f b r i t i s h C o l U m b i a
7

In addition, several metered communities did not responde to our BC Municipal Water Survey. Most notably, we did not receive responses from Nanaimo, Fort St. John, Port Alberni, Dawson Creek, Tofino, Summerland, and other smaller communities that Environment Canada reports as universally metered. This leads us to underestimate the absolute number of metered connections. However the impact of the missing data on the percentage estimate is uncertain, since we would also need to account for the missing unmetered connections. Thus we estimate that the number of metered connections in the province is probably between 20-29%, and the percentage of single family homes that are metered is in the range of 35-40%. Our survey reports 26% and 36% respectively, however we would need a more complete data set to report these values with greater certainty.
While uncertainty remains about the precise rate of metering coverage, it is clear that BC is far below the Canadian average (72%) and behind most provinces in the country, many of which are close to universal coverage (Brandes et al 2010, Environment Canada 2011).
Figure 7. Timeline showing the date in which municipal governments adopt a universal water metering policy. Victoria was the earliest adopter in 1888.
Water Metering Policies
We tabulated municipal water metering policies for all users, including ICI and residential metering policies (Table 1). Most municipalities have ample metering coverage of the ICI sector. In the residential sector, we confirm that at least 13 municipalities have universal residential metering. Metering coverage rates are much higher in the ICI sector, followed by multifamily homes, with the single family homes having the least amount of coverage. Metering coverage rates show extreme values, with most municipalities either covering a large segment of the sector (>80%), or a low coverage (<20%). Few municipalities have metering coverage rates in any sector between 20 and 80%.
B C M u n i C i p a l W a t e r S u r v e y 2 0 1 6
8

Table 1. Municipal and Residential Metering Policies
Municipality Municipality Municipal Metering Policy
Municipal Metering Policy
Residential Metering Policy
Residential Metering Policy
Abbotsford
Anmore Village
Armstrong
Burnaby
Campbell River
Chetwynd
Chilliwack
Comox
Coquitlam
Courtenay
Cranbrook
Cumberland
Delta
District of New Hazelton
Elkford
Gibsons
Greater Vancouver A (UEL)
Hope
Kamloops
Kelowna
Kent
Langley (District - Township)
Maple Ridge
Mission
Nakusp
Nelson
North Vancouver City
North Vancouver District
Penticton
Pitt Meadows
Port Moody
Powell River
Prince George
Prince Rupert
Richmond
Salmon Arm
Squamish
Surrey
Terrace
Vancouver
Vernon
Victoria
West Vancouver
Whistler
Williams Lake
W a t e r P l a n n i n g l a b
U n i v e r s i t y o f b r i t i s h C o l U m b i a
9
UniversalSemi-Mandatory
No policyVoluntary

Figure 8. Residential water use by metering policy.
Water Metering and Water Use
It is often assumed that the installation of water meters will bring large reductions in water use, and that metered communities use less water. While we find that the highest residential water users per capita are unmetered (Elkford and Prince Rupert) we also find metered communities with high water use (Vernon, Cumberland, West Vancouver). On the other extreme, among low water users per capita, we find both metered communities (Abbotsford, Gibson) as well as unmetered communities (Nelson, Pitt Meadows) (Figure 8).
Boxplot comparisons of total and residential water use show some differences across metering policies but not necessarily statistically significant differences (Figures 9 & 10). Especially among residential consumption, we find little difference in water use based on metering policy. While municipal governments with no policy have
outliers in the upper range, their median values are similar to municipalities with semi-mandatory or universal metering policies.
Understanding the relationship between metering policy and water use is also complicated by an intrinsic bias in the dataset, in that the decision to meter water depends on both local water availability, and local cultural norms surrounding water use and conservation. Thus in dry climates, or in water-scarce communities such as the Okanagan or the Gulf Islands, we would expect both higher metering coverage and lower water use, but we could not attribute lower water use to the metering policy itself, since the local conditions of scarcity and other factors probably explain reduced water use. In short, we would expect metered communities to be fundamentally different than unmetered communities in key characteristics (climate, attitudes) that might also explain differences in metering policy and differences in water use.
B C M u n i C i p a l W a t e r S u r v e y 2 0 1 6
10
No policyVoluntary
Universal Semi-Mandatory No policy

Figure 9. Total municipal water use (lpcd) by water metering policy. Bars represent median values. Boxes signal the range of upper and lower quartiles. Whiskers locate the maximum values excluding outliers.
Figure 10. Residential water use (lpcd) by residential metering policy. Bars represent median values. Boxes signal the range of upper and lower quartiles. Whiskers locate the maximum values excluding outliers.
W a t e r P l a n n i n g l a b
U n i v e r s i t y o f b r i t i s h C o l U m b i a
11
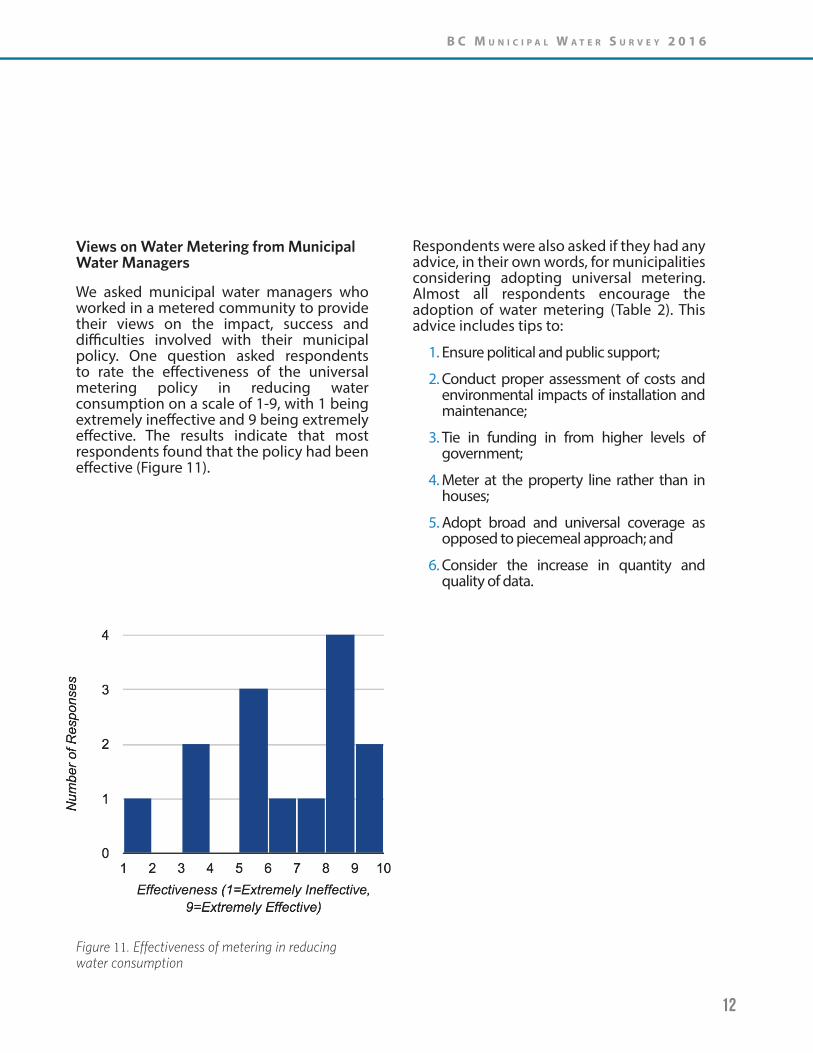
Figure 11. Effectiveness of metering in reducing water consumption
Views on Water Metering from Municipal Water Managers
We asked municipal water managers who worked in a metered community to provide their views on the impact, success and difficulties involved with their municipal policy. One question asked respondents to rate the effectiveness of the universal metering policy in reducing water consumption on a scale of 1-9, with 1 being extremely ineffective and 9 being extremely effective. The results indicate that most respondents found that the policy had been effective (Figure 11).
Respondents were also asked if they had any advice, in their own words, for municipalities considering adopting universal metering. Almost all respondents encourage the adoption of water metering (Table 2). This advice includes tips to:
1. Ensure political and public support;
2. Conduct proper assessment of costs and environmental impacts of installation and maintenance;
3. Tie in funding in from higher levels of government;
4. Meter at the property line rather than in houses;
5. Adopt broad and universal coverage as opposed to piecemeal approach; and
6. Consider the increase in quantity and quality of data.
B C M u n i C i p a l W a t e r S u r v e y 2 0 1 6
12

Table 2: Advice from fully-metered municipalities to those considering adopting universal metering.
› “Universal water metering is the most important thing. You have to have the infrastructure.It is very effective to have metering, frequent billing, and a volumetric rate structure for effective conservation.”
› “Water metering makes it so easy to understand how your system works: it is crucial for future planning, and it provides critical data.”
› “Way easier for water conservation, especially if there are financial incentives.”
› “DO IT! you don’t by bananas by flat fee, you put them on the scale...”
› “You can’t manage what you can’t measure. Leak detection will reduce water demand.”
› “Having individual water meters gives accountability for water use.”
› “What are you waiting for? There is no reason not to put in water meters. The benefits of accounting for delivered and lost water, and the benefits of planning for infrastructure go far beyond any revenue benefits”
› “Highly recommend it. Do it. You need to know how much water is used, where, and ideally when. For that reason we are looking into going to monthly billing, rather than twice a year. Metering is an important tool—the more data you have, the better.”
› “Do it” › “Universal metering is a good thing to do.
Definitely recommended.” › “Do it. Wasted effort if not paired with increasing
tiered rate and water conservation education.” › “Do It! It can reduce water consumption by 20-
30%. This has been proven.Surface water is diminishing, coupled with high temps and high water user and climate change adds even more incentive to get on this.It gives people info.It supports efficient operations.It promotes a cost effective operation.”
› “Carefully consider the costs of maintaining the infrastructure.”
› “Do it. Meter at property line, not in house. Tie the program in with federal grants.”
› “Environmental footprint of having meters (replacement every 15 years, excavation of earth, energy costs & waste). Do business case cost/benefit analysis.”
› “Have political support with public education and support.”
› “Involve Council/Mayor in understanding complexity of water distribution.Importance of metering, plus cost of metering: how would we pay for it?”
› “The push for implementation has to come from senior management/council in order for it to really work. Coverage needs to be broad and universal, not selective and only for a part.”
› “Mixed advice: the business case has to be there. In our case, a phased approach made sense. It has to make sense for your municipality.It does reduce water use.”
› “Beneficial in terms of getting a sense of what and how much water is being used. Obviously the long term operations and maintenance costs of metering, can be costly. Good opportunity to assess impact”
› “It’s effective.Need to look at cost/benefit of it.Water conservation outcomes can be disappointing.”
Encouraged Unequivocally Recommended with Caution
Note: Includes all responses with identifying information removed.
W a t e r P l a n n i n g l a b
U n i v e r s i t y o f b r i t i s h C o l U m b i a
13

3.4 Water Pricing
Rate Structure
We analyzed the water pricing policies and rate structures of the 44 local governments who responded to our survey. For this segment, the University Endowment Lands are not included in our analysis. We obtained the data directly from the bylaws that set municipal water rates, typically a Waterworks Bylaw. We identified the bylaw adoption date, the residential fees and rates for both single-family and multi-family residents, as well as other relevant information.
We found that there was a diversity of rates structures within municipalities, as many bylaws include both flat fee and volumetric
rate structures. However the bylaws do not clarify which price structure is used for the majority of households. In order to identify the dominant rate structure for each housing type (single family and multifamily), we used the percentage of households that are metered. For single-family homes, when the majority of households were metered, we assumed that the dominant rate structure was volumetric. For multifamily homes, we added an additional criterion in that only those living in municipalities with universal residential metering were assumed to pay volumetric rates. Our summary figures present results that consider the dominant rate structure for that municipality. We also found that some communities may have drafted volumetric rates in the bylaws but still charge most users a flat fee.
Figure 12: Distribution of municipalities by rate structure for single family dwellings. The different rate structures are: flat charge, a constant unit charge (CUC), a constant unit charge plus a base charge (CUC+base charge), a decreasing block rate plus a base charge (DBR+base charge), and an increasing block rate plus a base charge (IBR+base charge).
Figure 13: Distribution of municipalities by rate structure for multifamily dwellings. The different rate structures are: flat charge; a constant unit charge (CUC), a constant unit charge plus a base charge (CUC+base charge), a decreasing block rate plus a base charge (DBR+base charge), and an increasing block rate plus a base charge (IBR+base charge).
292
7
15
Flat charge CUC
CUC+Base charge DBR+Base charge
IBR+Base charge
32
2
8
2
Flat charge CUC
CUC+Base charge IBR+Base charge
B C M u n i C i p a l W a t e r S u r v e y 2 0 1 6
14

Water Rates for Single Family Homes
To compare how much residents pay for water across the province, we followed the approach used by Environment Canada and considered a monthly consumption of 25 cubic meters per household and a connection size of 3/4”. For a household of two people, this translates to 411 LPCD.
In our sample of 44 municipalities, each household is charged an average of $391 annually. The average charge for volumetric rate structures at this water volume is $418, while for those who charge only flat fees, the average charge is $381 (Figure 14). We observe a wide range in average water charges. Both the lowest (Chilliwack $135) and the highest (Vernon $782) are volumetric rates. However many of the highest water fees are also flat fees, such as the District of North Vancouver ($630), Nelson ($569) and Vancouver ($568).
Figure 14. Average annual water bill for households that consumes 25 cubic meter monthly with a 3/4” connection. For most municipalities the rate structure reflects 2015 rates and they do not consider any assessed (frontage based) fee or tax.
0 200 400 600 800
ChilliwackArmstrong
TerraceElkford
CranbrookSalmon arm
HopeCumberlandWilliams Lake
KentPowell River
District of New HazeltonCampbell River
ComoxAbbotsford
SurreyNakuspWhistler
CourtenayKelowna
Port MoodyGibsons
North Vancouver CitySquamishPenticton
Prince RupertKamloopsRichmondChetwynd
Pitt MeadowsCoquitlam
Township of LangleyMission
DeltaVictoria
Prince GeorgeMaple Ridge
West VancouverBurnaby
Anmore VillageVancouver
NelsonNorth Vancouver District.
Vernon
CND$
Volumetric Flat
We find flat fees remain the predominant rate structure in the province, with two thirds of the surveyed communities using a flat fee to charge single family homes. The remaining one third use some form of volumetric rate structure (Figure 12). In absolute terms, 15 of 44 municipalities reported charging single family dwellings a volumetric rate. For multifamily dwellings, the number of municipalities that charge a volumetric rate decreases to 12 (27%) (Figure 13). Moreover, in municipalities where a volumetric charge is in place, a constant charge is also present. This charge may take the form of a base charge or a minimum charge. It should also be noted that even when municipalities are charging volumetrically, most use a constant unit charge, in which each additional unit is priced the same. Only five municipalities have adopted increasing block rate structures in either housing types.
W a t e r P l a n n i n g l a b
U n i v e r s i t y o f b r i t i s h C o l U m b i a
15

Armstrong
Elkford
PrinceRupert
Vancouver
North VancouverDistrict
ChilliwackAbbotsford
WestVancouver
Vernon
0
200
400
600
800
1,000
1,200
1,400
1,600
0 200 400 600 800 1,000
LPCD
Residential
Annual Price
Flat
Volumetric
Single Family Pricing and Water Use
Price is also believed to be an important predictor of total water use. Other studies show clear relationships between price and water use (Brandes et al 2010). We examined this relationship with the 33 municipalities for which we have data on residential water use (Figure 15). We do not find a clear negative relationship as expected, although on average, residents with low-priced water do consume more. Vernon is an unusual outlier with high price and high water use, and may be explained by Vernon supplying neighbouring communities not accounted
Figure 15. The relationship between average annual water charge and residential water use, measured in litres per capita per day (LPCD) for single family homes.
for. We also suspect that municipal averages may hide internal disparities between metered and flat fee customers in cases where municipalities have a mixture of both fee structures. Combining residential level data across municipalities might show a stronger negative relationship between price and water use. Also, we advise caution on interpreting Figure 15 because the year of the water use data (2013-2014) does not always correspond to the year in which the bylaw was written. Most of the bylaws we examined are from 2014 and 2015.
B C M u n i C i p a l W a t e r S u r v e y 2 0 1 6
16

3.5 Water Conservation
The BC Municipal Water Survey included questions about water conservation programs and efforts. We asked respondents to identify which conservation measures they adopted in their municipality from a list of possible water conservation programs (Appendix 5: Conservation measures by municipality).
Our list of conservation measures drew from the Water Use Efficiency Catalogue of the Water Conservation Strategy for British Columbia published by the BC Ministry of Environment (1998). The Ministry’s comprehensive catalogue had 94 municipalities respond if they used over 80 types of conservation measures. Although the BC Municipal Water Survey asked about 19 conservation measures, they were designed to provide continuity, where possible, with the previous catalogue. Most notably, the 28 specific measures regarding education and school outreach were condensed into one, “Educational Watersaving Campaigns (including tips, fact sheets, school outreach, etc…)”.
A comparison of the BC Municipal Water Survey with the Water Use Efficiency Catalogue suggests greater adoption of a conservation agenda among BC municipalities since 1998. First, whereas the Water Use Efficiency Catalogue found only half (51%) of municipalities were pursuing any sort of water efficiency educational measures, 80% of municipalities responding to the BC Municipal Water Survey reported engaging in a water-saving educational campaign. Similarly, 45% of municipalities reported having mandatory restrictions
in place in 1998, compared to 73% of our respondents.
The most common conservation measures in British Columbia are educational campaigns (80%), mandatory restrictions (73%), and an active leak-detection program (58%). On the other extreme, only one municipality reported having a residential water reuse program (ie. greywater system program); two reported having seasonal water pricing; two had ICI water reuse programs, while only four reported ICI water audit programs.
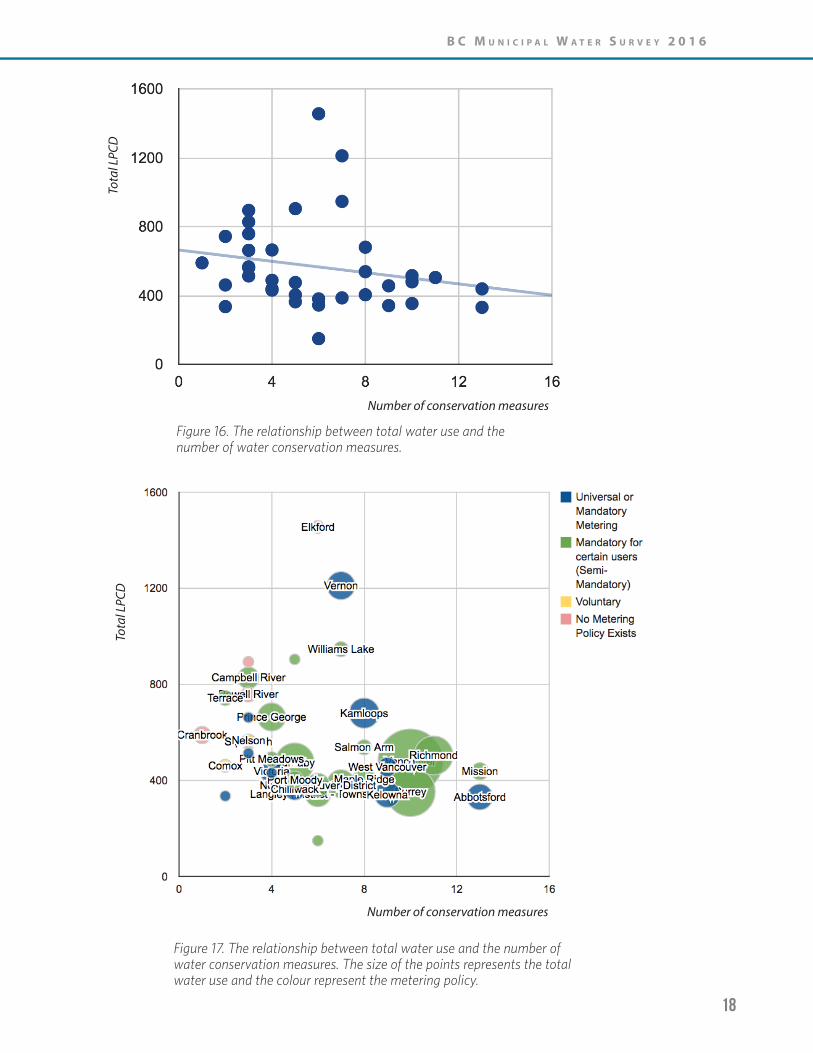
There is a wide range of water conservation programs and measures adopted by municipalities across the province. However, smaller municipalities tend to have fewer measures, while larger municipalities have more. This is unsurprising given resource constraints confronted by smaller local governments. Yet, as noted previously, water consumption per capita is highly variable and not explained simply by population size, metering policy, nor rate structure alone. As an exploratory analysis, we examine the relationship between total municipal water consumption per capita (LPCD) and number of conservation measures (Figure 16). The trendline indicates that while number of conservation measures is associated with lower per-capita water consumption, this association is weak (r2=0.04), and the relationship is not necessarily causal.
We then reproduce this figure by adding information about the size of the total water use, and information about metering policy for each municipality (Figure 17).
W a t e r P l a n n i n g l a b
U n i v e r s i t y o f b r i t i s h C o l U m b i a
17
Number of conservation measures
Tota
l LPC
D
Number of conservation measures
Tota
l LPC
D
Figure 16. The relationship between total water use and the number of water conservation measures.
Figure 17. The relationship between total water use and the number of water conservation measures. The size of the points represents the total water use and the colour represent the metering policy.
B C M u n i C i p a l W a t e r S u r v e y 2 0 1 6
18

4. CONCLUSION
Understanding existing practices and trends in municipal water use is essential for building resilient municipal water systems. The BC Municipal Water Survey provides new data on municipal water use, metering, pricing and water conservation in order to assess current practices, and provide provincial-wide comparison of municipal water use and policy.
Most significantly, we find that water use appears to be declining in the province across two important measures: (i) total annual water use per capita and (ii) residential water use per capita. These measures declined 18% and 12% respectively from 2009. With these results, the province is on track to meet its ambitious target of improving water efficiency by 33% by 2020.
More work is needed to confirm this trend. Similarly, more work is needed to understand what might explain the observed drop in water use. It is unclear if we can attribute this drop in water use to infrastructure efficiencies, policy changes, behavioural changes by water users or climatic differences between years. The explanation as to what is driving the drop in water use has policy implications. By understanding what is driving reduced water use, we can reveal which levers governments and water providers may use to manage water demands, and plan for the future.
Our preliminary examination suggests that the observed drop in water use is being driven by efficiency gains in larger cities. Smaller municipalities (<50,000), in contrast, have higher water use per capita and show little sign of reduction. From a provincial perspective, greater efficiency gains may be made in the smaller communities. However their impact on meeting the provincial targets is likely to be small.
Further research should aim to disentangle the possible impacts of municipal policies, changes in building codes, new mandates for water efficient appliances and fixtures, new fee structures, increases in urban density and new land use patterns. While we observe a decline in water use, we have no evidence that this drop is the result of government policy. It is possible that the decline in water use is due to larger structural changes in urban settings, irrespective of local or provincial water policy. For example, increased water efficiency per capita may merely be due to increases in residential density, in which multifamily households have less outdoor water use. This theory would suggest that large increases in residential density without any changes from the existing residents could result in an overall decline in per capita water use. Thus we should examine the extent to which urban densification may explain downward trends in per capita water use.
We identify provincial metering rates that are lower than past studies, although this may be explained by gaps in our data. There are also methodological issues for calculating metering coverage rates that might need refinement (Appendix 4). Nevertheless, we can be confident that metering coverage is on the rise in BC, even though they remain below most other provinces in Canada.
In part due to the transition to metering, many municipalities have a diverse fee structures in which flat fees and volumetric fees co-exist. We suspect that this mixture also partially explains why we do not observe a clean negative relationship between price and water use, in which water use decreases as prices increase.
We find that local governments are increasingly adopting a diverse set of water conservation programs to improve water
W a t e r P l a n n i n g l a b
U n i v e r s i t y o f b r i t i s h C o l U m b i a
19

efficiency. Yet while the adoption of these programs is more widespread, we have limited evidence that they are effective or cost-effective in meeting their objective. Municipalities might consider common methods from the field of impact evaluation in order to evaluate the impact of their water conservation programs. With well-designed programs, municipalities can measure their own impact while simultaneously help build the evidence-base for demand management approaches (Ferraro and Price 2013).
The BC Municipal Water Survey makes an important contribution to our understanding of municipal water use and practices in the province. Nevertheless, our data remains patchy and incomplete. Without a complete dataset, it will be difficult to affirm with confidence that the observed drop in water use is attributable to real efficiency improvements or if it is a spurious result due to other factors. Given the gaps in our data, we urge caution when analyzing our results. Despite similar response rates to previous studies in terms of total population, there remain important gaps that could modify the results.
Clearly, a more comprehensive data set is needed. In the next few years, it is possible that senior levels of government will begin requiring more systematic water use reporting. However we cannot be sure that they will require reporting on issues of metering coverage, pricing, water conservation or other important features of the water policy landscape.
Thus in the absence of a mandatory reporting requirement, or other systematic data collection programs, we call for collaboration among government officials, researchers and the private sector to complete a comprehensive database of water use across the province. We must reach
out to local managers who are intimately familiar with their particular water system. With their help, together, a pooled data set may help answer fundamental questions about water demands, trends, projections and the impact of conservation policies. The collaborative effort we envision would keep the data open to all, in order to benefit all residents of British Columbia and beyond.
B C M u n i C i p a l W a t e r S u r v e y 2 0 1 6
20

5. REFERENCES
AWWA 2010. Statement of policy on water supply matters: Metering & Accountability. American Water Works Association (AWWA) http://www.awwa.org/about-us/policy-statements/p o l i c y - s t a te m e n t / a r t i c l e i d / 2 0 6 /metering-and-accountability.aspx
BC Provincial Government 2008. Living Water Smart: British Columbia’s water plan. online: http://www.livingwatersmart.ca/
BC Provincial Government 2015. British Columbia Drought Response Plan. Ministry of Environment.
BCWWA 2012. Position Statement: Water Metering. BC Water & Waste Association. online http://www.bcwwa.org/component/bcwwaresourcelibrary/ ?view=resource&id=1109&Itemid=
Brandes, O.M., S. Carr-Wilson, D. Curran, R. Simms 2015. Awash with opportunity: Ensuring the sustainability of British Columbia’s new water law. Polis Project on Ecological Governance. University of Victoria. http://poliswaterproject.org/awashwithopportunity
Brandes, O.M., S. Renzetti, K. Stinchcombe 2010. Worth every penny: A primer on conservation oriented water pricing. Polis Project on Ecological Governance. University of Victoria.
Coelho, S. J. (2005). Municipal Residential Water Metering in the Greater Vancouver Regional District. Masters Project. School of Community and Regional Planning. University of British Columbia.
Environment Canada. 2011. 2011 Municipal Water Use Report: Municipal Water Use 2009 Statistics (p. 24).
Environment Canada. 2011. 2011 Municipal Water Pricing Report: 2009 Statistics https://ec.gc.ca/Publications/default.asp?lang=En&xml=992156D4-2599-4026-9B4C-47855D26CCB8
Federation of Canadian Municipalities & National Research Council (2003) Establishing a metering plan to account for Water Use and Loss. Issue No. 1. https ://w w w.fcm.ca/Documents/reports/Infraguide/Establishing_a_Meter ing_Plan_to_Account_for_Water_Use_and_Loss_EN.pdf
Ministry of Environment. 1998. Water Use Efficiency Catalogue for British Columbia. Online: http://www.env.gov.bc.ca/wsd/plan_protect_sustain/water_conservation/wtr_use_eff_cat_bc/toc.html
Renzetti, S. 2009. Wave of the Future: The Case for Smarter Water Policy (p. 24). Toronto, Canada: C.D. Howe Institute.
Ferraro, P. J., & Price, M. K. 2013. Using Nonpecuniary Strategies to Influence Behavior: Evidence from a Large-Scale Field Experiment. Review of Economics and Statistics, 95(1), 64–73.
RBC 2015. 2015 RBC Canadian Water Attitudes Survey. Blue Water Project. Online http://www.rbc.com/community-sustainability/environment/rbc-blue-water/water-attitude-study.html
Statistics Canada 2015. Survey of Drinking Water Plants, 2013. Statistics Canada. Online http://www.statcan.gc.ca/daily-quotidien/150619/dq150619d-eng.htm
W a t e r P l a n n i n g l a b
U n i v e r s i t y o f b r i t i s h C o l U m b i a
21

B C M u n i C i p a l W a t e r S u r v e y 2 0 1 6
22

APPENDIX 1. DATA COLLECTION METHODS
Assembling Stakeholder List
We aimed to survey each village, town, district municipality and city in the province of British Columbia (146). We began by researching each municipality’s website to find basic contact information (e-mail and phone number) of the appropriate department responsible for water services. If possible, we recorded contact information for specific positions related to water conservation (eg. Water Conservation Program Coordinator, Water Sustainability Coordinator) or management (e.g. Manager of Water and Waste Services, Utilities manager). These were typically departments of Public Works, Engineering, or Operations, although occasionally Finance Departments were involved (due to their role in billing). If no specific water-related position was found on the website, or a directory unavailable, the main phone number for the municipality was recorded. If department information was found, but the position uncertain, the most senior position’s contact information was recorded, and then contacted.
The stakeholder list was updated with new information as the surveys were conducted or municipalities contacted.
Survey Administration
After compiling the list of likely respondents, the survey was administered between June and December 2015 using two communicative pathways. The first pathway, illustrated in Figure A1, combined phone calls and e-mails, while the second pathway was exclusively by e-mail (Figure A2). The first approach was chosen as phone calls have been shown to have elicit a higher response rate than e-mail. However, they are more intensive, requiring staff time to look up each municipality, find the appropriate person responsible for water management,
call them, ask for their participation, then schedule a separate phone call for a phone survey. As a result, given limited resources, this method was reserved for municipalities with populations of over 10,000 to ensure maximum coverage of the B.C. Population. 61 municipalities were initially contacted using this method.
Phone Call Approach
In this first approach, the target municipal stakeholder (or, if none was identified, the main line of the municipality) was called and asked who would be best suited in the organization to answer questions regarding water distribution, metering, and pricing. The stakeholder list was then be updated with the new name, e-mail and number, and be given a call. The target stakeholder was told about the survey, asked if they wanted to participate, and if so, sent a checklist to prepare and a time to schedule the interview.
A second phone call on the agreed-upon date and time was made for the actual administration of the survey. This call took an average of twenty minutes.
Blanket E-mail Approach
The second pathway is a ‘blanket’ e-mail approach (Figure A2). Target municipal stakeholders who were not successfully reached by phone through the first method, and those of populations with fewer than 10,000, were sent an e-mail
In our initial contact with municipal water managers, we aimed to identify the person who was able to answer our questions about municipal water use. Once we had identified the correct individual, we sent them a document with the critical information we sought to collect, in order to allow them to prepare if necessary. We
W a t e r P l a n n i n g l a b
U n i v e r s i t y o f b r i t i s h C o l U m b i a
23

asked all respondents to provide data from 2013, although we accepted data from other years. We also allowed municipalities to
Kick-Off Call › Find right person › Basic introduction of project
› Introduce yourself/project in more detail › Ask if they are willing to participate › Answer any questions they may have › Set date and time
› Thank them for agreeing to participate › Confirm date and time › Attach checklist of desired data that they will
need to collect
› Reminder of date, time, and their contact number › Explain it will take 20-30 minutes. › Describe information we are interested in: total
municipal water use/metering coverage/pricing (re-attach checklist)
› Describe purpose and goal of survey, voluntary nature of questions, and priorities
› Re-obtain consent and ask if they have any questions before beginning
› Conduct Survey!
› Thank them for their participation › Provide our website where they will find updates
on the study
› Send final report and links to study results and analysis
First Phone Call with Water Person
Introductory E-mail
Reminder E-mail
Thank you E-mail
Survey call
Results
Attached Checklist
Message Goals
Re-attached Checklist
Figure A1. Data Collection Communication Flowchart for Municipalities over 10,000 inhabitants
respond on their own and reply by email if the preferred.
B C M u n i C i p a l W a t e r S u r v e y 2 0 1 6
24

Figure A2. Data Collection Communication Flowchart for Municipalities Having Fewer Than 10,000 inhabitants, and Larger Municipalities Not Responsive to Phone Calls
Assemble e-mails › Find right person per municipality › Assemble list of e-mails
› Introduce project › Ask if they are willing to participate, or if they can
forward to the right person › Attach Survey in fillable Word format
› Reminder to fill out survey › Re-attach survey
› Respond to every received survey with thank you e-mail
› Thank them for their participation › Provide our website where they will find updates
on the study
› Send final report and links to study results and analysis
Blanket Survey E-mail
Blanket Reminder E-mail
Thank you E-mail
Results
Attached Survey
Attached Survey
Message Goals
W a t e r P l a n n i n g l a b
U n i v e r s i t y o f b r i t i s h C o l U m b i a
25

APPENDIX 2. BC MUNICIPAL WATER SURVEY QUESTIONS AND VARIABLES
BC Municipal Water SurveyVariable Name Question/DefinitionVariable Name Question/DefinitionMunicipality Name of the municipalityIntMunicipalities_ID ID used in the 2009 Environment Canada reportintCensusID Stats Can's Census subdivision 7 digit codeSGC BC Stats id codestrCensusType The type of census subdivision, in short form, according to Stats CanintPopulation2013 Population in 2013, according to BC StatsintPopulation2014 Population in 2014, according to BC StatsRespondingPop This is the population served by the water system. We used the
population (intPopulation2013 or intPopulation2014) depending on the year in which data was reported
RespondingPop_2013 This is the population served by the water system with popluation data from 2013. Used to calculate response rate.
Has a water provider Does your jurisdiction obtain its drinking water from another local municipality or regional water provider (water district)?
Water provider Name of that municipality/regional provider?TotalAnnualVol_M3 Total annual water delivered by the municipality in cubic metersbooleanHasTotalData Indicates if the municipality submitted total consumption valuelpcd_tot Total water use percapita per day in liters (lpcd) calculated with
TotalAnnualVol_M3 and RespondingPopyear Year of the data submitted by the municipalityintSizeGroup The municipal population size groups using the population of 2013. It
uses the same categories that Environment Canada: 1-‐population less than 1,000; 2-‐population 1,001-‐1,999; 3-‐Population 2,000-‐4,999; 4-‐ Population 5,000-‐49,999; 5 population 50,000-‐499,999 and category 6 has a population over 500,000.
IntResConecServedWDS How many residential connections are served by this water distribution system? (#)
PctPopServedWDS What percent of the residential population is served by this water distribution system? (%)
PctSF What percent of residents in your municipality live in Single Family Homes? (Data from Census 2011)
PctMF What percent of residents in your municipality live in multi-‐family homes? (Data from Census 2011)
intAvgDwelling Average persons in the dwelling (Data from 2011 Census)Pct_DomUse What percent of total annual water distributed by your system is
delivered to the residential sector? (%)Residential WaterUse_AnnualM3
Annual water delivered to residential in cubic meters, calculated using total water consumption (TotalAnnualVol_M3) and the percent of water delivered to residential (Pct_DomUse)
booleanHasResidentialData Indicates if the municipality submitted residential consumptionlpcd_res Residential water used percapita per day in liters (lpcd), it is
calculated as the residential consumption (Residential WaterUse_annualM3) divided by the responding population (RespondingPop) divided by 365
Pct_DomUseSF What percent of total annual water distributed by your system is delivered to the residential sector to Single Family dwellings? (%)
Pct_DomUseMF What percent of total annual water distributed by your system is delivered to the residential sector to Multi Family dwellings? (%)
Pct_ICIUse What percent of total annual water distributed by your system is delivered to industrial/commercial/institutional sectors? (%)
ICIWaterUse_AnnualM3 Annual water delivered to ICI in cubic meters, calculated using the total consumption (TotalAnnualVol_m3) and percent of water delivered to ICI (pct_ICIUse)
Pct_OnlyIndUse What percent of total annual water distributed by your system is delivered to the industrial sector? (%)
Pct_OnlyComUse What percent of total annual water distributed by your system is delivered to the commercial sector? (%)
Pct_OnlyInstUse What percent of total annual water distributed by your system is delivered to the institutional sector? (%)
Method ICI Breakdown What estimation method is used to determine the percentages of the total in the ICI sector?
Pct_OnlyAgrUse What percent of total annual water distributed by your system is delivered to the agricultural sector? (%)
Method Agr Breakdown What estimation method is used to determine the amount of water delivered to the agricultural sector?
Pct_UnaccountedUse What percent of the total system water is unaccounted for?str_UnaccountedUse The municipality considered the unaccounted use included in the
100% breakdown of usesMethod Losses What estimation method is used to calculate the percentage of total
unaccounted water?Metering policy Which best describes your municipal water metering policy?MeteringPolicy_Res Categorical variable describing the metering policy for the residential
sector.PctPopServedSFMeters What percentage of single-‐family homes have water meters?strScopeSF-‐SurveySummary Single Family Residential Pricing Policy, above 50% it is considered
that the municipality charges volumetricallyPctPopServedMFMeters What percentage of multi-‐family homes have water meters?strScopeMF-‐SurveySummary Multi family pricing policy. While multifamily units often have a meter
for the entire complex, we counted multifamily homes as metered only if they lived in a municipality with a universal metering policy. Thus those multifamily homes without individual meters were not counted as metered.
PctServedIndMeters What percentage of your industrial water connections are metered?PctServedComMeters What percentage of commercial water connections are metered?PctServedInstMeters What percentage of your institutional water connections are
metered?PctServedAgrMeters What percentage of your agricultural water connections are metered?
PctServedICIMeters What percentage of your industrial, commercial, and institutional water connections are metered?
Year Metering Data Year for Data on Metering CoverageYear Metering Beginning When did your municipality's water metering policy come into effect?Effectiveness of metering On a scale of 1 to 9, with 1 being extremely ineffective, 5 being
neither effective nor ineffective, and 9 being extremely effective, how effective do you think your metering program has been in reducing water consumption?
Metering to detect leaks Has your municipality used household metering data to detect leaks in the water system?
Metering to evaluate conservation programs
Has your municipality used household metering data to evaluate the impacts of water conservation programs?
Study for URM in last 5 years In the past five years, has a study been conducted on requiring universal residential water metering in your municipality?
Author of the study If yes, who conducted the study?Disicentives for URM -‐ Comments
What are the main disincentives to adopting universal residential water metering in your municipality?
Disicentives for URM Previous research has identified six primary reasons for not adopting universal residential metering programs. Which of the following six apply to your municipality?
Main disicentive for URM Which of these is the primary reason for not adopting universal residential water metering in your municipality?
Comments Any additional relevant info
B C M u n i C i p a l W a t e r S u r v e y 2 0 1 6
26

Variable Name Question/DefinitionMunicipality Name of the municipalityIntMunicipalities_ID ID used in the 2009 Environment Canada reportintCensusID Stats Can's Census subdivision 7 digit codeSGC BC Stats id codestrCensusType The type of census subdivision, in short form, according to Stats CanintPopulation2013 Population in 2013, according to BC StatsintPopulation2014 Population in 2014, according to BC StatsRespondingPop This is the population served by the water system. We used the
population (intPopulation2013 or intPopulation2014) depending on the year in which data was reported
RespondingPop_2013 This is the population served by the water system with popluation data from 2013. Used to calculate response rate.
Has a water provider Does your jurisdiction obtain its drinking water from another local municipality or regional water provider (water district)?
Water provider Name of that municipality/regional provider?TotalAnnualVol_M3 Total annual water delivered by the municipality in cubic metersbooleanHasTotalData Indicates if the municipality submitted total consumption valuelpcd_tot Total water use percapita per day in liters (lpcd) calculated with
TotalAnnualVol_M3 and RespondingPopyear Year of the data submitted by the municipalityintSizeGroup The municipal population size groups using the population of 2013. It
uses the same categories that Environment Canada: 1-‐population less than 1,000; 2-‐population 1,001-‐1,999; 3-‐Population 2,000-‐4,999; 4-‐ Population 5,000-‐49,999; 5 population 50,000-‐499,999 and category 6 has a population over 500,000.
IntResConecServedWDS How many residential connections are served by this water distribution system? (#)
PctPopServedWDS What percent of the residential population is served by this water distribution system? (%)
PctSF What percent of residents in your municipality live in Single Family Homes? (Data from Census 2011)
PctMF What percent of residents in your municipality live in multi-‐family homes? (Data from Census 2011)
intAvgDwelling Average persons in the dwelling (Data from 2011 Census)Pct_DomUse What percent of total annual water distributed by your system is
delivered to the residential sector? (%)Residential WaterUse_AnnualM3
Annual water delivered to residential in cubic meters, calculated using total water consumption (TotalAnnualVol_M3) and the percent of water delivered to residential (Pct_DomUse)
booleanHasResidentialData Indicates if the municipality submitted residential consumptionlpcd_res Residential water used percapita per day in liters (lpcd), it is
calculated as the residential consumption (Residential WaterUse_annualM3) divided by the responding population (RespondingPop) divided by 365
Pct_DomUseSF What percent of total annual water distributed by your system is delivered to the residential sector to Single Family dwellings? (%)
Pct_DomUseMF What percent of total annual water distributed by your system is delivered to the residential sector to Multi Family dwellings? (%)
Pct_ICIUse What percent of total annual water distributed by your system is delivered to industrial/commercial/institutional sectors? (%)
ICIWaterUse_AnnualM3 Annual water delivered to ICI in cubic meters, calculated using the total consumption (TotalAnnualVol_m3) and percent of water delivered to ICI (pct_ICIUse)
Pct_OnlyIndUse What percent of total annual water distributed by your system is delivered to the industrial sector? (%)
Pct_OnlyComUse What percent of total annual water distributed by your system is delivered to the commercial sector? (%)
Pct_OnlyInstUse What percent of total annual water distributed by your system is delivered to the institutional sector? (%)
Method ICI Breakdown What estimation method is used to determine the percentages of the total in the ICI sector?
Pct_OnlyAgrUse What percent of total annual water distributed by your system is delivered to the agricultural sector? (%)
Method Agr Breakdown What estimation method is used to determine the amount of water delivered to the agricultural sector?
Pct_UnaccountedUse What percent of the total system water is unaccounted for?str_UnaccountedUse The municipality considered the unaccounted use included in the
100% breakdown of usesMethod Losses What estimation method is used to calculate the percentage of total
unaccounted water?Metering policy Which best describes your municipal water metering policy?MeteringPolicy_Res Categorical variable describing the metering policy for the residential
sector.PctPopServedSFMeters What percentage of single-‐family homes have water meters?strScopeSF-‐SurveySummary Single Family Residential Pricing Policy, above 50% it is considered
that the municipality charges volumetricallyPctPopServedMFMeters What percentage of multi-‐family homes have water meters?strScopeMF-‐SurveySummary Multi family pricing policy. While multifamily units often have a meter
for the entire complex, we counted multifamily homes as metered only if they lived in a municipality with a universal metering policy. Thus those multifamily homes without individual meters were not counted as metered.
PctServedIndMeters What percentage of your industrial water connections are metered?PctServedComMeters What percentage of commercial water connections are metered?PctServedInstMeters What percentage of your institutional water connections are
metered?PctServedAgrMeters What percentage of your agricultural water connections are metered?
PctServedICIMeters What percentage of your industrial, commercial, and institutional water connections are metered?
Year Metering Data Year for Data on Metering CoverageYear Metering Beginning When did your municipality's water metering policy come into effect?Effectiveness of metering On a scale of 1 to 9, with 1 being extremely ineffective, 5 being
neither effective nor ineffective, and 9 being extremely effective, how effective do you think your metering program has been in reducing water consumption?
Metering to detect leaks Has your municipality used household metering data to detect leaks in the water system?
Metering to evaluate conservation programs
Has your municipality used household metering data to evaluate the impacts of water conservation programs?
Study for URM in last 5 years In the past five years, has a study been conducted on requiring universal residential water metering in your municipality?
Author of the study If yes, who conducted the study?Disicentives for URM -‐ Comments
What are the main disincentives to adopting universal residential water metering in your municipality?
Disicentives for URM Previous research has identified six primary reasons for not adopting universal residential metering programs. Which of the following six apply to your municipality?
Main disicentive for URM Which of these is the primary reason for not adopting universal residential water metering in your municipality?
Comments Any additional relevant info
Variable Name Question/Definition
W a t e r P l a n n i n g l a b
U n i v e r s i t y o f b r i t i s h C o l U m b i a
27

Variable Name Question/DefinitionMunicipality Name of the municipalityIntMunicipalities_ID ID used in the 2009 Environment Canada reportintCensusID Stats Can's Census subdivision 7 digit codeSGC BC Stats id codestrCensusType The type of census subdivision, in short form, according to Stats CanintPopulation2013 Population in 2013, according to BC StatsintPopulation2014 Population in 2014, according to BC StatsRespondingPop This is the population served by the water system. We used the
population (intPopulation2013 or intPopulation2014) depending on the year in which data was reported
RespondingPop_2013 This is the population served by the water system with popluation data from 2013. Used to calculate response rate.
Has a water provider Does your jurisdiction obtain its drinking water from another local municipality or regional water provider (water district)?
Water provider Name of that municipality/regional provider?TotalAnnualVol_M3 Total annual water delivered by the municipality in cubic metersbooleanHasTotalData Indicates if the municipality submitted total consumption valuelpcd_tot Total water use percapita per day in liters (lpcd) calculated with
TotalAnnualVol_M3 and RespondingPopyear Year of the data submitted by the municipalityintSizeGroup The municipal population size groups using the population of 2013. It
uses the same categories that Environment Canada: 1-‐population less than 1,000; 2-‐population 1,001-‐1,999; 3-‐Population 2,000-‐4,999; 4-‐ Population 5,000-‐49,999; 5 population 50,000-‐499,999 and category 6 has a population over 500,000.
IntResConecServedWDS How many residential connections are served by this water distribution system? (#)
PctPopServedWDS What percent of the residential population is served by this water distribution system? (%)
PctSF What percent of residents in your municipality live in Single Family Homes? (Data from Census 2011)
PctMF What percent of residents in your municipality live in multi-‐family homes? (Data from Census 2011)
intAvgDwelling Average persons in the dwelling (Data from 2011 Census)Pct_DomUse What percent of total annual water distributed by your system is
delivered to the residential sector? (%)Residential WaterUse_AnnualM3
Annual water delivered to residential in cubic meters, calculated using total water consumption (TotalAnnualVol_M3) and the percent of water delivered to residential (Pct_DomUse)
booleanHasResidentialData Indicates if the municipality submitted residential consumptionlpcd_res Residential water used percapita per day in liters (lpcd), it is
calculated as the residential consumption (Residential WaterUse_annualM3) divided by the responding population (RespondingPop) divided by 365
Pct_DomUseSF What percent of total annual water distributed by your system is delivered to the residential sector to Single Family dwellings? (%)
Pct_DomUseMF What percent of total annual water distributed by your system is delivered to the residential sector to Multi Family dwellings? (%)
Pct_ICIUse What percent of total annual water distributed by your system is delivered to industrial/commercial/institutional sectors? (%)
ICIWaterUse_AnnualM3 Annual water delivered to ICI in cubic meters, calculated using the total consumption (TotalAnnualVol_m3) and percent of water delivered to ICI (pct_ICIUse)
Pct_OnlyIndUse What percent of total annual water distributed by your system is delivered to the industrial sector? (%)
Pct_OnlyComUse What percent of total annual water distributed by your system is delivered to the commercial sector? (%)
Pct_OnlyInstUse What percent of total annual water distributed by your system is delivered to the institutional sector? (%)
Method ICI Breakdown What estimation method is used to determine the percentages of the total in the ICI sector?
Pct_OnlyAgrUse What percent of total annual water distributed by your system is delivered to the agricultural sector? (%)
Method Agr Breakdown What estimation method is used to determine the amount of water delivered to the agricultural sector?
Pct_UnaccountedUse What percent of the total system water is unaccounted for?str_UnaccountedUse The municipality considered the unaccounted use included in the
100% breakdown of usesMethod Losses What estimation method is used to calculate the percentage of total
unaccounted water?Metering policy Which best describes your municipal water metering policy?MeteringPolicy_Res Categorical variable describing the metering policy for the residential
sector.PctPopServedSFMeters What percentage of single-‐family homes have water meters?strScopeSF-‐SurveySummary Single Family Residential Pricing Policy, above 50% it is considered
that the municipality charges volumetricallyPctPopServedMFMeters What percentage of multi-‐family homes have water meters?strScopeMF-‐SurveySummary Multi family pricing policy. While multifamily units often have a meter
for the entire complex, we counted multifamily homes as metered only if they lived in a municipality with a universal metering policy. Thus those multifamily homes without individual meters were not counted as metered.
PctServedIndMeters What percentage of your industrial water connections are metered?PctServedComMeters What percentage of commercial water connections are metered?PctServedInstMeters What percentage of your institutional water connections are
metered?PctServedAgrMeters What percentage of your agricultural water connections are metered?
PctServedICIMeters What percentage of your industrial, commercial, and institutional water connections are metered?
Year Metering Data Year for Data on Metering CoverageYear Metering Beginning When did your municipality's water metering policy come into effect?Effectiveness of metering On a scale of 1 to 9, with 1 being extremely ineffective, 5 being
neither effective nor ineffective, and 9 being extremely effective, how effective do you think your metering program has been in reducing water consumption?
Metering to detect leaks Has your municipality used household metering data to detect leaks in the water system?
Metering to evaluate conservation programs
Has your municipality used household metering data to evaluate the impacts of water conservation programs?
Study for URM in last 5 years In the past five years, has a study been conducted on requiring universal residential water metering in your municipality?
Author of the study If yes, who conducted the study?Disicentives for URM -‐ Comments
What are the main disincentives to adopting universal residential water metering in your municipality?
Disicentives for URM Previous research has identified six primary reasons for not adopting universal residential metering programs. Which of the following six apply to your municipality?
Main disicentive for URM Which of these is the primary reason for not adopting universal residential water metering in your municipality?
Comments Any additional relevant info
Variable Name Question/Definition
B C M u n i C i p a l W a t e r S u r v e y 2 0 1 6
28

Variable Name DefinitionINTMUNICIPALITIES_ID ID used in the 2009 Environment Canada reportintCensusID Stats Can's Census subdivision 7 digit codeMUNICIPALITY Name of the municipality
BylawNumber or name of the bylaw(s) that were used. It usually is the water related bylaw and/or the fee related bylaw
intBylawYear Year of the bylaw that were usedintFeeYear Year of the fee used
strScopeSFThe bylaw specifies a Volumetric pricing structure (Metered), a Flat pricing structure (Not metered) or both for Single Families dwellings
strScopeMFThe bylaw specifies a Volumetric pricing structure (Metered), a Flat pricing structure (Not metered) or both for Multi Families dwellings
RespondingPop
This is the population served by the water system. It used intPopulation201X according to the year of data for each municipality and according to the percent of the population served by the water system (PctPopServedWDS)
Pct_DomUseWhat percent of total annual water distributed by your system is delivered to the residential sector? (in %)
PctSF What percent of residents in your municipality live in Single Family Homes?PctMF What percent of residents in your municipality live in multi-‐family homes?strFeeUnit Unit used in the charge of the bylaw
strMeteredFeeTypeSFType of fee for metered single family users: Just consumption or they also have a base charge
intMeteredSFBillingPeriodBilling period for metered single family, in case where the household is billed quarterly but charged monthly it was used monthly
booleanMeteredSFMinimum
The metered fee for single family dwellings considers a minimum charge which is the least amount to be paid in each billing cycle, even if no consumption is done: false=no, true=yes
intMeteredSFMinimum The minimum charge fee, the amount given here is for the billing period
booleanMeteredSFBaseThe metered fee considers a base charge which is an amount to be paid in addition to any volumetric charge: false=no, true=yes
strMeteredSFBase Name in the bylaw to the base charge
Variable Name Definition
strMeteredSFBase Name in the bylaw to the base chargeintMeteredSFBase0to5_8 The base charge fee, for connection up to 5/8" or 17mm. The amount given is annual
intMeteredSFBase3_4The base charge fee, for connection of 3/4" or 18-‐19-‐20 mm. The amount given is annual
intMeteredSFBase1 The base charge fee, for connection of 1" or 25-‐26 mm. The amount given is annualintMeteredSFBase5_4 The base charge fee, for connection of 1 1/4" or 32 mm. The amount given is annual
intMeteredSFBase6_4The base charge fee, for connection of 1 1/2" or 38-‐39-‐40 mm. The amount given is annual
intMeteredSFBase2 The base charge fee, for connection of 2" or 50-‐51 mm. The amount given is annualintMeteredSFBase10_4 The base charge fee, for connection of 2 1/2" or 64 mm. The amount given is annualintMeteredSFBase3 The base charge fee, for connection of 3" or 75-‐76 mm. The amount given is annual
intMeteredSFBase4The base charge fee, for connection of 4" or 100-‐101-‐102 mm. The amount given is annual
strMeteredSFAdditional Name in the bylaw to additional fee besides minimum and baseintMeteredSFAdditional The additional charge fee, the amount given here is annual, unless otherwise statedstrMeteredSFFeeComment Comments on the fee for metered SF
strMeteredSFBlockTypeThe type of block charge that metered users in single family are facing: CUC-‐Constant unit charge; IBR-‐Increasing block rate; DBR-‐Decreasing block rate
intMeteredSFCUCm3Customers are charged a uniform amount per unit. This is the constant amount per cubic meter
intMeteredSFBRLimit1Customers are charged in blocks. This is the upper limit of the first block, this quantity is "units". A "-‐" indicates it is from the last limit and more
intMeteredSFBRFee1m3 Customers are charged in blocks. This is the fee for the first block per m3
intMeteredSFBRLimit2Customers are charged in blocks. This is the upper limit of the second block, this quantity is "units". A "-‐" indicates it is from the last limit and more
intMeteredSFBRFee2m3 Customers are charged in blocks. This is the fee for the second block per m3
intMeteredSFBRLimit3Customers are charged in blocks. This is the upper limit of the third block, this quantity is "units". A "-‐" indicates it is from the last limit and more
intMeteredSFBRFee3m3 Customers are charged in blocks. This is the fee for the third block per m3
intMeteredSFBRLimit4Customers are charged in blocks. This is the upper limit of the fourth block, this quantity is "units". A "-‐" indicates it is from the last limit and more
BC Municipal Pricing Database
W a t e r P l a n n i n g l a b
U n i v e r s i t y o f b r i t i s h C o l U m b i a
29

Variable Name Definition
strMeteredSFBase Name in the bylaw to the base chargeintMeteredSFBase0to5_8 The base charge fee, for connection up to 5/8" or 17mm. The amount given is annual
intMeteredSFBase3_4The base charge fee, for connection of 3/4" or 18-‐19-‐20 mm. The amount given is annual
intMeteredSFBase1 The base charge fee, for connection of 1" or 25-‐26 mm. The amount given is annualintMeteredSFBase5_4 The base charge fee, for connection of 1 1/4" or 32 mm. The amount given is annual
intMeteredSFBase6_4The base charge fee, for connection of 1 1/2" or 38-‐39-‐40 mm. The amount given is annual
intMeteredSFBase2 The base charge fee, for connection of 2" or 50-‐51 mm. The amount given is annualintMeteredSFBase10_4 The base charge fee, for connection of 2 1/2" or 64 mm. The amount given is annualintMeteredSFBase3 The base charge fee, for connection of 3" or 75-‐76 mm. The amount given is annual
intMeteredSFBase4The base charge fee, for connection of 4" or 100-‐101-‐102 mm. The amount given is annual
strMeteredSFAdditional Name in the bylaw to additional fee besides minimum and baseintMeteredSFAdditional The additional charge fee, the amount given here is annual, unless otherwise statedstrMeteredSFFeeComment Comments on the fee for metered SF
strMeteredSFBlockTypeThe type of block charge that metered users in single family are facing: CUC-‐Constant unit charge; IBR-‐Increasing block rate; DBR-‐Decreasing block rate
intMeteredSFCUCm3Customers are charged a uniform amount per unit. This is the constant amount per cubic meter
intMeteredSFBRLimit1Customers are charged in blocks. This is the upper limit of the first block, this quantity is "units". A "-‐" indicates it is from the last limit and more
intMeteredSFBRFee1m3 Customers are charged in blocks. This is the fee for the first block per m3
intMeteredSFBRLimit2Customers are charged in blocks. This is the upper limit of the second block, this quantity is "units". A "-‐" indicates it is from the last limit and more
intMeteredSFBRFee2m3 Customers are charged in blocks. This is the fee for the second block per m3
intMeteredSFBRLimit3Customers are charged in blocks. This is the upper limit of the third block, this quantity is "units". A "-‐" indicates it is from the last limit and more
intMeteredSFBRFee3m3 Customers are charged in blocks. This is the fee for the third block per m3
intMeteredSFBRLimit4Customers are charged in blocks. This is the upper limit of the fourth block, this quantity is "units". A "-‐" indicates it is from the last limit and more
intMeteredSFBRFee4m3 Customers are charged in blocks. This is the fee for the fourth block per m3
intMeteredSFBRLimit5Customers are charged in blocks. This is the upper limit of the fifth block, this quantity is "units". A "-‐" indicates it is from the last limit and more
intMeteredSFBRFee5m3 Customers are charged in blocks. This is the fee for the fifth block per m3
intMeteredSFBRLimit6Customers are charged in blocks. This is the upper limit of the sixth block, this quantity is "units". A "-‐" indicates it is from the last limit and more
intMeteredSFBRFee6m3 Customers are charged in blocks. This is the fee for the sixth block per m3strMeteredSFSSAmount Shows the multiplier or specific seasonal chargestrMeteredSFSSConditions Explain when the seasonal multiplier occursstrMeteredSFFeeComment2 Additional comments regarding the volumetric rates or the seasonal surplus
strMeteredFeeTypeMFType of fee for metered multi family users: Just consumption or they also have a base charge
intMeteredMFBillingPeriodBilling period for metered multi family, in case where the household is billed quarterly but charged monthly it was used monthly
booleanMeteredMFMinimum
The metered fee for multi family dwellings considers a minimum charge which is the least amount to be paid in each billing cycle, even if no consumption is done: false=no, true=yes
intMeteredMFMinimum The minimum charge fee, the amount given here is for the billing period
booleanMeteredMFBaseThe metered fee considers a base charge which is an amount to be paid in addition to any volumetric charge: false=no, true=yes
strMeteredMFBase Name in the bylaw to the base chargeintMeteredMFBase0to5_8 The base charge fee, for connection up to 5/8" or 17mm. The amount given is annual
intMeteredMFBase3_4The base charge fee, for connection of 3/4" or 18-‐19-‐20 mm. The amount given is annual
intMeteredMFBase1 The base charge fee, for connection of 1" or 25-‐26 mm. The amount given is annualintMeteredMFBase5_4 The base charge fee, for connection of 1 1/4" or 32 mm. The amount given is annual
intMeteredMFBase6_4The base charge fee, for connection of 1 1/2" or 38-‐39-‐40 mm. The amount given is annual
intMeteredMFBase2 The base charge fee, for connection of 2" or 50-‐51 mm. The amount given is annualintMeteredMFBase10_4 The base charge fee, for connection of 2 1/2" or 64 mm. The amount given is annualintMeteredMFBase3 The base charge fee, for connection of 3" or 75-‐76 mm. The amount given is annual
B C M u n i C i p a l W a t e r S u r v e y 2 0 1 6
30

Variable Name Definition
intMeteredSFBRFee4m3 Customers are charged in blocks. This is the fee for the fourth block per m3
intMeteredSFBRLimit5Customers are charged in blocks. This is the upper limit of the fifth block, this quantity is "units". A "-‐" indicates it is from the last limit and more
intMeteredSFBRFee5m3 Customers are charged in blocks. This is the fee for the fifth block per m3
intMeteredSFBRLimit6Customers are charged in blocks. This is the upper limit of the sixth block, this quantity is "units". A "-‐" indicates it is from the last limit and more
intMeteredSFBRFee6m3 Customers are charged in blocks. This is the fee for the sixth block per m3strMeteredSFSSAmount Shows the multiplier or specific seasonal chargestrMeteredSFSSConditions Explain when the seasonal multiplier occursstrMeteredSFFeeComment2 Additional comments regarding the volumetric rates or the seasonal surplus
strMeteredFeeTypeMFType of fee for metered multi family users: Just consumption or they also have a base charge
intMeteredMFBillingPeriodBilling period for metered multi family, in case where the household is billed quarterly but charged monthly it was used monthly
booleanMeteredMFMinimum
The metered fee for multi family dwellings considers a minimum charge which is the least amount to be paid in each billing cycle, even if no consumption is done: false=no, true=yes
intMeteredMFMinimum The minimum charge fee, the amount given here is for the billing period
booleanMeteredMFBaseThe metered fee considers a base charge which is an amount to be paid in addition to any volumetric charge: false=no, true=yes
strMeteredMFBase Name in the bylaw to the base chargeintMeteredMFBase0to5_8 The base charge fee, for connection up to 5/8" or 17mm. The amount given is annual
intMeteredMFBase3_4The base charge fee, for connection of 3/4" or 18-‐19-‐20 mm. The amount given is annual
intMeteredMFBase1 The base charge fee, for connection of 1" or 25-‐26 mm. The amount given is annualintMeteredMFBase5_4 The base charge fee, for connection of 1 1/4" or 32 mm. The amount given is annual
intMeteredMFBase6_4The base charge fee, for connection of 1 1/2" or 38-‐39-‐40 mm. The amount given is annual
intMeteredMFBase2 The base charge fee, for connection of 2" or 50-‐51 mm. The amount given is annualintMeteredMFBase10_4 The base charge fee, for connection of 2 1/2" or 64 mm. The amount given is annualintMeteredMFBase3 The base charge fee, for connection of 3" or 75-‐76 mm. The amount given is annual
intMeteredMFBase4The base charge fee, for connection of 4" or 100-‐101-‐102 mm. The amount given is annual
strMeteredMFAdditional Name in the bylaw to additional fee besides minimum and baseintMeteredMFAdditional The additional charge fee, the amount given here is annual, unless otherwise statedstrMeteredMFFeeComment Comments on the fee for metered MF
strMeteredMFBlockTypeThe type of block charge that metered users in multi family dwellings are facing: CUC-‐Constant unit charge; IBR-‐Increasing block rate; DBR-‐Decreasing block rate
intMeteredMFCUCm3Customers are charged a uniform amount per unit. This is the constant amount per cubic meter
intMeteredMFBRLimit1Customers are charged in blocks. This is the upper limit of the first block, this quantity is "units". A "-‐" indicates it is from the last limit and more
intMeteredMFBRFee1m3 Customers are charged in blocks. This is the fee for the first block per m3
intMeteredMFBRLimit2Customers are charged in blocks. This is the upper limit of the second block, this quantity is "units". A "-‐" indicates it is from the last limit and more
intMeteredMFBRFee2m3 Customers are charged in blocks. This is the fee for the second block per m3
intMeteredMFBRLimit3Customers are charged in blocks. This is the upper limit of the third block, this quantity is "units". A "-‐" indicates it is from the last limit and more
intMeteredMFBRFee3m3 Customers are charged in blocks. This is the fee for the third block per m3
intMeteredMFBRLimit4Customers are charged in blocks. This is the upper limit of the fourth block, this quantity is "units". A "-‐" indicates it is from the last limit and more
intMeteredMFBRFee4m3 Customers are charged in blocks. This is the fee for the fourth block per m3
intMeteredMFBRLimit5Customers are charged in blocks. This is the upper limit of the fifth block, this quantity is "units". A "-‐" indicates it is from the last limit and more
intMeteredMFBRFee5m3 Customers are charged in blocks. This is the fee for the fifth block per m3
intMeteredMFBRLimit6Customers are charged in blocks. This is the upper limit of the sixth block, this quantity is "units". A "-‐" indicates it is from the last limit and more
intMeteredMFBRFee6m3 Customers are charged in blocks. This is the fee for the sixth block per m3strMeteredMFSSAmount Shows the multiplier or specific seasonal chargestrMeteredMFSSConditions Explain when the seasonal multiplier occursstrMeteredMFFeeComment2 Additional comments regarding the volumetric rates or the seasonal surplus
W a t e r P l a n n i n g l a b
U n i v e r s i t y o f b r i t i s h C o l U m b i a
31

Variable Name Definition
intMeteredMFBase4The base charge fee, for connection of 4" or 100-‐101-‐102 mm. The amount given is annual
strMeteredMFAdditional Name in the bylaw to additional fee besides minimum and baseintMeteredMFAdditional The additional charge fee, the amount given here is annual, unless otherwise statedstrMeteredMFFeeComment Comments on the fee for metered MF
strMeteredMFBlockTypeThe type of block charge that metered users in multi family dwellings are facing: CUC-‐Constant unit charge; IBR-‐Increasing block rate; DBR-‐Decreasing block rate
intMeteredMFCUCm3Customers are charged a uniform amount per unit. This is the constant amount per cubic meter
intMeteredMFBRLimit1Customers are charged in blocks. This is the upper limit of the first block, this quantity is "units". A "-‐" indicates it is from the last limit and more
intMeteredMFBRFee1m3 Customers are charged in blocks. This is the fee for the first block per m3
intMeteredMFBRLimit2Customers are charged in blocks. This is the upper limit of the second block, this quantity is "units". A "-‐" indicates it is from the last limit and more
intMeteredMFBRFee2m3 Customers are charged in blocks. This is the fee for the second block per m3
intMeteredMFBRLimit3Customers are charged in blocks. This is the upper limit of the third block, this quantity is "units". A "-‐" indicates it is from the last limit and more
intMeteredMFBRFee3m3 Customers are charged in blocks. This is the fee for the third block per m3
intMeteredMFBRLimit4Customers are charged in blocks. This is the upper limit of the fourth block, this quantity is "units". A "-‐" indicates it is from the last limit and more
intMeteredMFBRFee4m3 Customers are charged in blocks. This is the fee for the fourth block per m3
intMeteredMFBRLimit5Customers are charged in blocks. This is the upper limit of the fifth block, this quantity is "units". A "-‐" indicates it is from the last limit and more
intMeteredMFBRFee5m3 Customers are charged in blocks. This is the fee for the fifth block per m3
intMeteredMFBRLimit6Customers are charged in blocks. This is the upper limit of the sixth block, this quantity is "units". A "-‐" indicates it is from the last limit and more
intMeteredMFBRFee6m3 Customers are charged in blocks. This is the fee for the sixth block per m3strMeteredMFSSAmount Shows the multiplier or specific seasonal chargestrMeteredMFSSConditions Explain when the seasonal multiplier occursstrMeteredMFFeeComment2 Additional comments regarding the volumetric rates or the seasonal surplus
intFlatBillingPeriodBilling period for flat charged users, in case where the household is billed quarterly but charged monthly it was used monthly
strFlatBase Name in the bylaw to the base chargeintFlatBase0to5_8 The base charge fee, for connection up to 5/8" or 17mm. The amount given is annual
intFlatBase3_4The base charge fee, for connection of 3/4" or 18-‐19-‐20 mm. The amount given is annual
intFlatBase1 The base charge fee, for connection of 1" or 25-‐26 mm. The amount given is annualintFlatBase5_4 The base charge fee, for connection of 1 1/4" or 32 mm. The amount given is annual
intFlatBase6_4The base charge fee, for connection of 1 1/2" or 38-‐39-‐40 mm. The amount given is annual
intFlatBase2 The base charge fee, for connection of 2" or 50-‐51 mm. The amount given is annualintFlatBase10_4 The base charge fee, for connection of 2 1/2" or 64 mm. The amount given is annualintFlatBase3 The base charge fee, for connection of 3" or 75-‐76 mm. The amount given is annual
intFlatBase4The base charge fee, for connection of 4" or 100-‐101-‐102 mm. The amount given is annual
strFlatAdditional Name in the bylaw to additional fee besides minimum and baseintFlatAdditional The additional charge fee, the amount given here is annual, unless otherwise statedintFlatSF Quantity of the flat fee (annual) for single families
intFlatSFMeteredQuantity of the flat fee (annual) for single families, when mandatory metering is on place but refused
intFlatSFx2Quantity of the flat fee (annual) for single Family plus "basement or laneway or secondary suite or other"
intFlatSFx3 Quantity of the flat fee (annual) for single Family plus "any two of the former"intFlatMF Quantity of the flat fee (annual) for multi familystrFlatFeeComment Comments on the fee for flat users
B C M u n i C i p a l W a t e r S u r v e y 2 0 1 6
32
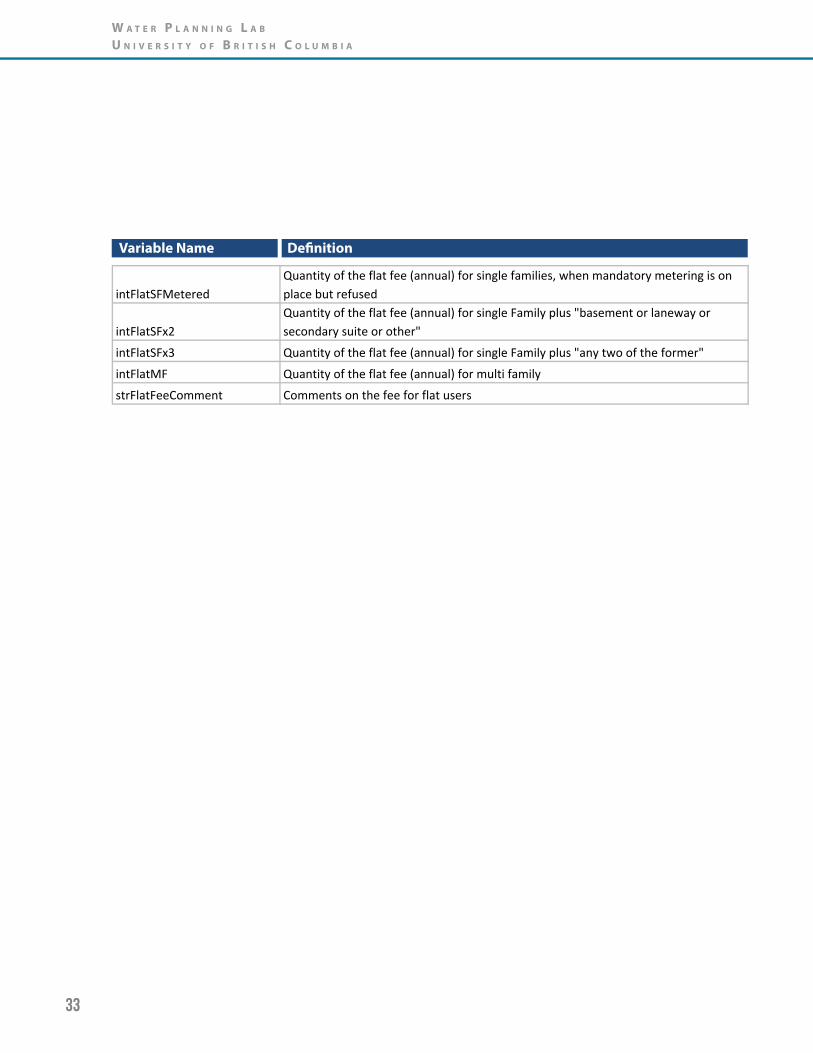
Variable Name Definition
intFlatBillingPeriodBilling period for flat charged users, in case where the household is billed quarterly but charged monthly it was used monthly
strFlatBase Name in the bylaw to the base chargeintFlatBase0to5_8 The base charge fee, for connection up to 5/8" or 17mm. The amount given is annual
intFlatBase3_4The base charge fee, for connection of 3/4" or 18-‐19-‐20 mm. The amount given is annual
intFlatBase1 The base charge fee, for connection of 1" or 25-‐26 mm. The amount given is annualintFlatBase5_4 The base charge fee, for connection of 1 1/4" or 32 mm. The amount given is annual
intFlatBase6_4The base charge fee, for connection of 1 1/2" or 38-‐39-‐40 mm. The amount given is annual
intFlatBase2 The base charge fee, for connection of 2" or 50-‐51 mm. The amount given is annualintFlatBase10_4 The base charge fee, for connection of 2 1/2" or 64 mm. The amount given is annualintFlatBase3 The base charge fee, for connection of 3" or 75-‐76 mm. The amount given is annual
intFlatBase4The base charge fee, for connection of 4" or 100-‐101-‐102 mm. The amount given is annual
strFlatAdditional Name in the bylaw to additional fee besides minimum and baseintFlatAdditional The additional charge fee, the amount given here is annual, unless otherwise statedintFlatSF Quantity of the flat fee (annual) for single families
intFlatSFMeteredQuantity of the flat fee (annual) for single families, when mandatory metering is on place but refused
intFlatSFx2Quantity of the flat fee (annual) for single Family plus "basement or laneway or secondary suite or other"
intFlatSFx3 Quantity of the flat fee (annual) for single Family plus "any two of the former"intFlatMF Quantity of the flat fee (annual) for multi familystrFlatFeeComment Comments on the fee for flat users
W a t e r P l a n n i n g l a b
U n i v e r s i t y o f b r i t i s h C o l U m b i a
33
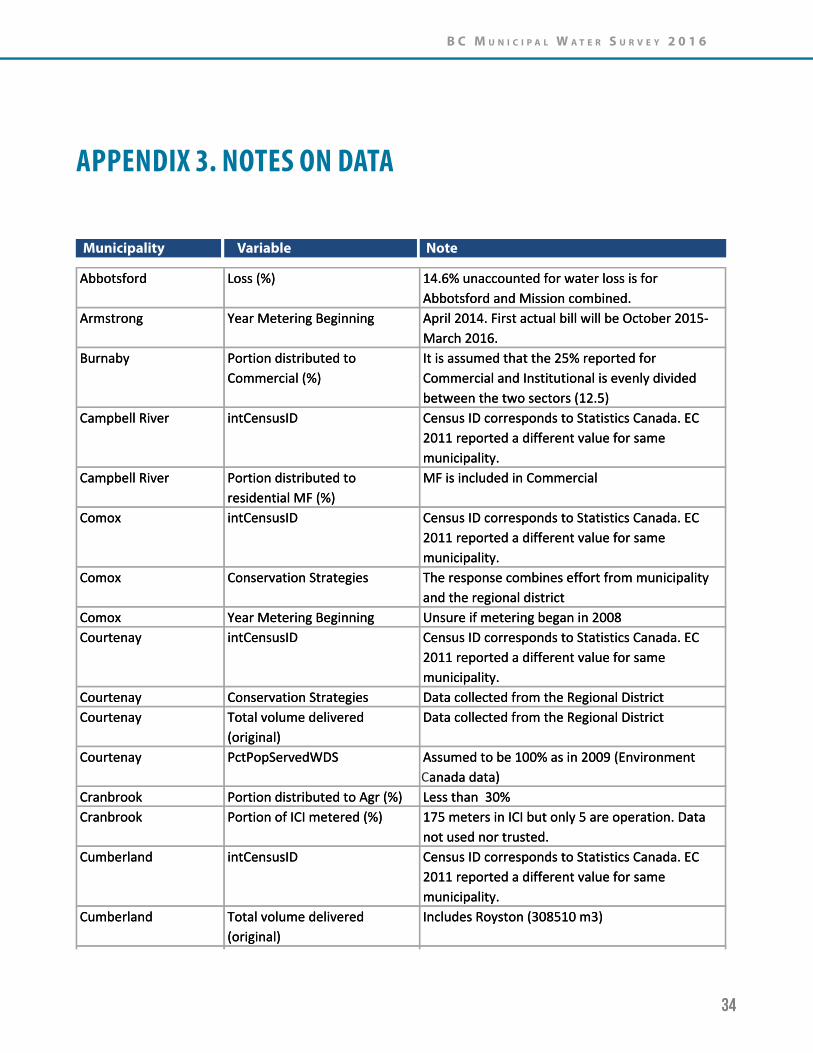
APPENDIX 3. NOTES ON DATA
Municipality Variable Note
Abbotsford Loss (%) 14.6% unaccounted for water loss is for Abbotsford and Mission combined.
Armstrong Year Metering Beginning April 2014. First actual bill will be October 2015-‐March 2016.
Burnaby Portion distributed to Commercial (%)
It is assumed that the 25% reported for Commercial and Institutional is evenly divided between the two sectors (12.5)
Campbell River intCensusID Census ID corresponds to Statistics Canada. EC 2011 reported a different value for same municipality.
Campbell River Portion distributed to residential MF (%)
MF is included in Commercial
Comox intCensusID Census ID corresponds to Statistics Canada. EC 2011 reported a different value for same municipality.
Comox Conservation Strategies The response combines effort from municipality and the regional district
Comox Year Metering Beginning Unsure if metering began in 2008Courtenay intCensusID Census ID corresponds to Statistics Canada. EC
2011 reported a different value for same municipality.
Courtenay Conservation Strategies Data collected from the Regional DistrictCourtenay Total volume delivered
(original)Data collected from the Regional District
Courtenay PctPopServedWDS Assumed to be 100% as in 2009 (Environment canada data)
Cranbrook Portion distributed to Agr (%) Less than 30%Cranbrook Portion of ICI metered (%) 175 meters in ICI but only 5 are operation. Data
not used nor trusted.Cumberland intCensusID Census ID corresponds to Statistics Canada. EC
2011 reported a different value for same municipality.
Cumberland Total volume delivered (original)
Includes Royston (308510 m3)
Delta Total volume delivered (original)
Data collected from Metro Vancouver
Delta Year Consumption Data Year not reported. Assumed 2013Gibsons Year Metering Beginning Residential in 2009; ICI long term but recently
more strictly implemented Greater Vancouver A intCensusID Census ID corresponds to Statistics Canada
Greater Vancouver A however we only report data for the University Endowment Lands.
B C M u n i C i p a l W a t e r S u r v e y 2 0 1 6
34
Abbotsford Loss (%) 14.6% unaccounted for water loss is for Abbotsford and Mission combined.
Armstrong Year Metering Beginning April 2014. First actual bill will be October 2015-‐March 2016.
Burnaby Portion distributed to Commercial (%)
It is assumed that the 25% reported for Commercial and Institutional is evenly divided between the two sectors (12.5)
Campbell River intCensusID Census ID corresponds to Statistics Canada. EC 2011 reported a different value for same municipality.
Campbell River Portion distributed to residential MF (%)
MF is included in Commercial
Comox intCensusID Census ID corresponds to Statistics Canada. EC 2011 reported a different value for same municipality.
Comox Conservation Strategies The response combines effort from municipality and the regional district
Comox Year Metering Beginning Unsure if metering began in 2008Courtenay intCensusID Census ID corresponds to Statistics Canada. EC
2011 reported a different value for same municipality.
Courtenay Conservation Strategies Data collected from the Regional DistrictCourtenay Total volume delivered
(original)Data collected from the Regional District
Courtenay PctPopServedWDS Assumed to be 100% as in 2009 (Environment canada data)
Cranbrook Portion distributed to Agr (%) Less than 30%Cranbrook Portion of ICI metered (%) 175 meters in ICI but only 5 are operation. Data
not used nor trusted.Cumberland intCensusID Census ID corresponds to Statistics Canada. EC
2011 reported a different value for same municipality.
Cumberland Total volume delivered (original)
Includes Royston (308510 m3)
Delta Total volume delivered (original)
Data collected from Metro Vancouver
Delta Year Consumption Data Year not reported. Assumed 2013Gibsons Year Metering Beginning Residential in 2009; ICI long term but recently
more strictly implemented Greater Vancouver A intCensusID Census ID corresponds to Statistics Canada
Greater Vancouver A however we only report data for the University Endowment Lands.
C

Delta Total volume delivered (original)
Data collected from Metro Vancouver
Delta Year Consumption Data Year not reported. Assumed 2013Gibsons Year Metering Beginning Residential in 2009; ICI long term but recently
more strictly implemented Greater Vancouver A intCensusID Census ID corresponds to Statistics Canada
Greater Vancouver A however we only report data for the University Endowment Lands.
Greater Vancouver A Municipality University Endowment Lands was surveyed. It is not a municipality but a part of Greater Vancouver A
Greater Vancouver A Total volume delivered (m3) Excluding the University of British Columbia, UEL consumed 613,972 cubic meters in 2014. UBC consumed 4192462 cubic meters
Greater Vancouver A Portion distributed to residential (%)
A "small portion" of the MF rate above goes to commercial use
Greater Vancouver A 2013Population Only considers UEL and population data from 2015
Greater Vancouver A SGC The code is for the unicorporated areas of greater Vancouver
Kamloops Portion distributed to Agr (%) Non PotableKamloops Portion of Agr metered (%) Metered only at intakeKamloops Year Metering Beginning Voluntary in 2008. Mandatory in 2011Kelowna Portion distributed to
residential MF (%)MF includes strata, which may be SF-‐type homes in strata properties (such as gated communities).
Kelowna Portion distributed to ICI (%) MF also includes mixed-‐use, as most mixed-‐use water is supposedly residential.
Maple Ridge Total volume delivered (original)
Data collected from Metro Vancouver
Mission Loss (%) 14.6% unaccounted for water loss is for Abbotsford and Mission combined.
Nakusp Portion distributed to Ind (%) Industrial and Institutional are included in the same category, and amount to 3%
North Vancouver City PctPopServedWDS Assumed to be 100% as in 2009 (Environment canada data)
North Vancouver District
Portion of ICI metered (%) Churches are considered ICI but are charged a flat rate
North Vancouver District
Portion distributed to residential MF (%)
Could only provide % of service connections, of which 94.3% are residential (92.9% SF, 1.4% MF) and 5.7% ICI
North Vancouver District
Portion distributed to residential (%)
Could only provide % of service connections, of which 94.3% are residential (92.9% SF, 1.4% MF) and 5.7% ICI
Penticton Year Metering Beginning Metering started in the 1960's (no specific year)
Municipality Variable Note
W a t e r P l a n n i n g l a b
U n i v e r s i t y o f b r i t i s h C o l U m b i a
35

North Vancouver City PctPopServedWDS Assumed to be 100% as in 2009 (Environment canada data)
North Vancouver District
Portion of ICI metered (%) Churches are considered ICI but are charged a flat rate
North Vancouver District
Portion distributed to residential MF (%)
Could only provide % of service connections, of which 94.3% are residential (92.9% SF, 1.4% MF) and 5.7% ICI
North Vancouver District
Portion distributed to residential (%)
Could only provide % of service connections, of which 94.3% are residential (92.9% SF, 1.4% MF) and 5.7% ICI
Penticton Year Metering Beginning Metering started in the 1960's (no specific year)Port Moody Portion distributed to ICI (%) 200 ICI connections are metered. Powell River Total volume delivered
(original)Residential & ICI
Prince George Portion distributed to residential SF (%)
The percentage is based on the sum of SF, Duplex, MF and Strata of 22286 connections
Prince George Portion distributed to residential MF (%)
2000 MF and Strata connections.
Prince George Portion distributed to Ind (%) Based on estimate of 10% for commercial and industrial combined
Prince George Portion distributed to Comm (%)
Based on estimate of 10% for commercial and industrial combined
Richmond Portion distributed to ICI (%) ICI includes agriculturalRichmond Portion distributed to Agr (%) ICI includes agriculturalRichmond Portion of residential MF
metered (%)9 Townhouses, 24 Apartments are metered
Surrey Residential connections (#) Number of residential connections also includes ICI
Surrey Portion distributed to Comm (%)
Some of the commercial may in fact include industrial uses
Vernon Year Metering Beginning Mid 1990's, with agriculture following suit in 2011Vernon Total volume delivered
(original)Considers only domestic (including commercial). Agricultural is 378930m3
Whistler Portion distributed to residential SF (%)
Assuming SF consumes double of MF
Whistler Portion distributed to ICI (%) Further estimated breakdown: Hotels 24.7% of total, Restaurants 18.85%, and "Other" 11.05%.
Whistler Portion of residential SF metered (%)
No accurate data on water meters as they are not currently used. Estimate that residential sector has 3285 water meters.
Whistler Portion of ICI metered (%) Best guess on industrial is 400 water meters.
Municipality Variable Note
B C M u n i C i p a l W a t e r S u r v e y 2 0 1 6
36

North Vancouver City PctPopServedWDS Assumed to be 100% as in 2009 (Environment canada data)
North Vancouver District
Portion of ICI metered (%) Churches are considered ICI but are charged a flat rate
North Vancouver District
Portion distributed to residential MF (%)
Could only provide % of service connections, of which 94.3% are residential (92.9% SF, 1.4% MF) and 5.7% ICI
North Vancouver District
Portion distributed to residential (%)
Could only provide % of service connections, of which 94.3% are residential (92.9% SF, 1.4% MF) and 5.7% ICI
Penticton Year Metering Beginning Metering started in the 1960's (no specific year)Port Moody Portion distributed to ICI (%) 200 ICI connections are metered. Powell River Total volume delivered
(original)Residential & ICI
Prince George Portion distributed to residential SF (%)
The percentage is based on the sum of SF, Duplex, MF and Strata of 22286 connections
Prince George Portion distributed to residential MF (%)
2000 MF and Strata connections.
Prince George Portion distributed to Ind (%) Based on estimate of 10% for commercial and industrial combined
Prince George Portion distributed to Comm (%)
Based on estimate of 10% for commercial and industrial combined
Richmond Portion distributed to ICI (%) ICI includes agriculturalRichmond Portion distributed to Agr (%) ICI includes agriculturalRichmond Portion of residential MF
metered (%)9 Townhouses, 24 Apartments are metered
Surrey Residential connections (#) Number of residential connections also includes ICI
Surrey Portion distributed to Comm (%)
Some of the commercial may in fact include industrial uses
Vernon Year Metering Beginning Mid 1990's, with agriculture following suit in 2011Vernon Total volume delivered
(original)Considers only domestic (including commercial). Agricultural is 378930m3
Whistler Portion distributed to residential SF (%)
Assuming SF consumes double of MF
Whistler Portion distributed to ICI (%) Further estimated breakdown: Hotels 24.7% of total, Restaurants 18.85%, and "Other" 11.05%.
Whistler Portion of residential SF metered (%)
No accurate data on water meters as they are not currently used. Estimate that residential sector has 3285 water meters.
Whistler Portion of ICI metered (%) Best guess on industrial is 400 water meters.
Municipality Variable Note
W a t e r P l a n n i n g l a b
U n i v e r s i t y o f b r i t i s h C o l U m b i a
37
APPENDIX 4. TECHNICAL NOTE ON METERING COVERAGE CALCULATIONSFrom the raw data collected, a few calculations are necessary to estimate metering coverage rates per housing type for the province. To estimate metering coverage rates, we rely on the response to the question “What percentage of single family homes are metered?” which is reported in the variable name PctPopServedSFMeters. We adopted the same question as previous Environment Canada surveys, and asked the equivalent question for multifamily homes.
First we multiply the total number of residential connections serviced by the percent residents that live in single family homes, as reported by Statistics Canada. This step makes the assumption that the proportion of residential connections in a municipality is similar to the proportion of the population distributed between single family and multifamily homes. Then, to move from a percentage value to an absolute value of single family homes with water meters, we then multiply the number of single family connections calculated in the previous step, with their response to our question regarding the percentage of single family homes metered. This provides us with the total number of single family homes that are metered, the sum of which is 107,595 metered homes (36%).
For multifamily homes, we followed the same procedure as above, but only include municipalities with universal metering policies. Here we assume that multifamily homes within a jurisdiction with a universal metering policy will also have individual metering, while multifamily units in a municipality without a universal metering policy are not individually metered. The sum of metered multifamily units is 62,882 (18%).
However, there is some ambiguity with regard to how to interpret the variable PctPopServedSFMeters since the variable
name implies a percent population while the question specifically asks for percent homes. While we can expect these two values to be similar, we are nevertheless making an assumption. More importantly, the ambiguity may lead to the calculation of different coverage rates for the province, since in one case the denominator is number of homes, while in another it the BC population.
In future studies, this ambiguity should be clarified. We suggest rewording this question to ask for the total number of individually metered connections for single family homes and multifamily homes, rather than percentages. Asking for the number of individual connections would also clarify if residents within multifamily homes are individually metered – also known as submetering. In some instances, we suspect that asking the question in percentage terms, rather than a total number of metered connections, led to underestimates of total metering coverage. For example, we suspect this may explain the low number of connections estimated in Vancouver.
We also feel that reporting metering coverage rates in terms of percent connections to be preferable than percent homes or percent population. There are many BC residents that are not connected to the municipal service area, and therefore it would be unfair to expect utilities to meter those not connected to the network.
B C M u n i C i p a l W a t e r S u r v e y 2 0 1 6
38

APPENDIX 5: WATER CONSERVATION MEASURES BY MUNICIPALITY
W a t e r P l a n n i n g l a b
U n i v e r s i t y o f b r i t i s h C o l U m b i a
39

B C M u n i C i p a l W a t e r S u r v e y 2 0 1 6
40

APPENDIX 5
W a t e r P l a n n i n g l a b
U n i v e r s i t y o f b r i t i s h C o l U m b i a
41
Water Planning lab
School of community and regional Planning
faculty of aPPlied ScienceS
univerSity of britiSh columbia
www.wpl.scarp.ubc.ca