Bayat and Moolla - TIPS
23
P A P E R S TIPS 2003 2 0 0 3 F O R U M Public Ò Private Participation in the Delivery of Water Services: The Case of Nelspruit Zunaid Moolla, Amiena Bayat andAbdul Giassuddien Parker Development Policy Research Unit School of Economics, University of Cape Town
Transcript of Bayat and Moolla - TIPS

P A P E R S
TIPS
2 0 0 32 0 0 3F O R U M
Public Ò Private Participation in the Delivery of Water Services:
The Case of Nelspruit
Zunaid Moolla, Amiena Bayat andAbdul Giassuddien Parker
Development Policy Research UnitSchool of Economics, University of Cape Town

Public – Private Participation in the Delivery of Water Services: The Case of Nelspruit
15 August 2003
Zunaid Moolla, Amiena Bayat and Abdul Giassuddien Parker
Prepared for
Trade and Industry Policy Strategies

2
TABLE OF CONTENTS
INTRODUCTION....................................................................................................... 4 THEORETICAL PERSPECTIVES ON PPP PROGRAMS......................................... 4 WATER SUPPLY IN NELSPRUIT: A BACKGROUND SKETCH............................... 8 RESEARCH FINDINGS.......................................................................................... 11 EXTENT OF COVERAGE....................................................................................... 11 THE QUALITY OF WATER SUPPLIED .................................................................. 12 TARIFFS AND AFFORDABILITY............................................................................ 12 NON-PAYMENT OF SERVICES............................................................................. 16 CUSTOMER MANAGEMENT................................................................................. 17 TECHNICAL MATTERS.......................................................................................... 18 CONCLUSION ........................................................................................................ 18 REFERENCES ....................................................................................................... 20 ANNEXURE 1 ......................................................................................................... 22

3
LIST OF TABLES
LIST OF FIGURES
TABLE 1: ACCESS TO WATER SUPPLY BY RACE (2001).....................................................11 TABLE 2: ACCESS TO SANITATION SERVICES BY RACE (2001) ........................................12 TABLE 3: TARIFF STRUCTURE FOR DOMESTIC CUSTOMERS (1998/1999).....................12 TABLE 4: TARIFF STRUCTURE FOR DOMESTIC CUSTOMERS (2002/2003).....................13 TABLE 5: SANITATION TARIFFS IN 1998/99 AND ADJUSTED FOR 2003............................14 TABLE 6: ESTIMATED WILLINGNESS TO PAY FOR VARIOUS SERVICES BY LOW-INCOME
HOUSEHOLDS (R/MONTH) ................................................................ ................................15 TABLE 7: AFFORDABILITY OF THOSE EARNING R800 1998/99 (R/MONTH).....................15 TABLE 8: AFFORDABILITY OF THOSE EARNING BETWEEN R801 AND R1500 IN 1998/99
(R/MONTH) ................................ ................................................................ ............................15 TABLE 9: AFFORDABILITY OF THOSE EARNING R800 IN 2003 (R/MONTH).....................16 TABLE 10: AFFORDABILITY OF THOSE EARNING BETWEEN R800 AND R1,500 IN 2003
(R/MONTH) ................................ ................................................................ ............................16
FIGURE 1: MONTHLY BILLS FOR CONSUMPTION OF 10, 15 AND 20 KL OF WATER......13 FIGURE 2: COMPARISON OF WATER BILLS 1998/99 AND 2003 (CONSTANT 2003 RANDS)
................................................................ ................................................................ ................14

4
INTRODUCTION The provision of basic services to deprived communities is an overriding policy objective for most of South Africa’s local governments that aim to improve the living conditions of residents. What is perhaps more equivocal is the question about who should be providing these services. The issue has gained currency over the recent past as some municipalities entered into partnership arrangements with the private sector to deliver services that range from water and sanitation to refuse collection. The decision to contract private firms for service delivery has revived the old debate about the respective roles of the state and market in economic growth and development. The introduction of Public – Private Participation programs (PPP), a variant of privatised service delivery, is seen by some as offering a possible balance between state and market provision. But, here too, opinions are divided over whether this is an appropriate solution in the case of an essential good like water.
The rationale for PPPs, according to those municipal officials who have opted for this mode of delivery, is that it is necessitated by the lack of human and financial resources that many local governments face in South Africa. They argue that dramatic increases in the population that require services, limited budgets, a chronic lack of capacity (especially insofar as technical and managerial personnel are concerned) and the constitutional imperative to ensure service delivery, compel municipalities to seek alternative approaches to providing basic services. In the case of water supply, those in favour of PPPs believe that a regulatory framework that allows the municipality some degree of control over quality, tariffs, levels of service and social responsibility is the preferred route to take.
In 1996 the local authority of Nelspruit, in conjunction with the Department of Constitutional Development and the Development Bank of Southern Africa (DBSA), proposed a public -private partnership to deliver water and sanitation services for Nelspruit. The aim of the project was to eradicate the backlog of services in marginalised areas such as KaNyamazane and Mpakeni in the first phase. Other areas such as Zwelitsha would be incorporated into the scheme within one year after the commencement of the project. Secondly, the overall improvement in service would be integrated with broader developmental projects that were planned such as the Maputo Development Corridor, allowing Nelspruit to maximise its investment potential.
This paper assesses the extent to which the PPP has been able to fulfil the original objectives of water provision for the greater Nelspruit area. The paper also examines the impact of the PPP on the poor with special reference to poverty alleviation and general improvements to quality of life for the residents in the area.
THEORETICAL PERSPECTIVES ON PPP PROGRAMS On the face of it the advent of PPPs appears to be a pragmatic response to dire social conditions rather than a politically inspired ideology. By contrast, the privatisation of several state-owned enterprises since the establishment of political democracy in South Africa is an indication of the central government’s overt preference for private over public ownership and control of key sectors of the economy. Some observers (Ruiters and Bond, 2000; Hall, 2001) believe, however, that PPPs also reflect the increasing withdrawal of local government from critical areas of intervention in social and economic reconstruction including the provision of basic services. In their criticism of privatised utilities they point out that good quality basic services have been historically provided by the state to most white South Africans. In so far as developed countries are concerned, they argue that since industrialization the state has been the main, if not the only, provider of water services. Moreover, they demonstrate that governments were able to do this at relatively low cost. That these services are now being contracted out to the private sector is seen as casting the poor to the mercy of the market and a defeat of the developmental purposes of local government.

5
The main assumptions that underpin PPPs are that private companies are able to provide basic services more efficiently and, hence, at lower cost than the public sector. Other assumptions are that PPPs open the delivery of services to competition (which also leads to greater allocative and technical efficiency), operate under a hard budget constraint (unlike local authorities) and gradually lead to higher rates of productivity of workers. With the increase in growth of privatisation since the eighties, especially in developing countries usually under pressure from International Financial Institutions, it is now possib le to evaluate these assumptions against the empirical evidence. To undertake a comprehensive comparison of case studies of full and partial privatisation of utilities in Africa and elsewhere is, unfortunately, beyond the scope of this paper. We have chosen instead to review some of the empirical evidence that has been gathered from research on privatisation of water services in different countries in order to establish a framework for the analysis of the PPP in Nelspruit and the reasons why it was adopted in favour of other possible policy options. In the process we hope to highlight some of the successes and failures of this approach to delivery of services and the lessons that could be learned with respect to meeting the needs of poor communities.
Alfaro, Bradburd and Briscoe (1997) find that there are several reasons for the generally poor performance of public water utilities: Firstly, water and sewage service is a natural monopoly, even more so than electricity or telecommunications services. As a result, customers cannot easily impose discipline on a utility that offers an inferior price/service combination. Thus both market and bureaucratic constraints on management efficiency are weak. Secondly, government, as owner and operator of water utilities, has multiple objectives and no explicit approaches for making the appropriate tradeoffs between them. Thirdly, in public -owned firms, there is no person or group who gets the profits, no “residual claimant” whose overriding goal, subject to socially determined constraints, is maximising the difference between revenues and costs. This lack of residual claimant, or senior managers whose income is strongly performance-determined, also means there is often no one with a strong incentive to vigorously resist polit ical plunder of the utility.
The main raison d’être for public utilities, according to the authors, is the view that water is a merit good and this created strong pressure for government-owned utilities to subsidise water tariffs so that poor and low-income families would not be priced out of the market. Despite good intentions, the real price of water under the social tariff regime was very high for many poor and low-income families and probably higher than it would have been without a social tariff. The social tariff usually operated in a manner that left water utilities without financial resources to properly maintain existing delivery systems, much less to expand and upgrade coverage. In many cases water tariffs were set below costs of production, often below short-run operating costs. Operating revenues were thus far below the level necessary to sustain an investment program. This meant that when government subsidies dried up, it was impossible to extend services to cover all.
In a similar vein Bradburd (1995) argues that there are several reasons to believe that public enterprises will be less efficient than private enterprises producing the same product. First, there is no residual claimant in a public enterprise that receives the profits. Consequently there may be nobody with a compelling interest in ensuring that the difference between revenues and costs is as large as possible. Employees of public enterprises have an incentive to capture as many rents within the firm as possible whereas the extent of rent capture in private firms is likely to be smaller. Second, managers in public enterprises are largely shielded from the effects of the market for corporate control. Managers of private firms are forced to keep profits up out of fear that low earnings will encourage a corporate takeover. Third, managers of public enterprises must often try to satisfy multiple objectives determined by politicians. He finds that the soft budget constraint of public enterprises also plays a role in promoting inefficiency. Finally, the risk-reward structure in public enterprises is less encouraging to risk taking and innovation than is true for private enterprises. He cites three

6
studies for water utilities that found private firms to be more efficient than public firms by amounts ranging from 15% to 40%.
For Tova Maria Solo (1998) efficient, large-scale, monopolistic companies may be the best alternative in Europe and the United States, where everyone can pay for - and everyone wants - a standard metered water connection and a sewerage hookup. But it is hard to replicate such efficiencies in the utility companies of developing countries. Where needs and conditions differ from one neighbourhood to the next, there is a case to be made for a range of services and providers. For Solo the operational efficiency of the small-scale operators compares well with the large-scale suppliers. In the research that she cites on Haiti and four West African countries there were virtually no water losses among the private providers reported even with an employee client ratio of one to 500. The study in Guatemala compared two private aqueduct and sanitation systems with the state water company and found that investment costs per new customer were 20% and 60% lower for the small-scale private companies than for the state utility, operating costs 72% and 77 % lower, and administrative costs 92 % and 95 % lower. The ratio of income to expenses was 1:18 and 1:37 for the small-scale operators, compared with 1:47 for the public company.
The study of Haiti and four West African countries also found that of 25 municipal water supply companies reviewed, only those in cities of more than 100,000 people were operating in the black. And while the official water companies enjoyed monopoly rights to serve in these cities, they reached no more than 65% of the population, leaving the private, small-scale sector to cover the low-income families. Solo’s conclusion is that small private water and sanitation businesses are profitable, unlike most single -source utilit ies, which seem to need a critical mass of high-income clients to make a profit.
Kate Bayliss (2002), however, presents a different view. She agrees that in much of Sub Saharan Africa (SSA), the institutional structure of the public sector is weak and that for some; this presents a reason to privatise. The consequent weak regulatory capacity could, in her opinion, also be a reason for retaining water in the public sector. In some parts of SSA, water has been provided effectively by the public sector. This is not to say, however, that these will not be privatised. Botswana, Namibia, Burkina Faso and the South African district of Odi all demonstrate positive results from the public provision of water.
Her research findings showed that in Botswana the Water Utilities Corporation (WUC) substantially increased the proportion of the population with access to safe water over the period from 1970 and 1998. The population served increased from 30,000 to 330,000 while the average daily consumption rose – from five to 84 mega-litres. The WUC operates on commercial principles and sets tariffs which allow a ‘fair’ return on its services and assets employed. The corporation maintains a policy of cross-subsidy to ensure that domestic consumers at the lowest band have access to water supplies. A Chief Executive who is accountable to a Board of Directors which consists of six to eight members heads the corporation. The board members are appointed by the Minister of Mineral Resources and Water Affairs.
Her findings for Namibia and Burkina Faso are equally positive. In Namibia, the Namibian Water Corporation Ltd (NamWater) was officially registered as a company on 9th December 1997 and started business as a fully government owned company on 1 April 1998. It supplies water in bulk to industry, municipalities and the Directorate of Rural Water Supply. The company’s operations are financed through the sale of water and to a lesser extent irrigation water to farming communities. All surpluses are accumulated into a fund which is used to finance capital development renewal expenditure and reduces the need for external borrowing. NamWater receives a government subsidy which will be phased out over a period of five years. In 2000, the company redesigned the tariff structure on a zone basis to enable cross subsidy.
There were a number of layoffs in the restructuring. Total employee numbers were reduced from 1180 to 975. For the staff that remained, wages and benefits increased, working
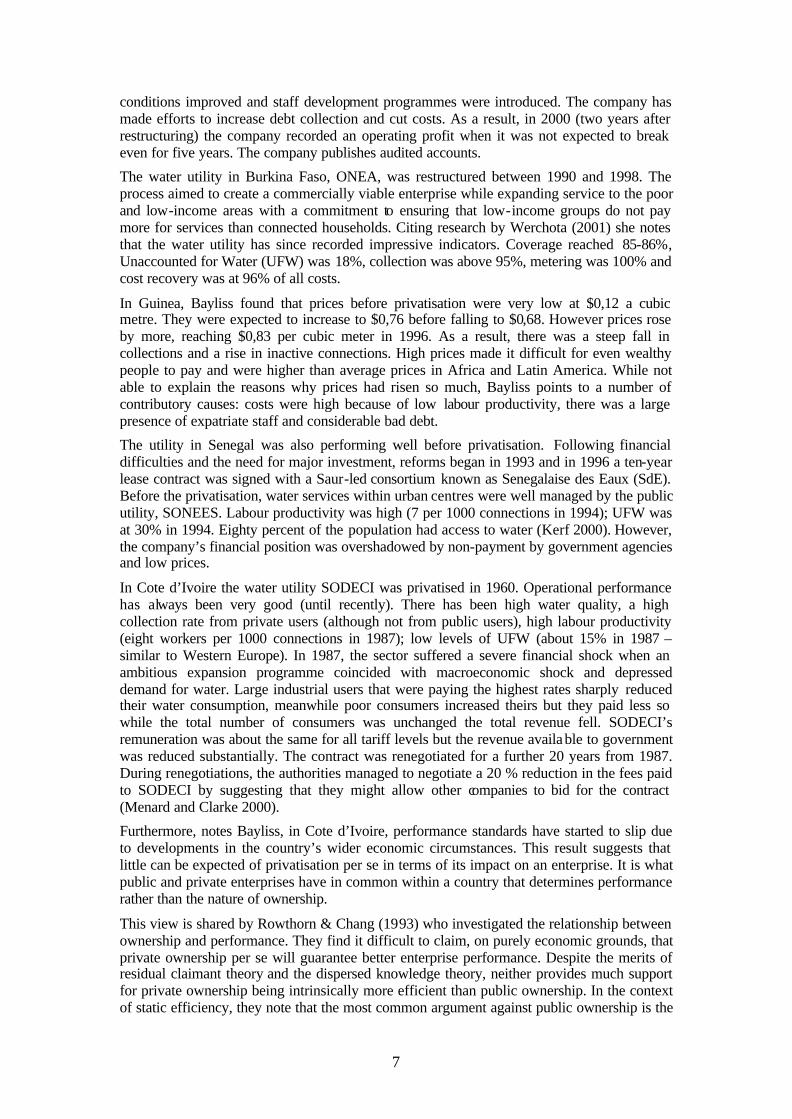
7
conditions improved and staff development programmes were introduced. The company has made efforts to increase debt collection and cut costs. As a result, in 2000 (two years after restructuring) the company recorded an operating profit when it was not expected to break even for five years. The company publishes audited accounts.
The water utility in Burkina Faso, ONEA, was restructured between 1990 and 1998. The process aimed to create a commercially viable enterprise while expanding service to the poor and low-income areas with a commitment to ensuring that low-income groups do not pay more for services than connected households. Citing research by Werchota (2001) she notes that the water utility has since recorded impressive indicators. Coverage reached 85-86%, Unaccounted for Water (UFW) was 18%, collection was above 95%, metering was 100% and cost recovery was at 96% of all costs.
In Guinea, Bayliss found that prices before privatisation were very low at $0,12 a cubic metre. They were expected to increase to $0,76 before falling to $0,68. However prices rose by more, reaching $0,83 per cubic meter in 1996. As a result, there was a steep fall in collections and a rise in inactive connections. High prices made it difficult for even wealthy people to pay and were higher than average prices in Africa and Latin America. While not able to explain the reasons why prices had risen so much, Bayliss points to a number of contributory causes: costs were high because of low labour productivity, there was a large presence of expatriate staff and considerable bad debt.
The utility in Senegal was also performing well before privatisation. Following financial difficulties and the need for major investment, reforms began in 1993 and in 1996 a ten-year lease contract was signed with a Saur-led consortium known as Senegalaise des Eaux (SdE). Before the privatisation, water services within urban centres were well managed by the public utility, SONEES. Labour productivity was high (7 per 1000 connections in 1994); UFW was at 30% in 1994. Eighty percent of the population had access to water (Kerf 2000). However, the company’s financial position was overshadowed by non-payment by government agencies and low prices.
In Cote d’Ivoire the water utility SODECI was privatised in 1960. Operational performance has always been very good (until recently). There has been high water quality, a high collection rate from private users (although not from public users), high labour productivity (eight workers per 1000 connections in 1987); low levels of UFW (about 15% in 1987 – similar to Western Europe). In 1987, the sector suffered a severe financial shock when an ambitious expansion programme coincided with macroeconomic shock and depressed demand for water. Large industrial users that were paying the highest rates sharply reduced their water consumption, meanwhile poor consumers increased theirs but they paid less so while the total number of consumers was unchanged the total revenue fell. SODECI’s remuneration was about the same for all tariff levels but the revenue available to government was reduced substantially. The contract was renegotiated for a further 20 years from 1987. During renegotiations, the authorities managed to negotiate a 20 % reduction in the fees paid to SODECI by suggesting that they might allow other companies to bid for the contract (Menard and Clarke 2000).
Furthermore, notes Bayliss, in Cote d’Ivoire, performance standards have started to slip due to developments in the country’s wider economic circumstances. This result suggests that little can be expected of privatisation per se in terms of its impact on an enterprise. It is what public and private enterprises have in common within a country that determines performance rather than the nature of ownership.
This view is shared by Rowthorn & Chang (1993) who investigated the relationship between ownership and performance. They find it difficult to claim, on purely economic grounds, that private ownership per se will guarantee better enterprise performance. Despite the merits of residual claimant theory and the dispersed knowledge theory, neither provides much support for private ownership being intrinsically more efficient than public ownership. In the context of static efficiency, they note that the most common argument against public ownership is the

8
‘soft budget constraint’ – that there is no incentive to economise on resources because they can always claim more from the state budget. The solution proposed here by the authors is to abolish or limit subsidies, which is more efficient than privatisation because it avoids transaction costs. Under dynamic efficiency they argue that it is not only agents in the public sector who block structural change but also private agents because what matters is political influence and not ownership per se.
David Hall (2001) observes that there have been problems with privatised management of water systems through all forms of PPPs, whether concessions, leases, management contracts, or build-operate-transfer (BOTs). He includes in this list the following:
§ A lack of competition, with two globally dominant multinational companies § Higher prices, often caused by privatisations used to make debt reductions § Difficulty in terminating unsatisfactory concessions § Poor results from private management § Private sector reluctance to extend water and sanitation access to the poor § Multinationals use of water profits to subsidise other global investments § Difficulty in regulation, lack of transparency, secrecy and cases of corruption
Hall’s research also leads him to conclude that public authorities have been able to operate successful Public Sector Water Undertakings (PWU) in transition and developing countries, as well as in developed countries. Among his findings are that:
§ PWUs score well on efficiency indicators, and have better public support § A PWU can take various forms, ranging from a department to a corporative body § Transparency, accountability and defined managerial autonomy can be built in § Business plans and pricing policies can include a range of cross-subsidies § PWUs can turn around their finances and improve collection of bills.
He cites examples of good practice by PWUs in a diverse range of countries, including Sao Paulo, Brazil; Debrecen, Hungary; Lilongwe, Malawi; Tegucigalpa, Honduras.
WATER SUPPLY IN NELSPRUIT: A BACKGROUND SKETCH Nelspruit occupies a strategic place in the economy of the Province of Mpumalanga. For several consecutive years it maintained an economic growth rate of 8% while that of the province was 3.7% and the national economic growth was a mere 1.8%. Its contribution of 6.1% to the provincial gross geographic product (GGP) made it the fastest growing economy in the country.
Much of this growth can be attributed to the Maputo Development Corridor (MDC), an ambitious development initiative in which Nelspruit is to serve as the hub of the new economic node that links Gauteng with the port at Maputo in Mozambique. The port is expected to play a vital role in the growth in trade between Southern Africa and the Pacific Rim.
In many ways Nelspruit resembles many of the other major urban centres or secondary cities in South Africa – the vast majority of its poor residents live a significant distance from the city centre (20km on average) and suffer high rates of unemployment and poverty. In the case of Nelspruit though, some of this can be attributed to the incorporation of several surrounding townships in 1995. The size of the population swelled from 24,000 to 202,000 with population growth rates increasing from 4.6% to 6.5% respectively. Some 40% of this population is in the zero – four-year age group, indicating the critical need for education, employment, housing, water and sanitation.
In the outlying areas where the unemployment rate ranges from 30% - 36%, the informal sector has become the main source of employment. The rate of unemployment for the town of Nelspruit is estimated to be 11.3%. For some 50% of households the joint monthly income is less than R500.

9
Soon after the incorporation of KaNyamazane, Msogwaba, Mpakeni and Matsulu , the lack of basic services was identified as a critical need, which if not given a high priority could severely inhibit growth and development of the area. The costs of providing basic services and meeting infrastructural backlogs, however, exceeded the amount allocated to the capital budget of the town council. The cost of various in-house delivery options that were considered was estimated to be around R350 million while the annual capital budget of R25 million was projected to grow at six percent a year. It was these circumstances that prompted the Council to investigate alternative service provision options.
In 1996 the local authority, in conjunction with the Department of Constitutional Development and the Development Bank of Southern Africa (DBSA), proposed a public -private partnership to deliver water and sanitation services for Nelspruit. The primary aim of the project was to eradicate the backlog of services in marginalised areas. KaNyamazane and Mpakeni would benefit in the first phase of delivery while other areas such as Zwelitsha, Msogwaba, and Daantjie would be incorporated into the scheme within one year after the commencement of the project. A secondary aim was to capture the growth and development opportunities that would emerge from other, larger projects such as the Maputo Development Corridor and thereby leverage the investment potential.
The DBSA assisted the Council in conducting various public information sessions from November 1996. The PPP was also discussed at several community meetings to address issues such as need, affordability and the impact that a resumption of payments would have on financial sustainability. During the process of consultation the South African Municipal Workers Union (SAMWU) emerged as one of the leading opponents of the PPP on the grounds that it was not an appropriate policy and that it would adversely affect its members.
Through a loan of R3.3 million from the Private Sector Investment Unit of the DBSA the Council was able to undertake research on the PPP which included a socio-economic survey and the collection of technical data. The DBSA constructed financial models using different levels of service, consulted a number of technical experts and helped to prepare the contracting and procurement procedures. The Municipal Infrastructure Investment Unit (MIIU) which is housed in the DBSA but operates under a separate identity provided further financing and technical advice. Several other experts from South Africa and abroad to cover the panoply of legal, engineering and financial studies that were required joined consultants from the DBSA and the MIIU.
The 'Request for Proposal' document and the framework for the agreement was prepared by DBSA with the assistance of an international firm of attorneys with similar international experiences. In December, 1996 the Council invited eight local, French and British companies to tender for the R330-million contract to a bidders' conference. The companies that qualified to bid were Murray & Roberts, General Des Eaux, Bechtel/LTA, BiWater, Aquafund, SAUR and WSSA.
At the bidders' conference the important conditions of the agreement that would have to be satisfied were specified. These were:
§ The standards and process for the provision of water and sanitation services would be set by the Council. Min imum standards would have to be adhered to according to national government policy.
§ A timetable would be set for the provision of certain levels of services and the achievement of the minimum standard and quality of services.
§ Metering, billing and revenue collection would be the responsibility of the concessionaire. This effectively releases the council from any financial obligations towards the company.
§ The financial risk of revenue collection would have to be carried by the concession holder but the council would remain in charge of regulating the tariff structure. The setting of the tariff would initially be made through the bidding process and would be stated in the concession document. Thereafter the agreement called for an annual escalation indexed to

10
the increase in the consumer price index, for the first five years. At the end of the five-year period the terms would be renegotiated.
BiWater was chosen as the preferred service provider and in April 1999 a formal contract was signed. A 30-year concession was signed with the Greater Nelspruit Utility Company (GNUC), a special purpose vehicle created by BiWater and a local empowerment partner. The main requirements of the contract include the upgrading of existing facilities, the design, financing and construction of new facilities and the operation and maintenance of all facilities.
Apart from regulating and monitoring the performance of GNUC, the Nelspruit Council remained responsible for other aspects of the contract such as
§ Applying the contract and legislation § Approving tariffs § Approving quality and levels of service § Monitoring capital investment and performance targets § Ensuring consistency with IDP (including environmental management)
The installation of new infrastructure, particularly the extension of the water services network, was another important issue that needed to be resolved. The cost of extensions to the existing sewage treatment plants, the building of reservoirs, water pressure towers, trunk lines and internal reticulation could not be borne by GNUC as it felt that the provision of such additional services would have negatively affected its profit. To reduce the cost of water services to consumers two solutions were proposed. The first was to use all possible RDP grants from government and the second was for Council to make its share of equitable payments from Central Government available to GNUC in the form of a consumer token for the purchase of services.
These arrangements would ensure that all residents will have access to RDP level services within five years (standpipes within 200 metres and pit latrines).
The total finance required for this project was R156 million, of which 20% had to come from the successful bidder. The agreement concluded with GNUC was that it would also service the existing municipal loans of R59 million. The cash flow projected by GNUC therefore had to be adequate to cover operations and maintenance costs, servicing of the loan as well as its profits. Responsibility for collecting service fees, exercising credit control and disconnecting services where necessary would rest with GNUC.
With respect to tariffs, it was agreed that increases would be linked to the CPI and would be generally lower for the average consumer as a result of operating efficiencies and stepped tariff levels.
In an article in African Eye News Service in April, 2003 journalists Sizwe Samayende & Justin Arenstein reported that in August 2002 GNUC officially suspended all infrastructure projects. They claim that this is in response to a rates boycott that is costing the consortium R13 million per year. Quoting from leaked letters, Samayande and Arenstein say that Brian Sims, Managing Director of GNUC, warned that the losses are so great the consortium’s foreign shareholders will pull out of the deal unless Nelspruit’s umbrella municipality, the Mbombela Council, agrees to an immediate R72 million rescue package over the next seven years.
The reporters claim that GNUC is also pushing for an additional tariff holiday that may cause taxpayers to lose R109 million over the remainder of the concession period. In the relief measures GNUC proposed a dramatic R18 million reduction in its loan repayments to Mbombela, as well as the scrapping of lease payments to council worth R4 million per year, amounting to R28 million over the next seven years. Other demands, according to the journalists, were that electricity tariffs to operate infrastructure be reduced, allowing GNUC to save R800,000 a year, and that council performance auditing fees be decreased by

11
R750,000 per year. If agreed to, the reductions in tariffs would mean that taxpayers would have to absorb a R43.4 million loss over the concession contract’s remaining 28-years.
This was likely to force GNUC to lobby for a higher than planned 10% rates increase in Nelspruit’s former white suburbs and also to ask for an increase of R700,000 per year in the council’s existing R2.2 million annual subsidy to deliver a minimum of 6000 litres per household a month free-of-charge.
RESEARCH FINDINGS The primary objective of this research paper is to assess the impact that the Nelspruit PPP for the provision of water services has had on poor residents. The main criteria considered in this paper for determining the effectiveness of the PPP on the poor are the following:
§ The extent of coverage (population served and quantity supplied) § The quality of the water supplied § The price that consumers of water have to pay (tariffs and affordability) § Customer management (meter readings, billing, payment points and credit control) § Technical matters (unaccounted for water, management, operation and maintenance of
infrastructure, etc) § General views of various stakeholders
EXTENT OF COVERAGE Census 1996 data suggests that there were approximately 91,600 households living in what is now called Mbombela municipality. Of the total population 65% enjoyed water either inside their dwelling or on site. Thirty five percent of the population relied on other sources of water including boreholes, springs etc. Only 27% of the population had access to a flush toilet, while 66% of the population made use of pit latrines. Seven percent of the population was not served at the time.
The picture that emerges from the 2001 Census data is that the number of households in Mbombela municipality increased from 91,600 to 112,000 since 1996. This represents a 22% increase in the number of new households that have been established over this period.
Table 1: Access to water supply by race (2001)
Black Coloured Asian White Total
Piped water inside dwelling 15% 51% 90% 85% 21% Piped water inside yard 36% 21% 6% 10% 34% Piped water on community stand: distance less than 200m from dwelling 14% 7% 1% 1% 12% Piped water on community stand: distance greater than 200m from dwelling 21% 10% 3% 3% 20% Spring/borehole/other 15% 11% 0% 1% 13%
Total 100% 100% 100% 100% 100% [Source: Census 2001]
The table shows that in 2001 only 67% of the population had access to adequate levels of water services (adequate water services are defined as those people who have access to piped water inside as well as outside their dwellings and communities who are provided with water on a community stand provided that the distance is less than 200m from the ir dwelling). Overall, African households in the area are worst off in that more than a third (36%) of all households still don’t have access to adequate water supply services. Thus despite the fact that capital investments were undertaken in the initial stages of the contract, the influx of people into the region has meant that the backlog in water services is still relatively the same as what it was in the past. If people continue to migrate to the area in search of economic

12
opportunities then the backlog in water services will increase as the GNUC has suspended its capital operations due to high levels of non-payment in the area.
Table 2: Access to sanitation services by race (2001)
African Coloured Asian White Total Flush toilet (connected to sewerage system) 17% 58% 93% 83% 23% Flush toilet (with septic tank) 1% 2% 3% 15% 2% Chemical toilet 2% 1% 0% 0% 2% Pit latrine with ventilation (VIP) 12% 6% 1% 0% 11% Pit latrine without ventilation 56% 26% 2% 0% 51% Bucket latrine 1% 0% 0% 0% 1% None 11% 6% 1% 1% 10% Total 100% 100% 100% 100% 100% [Source: Census 2001]
In 1996, 27% of all households had access to a flush toilet. Sixty-six percent of the population had access to pit latrines while roughly seven percent of the population were not served. The 2001 Census data indicate that roughly the same amount of people have access to flush toilets and pit latrines. However, although 66% of the population still relied on pit latrines, only 11% had access to a VIP (ventilated improved pit) with the vase majority relying on pits without ventilation. The backlog of people who do not have access to any service at all increased to 10%. African households are the worst off in that 68% of the population does not have access to an adequate level of service. Eleven percent of these households are currently not served.
The conclusion that can be drawn from the data is that there has been no change in the percentage of individuals who have access to adequate water services. The backlog in sanitation services has grown and it is anticipated that the backlog in adequate water services will increase as GNUC has suspended capital investments in the areas as a result of non-payment for services. The increase in the backlog will probably be exacerbated by the mass migration of people into the area seeking economic opportunities.
THE QUALITY OF WATER SUPPLIED The quality of water in urban and semi-urban areas is of a very good quality since GNUC is compelled to adhere to the quality standards stipulated by the South African Bureau of Standards (SABS). There is no verifiable information available on the quality of water in rural areas, but interviews with key personnel at the local authority indicated that water quality in the rural areas needs improvement.
TARIFFS AND AFFORDABILITY In 1998, before the introduction of the partnership with BiWater, residents in the then Nelspruit TLC were charged the following tariffs for water supply.
Table 3: Tariff structure for domestic customers (1998/1999)
Consumption Tariff per kl
0 – 6 kilolitre R 1,14 7 – 30 kilolitre R 1,65 31 - 100 kiloliter R 1,84 Over 100 kilolitre R 2,00
[Source: Mbombela Municipality]
The municipality employed a rising block tariff structure. The major advantage of using a rising block tariff structure instead of a constant per kl charge is that it reduces the costs of the service to small users who are usually the poor.

13
The tariff structure has changed since 1998/99, partly as a result of the free basic water policy of government. The primary intention of the policy is to ensure that no one is denied access to water supply simply because they are unable to pay for the service. Underlying this policy is the recognition that the supply of water at a basic level has numerous positive impacts on society including equity and poverty alleviation. The 6kl of free basic water draws on the World Health Organisation’s standard of 25 litres per person per day. This amount is about 6,000 litres (6kl) per household per month for a household of eight people.
The tariffs for 2002/3 provide for lower tariffs for households with low pressure as opposed to full pressure. The tariff structure is as follows:
Table 4: Tariff structure for domestic customers (2002/2003)
Consumption Low pressure High pressure 0 – 6 kilolitre No Charge No Charge 7 – 30 kilolitre R 2,94 R 3,40 31 - 100 kiloliter R 3,23 R 3,53 Over 100 kilolitre R 3,41 R 3,75 [Source: Mbombela Municipality]
The tariff is structured so that those households consuming less than 6 kl per month would pay R0 per month. If consumption increases to say 10kl, 15kl or 20kl (‘typical’ low to average residential water consumption rates) residents would be paying a monthly charge of between R11,80 and R51,00 per month depending on whether the supply is low or high pressure.
Figure 1: Monthly bills for consumption of 10, 15 and 20 kl of water
R 0.00R 10.00R 20.00R 30.00R 40.00R 50.00
10kl 15kl 20kl
low pressure high pressure
[Source: Mbombela Municipality]
Comparing the amount consumers paid for water in 1998/99 (in real terms) with current rates, it would appear that the current tariffs do benefit low-income consumers. It would also appear that low-income consumers are subsidised through the charging of higher rates to high-income households.

14
Figure 2: Comparison of water bills 1998/99 and 2003 (constant 2003 Rands)
[Source: GNUC and Mbombela Municipality]
However, if one were to adjust the 1998/99-tariff structure to reflect 2003 prices and one were to account for free basic water (FBW) then the picture changes quite a bit. FBW tariffs for domestic consumers in 1998/99 were definitely cheaper than the GNUC’s tariffs for 2003.
The structure of sanitation tariffs has changed since the introduction of the partnership. Households currently pay a fixed monthly charge of R31,71 per month for waterborne sanitation. Apart from this fixed charge a variable amount is also levied at the rate of R3,84 per kl of water up to a maximum of 40kl. As only a few households have access to waterborne sanitation, the current sanitation tariff penalises those households where water consumption is high. These tariffs for 1998/99 are presented in the table below. Note that the table also reflects the 1998/99 tariffs in 2003 prices (adjusted for inflation).
Table 5: Sanitation tariffs in 1998/99 and adjusted for 2003
[Source: Mbombela Municipality]
A comparison of the sanitation tariffs in 1998/99 and 2003 reflect that there has been a substantial change in the structure of the sanitation charge. Households currently pay a fixed as well as a kilolitre charge. This differs from the pre partnership situation where households were charged according to the water consumption band in which they fell. For sanitation, tariff increases have been starker than that of water supply, increasing from R32,57 in 1998/99 to R54,75 for households consuming 6kl of water per month.
On average households expressed dissatisfaction with current tariffs. Many complained that services were unaffordable.
The ability of consumers to afford water services is key to the viability of the municipality’s policies. The affordability of services are linked to what people are willing to pay for the services they receive. Willingness to pay (WTP) depends largely on the value each household attaches to a particular service. This is highly dependent on local conditions. There are no universally applicable figures which can be applied. Ideally willingness to pay studies should be carried out before a project is commenced. However, this is often not possible and ‘rules of
Water consumed per month 1998/99 2003(adj)
0 - 20 kilolitre R23,95 R32,57
21- 30 kilolitre R37,85 R51,48
31 - 40 kilolitre R54,45 R74,05
Over 40 kilolitre R68,10 R92,62
R 0.00
R 20.00
R 40.00
R 60.00
R 80.00
R 100.00
R 120.00
R 140.00
R 160.00
0 4 8 12 16 20 24 28 32 36 40 44 48
Household bills 1998 (adjusted) Household bills 2003
Household bills 2003 low pressure Household bills -fbw 1998 adjusted

15
thumb’ have to be relied on in order to take planning decisions. The following table represents a ‘rule of thumb’ approach based on work that Palmer Development Group has done nationally. It illustrates households’ willingness to pay for various services. It is notable that, in most instances, 10% of the monthly income is regarded as the maximum amount a household would be prepared to allocate to service payments. For water services this amounts to 5-6.5% of total monthly income. The assumption here is that households are willing to pay more, in relative terms, for water and electricity than other services.
Table 6: Estimated willingness to pay for various services by low-income households (R/month)
Income Service 0 – 800 801 – 1 500 1 501 – 2 500 2 501 – 3 500
Water 16 35 50 60 Sanitation 6 14 20 30 Electricity 16 37 60 90 Solid waste 4 9 12 15 Other user charges 8 23 40 60 Property rates 4 12 20 30 Total 54 129 202 285 Total as % of income 14 11 10 10 [Source: Palmer Development Group 1999]
One way of analysing affordability and willingness-to-pay is to construct illustrative household bills using consumption assumptions and the tariff structure. For illustrative and comparative purposes the consumption assumptions outlined in Table 7 were modeled using the tariff structure of the municipality in 1998/99 adjusted to reflect 2003 prices.
Table 7: Affordability of those earning R800 1998/99 (R/month)
Service Consumption Bill WTP Affordability gap1
Water 6kl 9,30 16,00 6,70 Sanitation 0-20kl 32,57 6,00 -26,57 Total 41,87 22,00 -19,87
Table 7 illustrates that very poor households living in the municipality using 6kl of water per month were faced with a total bill of R41,87 per month for water and sanitation. Although water is within households affordability range, sanitation tariffs are prohibitively expensive if poor households rely on waterborne sanitation. The overall affordability gap is negative implying that the overall service bill was unaffordable to poor households.
Table 8: Affordability of those earning between R801 and R1500 in 1998/99 (R/month)
Service Consumption Bill WTP Affordability gap
Water 15kl 29,46 35,00 5,54 Sanitation 32,57 32,57 14,00 -18,57
Total 62,03 49,00 -13,03
Table 8 assumes that those households earning over R800 but less than R1,500 per month will consume more water than very poor households. Using the tariffs in 1998/99, this translates to 1 If the affordability gap is negative then households cannot afford the services provided.

16
a typical monthly bill of R62,03 for water and sanitation. Once again sanitation tariffs are unaffordable to poor households.
Table 8 and Table 9 depict the current situation. Since government has introduced the FBW policy, the water supply bill falls within the affordability threshold of those earning below R800,00 per month. For those households who have access to waterborne sanitation the sanitation bill is completely unaffordable. The affordability gap in this instance is greater than what is in Table 7.
Table 9: Affordability of those earning R800 in 2003 (R/month)
Service Consumption Bill WTP Affordability gap
Water 6kl 0,00 16,00 16,00 Sanitation 6kl 54,75 6,00 -48,75
Total 54,75 49,00 -32,75
The table illustrates that the new tariff policy implemented by the city has impacted on the affordability of the overall water services package of very poor households. Assuming consumption of 6kl of water per month and one sewerage point per house, this analysis shows that a typical bill for water services would amount to just R54,75 per month. Once again the sanitation charge is way above peoples’ WTP and can be interpreted as unaffordable.
Table 10: Affordability of those earning between R800 and R1,500 in 2003 (R/month)
Service Consumption Bill WTP Affordability gap
Water 15kl 26,46 35,00 8,54 Sanitation 15kl 89,31 14,00 -75,31
Total 115,77 49,00 -66,77
Table 10 shows that the situation for poor households earning between R800 and R1,500 per month has deteriorated since 2000 in terms of their ability to pay for water services. The average bill, based on the consumption assumptions of 15kl of water is calculated at R115,77. Only households qualifying for a rebate will be able to afford the overall water services bill. Those who do not qualify will not be able to afford water services.
In general, GNUC’s tariffs for water are only affordable to poor households who consume approximately less than 15kl per month because of the subsidy received from central government through the equitable share grant. Had it not been for this grant there is little likelihood that water services would be affordable and therefore non-payment levels would have been even higher than is currently the case. Sanitation tariffs are currently unaffordable for poor households that have access to waterborne sanitation but in the case of Nelspruit it is important to note that this may only constitute a small percentage of the total number of poor households. The above analysis demonstrates the need for a comprehensive pro-poor policy aimed at making services more affordable and accessible to low-income households. Despite being unaffordable, residents show considerable resistance to accepting anything less than full-service options whether these are affordable or not. Given that some residents are currently receiving a very high level of service, affordability can be enhanced through cross subsidising from other consumer groups.
NON-PAYMENT OF SERVICES The non-payment of water services is related to the question of affordability. Interviews with key personnel at GNUC and information supplied by them show the following:

17
§ On average, customers in Nelspruit are billed R230,00 per month for water. In the township areas the average bill is R70,00 per month. 2
§ The average amount paid is R220,00 in Nelspruit. In township areas the average amount paid is R10,00 per household.
§ There is thus a huge discrepancy between the average amount billed and the average amount paid in township areas.
§ In cases where households have access to communal standpipes and ground tanks no charges are levied.
§ The number of households in arrears is 70% in Kanyamazane and 80% in Matsulu. § The shortfall in GNUC’s income is R12 million annum in townships. Losses are cross-
subsidised by payment levels in Nelspruit and through the use of the Equitable Share Grant.
According to Smith et al (2003), the Nelspruit concession will come to a close if payment rates do not reach 50% within the next year. She states that in terms of the contractual agreement the concessionaire can file for an omega, a legal term that enables it to forego any liabilities for debts it has incurred during the concession because of unforeseen external circumstances. Unfortunately the failure of the concession will leave the Mbombela municipa lity in severe debt to the order of R50 million. This scenario raises the question of the degree to which a private sector investor carries the commercial risk in such a long-term contract? Evidence from failed concessions elsewhere, such as in Cochabamba, Bolivia or in Buenos Aires, Argentina, suggest that it is actually the state, and in this case the local authority, that carries the financial risk in a long-term concession.
Despite the high levels of non-payment, officials at GNUC pointed out that there has been a reduction in outstanding debt since the introduction of the concession. Debt is lower under GNUC - R17 million compared to R90 million under the local authority. One of the main reasons for the low levels of debt is the current customer management programme of GNUC.
CUSTOMER MANAGEMENT There are a total of 15,700-metered households in the Municipality. All of these meters are read on a monthly basis using subcontractors employed jointly by the local authority and GNUC in Nelspruit. Outside of Nelspruit the same contractor is employed by GNUC. The post-office delivers bills throughout the concession area. Customer care offices have been set up in Nelspruit, Kanyamazane, Matsulu, and Msogwaba. Staff is appointed in each office to deal with billing queries etc. Staff at the head-office supports these activities.
The credit control process of the municipality falls within the customer management system of the municipality. Customers generally have a period of 30 days to pay their account after which interest may be paid on the overdue amount. Customers whose accounts are more than 60 days in arrears on the basis of age analyses may be subject to disconnection. Prior to disconnection however, warnings should be sent to all customers whose accounts are close to or more than 60 days in arrears. The municipality does however recognise that it cannot effectively issue all customers with warning notices and has developed a criterion for customers to be warned. Customers who fail to heed their warnings are disconnected after they have been given fair warning. Long-term debt is handed over to the Debt Recovery Agency to institute due legal process. This only applies to customers that are employed. Where disconnections do occur, the GNUC ensures that temporary standpipes are in place.
2 The data supplied by GNUC on average amount billed is somewhat confusing. At an average of R70 per household the consumption levels would have to be somewhere around 40kl per month, a figure that is generally far in excess of the pattern of consumption for poor households.
18
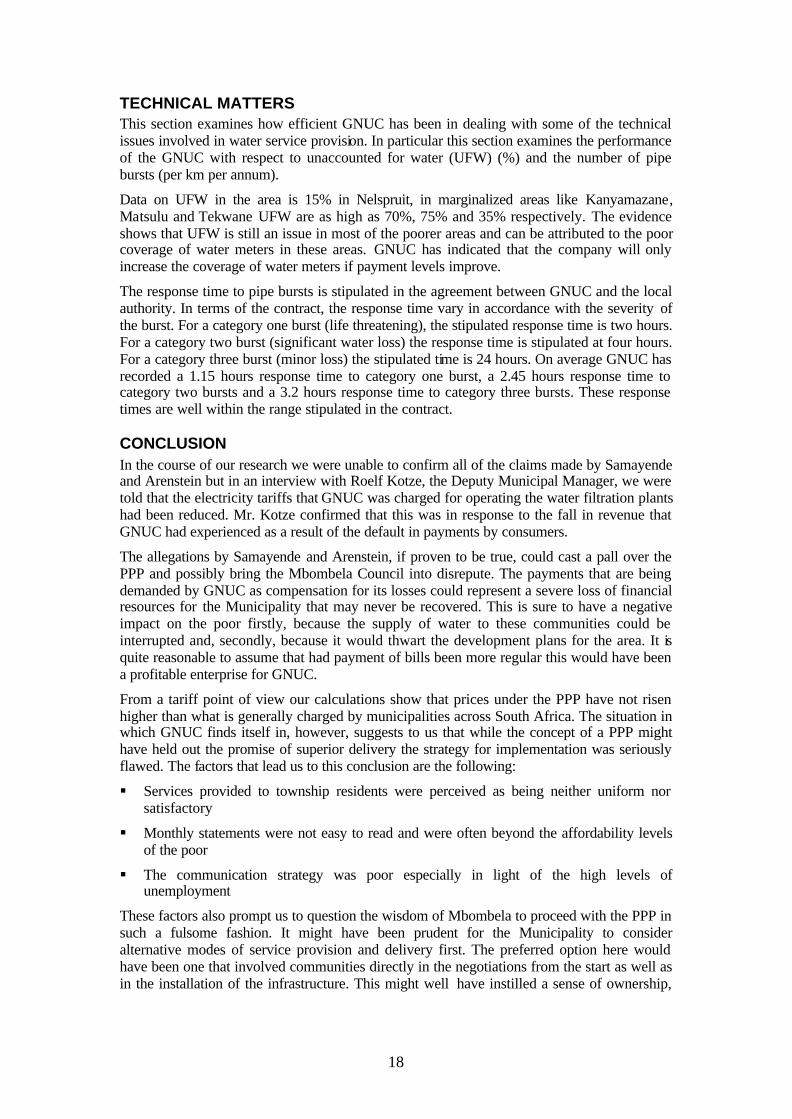
TECHNICAL MATTERS This section examines how efficient GNUC has been in dealing with some of the technical issues involved in water service provision. In particular this section examines the performance of the GNUC with respect to unaccounted for water (UFW) (%) and the number of pipe bursts (per km per annum).
Data on UFW in the area is 15% in Nelspruit, in marginalized areas like Kanyamazane, Matsulu and Tekwane UFW are as high as 70%, 75% and 35% respectively. The evidence shows that UFW is still an issue in most of the poorer areas and can be attributed to the poor coverage of water meters in these areas. GNUC has indicated that the company will only increase the coverage of water meters if payment levels improve.
The response time to pipe bursts is stipulated in the agreement between GNUC and the local authority. In terms of the contract, the response time vary in accordance with the severity of the burst. For a category one burst (life threatening), the stipulated response time is two hours. For a category two burst (significant water loss) the response time is stipulated at four hours. For a category three burst (minor loss) the stipulated time is 24 hours. On average GNUC has recorded a 1.15 hours response time to category one burst, a 2.45 hours response time to category two bursts and a 3.2 hours response time to category three bursts. These response times are well within the range stipulated in the contract.
CONCLUSION In the course of our research we were unable to confirm all of the claims made by Samayende and Arenstein but in an interview with Roelf Kotze, the Deputy Municipal Manager, we were told that the electricity tariffs that GNUC was charged for operating the water filtration plants had been reduced. Mr. Kotze confirmed that this was in response to the fall in revenue that GNUC had experienced as a result of the default in payments by consumers.
The allegations by Samayende and Arenstein, if proven to be true, could cast a pall over the PPP and possibly bring the Mbombela Council into disrepute. The payments that are being demanded by GNUC as compensation for its losses could represent a severe loss of financial resources for the Municipality that may never be recovered. This is sure to have a negative impact on the poor firstly, because the supply of water to these communities could be interrupted and, secondly, because it would thwart the development plans for the area. It is quite reasonable to assume that had payment of bills been more regular this would have been a profitable enterprise for GNUC.
From a tariff point of view our calculations show that prices under the PPP have not risen higher than what is generally charged by municipalities across South Africa. The situation in which GNUC finds itself in, however, suggests to us that while the concept of a PPP might have held out the promise of superior delivery the strategy for implementation was seriously flawed. The factors that lead us to this conclusion are the following:
§ Services provided to township residents were perceived as being neither uniform nor satisfactory
§ Monthly statements were not easy to read and were often beyond the affordability levels of the poor
§ The communication strategy was poor especially in light of the high levels of unemployment
These factors also prompt us to question the wisdom of Mbombela to proceed with the PPP in such a fulsome fashion. It might have been prudent for the Municipality to consider alternative modes of service provision and delivery first. The preferred option here would have been one that involved communities directly in the negotiations from the start as well as in the installation of the infrastructure. This might well have instilled a sense of ownership,

19
which would have encouraged higher payment levels as well as higher care and maintenance of the infrastructure.
The Mbombela Council appears not to have linked water provision to larger developmental initiatives in the communities concerned. Had the stimulation of local economic activity, for example, been targeted as a developmental priority and an appropriate mix of private and public sector initiatives introduced to complement water provision an improvement in the socio-economic status of the community could possibly have been effected. The structural nature of poverty in Mbombela means that the surrounding townships remain peripheral to economic growth and must continue to rely on the performance of the Nelspruit economy for their survival. Continual commuting between Nelspruit and the townships for jobs, goods and services also drains the latter of resources in terms of the classical notion of ‘leakage’ and prevents the growth cycle from taking root. By systematically dismantling the structural base of poverty of which water provision would be but one part, the Mbombela Council might well have set the stage for the economic development of its townships.
GNUC’s ability to maintain a reasonable tariff in light of the difficult circumstances in which it finds itself is impressive. It has also shown remarkable technical proficiency in the way it has been able to respond rapidly to burst pipes. And the decision to refer delinquent accounts to due legal process may well yield results in so far as recovering a proportion of unpaid accounts is concerned. However, the random interviews held during our research suggest that irreparable damage has been done to the relationship between consumers and GNUC and the Council. This was also the message in the investigative television program Special Assignment aired on SABC 3 on July 8, 2003. Whatever good the Council may have done in other areas this is sure to be construed as a case of bad governance and can only reinforce perceptions that local government administration has changed little since the days of apartheid.
There appears to have been no systematic study on affordability levels either before or after the PPP was entered into. This is a serious omission in a profit-driven undertaking of this magnitude for it begs the question about the integrity of the business plans and the formulae used to determine if this was a profitable venture. Moreover, it compels us to question the assumptions on which payment levels were anticipated. Was it assumed that jobs would be created and living standards raised? Which were the sources of growth that were identified? The ratio of employed to unemployed persons would have been an early indicator that payments could not be sustained beyond a certain level. Poverty data would have been another means by which to determine the ability of households to pay for water and sanitation. As the analysis above reveals, billing by GNUC is at variance with the income of households and their willingness to pay when we apply criteria that have been used nationally in studies on service delivery.
PPPs may be a viable option for some of South Africa’s municipalities in so far as service delivery is concerned. A cautionary approach, however, may be advisable where levels of unemployment and poverty are high and there is an absence of a blueprint for rapid economic development. Any venture in the field of service delivery that is profit-driven is bound to face severe challenges in the way of non-payment if feasibility studies are not undertaken prior to the negotiation of contracts. These problems have the potential to not only plunge municipalities into financial hardship when the contracts cannot be fulfilled but also to thwart the development of whole communities. Since the impact on the poor of such occurrences is devastating, it would be in the interest of all to explore other options as well.

20
REFERENCES Alfaro, R. et al. (1998). Reforming Former Public Monopolies: Water Supply. in Birdsall, N. et al. (Eds.). Beyond Tradeoffs – Market Reform and Equitable Growth in Latin America. Inter-American Development Bank, Brookings Institution Press. Bate, R. and Tren, R. (2002). The Cost of Free Water: The Global Problem of Water Misallocation and the Case of South Africa. The Free Market Foundation. Bayliss, K. (2002). Water Privatisation in SSA: Progress, Problems and Policy Implications. Presented at the Development Studies Association Annual Conference, University of Greenwich. Public Services International Research Unit, University of Greenwich. www.psiru.org Brook Cowen, P. (1997). Getting the Private Sector Involved in Water: What to Do in the Poorest Countries. Note No. 102, The World Bank, Finance, Private Sector, and Infrastructure Network. The World Bank: Washington D.C. Brook Cowen, P. and Tynan, N. (1999). Reaching the Urban Poor with Private Infrastructure.” Note No. 188, The World Bank, Finance, Private Sector, and Infrastructure Network. The World Bank: Washington D.C. DBSA. PSI Paper No. 3. 2002. Public Private Partnerships (PPP) and Impact on Jobs Fine, B. (1997). Privatisation and the Restructuring of State Assets in South Africa: A Strategic View. National Institute for Economic Policy (NIEP) Occasional Paper Series. Hall, D. (2001). Water in Public Hands: Public Sector Water Management – a necessary option. Public Services International Research Unit, University of Greenwich. www.psiru.org Hall, D. (2002). The Water multinationals 2002 - financial and other problems. Public Services International Research Unit report for PSI, August 2002. http://www.psiru.org/reports/2002-08-W- MNCs.doc Katakura, Y. and Bakalian, A. (1998). PROSANEAR: People, Poverty and Pipes. United Nations Development Programme and World Bank Water and Sanitation Program, Washington, D.C. Lovei, L. et al. (2000). Maintaining Utility Services for the Poor: Policies and Practices in Central and Eastern Europe and the Former Soviet Union. World Bank, Europe and Central Asia Region, Washington, D.C. Menard, C. and Clarke, G. (2000). Reforming Water Supply in Abidjan, Côte d’Ivoire: A Mild Reform in a Turbulent Environment. World Bank, Development Research Group, Washington, D.C Parker, D. (1993). Ownership, Organizational Changes and Performance. in Clarke, T. and Pitelis, C. (Ed.). The Political Economy of Privatisation. New York: Routledge Press. Roger, N. (1999). Recent Trends in Private Participation in Infrastructure. Note No. 196, The World Bank, Finance, Private Sector, and Infrastructure Network, Washington D.C.

21
Roth, G. (1987). Privatisation of Public Services. in Hanke, S.H. (Ed.). Privatisation and Development. The International Centre for Economic Growth. Rowthorn, B. and Chang, H. (1993). Public Ownership and the Theory of the State. in Clarke, T. and Pitelis, C. (Ed.). The Political Economy of Privatisation. London and New York: Routledge Press. Ruiters, G. and Bond, P. (2000). Contradictions in Municipal Transformation from Apartheid to Democracy: The Battle over Local Water Privatisation in South Africa. Background Research Series. Municipal Services Project. Savedoff, W. and Spiller, P. (1999). Spilled Water: Institutional Commitment in the Provision of Water Services. Inter-American Development Bank, Washington, D.C. Smith, L. et al. (2003). Service Delivery Alternatives: The Water Concession in Nelspruit, South Africa. Centre for Policy Studies, Johannesburg. Solo, T. M. (1998). Competition in Water and Sanitation: The Role of Small-Scale Entrepreneurs. Note No. 165. World Bank, Finance, Private Sector, and Infrastructure Network, Washington D.C. Yepes, G. (1999). Do Cross Subsidies Help the Poor to Benefit from Water and Wastewater Services? Lessons from Guayaquil. Water Supply and Sanitation Program Working Paper. United Nations Development Programme and World Bank, Washington, D.C.

ANNEXURE 1
NELSPRUIT WATER PPP: FACT SHEET CLIENT TLC (Mbombela Municipality) SERVICE PROVIDER Greater Nelspruit Utility Company CONTRACT DURATION AND TYPE 30-year concession CONTRACT DATE 21 April 1999 TOTAL PROJECT VALUE R 1,45 billion PROJECT PREPARATION COSTS R 4,6 million (MIIU contributed R 4,3 million) POPULATION SERVED In the whole municipality area: 240 000 Direct beneficiaries: 240 000 By new or greatly improved services: 120 000 TRANSACTION ADVISERS Value Ad Edward Nathan and Friedland – Legal Coopers and Lybrand – Financial BKS – Technical KEY FEATURES OF THE CONCESSION § Greater Nelspruit Utility Company: 90% owned by BiWater and 10% by Sivukile
Investments § Preferred bidder must maintain 26% shareholding § Overall responsibility for operation and maintenance § Capital investment (est. R370m) in first six years § 30 Year concession, but assets remain property of council § Performance guarantee of R8m. § Contract implementation fee of R200000 and annual concession fee of R1.25 million § Annual CPI increase, re-negotiated after 5 years § R11 m annual payment to lease existing water and sanitation systems (10 years) from
council § Leasing fees geared to debts on current systems