Bay Geophysical Associates Inc. Alamos National Labs/TA 21... · Bay Geophysical Associates, Inc...
20
,', Bay Geophysical Associates" Inc. d 206 Cambridge Way, Coatesville, PA 19320 24 July 1998 Project No.:98-176P Mr. John Hopkins Monison Knudsen Corporation 2237 Trinity, Bldg. 2, 1st Floor Los Alamos, New Mexico 87544 RE: Results of Integrated Geophysical Investigation Los Alamos National Laboratory TA-21, MDA-B Dear Mr. Hopkins: Bay Geophysical Associates, Inc. appreciates the opportunity to present this letter report summarizing the results of a geophysical investigation completed at the above-referenced site on 15 through 20 July 1998. The purpose of the investigation is to delineate the lateral and vertical boundaries of former disposal pits. To achieve this objective, an integrated geophysical investigation was completed using high-sensitivity metal detector (EM61), terrain conductivity (EM31j, and ground-penetrating radar (OPR) techniques. The survey area encompasses approximately 6 acres and consists of both paved and unpaved areas. Figure 1 illustrates the survey area locations. The site was divided into three separate survey areas that are bounded by chain- link fences. Area 1 is the main survey area encompassing approximately 5.5 acres. This area includes the large paved area and unpaved area at the '-Po t) end of the site. Area 2 is the small (approximately 0.2 acres) paved area on the end of the site. Area 3 is the small (approximately 0.2 acres) unpaved area south of Area 2. METHODOLOGY The geophysical investigation was completed using an integrated approach. Integrating two or more geophysical techniques provides a complementary or synergistic effect by reducing the inherent ambiguities in interpretation that may exist if only one method was used. This approach often provides higher confidence levels and more complete subsurface information. 1"'1111/'111111111111111/111111111 10757 (6 1 0) 384 - 6 7 7:2 • Fax (6 10) 380 - a6 1 :2
Transcript of Bay Geophysical Associates Inc. Alamos National Labs/TA 21... · Bay Geophysical Associates, Inc...

,', Bay Geophysical Associates" Inc.
d 206 Cambridge Way, Coatesville, PA 19320
24 July 1998 Project No.:98-176P
Mr. John Hopkins Monison Knudsen Corporation 2237 Trinity, Bldg. 2, 1st Floor Los Alamos, New Mexico 87544
RE: Results of Integrated Geophysical Investigation Los Alamos National Laboratory TA-21, MDA-B
Dear Mr. Hopkins:
Bay Geophysical Associates, Inc. appreciates the opportunity to present this letter report summarizing the results of a geophysical investigation completed at the above-referenced site on 15 through 20 July 1998. The purpose of the investigation is to delineate the lateral and vertical boundaries of former disposal pits. To achieve this objective, an integrated geophysical investigation was completed using high-sensitivity metal detector (EM61), terrain conductivity (EM31j, and ground-penetrating radar (OPR) techniques.
The survey area encompasses approximately 6 acres and consists of both paved and unpaved areas. Figure 1 illustrates the survey area locations. The site was divided into three separate survey areas that are bounded by chainlink fences. Area 1 is the main survey area encompassing approximately 5.5 acres. This area includes the large paved area and unpaved area at the
'-Po t)y.s!~ end of the site. Area 2 is the small (approximately 0.2 acres) paved
area on the ~ end of the site. Area 3 is the small (approximately 0.2 acres) unpaved area south of Area 2.
METHODOLOGY
The geophysical investigation was completed using an integrated approach. Integrating two or more geophysical techniques provides a complementary or synergistic effect by reducing the inherent ambiguities in interpretation that may exist if only one method was used. This approach often provides higher confidence levels and more complete subsurface information.
1"'1111/'111111111111111/111111111 10757(6 10) 384 - 6 7 7:2 • Fax (6 10) 380 -a6 1 :2

Mr. John Hopkins 98-176P 07/24/98 Page 2
The EM61 survey was completed to help delineate the lateral extent of the fonner trenches by mapping the locations of metallic objects contained within the trench. A minimum depth of the trenches can be estimated by calculating the depth of the objects based on the EM response. The EM31 survey was used in conjunction with the EM61 to delineate the lateral extent of the trenches by mapping the anomalous conditions created by disturbed zones and buried metal objects. The GPR technique was chosen to provide a crosssectional image of the subsurface from which depth estimates could be made. These data could be used to corroborate and refine the lateral boundaries of the trenches determined by the other techniques.
HIGH-SENSITIVITY METAL DETECTOR (EM61)
The metal detector survey was completed using a Geonics EM61 HighSensitivity Metal Detector. The EM6I is a time domain electromagnetic (EM) system that can discriminate between conductive soils and metal objects. The EM61 generates rapid electromagnetic pulses and measures the response of the subsurface between pulses. Secondary EM fields are generated in the ground after each pulse. These fields dissipate rapidly in earth materials but remain for a longer time in buried metal objects. The EM61 measures the prolonged metal response only after the earth response has dissipated. This response is measured and displayed in millivolts (mV).
For this investigation, data were acquired along parallel grid lines spaced 5 ft apart. Measurements were recorded at less than I-ft intervals along each grid line. Data were collected at approximately 60,000 points to provide very high lateral resolution.
TERRAIN CONDUCTIVITY (EM31)
The terrain conductivity method uses the principle of electromagnetic induction to measure the electrical conductivity of earth/fill materials. Commonly, significant contrasts in the electrical properties between non-indigenous materials and surrounding soil enable accurate delineation of former disposal sites.
A Geonics EM31-D was used to conduct the survey. The EM31-D operates in accordance with the theory of operation at low induction numbers. An

Mr. John Hopkins 98-176P 07/24/98 Page 3
alternating current is passed through transmitter coil to induce eddy currents into the ground below the instrument. These eddy currents generate a secondary magnetic field. The quadrature-phase component of the induced secondary magnetic field is detected by a receiver coil and measured by the instrument. The measured response is linearly related to the terrain conductivity. The instrument converts the measured signal and displays it as terrain conductivity in milliSeimens per meter (mSjm) ..
Data were acquired at 2.5-ft intervals ~long parallel grid lines spaced 5-ft apart. The data were digitally recorded to improve precision and eliminate the possibility of transcription error. The EM31-D was calibrated prior to operation at an off-site background reference station believed to free from cultural interference. The reference station was re-occupied at the end of each day of operation for system functional checks.
GROUND PENETRATING RADAR (GPR)
The GPR technique uses the transmission and reflection of radio waves to .image objects beneath the ground surface. The technique responds to changes in the electrical properties of the earth or buried materials. A GPR target must possess' electrical characteristics that are differen(from the surrounding media. When the transmitted wave encounters an anomalous object or layer, the wave is reflected back to the surface where it is recorded and analyzed. The waves are transmitted rapidly such that a continuous subsurface image is generated as the transmitter is pulled along the ground surface.
The GPR survey was performed using a digital SIR System-2 Subsurface Interface Radar System, manufactured by Geophysical Survey Systems, Inc. A 400 MHz transducer was chosen after initial field tests to provide maximum penetration with sufficient resolution. Data were digitally recorded. displayed, and analyzed during acquisition to allow real-time interpretation. Further detailed processing was completed on a portable computer.
The location of GPR survey lines were chosen after the EM61 and EM31 data were processed and interpreted to allow strategic placement. Data were collected continuously along traverses established over EM anomalies.

Mr. John Hopkins 98-176P 07/24/98 Page 4
SUMMARY OF RESULTS
AREA 1: MAIN SURVEY AREA
Plate 1 presents a plan map of the EM61 data collected at the main survey area. All values above background (0 mV) are considered anomalous and are attributed to occurrence of metal objects. The data are characterized by highamplitude, linear patterns of anomalies that extend throughout the majority of the site. Very few significant metallic anomalies were identified outside the boundaries of these anomalies. Based on anomaly amplitude as well as the depth and linear arrangement of buried metal objects, these linear anomalies are interpreted as former disposal trenches.
The linear anomaly along the western' --rtion of Area 1 is approximately 40-ft wide and over 1,000 ft long. The wes .. end of this anomaly extends into Area 2 and is described in the following section. Two anomalous areas containing buried metal were detected south of tr~e interpreted trench near stations 450N/700E and 600N/975E.
The linear anomalies on the eastern end of Area 1 are also well defined. The western end of this anomaly has a higher amplitude and greater width (approximately 60 ft) than the eastern end. The lower amplitudes measured at the eastern end indicate fewer metal objects are present. Additional anomalies, which are attributed to buried metal, are identified south of the interpreted trench location near station 650N/ 1650E. Finally, a small continuous metal object was detected near the southern fence and is interpreted as a buried pipeline. The remaining anomalies observed near the perimeter of the Area 1 are attributed to the chain link fence that surrounds the site.
Depths to the top of buried metal objects were estimated using the EM61 data. If numerous metal objects are buried close, these estimates would represent '7
the depths to, the most shallow objects. The estimated depths of selected metal w.-l object within the interpreted trenches ranges from 1.3 to 7:2 (mean = 4.1). ~
There does not appear to be any significant difference between the range of depths calculated for objects in the western and eastern trenches.
Plate 2 presents the in-phase EM31 data collected in Area 1. The locations of detected anomalies are consistent with those detected during the EM61 survey and corroborate the interpreted trench boundaries. However, these boundaries

Mr. John Hopkins 98-176P 07/24/98 PageS
are less well defined due to interference from the chain link fence and the lower resolution of the EM31. An decrease in overall conductivity is observed in the unpaved area and is attributed to the surficial materials.
Figure 2 presents the EM31 conductivity data in the unp&ved portion of Area 1. These data show a low conductivity anomaly that is consistent with the documented location of the former chemical disposal pits. This anomaly may be caused either by the presence of organic constituents associated with the former chemical trench or by lateral changes in fill materials.
GPR data were collected over the interpreted location of the former trenches to confirm the interpreted boundaries and determine depths. The locations of the profile lines are presented in Figure 3. The GPR profiles are shown in Figures 4 through 10. The X/Y coordinates presented along the tope of the profile . correspond to survey grid coordinates. The processed data indicate tbedepth of the trenches range from approximately 11 to 15 ft below ground surface . (bgs).
The GPR data collected in the unpaved area did n'ot reveal any anomalies attributable to disposal trenches due to insufficient electrical contrasts between the buried and native materials. However, horizontal interfaces were encountered and are attributed to the cover materials. An example of these interfaces is presented in Figure 10.
AREA 2: SMALL PAVED AREA
Area 2 is located at the western end of the survey site and is adjacent to Area 1 (Figure 1). Figure 11 shows a linear anomaly located along grid line 375N. This anomaly corresponds to the interpreted trench identified in Area 1 and defines the western boundary of the trench. The remaining anomalies around the perimeter of the site are attributed to interference from the surrounding chain-link fence. The EM31 (Figure 12) data show no evidence of trench boundaries due to excessive interference from the fence. The depth of the interpreted trench could not be determined from the GPR data due to poor data qUality.

Mr. John Hopkins 98-176P 07/24/98 Page 6
AREA3: SMALL UNPAVED AREA
Figure 13 is a plan map of the EM61 data collected at Area 3. These data show numerous anomalies that are scattered randomly throughout the area. No linea.: patterns of anomalies - similar to those seen in Area 1 and 2 - were observed, suggesting a more heterogeneous distribution of buried materials. Based on the location of metal objects, the boundary of the disposal area extends at least to the survey area boundary. The calculated depths of detected buried metal object ranges from 0.1 to 6.8 ft.
The terrain conductivity data presented in Figure 14 show no evidence of lateral changes in conductivity attributable to disposal area boundaries. If this boundary were located near the fence, it would be masked by the observed interference. Finally, the GPR data did not reveal any continuous anomalies attributable to the boundary of the disposal area.
In conclusion, the results of the investigation successfully achieved the project objectives by delineating the extent of major disposal trenches. Please contact me at 610-384-6772 if you have question regarding the results presented in this summary report.
Kind regards,
Bay Geophysical Associates, Inc.
~~ M. Scott Mc Quown, P.G. Principal Geophysicist
Attachments: Plate 1 EM61 Anomaly Map of Area 1 Plate 2: EM31 In-phase Map of Area 1 .

t I! w I
Survey Area Loe:, \on Map Los Alamos National Laboratory
TA-21 , MDA B
< •••••
\:; (~t""!111 ....... ""'OPSoad - III'''' ~_ .> ;r :::::::::::......i· -
...... ~ . ~.:.;. ...... ---==- .......?- AREA 1 ..'
A~EA3
,............/ ,,~-....----......-.-~ ...... '" .......-.... 811 .--.~.,.....
........ '-'" v C,ql\lhl __ ~......... 011, ... -.. ," 'v
~.'''...... <1/ "',
.............. ..., ..........
..........
..•......... .•..•.
'. ___-_ ="-.e :~:::~~;;~i~.......................... .... )o 100 200 300 400 500 fl .- - - Unimproved road L'---l__J.!--"'--_.1-_-,
Fence eART~ IJI A. Knln 7~ ....................... Contour,lnterval 20 It I Saurt.e: FIMAO G104885 7/12J!l8 and 10276712J8/!M
'. ...........
'.
..... •••••••• h •••

Figure ". Terrain Conductivity Map
Former Chemical Disposal Pit Area TA-21 , MDA-B
Documented location of former chemical disposal pit
~·f ~J.
51 t~
,t5 <L;<
41 ~~
"!<? :!.c; !>.{
:;2
". , ~t)
2" ~7
:!~ ;:.: lJ 1;
~" lP 17
50 o 50 100 iii
(fe'3t) Conductivity
(mS/m'l '

--
Figure tJ
GPR Line location Map Los Alamos National Laboratory
TA..21 , MDA-8
1OOE 200~ _\OOC 4001: 50m: 600L mot BODE 900E 11 DOE 1200f UOOE 1boor 1IOOE IImor 190m. 1000f
z
1non[ 1400[ 1S()OE-.-~ r-' ---- -. --. - ..-.---- ~-. ,'" .-.~ -~ .... - ,------ -- -.- .. ~-- -~-~-- -::--.- -- ~"-T-' ....~-- _.....
r-- ~-I--
...ine
LI--'
~ ~V
"~ ""
-'- ~.'- :-- ...... --,- .. ~
li
0 ~V V
~ ~ i'-Int rpret ~d tre ~ch b
-~-- .~ ----- -... ~ -
.. ,--- -.. ._-- ..----. --line 5 ine 7
\ C ~
..Je 2 ~
~-- .1 ,,., tn :11 ~ Ioundc./ 'rv
~ Lin~ Lin 4 \. Line \.
3
undo IY
.' #
-.. . -~ . .,'~.,.,--~-.. ,-,. ----.- •.• __~ __ .. , .. _ ..__ L ____..... _____ .... ~.~ .. _..
8 I ~ 1r·
z o
11o,; C) n '" , ~
z o ,.o~
(Jli)) tf r;·
~ ,.o? n'<t
;~ z o o~ "1')
..,. (5 o~ , ,t,. r
~1
z 8,,
t ~,
C1 ;;:
100E 200f Jom: 40tH. ~)CHl[ FoOO[ lOoe 80m 900E WOOl 1100E 120m 1\001. 14001 1500E. 16()OE 1700E 18()OE 1900!. ;~Oflnr
100 0 Ilin :'00 \!lI1 t.I!'_~_ .. i
(Ceel)

Figure 4 GPR Profile - Line 1
Los Alamos National laboratory TA-21, MDA B
370.00 370.00 370.00 370.00 X/V (n):
0.00 0.00
5.00 5.00
-.::: '--"
10.00 I: -I ;j£(.;.~.\,. . ..J 10.00
~ t=I
15.00 I '0\.:';;. ,~ _-f'l b~~- 1-.: :,( . 'f i·e; It;,' ·~t;l ~-~" ... 'tit :' ~ :~'!", ~t;" ::lO~.l;'~< ~.~# '~-~'." f ;('"4'- ~...... ~. ~••,< ';';' 15.00L,.'
:ea.v Geophysical Associates, Inc.

Figure 5 GPR Profile -Line 2
Los Alamos National Laboratory TA·21. MDA·B
910.00 910.00 Qio.oo 910.00 910.00 X!Y (ft): 550.00 575.00 600.00 625.00 650.00
-~ ~
0,00
5.00
::J:! 10.00
~ ~
15.00 \; j' ", .... " -., : ,!'~~;:q:'~:""~::i~"'::'::';'~'::;::';~L~" 'i,.. ;1~
0.00
5.00
10.00
15.00
RJov n..nnnv..I......1 A ..I'U',c':llIIItfu •• Tnt:.

Figure 6 IGPR Profile - Line 3 ILos Alamos National Laboratory
TA-21, MDA-B
1000.00 950.00 900.00 850.00 800.00 X/Y (ft): 650.00 625.00 600.00 575.00 550.00
0.000.00
5.005.00 liA"J
..... -......... -
1'''''' ""i' 10.00::r::b:: 10.00 ..... . r::l o
15.00 I:'::.,,;~,::;.:..: 15.00
I
I I
Bay Geophysica.l Associates, Inc.

Figure 7 GPR Profile - Line 4
Los Alamos National Laboratory TA-21, MDA-B
1200.00 1200.00 1200.00 1200.00 X/Y (fl): 625.00
0.00
5.00
-~ ......... ::z:: 10.00 e,...
&s Q
15.00
650.00 675.00 700.00
0.00
5.00
10.00
15.00
Bay Geophysical Associates, Inc.
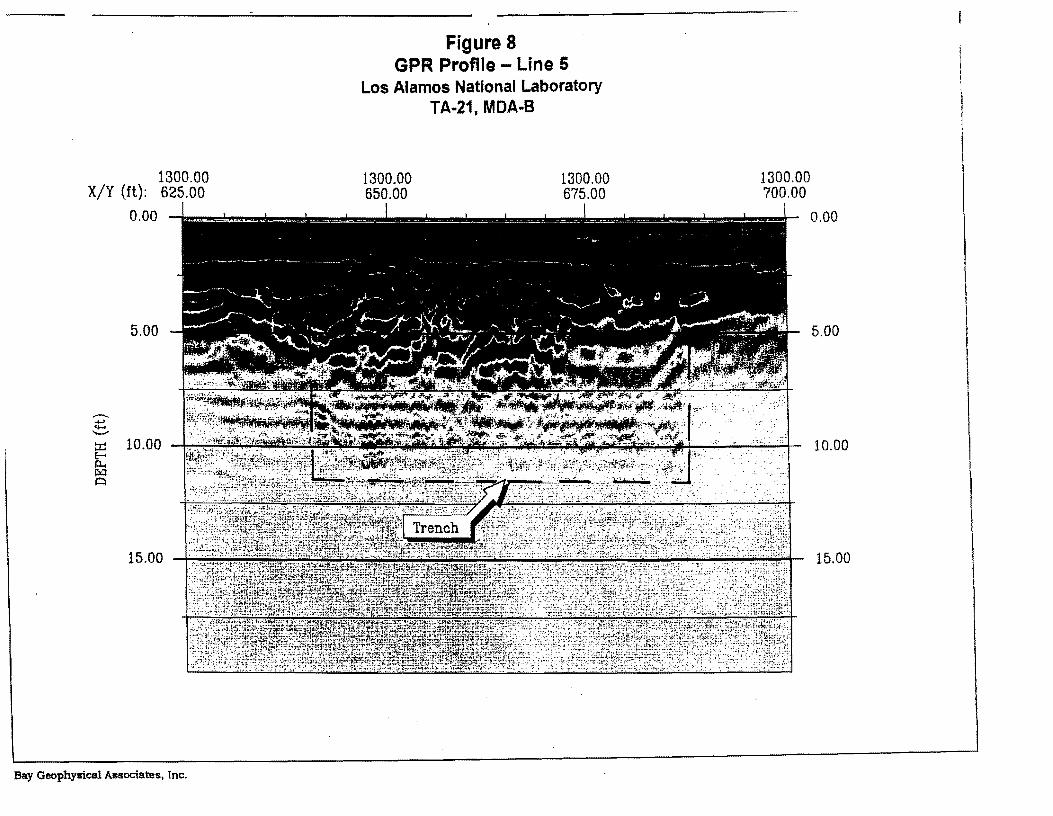
Figure 8 GPR Profile - Line 5
los Alamos National laboratory TA-21, MDA·B
1300.00 1300.00 1300.00 1300.00 X/Y {ft}; 625.00 650.00 675.00 700.00
-.........--....
0.00
5.00
~ 10.00 1._.':-'':~·)fr~(:;;i~1~;;;1;~-4:
Il...
"'"'A
15.00 1',",'
0.00
5.00
10.00
15.00
Bay Geophysical Associates, Inc.

Figure & GPR Profile - Line 6
Los Alamos National Laboratory TA-21, MDA-B
1350.00 1350.00 1350.00 1350.00 X/Y (fl): 700.00
0.00
5.00
~ ......... ::I:! 10.00
~ ~
15.00
675.00 650.00 625.00
0.00
5.00
10.00
15.00
Bay Geophysical Associates, Inc.

Figure H. GPR Profile - Line 7
Los Alamos National Laboratory TA-21, MDA-8
1830.00 1830.00 1830.00 1830.00 X!Y (ft): 650.00 615.00 100.00 125.00
0.00
5.00
-;::: ........... ::r:: 10.00 " ........ ",,"e-. ....... ,. ..-. p., JlLI o
15.00
0.00
5.00
10.00
15.00
Bay Geophysical Associates, Inc,

._-_._.__..- ..---_.._------_._---_._------Figure 11
Buried Metal Anomaly (EM61) Map a Area 2 Los Alamos National Laboratory
TA-21 , MDA..B
·8 "<I'
115 lID 77 70 G4 59VI
1)1 54o 4!1Z 4~
42 .3fI J4 Jll 27 24 20 17 14
z Vi 11 on N VI R I') Z '"
I -2 -5 -8
-12 -15 -1\1
-26 -30 -34Z l5 -J98 0
I')L-~___________~______________~__~z -H -48100E 125E 150E -54 -62 -70 -79 -1)6
Response 10 20 (mv)
(feel)

Figure 12 Terrain Conductivity Map· Area 2
Los Alamos National Laboratory TA-21, MDA-B
1.1'VI 0 Z
1DOE 125E 150E
sa
3!1 37 16 34 32 31
_30 26 27 25 2~
~3
21 20 I!I 17 16 15 13 12 10 9 7 6
2 -0 -:1-~ -8
-11 -1~
-22 IV:.~-, 0 10 20
Conductivi ty--~;; : 1 (reet) (mS/m)

2 I
-0 -2 -4 -6 -9
Figure 13 Buried Metal Anomaly (EM61) Map - Area 3
Los Alamos National Laboratory TA-21, MDAMB
100E 125£ l50E
-13
Response25 (mV)I
( feet)
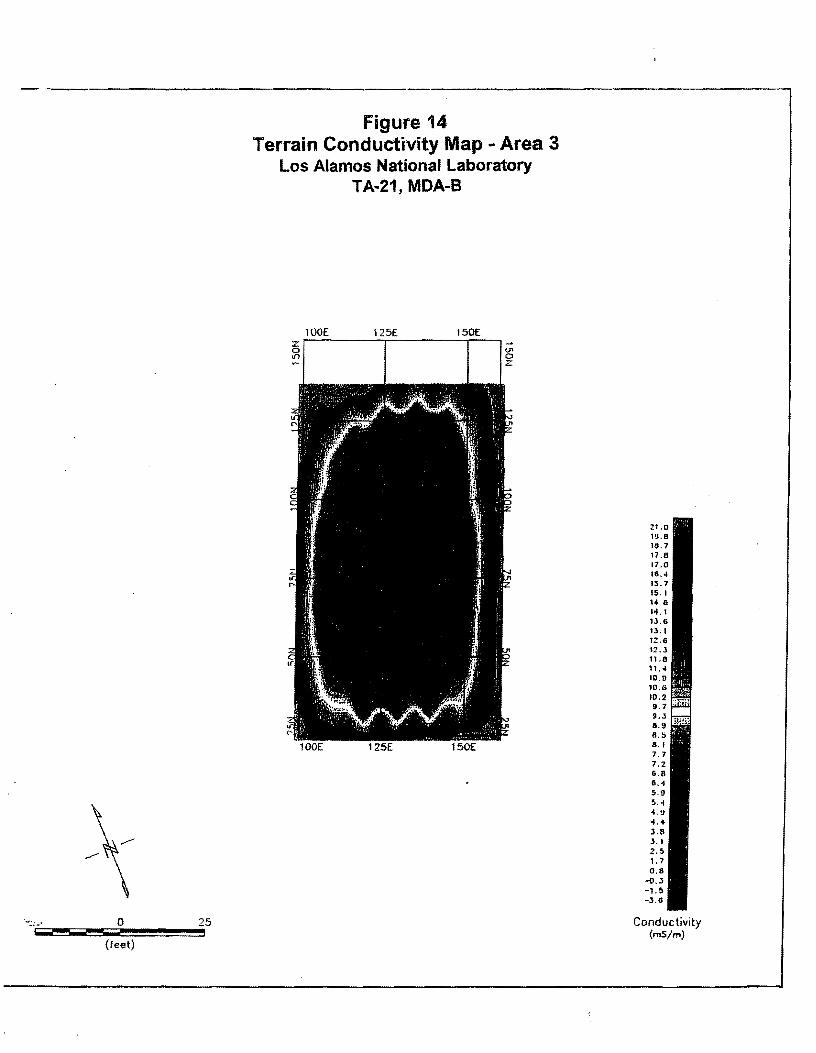
- '-------------------Figure 14
Terrain Conductivity Map .. Area 3 Los Alamos National Laboratory
TA-21 , MDA-B
lOOE 125E '150E z.--------r---------.~ o
0 ~
~ ~ z
21.0 1U.8 11.1.7 17.8 17.0 16.~
15.7 15.1 14,8 1<\.1 1l,6 13.1 1::.8 12 . .1 11.8 11. ~ 10.9 10.6 10.2 9.7 9.3 11.9 11.5 a.1 7.7 7.2 6.8 6." 5.11 5. ~ •. 9 '<\.4 l.8 l.1 2.5 1.7 0.8
-0 . .3 -1.5 -J.6
,
25 Conductivity (mS/m)
(feet)