Bathymetry from satellites for hydrographic purposes survey/presentations/26.pdf · Bathymetry from...
37
Bathymetry from satellites for hydrographic purposes A.G. Dekker 1 , S. Sagar 2 , V.E. Brando 1 , D.Hudson 2 1 CSIRO - Commonwealth Scientific & Industrial Research Organisation 2 GA – GeoScience Australia Shallow Survey 2012 Wellington, New Zealand , 22 February 2012
Transcript of Bathymetry from satellites for hydrographic purposes survey/presentations/26.pdf · Bathymetry from...

Bathymetry from satellites for hydrographic purposes A.G. Dekker1, S. Sagar2, V.E. Brando1, D.Hudson2
1 CSIRO - Commonwealth Scientific & Industrial Research Organisation 2 GA – GeoScience Australia
Shallow Survey 2012
Wellington, New Zealand , 22 February 2012

CSIRO
Introduction
Contents:
• Introduction to method
• Case studies of airborne and satellite derived bathymetry
interpreted by IHO bathymetric standards
• Conclusions and Recommendations

CSIRO
The conceptual model for optically deep and shallow waters

CSIRO. V. Brando - A physics based retrieval and quality assessment of bathymetry from suboptimal hyperspectral data.
physics based approach
Integrated physics
based mapping
approach that
includes atmospheric
correction and an
objective process of
quality control:
1. Atmospheric correction
2. Noise estimate
3. Inversion optimization
(SAMBUCA)
4. Quality control
at sensorL
rsr
QA variables:
SDI
Raw output:
bathymetry
substratum
concentrations
( , ,CHL CDOM NAPC C C )
radiosonde data
wind speed
ozone
horizontal visibility
SIOPs
concentration ranges
substrate spectra library
ENE rsr
QC’ed output:
bathymetry
substratum
concentrations
( , ,CHL CDOM NAPC C C )
SDI
Step 3:
inversion optimization
(SAMBUCA)
Step 1:
atmospheric correction
(WOMBAT)
Step 4:
quality control
(SAMBUCA)
ENE rsr
imagery
or spectra
process
Input parameters
Step 2:
noise estimate

Remote sensing of remote tropical Commonwealth marine protected areas
water
optical
properties
Substratum
reflectance
spectra
Physics-based
inversion model
(SAMBUCA Model)
Information Products
Substrate maps
Bathymetry maps
Accuracy maps
Satellite Remote Sensing Processing Pathway-
Physics-based inversion approach
satellite image
Pre-processing:
• De-glinting
• Atmospheric correction

Empirical vs physics-based methods
Empirical methods work when
• substratum and water column are homogeneous
• in situ bathymetry data is available
Empirical methods have no capability of
• assessing model based uncertainty
• transferring relationships across sensors
Physics based models:
• can deal with variable substratum and variable water
column properties
• can determine model uncertainty
• use all spectral information available –and therefore can
switch across sensors types
• outperform empirical methods (See Dekker et al., 2011)
• also performs without in situ data- by parameterising
with “best guess” bio-optical data CSIRO

CSIRO Overview Estuarine and Coastal Remote Sensing in Australia
Variables that can be measured directly using
physics-based earth observation methods (1)
• Water Column Properties:
• Chlorophyll-a, Phaeophytin (all photosynthesizing orgs)
• Cyano-phycocyanin & -erythrin=>Cyanobacteria
• Total Suspended Matter
• Coloured Dissolved Organic Matter
• Transparency/Turbidity/Vertical Attenuation of Light
• 3-D Information (if the bottom is visible)
• Bathymetry (depth of substrate)
• Bottom Relief (topography)

CSIRO Overview Estuarine and Coastal Remote Sensing in Australia
• Benthic (& Intertidal) substratum • Coastal: Seagrasses, macro-algae and associated
substrates & freshwater: macrophytes and associated substrates
• Extent
• Main species differentiation: if spectrally & spatially discriminable!
• Density of cover; biomass
• Coral Reef and associated substrates
• Extent
• Bleaching
• Main substratum types (Live coral ,dead coral , seagrasses, macro-algae)-main species : if spectrally & spatially discriminable!
Variables that can be measured directly using
physics-based earth observation methods (1)(2)
(now also approaches using object-oriented image processing methods)

IHO Standards for Hydrographic Surveys-
at 10m survey depth
For satellite bathymetry the following criteria affect the meeting of IHO standards :
• Data quality (satellite imagery)
• Pre-processing (atmospheric & sun glint correction)
• Existing site information (bathymetry, substrate maps, GCPs..)
•„Tide reduction (post-processing) Note: a satellite image is a snapshot!

Total Vertical Uncertainty IHO definition
CSIRO
For Multispectral Satellite derived bathymetry “b” increases with depth: faster
than most other bathymetric methods:
• LADS has a similar depth dependency-but is not the same as for satellite
imagery as LADS is an active system generating its own pulses of light and
LADS timegates the response ping.
• Satellite imaging is based on measuring reflected solar and sky light from the
benthos

ALOS AVNIR-2 Bathymetry in the Great Barrier Reef – 15ARSPC
Example of using 10 m spatial resolution
ALOS data (low cost )
DARLEY AND DINGO REEF
Located approx 90km north off
Bowen on the Queensland Coast

ALOS AVNIR-2 Bathymetry in the Great Barrier Reef – 15ARSPC
Validation using LADS (I or II) data Surface Comparison
LADS – Inverse Distance
Weighting Interpolated
ALSOS Bathymetry Map
ALOS Bathymetry Map
Median 3x3 Filter

ALOS AVNIR-2 Bathymetry in the Great Barrier Reef – 15ARSPC
Validation of ALOS derived bathymetry using
LADS (I or II) data
300 Points randomly selected in low gradient homogenous areas
R2 = 0.94
RMSE = 0.5 m (note :Not TVU!)

North West Gizo
(Solomon Islands)
Quickbird v ALOS
Quickbird
2.4m pixels ALOS
AVNIR2
10m pixels

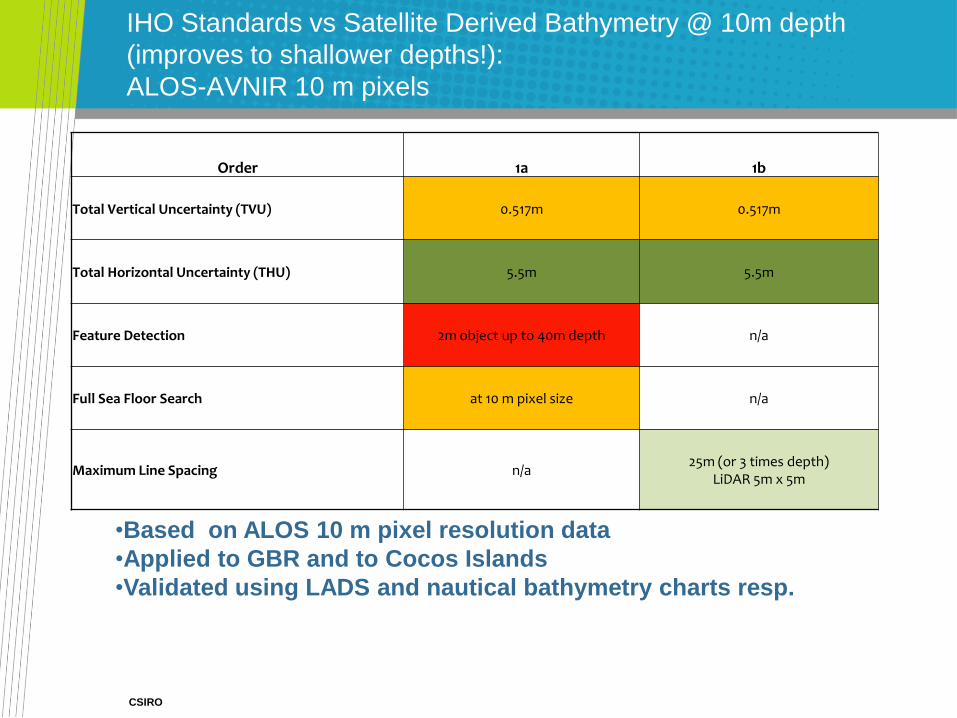
IHO Standards vs Satellite Derived Bathymetry @ 10m depth
(improves to shallower depths!):
ALOS-AVNIR 10 m pixels
CSIRO
•Based on ALOS 10 m pixel resolution data
•Applied to GBR and to Cocos Islands
•Validated using LADS (I or II) and nautical bathymetry charts resp.
Order 1a 1b
Total Vertical Uncertainty (TVU) 0.517m 0.517m
Total Horizontal Uncertainty (THU) 5.5m 5.5m
Feature Detection 2m object up to 40m depth n/a
Full Sea Floor Search at 10 m pixel size n/a
Maximum Line Spacing n/a 25m (or 3 times depth)
LiDAR 5m x 5m

Deriving Shallow Water Bathymetry from
Multi-spectral Data
SAMBUCA applied to multi-spectral
satellite data - shallow water
bathymetry up to 25m depth.
Spectral
measurements of
substrates made on-
site improve the
bathymetry
estimation process
Seagrass
Sand
Coral
Lord Howe Island, NSW - Quickbird 2.4m
resolution multi-spectral image acquired
9th Feb 2009

Lord Howe Island Bathymetry
- Northern Extents & Lagoon

Note: RAN LADS I - collected by RAN1997 & QuickBird data from Sep 2009
CSIRO

IHO Standards vs Satellite Derived Bathymetry @ 10m depth
(improves to shallower depths!):
QuickBird 2.6 m pixels
CSIRO
•Based on QuickBird 2.6 m pixels
•Applied to Lord Howe Island
•Validated using LADS I and nautical bathymetry charts
Order 1a 1b
Total Vertical Uncertainty (TVU) 0.517m 0.517m
Total Horizontal Uncertainty (THU) 5.5m 5.5m
Feature Detection 2m object up to 40m depth n/a
Full Sea Floor Search Yes(at 2.6 m pixels) n/a
Maximum Line Spacing n/a 25m (or 3 times depth)
LiDAR 5m x 5m

CSIRO. V. Brando - A physics based retrieval and quality assessment of bathymetry from suboptimal hyperspectral data.
Hyperspectral airborne and acoustic bathymetric
survey for the Moreton Bay Rous Channel area
A number of underwater acoustical
and video sensors were deployed in
Moreton Bay between 29 August
and 5 September 2004.
Aim: to obtain an integrated data
set of airborne CASI, multibeam,
drop-down video and other sensors,
platforms and ground-truth
information to enable the
comparison of bathymetry
retrieval.

CSIRO. V. Brando - A physics based retrieval and quality assessment of bathymetry from suboptimal hyperspectral data.
Acoustic bathymetric survey for the
Rous Channel area
• Bathymetric surface derived from the acoustic bathymetric survey
• Bathymetry vectors supplied by Port Authority- Queensland
Department of Transport.

CSIRO. V. Brando - A physics based retrieval and quality assessment of bathymetry from suboptimal hyperspectral data.
Pseudo true colour composite of the CASI-2
imagery for the Rous Channel area
• inadequate quality of portions of the CASI-2 image:
• Some very shallow portions of the Eastern banks are as bright a as the
thick clouds.
• A cloud masking based on cloud spectral properties was attempted but it
was not adopted as it showed a low accuracy
•

CSIRO. V. Brando - A physics based retrieval and quality assessment of bathymetry from suboptimal hyperspectral data.
Quality control map based on model agreement
and substratum visibility
Quality control of CASI image bathymetry
retrieval using SAMBUCA

CSIRO. V. Brando - A physics based retrieval and quality assessment of bathymetry from suboptimal hyperspectral data.
Accuracy of bathymetry retrieval
To our knowledge, the quantitative
identification and screening of the
“optically deep waters” and the
“quasi-optically deep waters” was
never attempted prior to this
research, leading to a degraded
accuracy in the depth retrievals for
previous studies as the waters
became deeper or more turbid
Lee et al., 2007
Goodman & Ustin, 2007
Stumpf et al., 2003
0
3
6
9
12
15
18
0 3 6 9 12 15
Depth (Acoustics) [m]
Dep
th (
CA
SI-
SA
MB
UC
A)
[m]
sambuca (good closure,opt.shallow) sambuca (bad closure,opt.deep) sambuca (bad closure,opt. shallow) sambuca (bad closure,opt.deep)
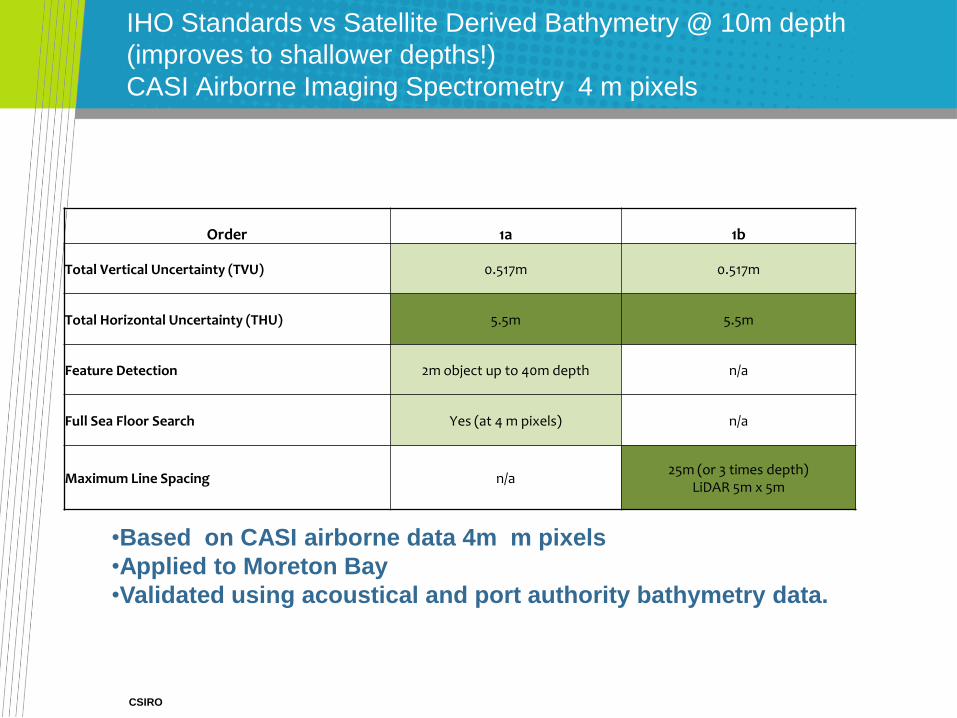
IHO Standards vs Satellite Derived Bathymetry @ 10m depth
(improves to shallower depths!)
CASI Airborne Imaging Spectrometry 4 m pixels
CSIRO
•Based on CASI airborne data 4m m pixels
•Applied to Moreton Bay
•Validated using acoustical and port authority bathymetry data.
Order 1a 1b
Total Vertical Uncertainty (TVU) 0.517m 0.517m
Total Horizontal Uncertainty (THU) 5.5m 5.5m
Feature Detection 2m object up to 40m depth n/a
Full Sea Floor Search Yes (at 4 m pixels) n/a
Maximum Line Spacing n/a 25m (or 3 times depth)
LiDAR 5m x 5m

CSIRO
0
2
4
6
8
10
12
14
16
18
0 2 4 6 8 10 12 14 16
Re
trie
ved
Bat
hym
etr
y (m
)
True Bathymetry (m)
Sat +10%
1 a+b S44
Sat-10%
1 a+b S44
True Bathymetry
Comparison of Satellite Bathymetry uncertainty (10% of depth) to IHO Standardsbased on simulated data
Satellite Bathymetry uncertainty at Order 1 a & b from surface to 5m depth

CSIRO
0
1
2
3
4
5
6
7
8
0 1 2 3 4 5 6 7 8
Re
trie
ved
Bat
hym
etr
y (m
)
True Bathymetry (m)
Sat +10%
1 a+b S44
Sat-10%
1 a+b S44
True Bathymetry
Comparison of Satellite Bathymetry uncertainty (10% of depth) to IHO Standardsbased on simulated data
Satellite Bathymetry uncertainty at Order 1 a & b from surface to 5m depth

CSIRO
Recommendations
Perform a dedicated comparison project with remote sensing and hydrographic bathymetry experts:
• LADS and/or multibeam calibrated and validated data
• Multispectral satellite image(s) e.g. WorldView-2, Quick Bird, RapidEye, IKONOS etc.
• Preferably (near) synchronous collection
Scenario testing to assess applicability under various realistic conditions: process satellite images with
• No ancillary data (remote or denied area scenario)
• Limited ancillary data (remote or denied area scenario where a priori information can be obtained)
• Complete ancillary data
Assess utility of
• analysing multiple images in surf zones for surf zone bathymetry
• bottom topography and roughness mapping
• simultaneous benthic composition and water quality mapping capabilities
Rigorous uncertainty estimation

CSIRO
Recommendations
The physics-based inversion methods for satellite bathymetry, benthic mapping and water quality can be applied successfully to archival satellite images.
Retrospective mapping can be done: back to 1984 for Landsat (30 m resolution) and back to 1973 for Landsat
MSS images (80 m resolution)
Back to 1999 for IKONOS; 2002 Quickbird etc.,and then later on RapidEye, WorldView-2, GeoEye etc..
Note: for physics-based inversion at a minimum three visible spectral bands (Blue, Green and Red) are required and (for less then 2 m depth) one nearby Infrared band.

CSIRO
Should an additional column be added to IHO standards for high
spatial resolution multispectral satellite derived bathymetry?
Depending on
• quality of satellite data
• access to a priori site information
• Water column turbidity
• And the decrease of accuracy with depth inherent to a passive optical detection system
…bathymetry assessment performance varies across current IHO bathymetry standards……..!
Bathymetry from multispectral satellite data is:
• more accurate at very shallow depths (0 m to 5 m)
• sufficiently accurate to 5 or 10 m depth
• Capable of bathymetry from 15 to 35m depth at lower accuracy
• Spatially comprehensive

Coral Sea Millenium mapping zones overlaid
with bathymetry contours (100 m) from
National Marine Bioregionalisation of Australia
(DEWHA)
Satellite-derived bathymetry map
(CSIRO) at 2.6 m spatial resolution
(depth scale in m) down to 35 m
Atmospherically
and sun-glint
corrected
satellite image
Bathymetry map
40 to zero m
IHO Standards vs Satellite Derived Bathymetry @ 10m depth
(improves to shallower depths!):
ALOS-AVNIR 10 m pixels
CSIRO
•Based on ALOS 10 m pixel resolution data
•Applied to GBR and to Cocos Islands
•Validated using LADS and nautical bathymetry charts resp.
Order 1a 1b
Total Vertical Uncertainty (TVU) 0.517m 0.517m
Total Horizontal Uncertainty (THU) 5.5m 5.5m
Feature Detection 2m object up to 40m depth n/a
Full Sea Floor Search at 10 m pixel size n/a
Maximum Line Spacing n/a 25m (or 3 times depth)
LiDAR 5m x 5m

IHO Standards vs Satellite Derived Bathymetry @ 10m depth
(improves to shallower depths!):
QuickBird 2.6 m pixels
CSIRO
•Based on QuickBird 2.6 mm pixels
•Applied to Lord Howe Island
•Validated using LADS and nautical bathymetry charts
Order 1a 1b
Total Vertical Uncertainty (TVU) 0.517m 0.517m
Total Horizontal Uncertainty (THU) 5.5m 5.5m
Feature Detection 2m object up to 40m depth n/a
Full Sea Floor Search Yes (at 2.6 m pixels) n/a
Maximum Line Spacing n/a 25m (or 3 times depth)
LiDAR 5m x 5m

IHO Standards vs Satellite Derived Bathymetry @ 10m depth
(improves to shallower depths!)
CASI Airborne Imaging Spectrometry 4 m pixels
CSIRO
•Based on CASI airborne data 4m pixels
•Applied to Moreton Bay
•Validated using acoustical and port authority bathymetry data.
Order 1a 1b
Total Vertical Uncertainty (TVU) 0.517m 0.517m
Total Horizontal Uncertainty (THU) 5.5m 5.5m
Feature Detection 2m object up to 40m depth n/a
Full Sea Floor Search Yes(at 4 m pixels) n/a
Maximum Line Spacing n/a 25m (or 3 times depth)
LiDAR 5m x 5m

New satellite IHO Standards for Satellite Derived
Bathymetry @ 5 m depth ?
Order 1 Sat
Total Vertical Uncertainty (TVU) 10% of depth m)
Total Horizontal Uncertainty (THU) Pixelsize (2 – 10 m)
Note that with no GCPs THU may be 3 to 5 pixels High within image coregistration accuracy
Feature Detection A pixel size object up to 15 m depth
Full Sea Floor Search Yes – to visibility depth-at pixel size
Maximum Line Spacing Pixel size (2 to 10 m)
CSIRO

Thank you!
Acknowledgement s:
CSIRO: Janet Anstee and Simon Allen
James Cook University: Rob Beaman
Most relevant publications:
Dekker A.G., Phinn S.R., Anstee J.M., Bissett P. Brando V.E., Casey B. Fearns P., Hedley
J., Klonowski, W., Lee Z.P., Lynch M., Lyons M., Mobley C. and Roelfsema C. (2011)
Intercomparison of shallow water bathymetry, hydro-optics and benthos mapping
techniques in Australian and Caribbean coastal environments; Limnology &
Oceanography Methods. 9:pp 396-425. | DOI: 10.4319/lom.2011.9.396.
Brando, V.E., Anstee, J.M., Wettle, Dekker, A.G., Phinn, S.R., and Roelfsema, C (2009) "A
Physics Based Retrieval and Quality Assessment of Bathymetry from Suboptimal
Hyperspectral Data," Remote Sensing of Environment 113 (2009), pp. 755-770,
10.1016/j.rse.2008.12.003
CSIRO
Some related publications
• Dekker A.G., Phinn S.R., Anstee J.M., Bissett P. Brando V.E., Casey B. Fearns P., Hedley J., Klonowski, W., Lee
Z.P., Lynch M., Lyons M., Mobley C. and Roelfsema C. (2011) Intercomparison of shallow water bathymetry, hydro-
optics and benthos mapping techniques in Australian and Caribbean coastal environments; Limnology &
Oceanography Methods. 9:pp 396-425. | DOI: 10.4319/lom.2011.9.396.
• Brando, V.E., Anstee, J.M., Wettle, Dekker, A.G., Phinn, S.R., and Roelfsema, C (2009) "A Physics Based Retrieval
and Quality Assessment of Bathymetry from Suboptimal Hyperspectral Data," Remote Sensing of Environment 113
(2009), pp. 755-770, 10.1016/j.rse.2008.12.003
• Kutser, T., Dekker, A. G., Skirving, W. (2003) Modeling spectral discrimination of Great Barrier Reef benthic
communities by remote sensing instruments. Limn.& Oceanogr. 48: p 497-510.
• Dekker, A. G. , Jordan, A. and Mount, R. (2008). Satellite and airborne imagery including aerial photography.
Chapter in “Marine benthic habitat mapping special publication” : p 11-28. Geological Association of Canada: 327
p. ISBN-13: 978-1-897095-33-1; ISSN: 0072-1042.
• Dekker, A. G., Brando, V.E., Anstee, J.M., Fyfe, S., Malthus, T.J.M. & Karpouzli, E. (2006) Remote sensing of
seagrass ecosystems: use of spaceborne and airborne sensors, Chapter 15 in : Larkum, A,., Orth, B and Duarte, C.
(eds) Seagrass Biology, Ecology and Conservation , Springer Verlag, Germany: pp 630.
• Zimmerman, R.C. and Dekker, A. G (2006) Aquatic Optics: Basic concepts for understanding how light affects
seagrasses and makes them measurable from space, Chapter 12 in : Larkum, A,., Orth, B and Duarte, C. (eds)
Seagrass Biology, Ecology and Conservation , Springer Verlag, Germany: pp 630.
• Dekker, A.G., Brodie, J. and Steven, A (2006) Cattle, crops and coral: Flood plumes and the Great Barrier Reef (ed:
Stephanie Renfrow), NASA Distributed Archive Center Annual Report 2006, NASA National Snow and Ice Data
Center DAAC; Boulder , Co, USA.
• Dekker, A. G., V. E. Brando, J. M. Anstee, N. Pinnel, T. Kutser, H. J. Hoogenboom, R. Pasterkamp, S. W. M. Peters,
R. J. Vos, C. Olbert, and T. J. Malthus, 2001, Imaging spectrometry of water, Ch. 11 in: Imaging Spectrometry: Basic
principles and prospective applications: Remote Sensing and Digital Image Processing, v. IV: Dordrecht, Kluwer
Academic Publishers, p. 307 - 359.
S. Sagar and M. Wettle (2010) Mapping the fine-scale shallow water bathymetry of the Great Barrier Reef using
ALOS AVNIR-2 data; presented at Oceans 2010 Conference.
CSIRO