Bathymetric Terrain Model of the Atlantic Margin for...
17
Bathymetric Terrain Model of the Atlantic Margin for Marine Geological Investigations By Brian D. Andrews, Jason D. Chaytor, Uri S. ten Brink, Daniel S. Brothers, James V. Gardner, Elizabeth A. Lobecker, and Brian R. Calder Open-File Report 2012–1266, Version 2.0 U.S. Department of the Interior U.S. Geological Survey
Transcript of Bathymetric Terrain Model of the Atlantic Margin for...

Bathymetric Terrain Model of the Atlantic Margin for Marine Geological Investigations
By Brian D. Andrews, Jason D. Chaytor, Uri S. ten Brink, Daniel S. Brothers, James V. Gardner,
Elizabeth A. Lobecker, and Brian R. Calder
Open-File Report 2012–1266, Version 2.0
U.S. Department of the Interior U.S. Geological Survey

U.S. Department of the Interior SALLY JEWELL, Secretary
U.S. Geological Survey Suzette M. Kimball, Director
U.S. Geological Survey, Reston, Virginia: 2016
For more information on the USGS—the Federal source for science about the Earth, it’s natural and living resources, natural hazards, and the environment—visit http://www.usgs.gov or call 1–888–ASK–USGS
For an overview of USGS information products, including maps, imagery, and publications, visit http://www.usgs.gov/pubprod
To order this and other USGS information products, visit http://store.usgs.gov
Although these data have been processed successfully on a computer system at the U.S. Geological Survey (USGS), no warranty expressed or implied is made regarding the display or utility of the data on any other system or for general or scientific purposes, nor shall the act of distribution constitute any such warranty. The USGS or the U.S. Government shall not be held liable for improper or incorrect use of the data described and/or contained herein. Any use of trade, product, or firm names is for descriptive purposes only and does not imply endorsement by the U.S. Government.
Although this report is in the public domain, permission must be secured from the individual copyright owners to reproduce any copyrighted material contained within this report.
Suggested citation: Andrews, B.D., Chaytor, J.D., ten Brink, U.S., Brothers, D.S., Gardner, J.V., Lobecker, E.A., and Calder, B.R., 2016, Bathymetric terrain model of the Atlantic margin for marine geological investigations: U.S. Geological Survey Open-File Report 2012–1266, Ver 2.0 11 p., http:/pubs.usgs.gov/of/2012/1266/.

iii
Acknowledgements
This report was prepared as part of a multiyear project funded by the NRC to study potential effects of tsunamis produced from marine landslides. We thank the Captain and crew of the NOAA Ship Okeanos Explorer, and the RV Marcus G. Langseth for their recent mapping efforts along the Atlantic margin. Deborah Hutchinson, and Nathan Miller of the USGS provided helpful comments. We thank VeeAnn Cross of the USGS for her comments on the metadata, Andrea Toran for her expertise in Web design, and Anna Glover for her editorial review of this report.

iv
Contents
Acknowledgements ......................................................................................................................................................... iiiConversion Factors and Datum ....................................................................................................................................... vAbbreviations ................................................................................................................................................................... vAbstract ........................................................................................................................................................................... 1Introduction ...................................................................................................................................................................... 1Common Processing Methods ........................................................................................................................................ 2
Data Access and Download ......................................................................................................................................... 2Data Processing .......................................................................................................................................................... 3
Data Catalog .................................................................................................................................................................... 4Projection ..................................................................................................................................................................... 4Data Resolution ........................................................................................................................................................... 4
Map Sheet ....................................................................................................................................................................... 5References Cited ............................................................................................................................................................. 5Appendix 1.Individual Surveys Used as Sources for the Bathymetric Terrain Model for the Atlantic
Margin of the United States .................................................................................................................................... 12
Figures
Figure 1. Map showing the location of the Atlantic margin and the extent of the bathymetric
terrain model seaward of the U.S. Atlantic coast published in this report. Land elevations in green
and additional regional bathymetry in light blue are for basemap purposes only and are not
published in this report. Data are from the University of New Hampshire, U.S. Geological Survey,
and the National Oceanic and Atmospheric Administration National Centers for Environmental
Information. Max, maximum; Min, minimum. ...................................................................................... 8
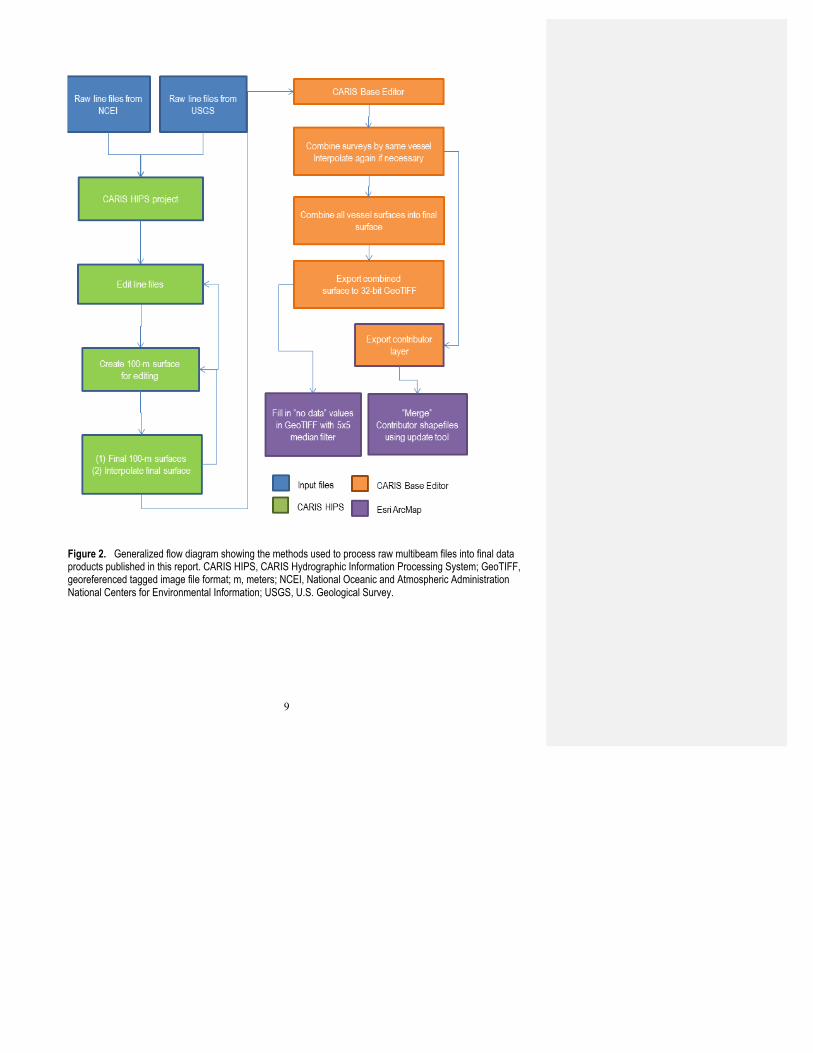
Figure 2. Generalized flow diagram showing the methods used to process raw multibeam files
into final data products published in this report. CARIS HIPS, CARIS Hydrographic Information
Processing System; GeoTIFF, georeferenced tagged image file format; m, meters; NCEI, National
Oceanic and Atmospheric Administration National Centers for Environmental Information; USGS,
U.S. Geological Survey. ..................................................................................................................... 9
Figure 3. Map showing the source surveys (color coded by survey vessel) used to compile the
final bathymetric terrain model and published as an Esri shapefile in this report. Surveys are listed
in appendix 1. Land elevations in green and regional bathymetry in light blue are for basemap
Deleted: 2
Deleted: 11
Deleted: 7
Deleted: 8

v
purposes only and are not published in this report. Data are from the U.S. Geological Survey and
the National Oceanic and Atmospheric Administration National Centers for Environmental
Information. 10
Conversion Factors and Datum SI to Inch/Pound
Multiply By To obtain centimeter (cm) 0.3937 inch (in.) meter (m) 3.281 foot (ft) kilometer (km) 0.6214 mile (mi) kilometer (km) 0.5400 mile, nautical (nmi) meter (m) 1.094 yard (yd) meter per second (m/s) 3.281 foot per second (ft/s) Vertical coordinate information is referenced to the Instantaneous Sea Level. Horizontal coordinate information is referenced to the World Geodetic System 1984 (WGS 84).
Abbreviations
BTM bathymetric terrain model CCOM Center for Coastal and Ocean Mapping CRM coastal relief model ECS extended continental shelf GCS geographic coordinate system GIS geographic information system HIPS hydrographic information processing system JHC Joint Hydrographic Center NOAA National Oceanic and Atmospheric Administration NRC U.S. Nuclear Regulatory Commission OE NOAA Ocean Exploration Program NGDC National Geophysical Data Center NCEI National Centers for Environmental Information UNH University of New Hampshire USAM U.S. Atlantic margin USGS U.S. Geological Survey WMS Web mapping service
Deleted: 9

1
Bathymetric Terrain Model of the Atlantic Margin for Marine Geological Investigations
By Brian D. Andrews,1 Jason D. Chaytor,1 Uri S. ten Brink,1 Daniel S. Brothers,1 and James V. Gardner2,
Lobecker, E.A. 3 , and Brian R. Calder2
Abstract
A bathymetric terrain model of the Atlantic Margin covering almost 725,000 square kilometers of seafloor from the New England Seamounts in the north, to the Blake Basin in the south is compiled from existing multibeam bathymetry data for marine geological investigations. Although other terrain models of the same area are extant, they are produced from either satellite-derived bathymetry at coarse resolution (ETOPO1), or use older bathymetry data collected using a combination of single beam, and multibeam sonars (Coastal Relief Model). The new multibeam data used to produce this terrain model have been edited using hydrographic data processing software to maximize the quality, usability, and cartographic presentation of the combined 100-meter resolution grid. The final grid provides the largest, high resolution, seamless terrain model of the Atlantic Margin.
Introduction
The purpose of the bathymetric terrain model presented in this report is to provide a high-quality bathymetric surface of the Atlantic margin of the United States that can be used to augment current and future marine geological investigations. Advances in acquisition and processing technologies of bathymetric data have facilitated the creation of high-resolution bathymetric surfaces that approach the resolution of similar surfaces available for onshore investigations. These bathymetric terrain models provide a detailed representation of the Earth’s subaqueous surface and, when combined with other geophysical and geological datasets, allow for interpretation of modern and ancient geological processes.
The input data for this bathymetric terrain model, covering approximately 725,000 square kilometers, were acquired between 1990 and 2015 by several sources, including the U.S. Geological Survey (USGS), the National Oceanic and Atmospheric Administration (NOAA), and the University of New Hampshire (UNH). The bathymetric data published in this report were compiled as part of a
1U.S. Geological Survey 2University of New Hampshire 3NOAA, Office of Ocean Exploration

2
project funded by the Nuclear Regulatory Commission (NRC) to evaluate tsunami hazards along the East Coast of the United States. (ten Brink and others, 2010; 2016). This hazards analysis research required a high-quality bathymetric terrain model (BTM) to identify and characterize submarine landslides capable of generating tsunamis in order to assess potential tsunami impacts to nuclear power plants along the Atlantic coast (fig. 1). The BTM provided a consistent framework for hazard-assessment along the Atlantic margin of the United States, aiding in the interpretation of other geophysical and geological datasets( seismic data and sediment cores), allowing for the extraction of pertinent statistical risk parameters, and helping scientists to focus on critical areas for future data collection (Chaytor and others, 2009, 2011, 2012a,b; ten Brink and others, 2009, 2011, 2012, 2014; Flores and others, 2011;Geist and others, 2009, Brothers and others, 2013). The compilation benefited from bathymetric data collected by NOAA and UNH Center for Coastal and Ocean Mapping/Joint Hydrographic Center (CCOM/JHC) for the U.S. Extended Continental Shelf (ECS) program. The ECS program collected bathymetric data (from 2004 through 2015) on the slope and rise of the Atlantic Margin (Gardner, 2004; Cartwright and Gardner, 2005; Calder and Gardner; 2008, Armstrong and others, 2012, Calder, 2015) as part of the evaluation of a potential ECS delineation by the United States within the framework of the United Nations Convention on the Law of the Sea (Gardner and others, 2006).
Beyond the applied use of the bathymetric compilation in hazard characterization, the BTM provides a spatially consistent dataset for investigating modern and ancient geological processes along a passive margin that contains glacial, fluvial, and carbonate environments (for example, Twichell and others, 2009; Chaytor and others, 2012b; Brothers and others, 2013) and in support of habitat evaluations, physical oceanographic studies, and other evaluations of the seafloor off the coast of the eastern United States (Quattrini and others, 2015).
Common Processing Methods
The methods used to access, process, and compile the BTM published in this report are described in this section (fig. 2). The first step in the process inventories all existing bathymetric data using the Web mapping service (WMS) of the NCEI (National Centers for Environmental Information, 2015). Individual surveys (fig. 3) covering areas seaward of the shelf break of the Atlantic margin of the United States were identified using the NCEI WMS. Initially, 54 individual surveys covering the area of interest were accessed; the number of surveys was later reduced to 32 for the final grid (fig. 1).
Data Access and Download
Bathymetric line files in compressed format (MB-System format; Caress and Chayes, 2013) for each identified survey were downloaded from NCEI (see list of dataset download URLs in appendix 1). Three of these surveys (RB0904, NF–11–04–NC, and NF1208–USGS) were conducted by USGS scientists onboard National Oceanic and Atmospheric Administration (NOAA) vessels (appendix 1). The bathymetric line files for these three surveys were accessed in “raw.all” format by the USGS directly from the vessel during the survey and not downloaded from the NCEI. The USGS archived the line files from these three surveys after completion of the survey, and the NCEI converted the raw.all files to MB-System format for public access via the NCEI Web site.

3
Data Processing
The CARIS Hydrographic Information System (HIPS) was used to process the line files after they were downloaded from NCEI and uncompressed. A new HIPS Project was started for each of the individual surveys and the line files were imported for each day (Julian calendar). All bathymetric line files were collected, archived with NCEI, and imported to HIPS, using the Geographic Coordinate System (GCS). Bathymetric files were collected using instantaneous sea level, and no additional tidal corrections were applied during import into HIPS. Instantaneous sea level indicates that the data collected were not referenced to a tidal datum, rather that the depths represent a height that is dependent on the local sea level at that location and time. Instantaneous Sea Level does not correlate to Mean Sea Level, however for comparison, the total tidal levels (tides, plus no-tidal sea surface heights above the geoid) range between -2.3 meters and 2.0 meters above the geoid for the period 1992-2011 (Egbert and Erofeeva, 2013).
For each survey, an initial depth surface was produced as a base to edit the data. The depth surfaces were created using a Mercator projection which was more suitable for the spatial extent of this project than the GCS of the input line files. Several quality control steps were conducted to ensure that the final depth surfaces were free of depth spikes (erroneous data that would impact the quality of the final BTM) before combining the individual surfaces using CARIS Base Editor. Each survey line was reviewed and edited for bad soundings, and adjustments to the speed of sound corrections were applied if required. Depth and range filters were then applied using the Swath Editor feature within HIPS to eliminate erroneous soundings. After preliminary editing was completed, a final depth surface was produced and evaluated again for any remaining artifacts using both the three-dimensional (3D) editor and 3D viewer in HIPS. The spatial extent of each surface was created with other adjacent survey data in mind so that it included the most suitable data in areas overlap, and may not include all the data from each survey. This was a qualitative assessment to produce the cleanest regional coverage with the least artifacts from survey line orientation that would affect the quality of derivitave products such as hillshade or gradient grids. If additional edits were required, then the final surface was rebuilt and interpolated to fill in any remaining small data gaps (fig. 2).
Combining the individual surveys into one surface using Base Editor involved two basic steps: (1) surveys conducted by the same vessel were usually combined into a single surface, and (2) all surfaces were then combined into one final BTM of 100-meter (m) resolution, covering the extent of all surveys (fig. 2). Combining surveys from the same vessel is a logical first step; data acquisition techniques and equipment vary from vessel to vessel, thus different “vessel files” were used during the import of data into the CARIS HIPS software. Data collected with the same vessel but different surveys, for example, were combined into one base surface because they used the same sonar and acquisition methods.
During the “Combine” process, the order of the input surfaces was controlled using one of several queries provided in Base Editor. For example, in most cases, separate surveys from the same vessel were combined using the query “where creation date is greatest;” therefore, in the areas where input base surfaces overlapped, the output surface was produced using the surface with the most recent creation date and older data were omitted in the overlap area. This method ensured that the most recent version of the surface was used. The second step combined the individual “vessel” surfaces using the “creation date is greatest” query to determine the surface order and produce a single final surface with a cell resolution of 100 meters per pixel (fig. 1).
The “Combine” function in Base Editor also produces a “contributor” layer that records the extent of the input surface used as a source for each cell in the output surface. This is perhaps the greatest benefit of this method compared with previous bathymetric compilations in which the user

4
cannot trace the source of the final compilation. This contributor layer is published in this report (in Esri shapefile format) as a record of the input surfaces used during the ”Combine” function and is ultimately the source of each pixel in the final BTM, using the “Source” attribute in the “AtlanticMarginBathSource_V2” shapefile (see the Data Catalog section). The metadata that accompany the spatial data published in this report provide detailed descriptions of the methods and steps used to produce the final BTM and source polygon.
The ability to control the input order and the combination of large overlapping bathymetric surfaces within hydrographic software is a relatively new technique within the CARIS software suite. Similar operations could be performed using geographic information system (GIS) software; however, the ability to manipulate these data in their near-native form (as soundings) with in CARIS software makes the process of combining datasets of different age and quality on a margin-scale more efficient than working in GIS software. Furthermore, this method facilitates periodic updates to the BTM as new bathymetric data are acquired.
Data Catalog
These data may be updated as new bathymetry data are made available. A version number will be appended to file names. For example, version 2.0 of the BTM is "ambath100m_V2".
Projection
The data in this report are published using a Mercator projection with central longitude of 72 degrees west and latitude of true scale of 40 degrees north. All horizontal and vertical units are in meters. The projection parameters continued in the “prj.adf” file used by ArcGIS grid published in this report are listed below:
• Projection: MERCATOR • Datum: WGS84 • Spheroid: WGS84 • Units: METERS • Xshift: 0.0 • Yshift: 0.0 • Parameters:
• –72 0 0.0 /* longitude of central meridian • 40 0 0.0 /* latitude of true scale • 0.0 /* false easting (meters) • 0.0 /* false northing (meters)
Data Resolution

5
Layer (metadata) Description View Download
AtlanticMarginBathSource_V2 Identifies the name of the source grid used in the combine operation
AM_SourcePgon_V2.zip
ambath100m_V2 100-m gridded bathymetry
ambath100m_V2.zip
Map Sheet
The data published in this report are also presented as a map sheet in portable document file (pdf) format. The data in this map are for cartographic display of the Atlantic Margin of the East coast of the United States and include data that were not collected for the purposes of the BTM published in this report. The areas covered by the BTM published in this report are outlined in gray in the inset map at the lower right of the map sheet. Other data are included for visual display only.
References Cited
Armstrong, A.A., Calder, B.R., and Smith, S.M., U.S. Law of the Sea Cruise to Map the Foot of the Slope of the U.S. Atlantic Continental Margin: Leg 7”, University of New Hampshire, Center for Coastal and Ocean Mapping (CCOM)/Joint Hydrographic Center (JHC), 2012.
Brothers, D.S., ten Brink, U.S., Andrews, B.D., and Chaytor, J.D., 2013, Geomorphic characterization of the U.S. Atlantic continental margin: Marine Geology, v. 338, April 1, p. 46–63.
Caress, D.W., and Chayes, D.N., 2013, Mapping the seafloor—Software for the processing and display of swath sonar data (version 5.3.2017): Columbia University MB-System, available at http://www.ldeo.columbia.edu/res/pi/MB-System/.
Calder, B. R., "U.S. Law of the Sea Cruise to Map the Foot of the Slope of the Northeast U.S. Atlantic Continental Margin: Leg 8", University of New Hampshire, Center for Ocean and Coastal Mapping (CCOM)/Joint Hydrographic Center (JHC), 2015, (also available at http://ccom.unh.edu/sites/default/files/publications/cruise-report-MGL15-12-atlantic.pdf)
Calder, B.R., and Gardner, J.V., "U.S. Law of the Sea Cruise to Map the Foot of the Slope of the Northeast U.S. Atlantic Continental Margin: Leg 6:, University of New Hampshire (UNH), Center for Coastal and Ocean Mapping (CCOM)/Joint Hydrographic Center (JHC), 2008. (also available at http://ccom.unh.edu/sites/default/files/publications/Calder_08_cruise_report_Atlantic_KNOX17RR_0.pdf)
Cartwright, Doug, and Gardner, J.V., 2005, U.S. law of the sea cruise to map the foot of the slope and 2500-m isobath of the northeast U.S. Atlantic continental margin—Legs 4 and 5: University of New Hampshire cruise report, 30 p. (Also available at http://ccom.unh.edu/sites/default/files/publications/Cartwright_05_cruise_report_PF05-1.pdf.)
Chaytor, J.D., Brothers, D.S., ten Brink, U.S. and Baxter, C.D., 2012a, Submarine landslides on the mid-Atlantic and southern New England continental margins, USA: American Geophysical Union, fall meeting, San Francisco, Calif., December 3–7, 2012, abstract OS43C–1828.

6
Chaytor, J.D., Twichell, D.C., and ten Brink, U.S., 2012b, A reevaluation of the Munson-Nygren-retriever submarine landslide complex, Georges bank lower slope, western North Atlantic, in Yamada, Yasuhiro, Kawamura, Kichiro, Ikehara, Ken, Ogawa, Yujiro, Urgeles, Roger, Mosher, David, Chaytor, Jason, and Strasser, Michael, eds., Submarine mass movements and their consequences: Advances in Natural and Technological Hazards Research, p. 135–146.
Chaytor, J.D., ten Brink, U.S., Twichell, D.C., Baxter, C.D., Hallam, T.D., and Brothers, D.S., 2011, Submarine landslides along the U.S. Atlantic margin—Their distribution, failure processes, and age: American Geophysical Union, fall meeting, San Francisco, Calif., December 5–9, 2011, abstract T21A–2302.
Chaytor, J.D., ten Brink, U.S., Solow, A.R., and Andrews, B.D., 2009, Size distribution of submarine landslides along the U.S. Atlantic margin and its implications to tsunami hazards: Marine Geology, v. 264, nos. 1–2, p. 16–27.
Egbert, G.D., and Erofeeva, Svetlana, [2013]: The OSU TOPEX/Poseidon global inverse solution TPXO: Oregon State University TPXO version [8.0], accessed July 18, 2013, at http://volkov.oce.orst.edu/tides/global.html.
Flores, C.H, Brothers, D.S., ten Brink, U.S., and Chaytor, J.D., 2011, New geophysical constraints on the stratigraphy and structure of the southern New England continental margin: American Geophysical Union, fall meeting, San Francisco, Calif., December 5–9, 2011, abstract T21A–2286, accessed July 10, 2013, at http://adsabs.harvard.edu/abs/2011AGUFM.T21A2286F.
ten Brink, U.S., Chaytor, J.D., Geist, E.L., Brothers, D.S., Flores, C.H., Andrews, B.D., Miller, N.C., Hill, J.C., Atwater,B.F., and Locat, J., 2016, Tsunami Hazard Assessment for the U.S. Atlantic and Gulf Coasts Final Report to the U.S. Nuclear Regulatory Commission: U.S. Geological Survey Administrative Report. 339 p.
Gardner, J.V., 2004, U.S. law of the sea cruise to map the foot of the slope and 2500-m isobath of the northeast U.S. Atlantic continental margin—Legs 1, 2, and 3: University of New Hampshire cruise report, 61 p. (Also available at http://ccom.unh.edu/sites/default/files/publications/Gardner_04_cruise_report_HEN04-1.pdf.) Gardner, J.V., Mayer, L.A., and Armstrong, Andrew, 2006, Mapping supports potential submission to
U.N. law of the sea: Eos, Transactions, American Geophysical Union, v. 87, no. 16, p. 157–160. Geist, E.L., Lynett, P.J., and Chaytor, J.D., 2009, Hydrodynamic modeling of tsunamis from the
Currituck landslide: Marine Geology, v. 264, nos. 1–2, p. 41–52. National Centers for Environmental Information, 2012, Web_mercator/trackline_bathymetry
(mapserver): National Oceanic and Atmospheric Administration, National Centers for Environmental Information Web mapping service, accessed November 11, 2015, at http://maps.ngdc.noaa.gov/arcgis/rest/services/web_mercator/trackline_bathymetry/MapServer.
Quattrini, A.M., Nizinski, M.S., Chaytor, J.D., Demopoulos, A.J., Roark, E.B., France, S.C., Moore, J.A., Heyl, T., Auster, P.J., Kinlan, B., Ruppel, C., Elliott, K.P., Kennedy, B.R.C., Lobecker, E., Skarke, A., and Shank, T.M., 2015, Exploration of the canyon-incised continental margin of the northeastern United States reveals dynamic habitats and diverse communities: PLoS One, 10(10): e0139904, doi:10.1371/journal.pone.0139904, 34 p.
ten Brink, U.S., Chaytor; J.D., Andrews, B.D., Brothers, D.S., and Geist, E.L., 2012, Updated size distribution of submarine landslides along the U.S. Atlantic margin: American Geophysical Union, fall meeting, San Francisco, Calif., December 3–7, 2012, abstract OS43C–1827.
ten Brink, U.S., Chaytor, J.D., Brothers, D.S., Twichell, D.C., Ross, S.W., and Brooke, Sandra, 2011, New high-resolution mapping of submarine canyons in the mid-Atlantic continental margin:

7
American Geophysical Union, fall meeting, San Francisco, Calif., December 5–9, 2011, abstract T21A–2299.
ten Brink, U.S., Barkan, R., Andrews, B.D., and Chaytor, J.D., 2009, Size distributions and failure initiation of submarine and subaerial landslides: Earth and Planetary Science Letters, v. 287, nos. 1–2, p. 31–42.
ten Brink, U.S., Twichell, D.C., Chaytor, J.D., Danforth, W.W., Andrews, B.D., and Pendleton, E.A., 2010, Seafloor mapping of the continental slope of the U.S. Atlantic margin to study submarine landslides that could trigger tsunamis: Nuclear Regulatory Commission report for job no. N6480, 9 p., accessed July 117, 2013, at http://pbadupws.nrc.gov/docs/ML1205/ML12058A502.pdf.
ten Brink, U.S., Chaytor, J.D., Geist, E.L., Brothers, D.S., and Andrews, B.D., Assessment of tsunami hazard to the U.S. Atlantic margin, Review Article, Marine Geology, v. 353, p. 31-54, 2014
ten Brink, U.S., Chaytor, J.D., Geist, E.L., Bothers, D.S., Flores, C. H., Andrews, B.D., Miller, N.C., Hill, J.C., Atwater, B.F., and Locat J. , 2015, Tsunami Hazard Assessment for the U.S. Atlantic and Gulf Coasts Final Report to the U.S. Nuclear Regulatory Commission: U.S. Geological Survey Administrative Report. 339 p. Twichell, D.C., Chaytor, J.D., ten Brink, U.S., and Buczkowski, Brian, 2009, Morphology of late
Quaternary submarine landslides along the U.S. Atlantic continental margin: Marine Geology, v. 264, nos. 1–2, p. 4–15.

8
Figure 1. Map showing the location of the Atlantic margin and the extent of the bathymetric terrain model seaward of the U.S. Atlantic coast published in this report. Land elevations in green and additional regional bathymetry in light blue are for basemap purposes only and are not published in this report. Data are from the University of New Hampshire, U.S. Geological Survey, and the National Oceanic and Atmospheric Administration National Centers for Environmental Information. Max, maximum; Min, minimum.
9
Figure 2. Generalized flow diagram showing the methods used to process raw multibeam files into final data products published in this report. CARIS HIPS, CARIS Hydrographic Information Processing System; GeoTIFF, georeferenced tagged image file format; m, meters; NCEI, National Oceanic and Atmospheric Administration National Centers for Environmental Information; USGS, U.S. Geological Survey.

10
Figure 3. Map showing the source surveys (color coded by survey vessel) used to compile the final bathymetric terrain model and published as an Esri shapefile in this report. Surveys are listed in appendix 1. Land elevations in
UNH/NOAA
UNH/NOAA
UNH/NOAA
UNH/NOAA
UNH/NOAA
NOAA Formatted: Font color: Background 1
Formatted: Font color: Background 1
Formatted: Font color: Background 1
Formatted: Font color: Background 1
Formatted: Font color: Background 1

11
green and regional bathymetry in light blue are for basemap purposes only and are not published in this report. Data are from the U.S. Geological Survey and the National Oceanic and Atmospheric Administration National Centers for Environmental Information.

12
Appendix 1. Individual Surveys Used as Sources for the Bathymetric Terrain Model for the Atlantic Margin of the United States
Table 1–1. Surveys used as sources for the bathymetric terrain model for the Atlantic Margin of the United States. Surveys 17-32 are new additions in version 2 of the data. [kHz, kilohertz; NGDC, National Centers for Environmental Information; USNS, U.S. Navy ship]