Batch Online Performance - Confex · BOP Team resume 3 The ... address space on the MF such as:...
62
B O P Mark Youngs – Technical Architect Batch Online Performance Humana Application Performance
-
Upload
hoangthuan -
Category
Documents
-
view
222 -
download
2
Transcript of Batch Online Performance - Confex · BOP Team resume 3 The ... address space on the MF such as:...

B O P
Mark Youngs – Technical Architect
Batch Online Performance
Humana Application Performance

Program code must do more than merely produce the correct result…
It must be scalable
It must perform under system stress
It must be economical
Driving issues for BOP
2 Background | Goal | Approach | Where do we Look? | What to do? | Results | Contact

BOP Team resume
3
The members of the BOP have the following experience
Utilities
Database
SQL
SAS , System Monitors & Measurements
Program coding
System Z/OS Architecture
Background | Goal | Approach | Where do we Look? | What to do? | Results | Contact

BOP Team Scope
4
The members of the BOP team
focus on reducing mainframe CPU
cost .
M ost of our t ime is spent tuning
applicat ions code but we also help
with any work that occupies an
address space on the M F such as:
CICS, IDM S, M Q series, M onitors
and DB2.
Capacity (Resources/ scalability)
Performance (SLA/SLO)
Cost (Hardware/ Software)
Background | Goal | Approach | Where do we Look? | What to do? | Results | Contact

• 2 EC12
• Z/OS version 2.1 , July 2014
• 10 production LPARS
• 13 production DB2 regions v9 with one V10 CM (all v10 by August)
• 4 production DB2 retrieval regions (where ad-hoc goes to suffer)
• 14 test/QA DB2 regions all V10 CM
• Data sharing with two small DB2 production regions on separate LPARS
5
Humana MF environment as of June , 2014 .
Background | Goal | Approach | Where do we Look? | What to do? | Results | Contact
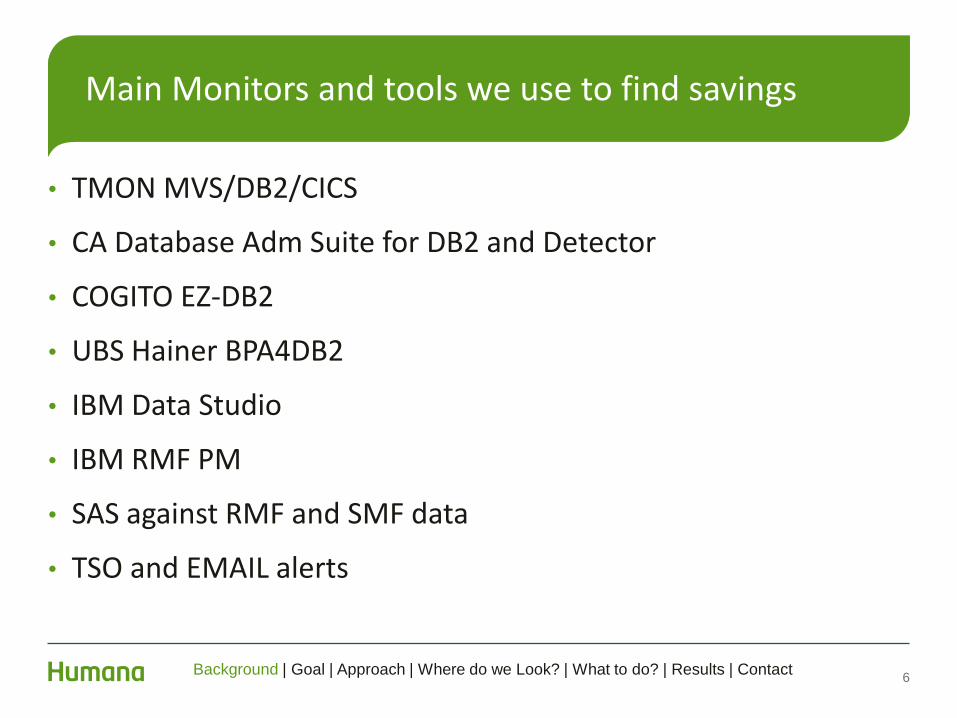
• TMON MVS/DB2/CICS
• CA Database Adm Suite for DB2 and Detector
• COGITO EZ-DB2
• UBS Hainer BPA4DB2
• IBM Data Studio
• IBM RMF PM
• SAS against RMF and SMF data
• TSO and EMAIL alerts
6
Main Monitors and tools we use to find savings
Background | Goal | Approach | Where do we Look? | What to do? | Results | Contact

• SELECT authority against all tables in test and production for explains, unloads, data analysis.
• DB2 sandbox with DBADM, we execute the DDL to support before/after solutions along with testing new indexes, MQT, UDF, ect. We usually use production data to load into the sandbox to test solutions and avoid unknown (to us) test data.
• Access to all tools and monitors at HUMANAs disposal.
• Ability to produce “testing code” and execute it.
• SMF data access via SAS performance database
• Compuware PurePath “end to end monitor”
7
BOP team requirements for DB2
Background | Goal | Approach | Where do we Look? | What to do? | Results | Contact

• Look for waste – Waste typically stands out • High CPU time
• Long response time / run time usually due to wait times
• High I/O counts
• High SQL counts
• High DB2 getpages counts
• High CICS calls
• Unusual MQ message behavior
• Create reporting to expose the largest consumers of resources from multiple angles
• Take spot measurements when you notice something big – watch your system using real-time monitors
Approach
8 Background | Goal | Approach | Where do we Look? | What to do? | Results | Contact

• Multiple perspectives are required
– Total resource by individual program execution
– Total resource by program in aggregate
– Peak hours, peak days – Month-end
– Use multiple descriptive statistics
• Averages hide problems
– Utilities are not exempt
Perspective
9 Background | Goal | Approach | Where do we Look? | What to do? | Results | Contact

• Your subsystems will cry foul
– CICS abends
– DB2 SQL errors
• Abend processing is costly
• How many abends are you happy with?
• How many SQL errors make sense?
• Recurrent batch failures that get “fixed” constantly
Listen…
10 Background | Goal | Approach | Where do we Look? | What to do? | Results | Contact
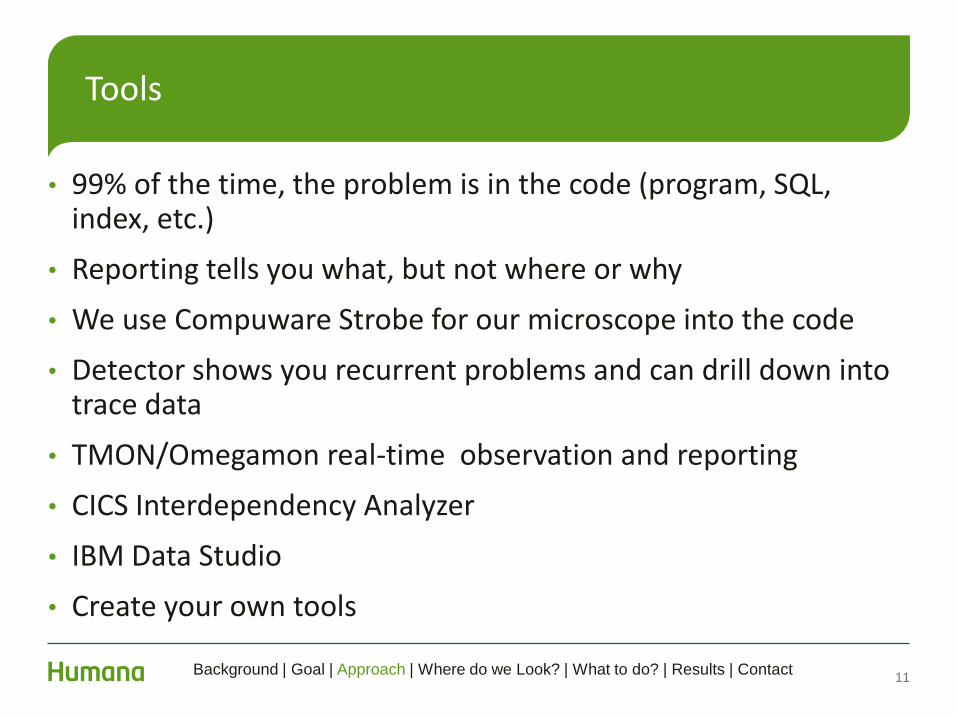
• 99% of the time, the problem is in the code (program, SQL, index, etc.)
• Reporting tells you what, but not where or why
• We use Compuware Strobe for our microscope into the code
• Detector shows you recurrent problems and can drill down into trace data
• TMON/Omegamon real-time observation and reporting
• CICS Interdependency Analyzer
• IBM Data Studio
• Create your own tools
Tools
11 Background | Goal | Approach | Where do we Look? | What to do? | Results | Contact

• Reduced batch clock time
• Reduced transaction response time
• Improved scalability
• Consistent performance under stress
• Reduced cost of application
• Reduced abends and support calls
• Reduced failed transactions
• Improved user experience
• Improved transaction accuracy
What’s In It For You?
12 Background | Goal | Approach | Where do we Look? | What to do? | Results | Contact

• A getpage implies a trip to one or more DB2 address spaces
• Found in buffer is ok but not free and if it is found more times than it exist in the table/indexes for one unit of work, then it is redundant.
• Batch processing on large transactional tables for non transactional reporting can sometimes be negated (Fastunload) and turn days into hours or hours into minutes of execution. Time=Work=Money.
• In general we are not involved in database/applications design. We recommend DDL changes when other measures are exhausted (Altered SQL, increased predicate use, sorting keys prior to executing sql, program arrays, etc.)
• We utilize memory wherever/whenever possible.
13
“A GETPAGE by any other name is MONEY!” some english fella.
Background | Goal | Approach | Where do we Look? | What to do? | Results | Contact

• TMON MVS/DB2/CICS
• CA Database Adm Suite for DB2 and Detector
• COGITO EZ-DB2
• UBS Hainer BPA4DB2
• IBM data studio
• IBM RMF PM
• SAS against RMF and SMF data
• TSO and EMAIL alerts
14
Main Monitors and tools we use to find savings at Humana

15
We start where are the savings are most valuable but are weary of the things that creep in or push this window around (usually batch)
Background | Goal | Approach | Where do we Look? | What to do? | Results | Contact

16
CA Detector exception analyzer was a good starting point for us to work on the most obvious problems
Background | Goal | Approach | Where do we Look? | What to do? | Results | Contact

17
Over the years we have lowered the thresholds
Profile ID ==> COLLPROF Profile SSID ==> DBP2 Last Update Userid ==> xyzzx Last Update Date ==> 11-16-12 Last Update Time ==> 13:04:00 Dynamic SQL Exception Thresholds Static SQL Exception Thresholds -------------------------------- ------------------------------- CPU Time ==> 00:00:00.500 CPU Time ==> 00:00:10.000 Getpage Reqs ==> 00040000 Getpage Reqs ==> 00040000
Fetch Count ==> 00300000 Fetch Count ==> 00300000
We continue to lower the Getpage trigger as we work thru and
fix the exceptions generated. In general 99% of the exceptions
are triggered by the getpage threshold but there are occasions
where CPU work creates an exception.
Background | Goal | Approach | Where do we Look? | What to do? | Results | Contact

• The following example is used to highlight some of the tools we use to explore MSU consumption stemming from a DB2 region.
• In this case there are alerts/reports to the DBA staff that show a growth in table data that may need attention but this one slipped by and wasn’t caught.
• Basically a COBOL stored procedure is performing SQL against a table that grew from a few rows to a few thousand and the original access path proved poor (Tablespace scan).
18
When GOOD things go BAD
Background | Goal | Approach | Where do we Look? | What to do? | Results | Contact

19
When looking at CA Subsystem Analyzer the table TDOLTSS is historically not on the top of this list.
16.0 > -------- SS Analyzer Table Activity Display -------- 05-29-14 14:06
Command ==> Scroll ==> CSR
LINE 1 OF 621
DB2 SSID ==> DBP5
View Type ==> O * -Object, V -Volume, B -BP, A -Extends, S -Subsys, Q -SQL
View By ==> T D -Dbase, S -Space , * -Table Filter ==> N Yes,No,Set
View Optn ==> A * -Activity, B -Access, C -Access Ratios
Interval Date => 05-28-14 Interval Time => 13:00:00 Elaps Time => 01-00
-------------------------------------------------------------------------------
S -Index Activity, A -SQL Activity, D -Table Detail, I -Index Analysis
TABLENAME DBNAME TSNAME PCTGP GETPAGE TB_GETPAGE IS_GETPAGE
------------------ -------- -------- ------ ---------- ---------- ----------
_ SYSLGRNX DSNDB01 SYSLGRNX 41.6% 847035642 842592956 4442686
_ TDOLTSS DDOMBR SDOLTSS 12.5% 253732703 253726656 6047
_ TDOMEMH DDOMBR SDOMEMH 11.4% 231442525 40236141 191206384
_ TDOCSTC DDOCSTC SDOCSTC 9.4% 190880825 64380595 126500230
_ TDOPERS DDOMBR SDOPERS 9.0% 183822468 54973147 128849321
_ TDOKCCOV DDOKYCOV SDOKCCOV 7.9% 161750888 10426646 151324242
Background | Goal | Approach | Where do we Look? | What to do? | Results | Contact

20
Further exploring shows the sql and program
16.0 ------------- DETECTOR SQL Call Text Display ------------ 05-29-14 14:21
Command ==> Scroll ==> CSR
DB2 SSID ==> DBP5 Planname ==> Program ==> MES047
Type ==> PACK Collid ==> MEHUMSPROC
Version ==> 2013-06-22-02.17.02.219408
-------------------------------------------------------------------------------
E -Explain SQL, T -Explain Text, I -ISQL ==> _
DECLARE INPUT_CSR CURSOR FOR
SELECT LTSS.PERS_GEN_KEY , LTSS.STATE_CODE , LTSS.PROGRAM_CODE ,
LTSS.PROD_PLAN_ID , LTSS.LTSS_EFF_DATE , LTSS.LTSS_END_DATE ,
LTSS.SRC_PLATFORM_CD , LTSS.SRC_APPL_CD
FROM A_DOLTSS LTSS INNER JOIN A_ME047I TEMP ON LTSS.PERS_GEN_KEY =
TEMP.MBR_PERS_GEN_KEY WITH UR
******************************* BOTTOM OF DATA ********************************
Background | Goal | Approach | Where do we Look? | What to do? | Results | Contact

21
In house GUI tool using SMF, Detector and SA data
Background | Goal | Approach | Where do we Look? | What to do? | Results | Contact
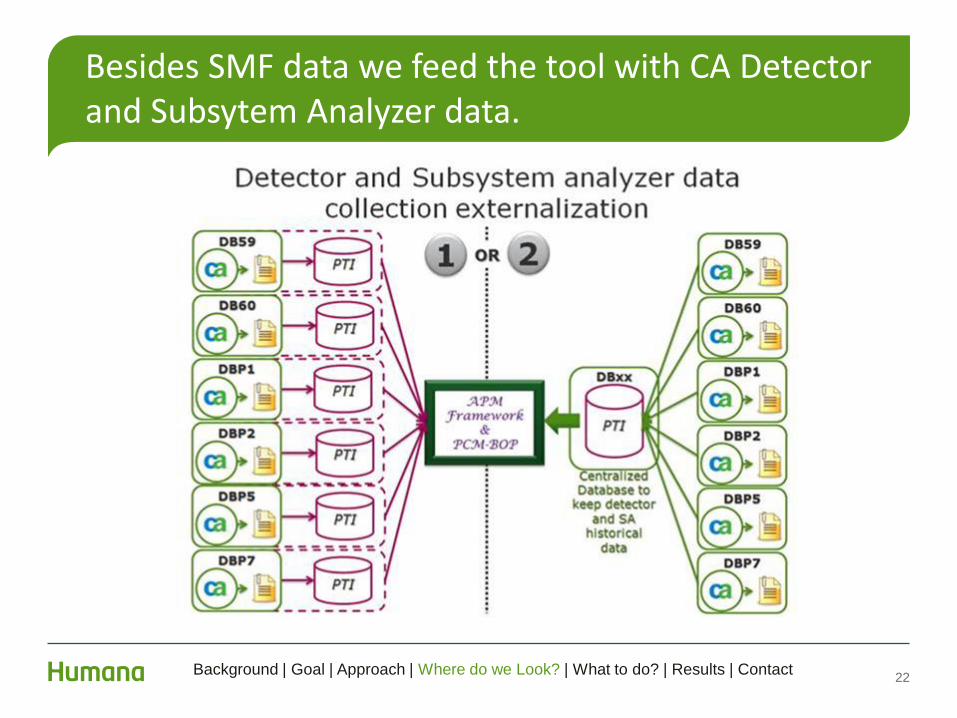
22
Besides SMF data we feed the tool with CA Detector and Subsytem Analyzer data.
Background | Goal | Approach | Where do we Look? | What to do? | Results | Contact

23
Getpage counts for the program are sourced from Detector.
Background | Goal | Approach | Where do we Look? | What to do? | Results | Contact

24
Getpage counts for the Table are sourced from Subsystem Analyzer.
Background | Goal | Approach | Where do we Look? | What to do? | Results | Contact

25
Table usage comparison data pulled from SA. One day compare for 4/16 vs 5/14 is 162+ million getpages . Notice the lack of indexed getpages.
Background | Goal | Approach | Where do we Look? | What to do? | Results | Contact
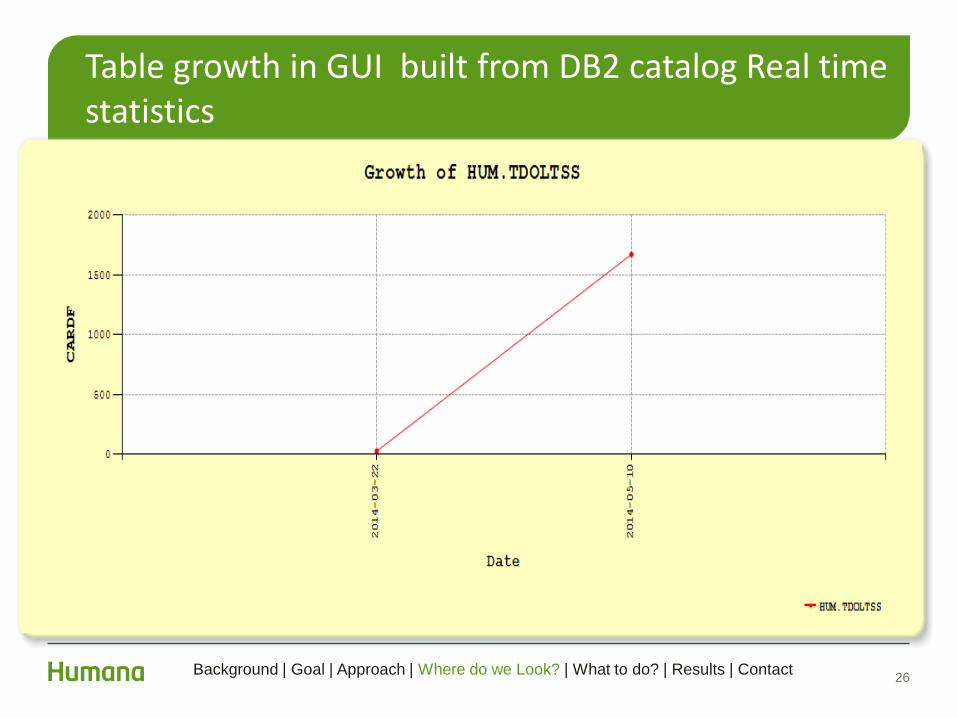
26
Table growth in GUI built from DB2 catalog Real time statistics
Background | Goal | Approach | Where do we Look? | What to do? | Results | Contact

27
EZ-DB2 for an hour shows the SQL as well
Background | Goal | Approach | Where do we Look? | What to do? | Results | Contact
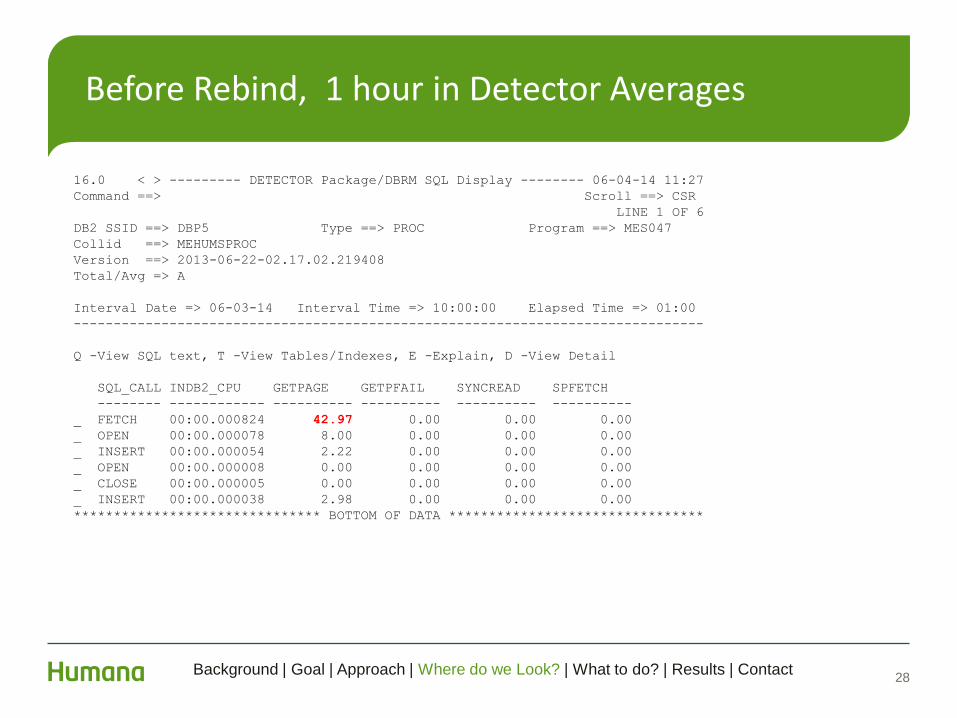
28
Before Rebind, 1 hour in Detector Averages
16.0 < > --------- DETECTOR Package/DBRM SQL Display -------- 06-04-14 11:27
Command ==> Scroll ==> CSR
LINE 1 OF 6
DB2 SSID ==> DBP5 Type ==> PROC Program ==> MES047
Collid ==> MEHUMSPROC
Version ==> 2013-06-22-02.17.02.219408
Total/Avg => A
Interval Date => 06-03-14 Interval Time => 10:00:00 Elapsed Time => 01:00
-------------------------------------------------------------------------------
Q -View SQL text, T -View Tables/Indexes, E -Explain, D -View Detail
SQL_CALL INDB2_CPU GETPAGE GETPFAIL SYNCREAD SPFETCH
-------- ------------ ---------- ---------- ---------- ----------
_ FETCH 00:00.000824 42.97 0.00 0.00 0.00
_ OPEN 00:00.000078 8.00 0.00 0.00 0.00
_ INSERT 00:00.000054 2.22 0.00 0.00 0.00
_ OPEN 00:00.000008 0.00 0.00 0.00 0.00
_ CLOSE 00:00.000005 0.00 0.00 0.00 0.00
_ INSERT 00:00.000038 2.98 0.00 0.00 0.00
******************************* BOTTOM OF DATA ********************************
Background | Goal | Approach | Where do we Look? | What to do? | Results | Contact

29
After Rebind 1 hour in detector, Approx 30 MSU reduction for this hour at 10am
16.0 < > --------- DETECTOR Package/DBRM SQL Display -------- 06-04-14 11:25
Command ==> Scroll ==> CSR
LINE 1 OF 6
DB2 SSID ==> DBP5 Type ==> PROC Program ==> MES047
Collid ==> MEHUMSPROC
Version ==> 2013-06-22-02.17.02.219408
Total/Avg => A
Interval Date => 06-04-14 Interval Time => 10:00:00 Elapsed Time => 01:00
-------------------------------------------------------------------------------
Q -View SQL text, T -View Tables/Indexes, E -Explain, D -View Detail
SQL_CALL INDB2_CPU GETPAGE GETPFAIL SYNCREAD SPFETCH
-------- ------------ ---------- ---------- ---------- ----------
_ INSERT 00:00.000053 2.25 0.00 0.00 0.00
_ FETCH 00:00.000032 4.61 0.00 0.00 0.00
_ OPEN 00:00.000010 0.00 0.00 0.00 0.00
_ OPEN 00:00.000006 0.00 0.00 0.00 0.00
_ CLOSE 00:00.000003 0.00 0.00 0.00 0.00
_ INSERT 00:00.000036 3.00 0.00 0.00 0.00
******************************* BOTTOM OF DATA ********************************
1 hour INDB2_CPU GETPAGE
-------- ------------ ----------
BEFORE 09:32.699365 31285653
AFTER 01:04.778710 4078480
Background | Goal | Approach | Where do we Look? | What to do? | Results | Contact

30
View of Program MSU after Bind
Background | Goal | Approach | Where do we Look? | What to do? | Results | Contact

31
View of getpage against the table after Bind
Background | Goal | Approach | Where do we Look? | What to do? | Results | Contact

32
View of Index activity since bind Sourced SA

33
Buffer activity by index of interest sourced SA

• When possible a sort step can be introduced to order the input file according to the predicates. I don’t remember the cost of the sort ever negating savings in DB2 work.
• When the predicate set returned from the sort is distinct then this sort will only provide clustering order relief to the program.
• When the predicates are repeated (most cases) then working storage can be interrogated to prevent the same sql execution more than once.
34
Perform the SQL only one time per key set
Background | Goal | Approach | Where do we Look? | What to do? | Results | Contact

• When you see many more of the same sql calls against a table or join than there are results then preform the sql one time and place the results into a program array.
• In some cases this may be more memory than available so in some cases we have used VSAM files to place the data and remove the DB2 work saving CPU and I/O wait time.
35
Perform the sql one time only - BATCH
Background | Goal | Approach | Where do we Look? | What to do? | Results | Contact

SELECT A.TYPE_CD_ID, A.TYPE_CD, A.SERV_RATE_AMT,
A.SERV_CNT, B.SERV_RATE_AMT, B.SERV_CNT
FROM TFNPPPX A
INNER JOIN TFNPPPY B
ON A.TYPE_CD_ID = B.TYPE_CD_ID
AND A.TYPE_CD = B.TYPE_CD
WHERE (A.SERV_CCYYMM_DT = :WS-CCYYMM1
AND B.SERV_CCYYMM_DT = :WS-CCYYMM2)
AND ROUND((A.SERV_RATE_AMT * :WS-PCT),2)
BETWEEN B.SERV_RATE_AMT - .50
AND B.SERV_RATE_AMT + .50;
SELECT A.TYPE_CD_ID, A.TYPE_CD, A.SERV_RATE_AMT,
A.SERV_CNT, B.SERV_RATE_AMT, B.SERV_CNT
FROM TFNPPPX A
INNER JOIN TFNPPPY B
ON A.TYPE_CD_ID = B.TYPE_CD_ID
AND A.TYPE_CD = B.TYPE_CD
WHERE (A.SERV_CCYYMM_DT = :WS-CCYYMM1
AND B.SERV_CCYYMM_DT = :WS-CCYYMM2)
AND B.SERV_RATE_AMT <= ROUND((A.SERV_RATE_AMT * :H),2) + .50
AND B.SERV_RATE_AMT >= ROUND((A.SERV_RATE_AMT * :H),2) - .50
CREATE INDEX HUM.XFNPPPY1
ON HUM.TFNPPPY
(SERV_CCYYMM_DT ASC
,TYPE_CD ASC
,TYPE_CD_ID ASC)
CREATE INDEX HUM.XFNPPPY1
ON HUM.TFNPPPY
(SERV_CCYYMM_DT ASC
,TYPE_CD ASC
,TYPE_CD_ID ASC
,SERV_RATE_AMT ASC)
SQL and Index change
Cobol Program
Background | Goal | Approach | Where do we Look? | What to do? | Results | Contact

37
Index change and SQL change example for BATCH
10733.39
8834.65
204.01
0
10
20
30
40
50
60
70
0
2000
4000
6000
8000
10000
12000
May July August
Execution Time (Hours)
MSU
Month (Monthly run)
RV045 MSU and Run Time
Total MSU Run Time (Hours)
Background | Goal | Approach | Where do we Look? | What to do? | Results | Contact
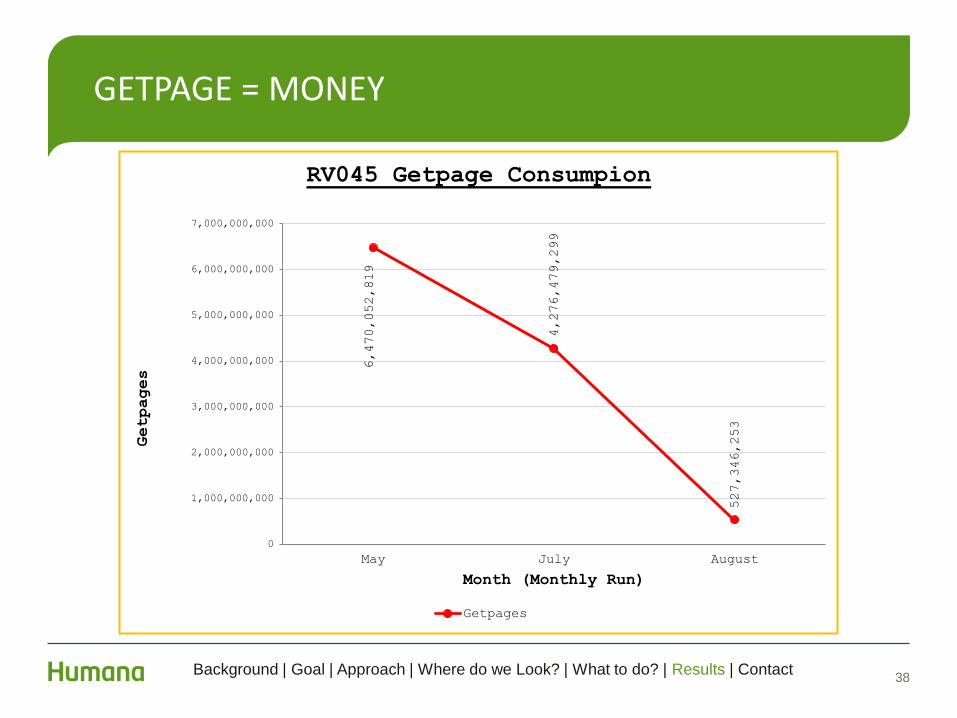
38
GETPAGE = MONEY
6,470,052,819
4,276,479,299
527,346,253
0
1,000,000,000
2,000,000,000
3,000,000,000
4,000,000,000
5,000,000,000
6,000,000,000
7,000,000,000
May July August
Getpages
Month (Monthly Run)
RV045 Getpage Consumpion
Getpages
Background | Goal | Approach | Where do we Look? | What to do? | Results | Contact

39
Creating a flat Master file with FASTUNLOAD and Match/merge for multiple batch jobs as input
Tuning effects
Background | Goal | Approach | Where do we Look? | What to do? | Results | Contact

40
Approximately 160 MSU saved per day
1,017.57
899.86
899.19
890.89
891.34
895.26
914.70
912.92
920.22
957.74
910.40
834.57
745.69
741.29
698.68
0
200
400
600
800
1,000
1,200
Feb
Mar
Apr
May
Jun
Jul
Aug
Sep
Oct
Nov
Dec
MSU
Year Month
ME Batch : Avg MSU/Day Consumption
2012 - Avg MSU/Day 2013 - Avg MSU/Day
Background | Goal | Approach | Where do we Look? | What to do? | Results | Contact

41
Best case, don’t run the same work twice!
Background | Goal | Approach | Where do we Look? | What to do? | Results | Contact

42
SQL join broken into desperate fastunloads and match merged
Background | Goal | Approach | Where do we Look? | What to do? | Results | Contact

43
Tie Detector results to Dynatrace Pure path example
Select DISTINCT RTRIM(GRP.GROUP_NBR) GroupNumber ,
RTRIM(GRP.PLATFORM_CD) Platform ,
RTRIM ( GRP.BLK_BUS_CD ) BlockOfBusiness ,
RTRIM ( GRP.GROUP_NM ) GroupName ,
GRP.EFF_DT EffectiveDate ,
GRP.TERM_DT TermDate
From Hum.TOVGRP GRP
INNER JOIN Hum.TMAPIDC PIDC
ON PIDC.GROUP_NBR = GRP.GROUP_NBR
INNER JOIN Hum.TSOPLAT PLAT
ON PLAT.PLATFORM_CD = GRP.PLATFORM_CD
INNER JOIN Hum.TSOBLK BLK
ON BLK.BLK_BUS_CD = GRP.BLK_BUS_CD
WHERE PIDC.MBR_UMID_NBR = ?
AND GRP.PLATFORM_CD = ?
AND (GRP.BLK_BUS_CD = ? OR GRP.BLK_BUS_CD = ?)
ORDER BY GroupNumber ASC FOR FETCH ONLY
Background | Goal | Approach | Where do we Look? | What to do? | Results | Contact

44
Searching by database in the dynatrace tool reveals the same SQL with over 6 second response time
Background | Goal | Approach | Where do we Look? | What to do? | Results | Contact

45
Resolution in this case was request for a new index. 6 Seconds to less than 0.04 response time and ~270K to Less than 4K Getpages per execution
Background | Goal | Approach | Where do we Look? | What to do? | Results | Contact

• Newer database releases
• Page fixing buffers
46
Clipping Coupons
Background | Goal | Approach | Where do we Look? | What to do? | Results | Contact

47
Immediate relief with DB2 Version 10
0
100
200
300
400
500
600
700
800
900
2_
01
2_
03
2_
05
2_
07
2_
09
2_
11
2_
13
2_
15
2_
17
2_
19
2_
21
2_
23
2_
25
2_
27
3_
01
3_
03
3_
05
3_
07
3_
09
3_
11
3_
13
3_
15
3_
17
3_
19
3_
21
3_
23
3_
25
3_
27
3_
29
3_
31
4_
02
4_
04
4_
06
4_
08
4_
10
DBP8 Started Task TCB,SRB,IO MSU
TCMSU
SRMSU
IOMSU
DB2 Version 10 Conv. Mode
Background | Goal | Approach | Where do we Look? | What to do? | Results | Contact

We page fixed two of the busiest buffer pools in one of our busiest DB2 region.
These two buffers are for large randomly accessed tablespaces and large randomly accessed indexes. These two BP represent 29% 4K pages allocated to the DB2 region and about 20% getpage activity in the pools.
The savings are for the DBM1 address space only for asynchronous (i.e., prefetch) read I/O and database writes and do not show savings in the allied address spaces like DDF (DIST), CICS or batch programs that perform SQL and incur synchronous read I/O.
Before page fixing the buffers we check the LPAR memory history and looked at the number page-ins required for the buffers over a period of weeks and determined we would not be .
48
Page fix
Background | Goal | Approach | Where do we Look? | What to do? | Results | Contact

49
Check the LPAR page rates, this one day example is typical before and after we page fixed. No problems.
Background | Goal | Approach | Where do we Look? | What to do? | Results | Contact

50
Check the high private memory, most notably Zone 1 workload (onlines) 8am-5pm.
Background | Goal | Approach | Where do we Look? | What to do? | Results | Contact

51
Check the System memory, most notably Zone 1 workload (onlines) 8am-5pm.
Background | Goal | Approach | Where do we Look? | What to do? | Results | Contact

52
Check the bufferpool to see how many times BP pages were paged out/in by MVS since startup.
¦ -DISPLAY BUFFERPOOL (BP4) DETAIL ¦
********************************* TOP OF DATA ********************************
DSNB401I -DBP5 BUFFERPOOL NAME BP4, BUFFERPOOL ID 4, USE COUNT 77
DSNB402I -DBP5 BUFFER POOL SIZE = 180000 BUFFERS AUTOSIZE = NO
ALLOCATED = 180000 TO BE DELETED = 0
IN-USE/UPDATED = 108 BUFFERS ACTIVE = 180000
DSNB406I -DBP5 PGFIX ATTRIBUTE -
CURRENT = NO
PENDING = NO
PAGE STEALING METHOD = LRU
DSNB404I -DBP5 THRESHOLDS -
VP SEQUENTIAL = 30
DEFERRED WRITE = 5 VERTICAL DEFERRED WRT = 5, 0
PARALLEL SEQUENTIAL =50 ASSISTING PARALLEL SEQT= 0
DSNB409I -DBP5 INCREMENTAL STATISTICS SINCE 07:01:07 FEB 12, 2014
DSNB411I -DBP5 RANDOM GETPAGE = 29356257 SYNC READ I/O (R) =
4924899
SEQ. GETPAGE = 18043535 SYNC READ I/O (S) = 7685
DMTH HIT = 0 PAGE-INS REQUIRED = 0
Background | Goal | Approach | Where do we Look? | What to do? | Results | Contact
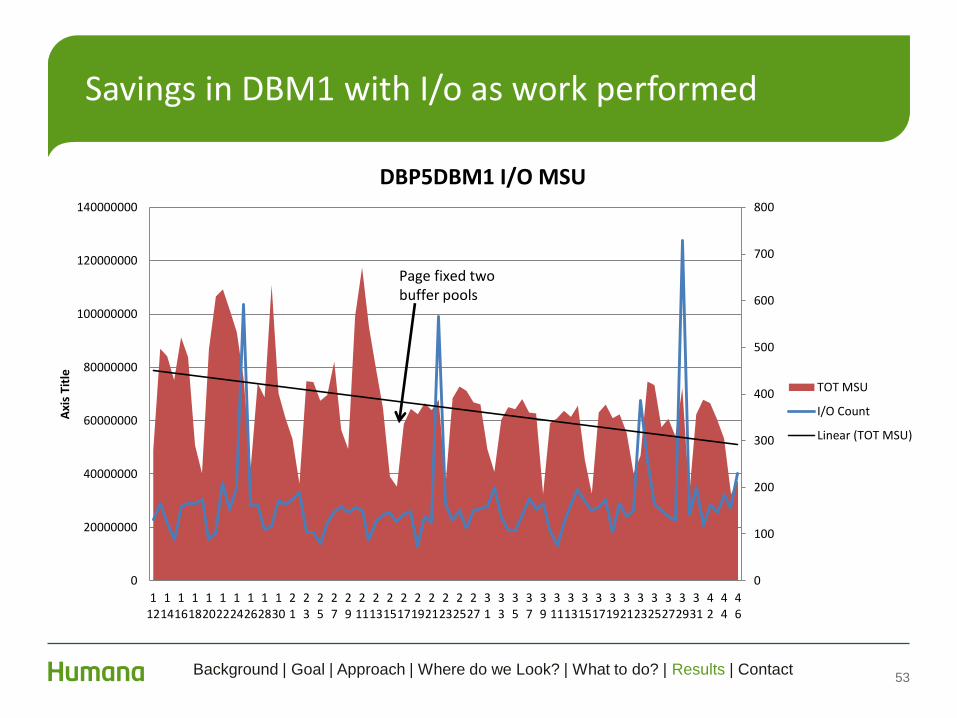
53
Savings in DBM1 with I/o as work performed
0
100
200
300
400
500
600
700
800
0
20000000
40000000
60000000
80000000
100000000
120000000
140000000
112
114
116
118
120
122
124
126
128
130
21
23
25
27
29
211
213
215
217
219
221
223
225
227
31
33
35
37
39
311
313
315
317
319
321
323
325
327
329
331
42
44
46
Axi
s Ti
tle
DBP5DBM1 I/O MSU
TOT MSU
I/O Count
Linear (TOT MSU)
Page fixed two buffer pools
Background | Goal | Approach | Where do we Look? | What to do? | Results | Contact

54
Rename your SYSDUMMY table to SYSPROBABLYDONTNEEDTOUSETHISTABLEDUMMY
An example showing use of DSNDB06 SYSDUMMY1
Background | Goal | Approach | Where do we Look? | What to do? | Results | Contact

55
Subsystem Analyzer a day activity against SYSDUMMY1 * there is relief for bound singleton selects against sysdummy1 in V10.
16.0 > -------- DETECTOR Table SQL Activity Display ------- 06-04-14 10:58
COMMAND ===> Scroll ==> CSR
LINE 1 OF 42
DB2 SSID ===> DBP2 Database ==> DSNDB06 Tablespace ==> SYSEBCDC
Table ===> SYSDUMMY1 Tablecreator ==> SYSIBM
View Type ==> A * -Table SQL, B -Table SQL/Multi-Table, C -Table SQL/Workfile
Total/Avg ==> T
Interval Date => 06-03-14 Interval Time => 09:00:00 Elapsed Time => 01-01
-------------------------------------------------------------------------------
S -View Indexes, A -View All Tables, P -View Plans, Q -View SQL Text E -Explain
SQLCALL PLCNT PROGRAM STMT# SECT# PCTTGP SQL TB_GETPAGE
-------- ----- -------- ------- ----- ------ ---------- ----------
_ SELECT 1 EK012 0001450 00005 94.0% 5961742 11923484
_ SELECT 4 EK61EK61 0000263 00002 2.7% 169872 339744
_ FETCH 1 SYSSH200 0000004 00004 2.3% 29696440 297736
_ SELECT 1 RVSTMAN 0000731 00006 .4% 27954 55908
_ FETCH 1 SYSSTAT 0000004 00004 .2% 2898170 31186
_ SELECT 1 IQ908 0003398 00017 .2% 12531 25062
_ SELECT 1 RV082 0003051 00002 .0% 1260 2520
_ SELECT 1 RV082 0003728 00005 .0% 454 908
_ SELECT 1 RV082 0003734 00006 .0% 454 908
_ FETCH 1 DQPS024 0002474 00001 .0% 3084 286
_ SELECT 1 IOK2IOK2 0001513 00004 .0% 83 166
_ FTCH RSN 1 UTAFUSQ9 0000750 00002 .0% 1523358 80
_ SELECT 1 RV084B 0005581 00006 .0% 19 38
_ SELECT 1 RV099B 0002938 00003 .0% 13 26
_ FETCH 1 DSNESM68 0000391 00001 .0% 2404 18
Background | Goal | Approach | Where do we Look? | What to do? | Results | Contact

• Use an assembler program for date, time, timestamp where possible and use the DB2 SET if that cannot be done.
• Use FETCH FIRST ROW ONLY for existence check vs SYSDUMMY
56
Little things add up, sweat the small stuff.
SELECT 1 FROM SYSIBM.SYSDUMMY1
WHERE EXISTS (SELECT CONTACT_ID
FROM HUM.TIQCINQ
WHERE INQA_GEN_KEY=?
AND STATUS_CD = 'CL'
AND INQUIRY_TYPE='GI'
AND DAYS(CREATED_TS)>=Days(CURRENT_DATE) - ? )
FOR FETCH ONLY WITH UR
SELECT 1
FROM HUM.TIQCINQ
WHERE INQA_GEN_KEY=?
AND STATUS_CD = 'CL'
AND INQUIRY_TYPE='GI'
AND DAYS(CREATED_TS)>=Days(CURRENT_DATE) - ?
FETCH FIRST ROW ONLY WITH UR
SYSIBM.SYSDUMMY1
Background | Goal | Approach | Where do we Look? | What to do? | Results | Contact
57
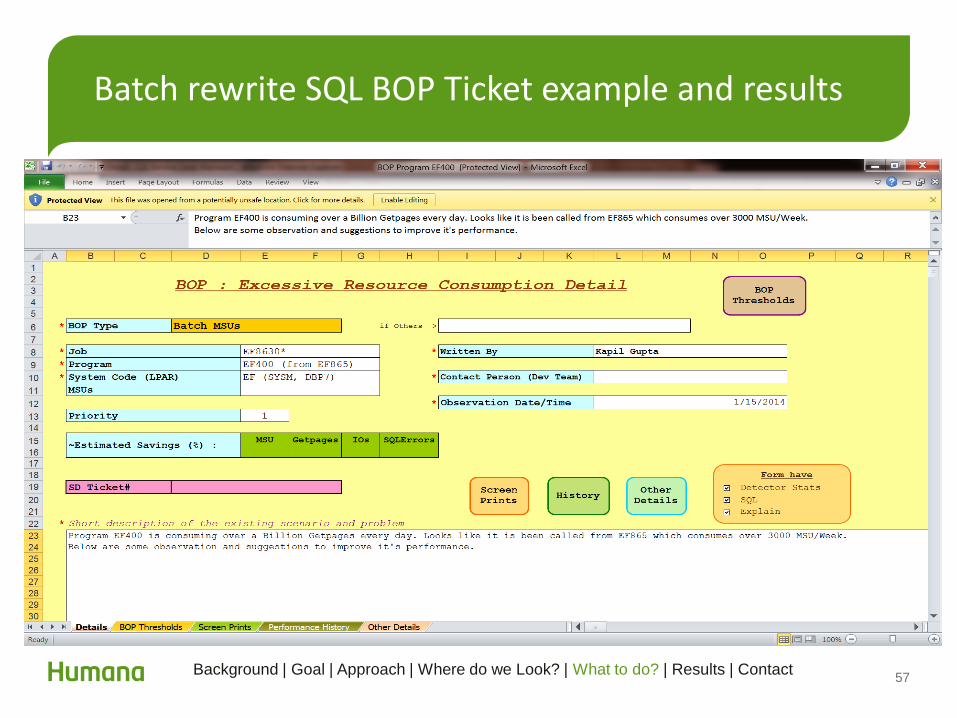
Batch rewrite SQL BOP Ticket example and results
Background | Goal | Approach | Where do we Look? | What to do? | Results | Contact

58
Show the problem and a unit tested possible solution In this case changing the sql to use a join versus an existence check and forcing the sql to use a different index .
Background | Goal | Approach | Where do we Look? | What to do? | Results | Contact

59
Remove the separate existence select and incorporate it into the join.
Background | Goal | Approach | Where do we Look? | What to do? | Results | Contact

60
Savings from this ticket, show the world and let applications take the credit if it means they will be more willing in the future to make changes.
Background | Goal | Approach | Where do we Look? | What to do? | Results | Contact

61
GETPAGE = MONEY, and I am thru
Background | Goal | Approach | Where do we Look? | What to do? | Results | Contact

62
Contact Information
Mark Youngs Technical Architect
Louisville KY
Background | Goal | Approach | Where do we Look? | What to do? | Results | Contact