Bat Fly Thesis - scholarspace.manoa.hawaii.edu
65
THE VISUAL OPSIN AND PHOTOTRANSDUCTION PATHWAY GENES ASSOCIATED WITH EYE REDUCTION AND LOSS IN BAT FLIES (STREBLIDAE, NYCTERIBIIDAE) A THESIS SUBMITTED TO THE GRADUATE DIVISION OF THE UNIVERSITY OF HAWAIʻI AT MĀNOA IN PARTIAL FULFILLMENT OF THE REQUIREMENTS FOR THE DEGREE OF MASTER OF SCIENCE IN ZOOLOGY (ECOLOGY, EVOLUTION AND CONSERVATION BIOLOGY) JULY 2021 By Melissa Atkins Thesis Committee: Megan Porter, Chairperson Floyd Reed Masato Yoshizawa Keywords: parasitic arthropod, evolutionary genomics, evolutionary loss, opsin, transcriptomics, bat fly
Transcript of Bat Fly Thesis - scholarspace.manoa.hawaii.edu

THE VISUAL OPSIN AND PHOTOTRANSDUCTION PATHWAY GENES ASSOCIATED WITH EYEREDUCTION AND LOSS IN BAT FLIES (STREBLIDAE, NYCTERIBIIDAE)
A THESIS SUBMITTED TO THE GRADUATE DIVISION OF THE UNIVERSITY OF HAWAIʻI ATMĀNOA IN PARTIAL FULFILLMENT OF THE REQUIREMENTS FOR THE DEGREE OF
MASTER OF SCIENCE
IN
ZOOLOGY (ECOLOGY, EVOLUTION AND CONSERVATION BIOLOGY)
JULY 2021
By
Melissa Atkins
Thesis Committee:
Megan Porter, Chairperson
Floyd Reed
Masato Yoshizawa
Keywords: parasitic arthropod, evolutionary genomics, evolutionary loss, opsin, transcriptomics, bat fly

ACKNOWLEDGEMENTS
I would like to thank my amazing advisor, Dr. Megan Porter who has guided me throughthis whole process and supported me in a change of direction when I lost all of my samples ayear into the degree. Without her help, knowledge, and endless patience for me none of thiswould have been possible. I would also like to acknowledge my committee members who havegiven me their time and expertise on certain portions of this project. In addition, other invaluablepeople who spent countless hours with me annotating genomes, helping me understand certainprograms, allotting me example data, collecting bat flies, and giving me motivation in times ofneed. These people include my mentor, Mirelle Steck along with my collaborators; KatharinaDittmar, Carl Dick, Holly Lutz, Kelly Speer, Steve Davis, and Matthew Aardema
A huge mahalo to my friends, family, and Oʻhana who have stood by me in all the upsand downs of this graduate work and have made my life in Hawai’i so incredibly rich. Learningto kiteboard, compete in races and triathlons, exploration of these beautiful islands by foot andboat, and the many game nights and family dinners mean more to me than I could ever explain inwords. A special thanks to my mom who spent hours on zoom “coworking” with me during thepandemic so I didn’t feel alone and had the motivation to continue on. Thank you to my mom,dad, and Aunt Marian who answered almost every one of my phone calls and consoled me fromafar. I love and appreciate every single person I am lucky enough to consider family, withoutwhom I am not sure how I would have completed this.
This thesis and graduate work is dedicated to my dog, Riley, who passed away July 30th,2020 right in the midst of the pandemic. At 17 years old, he was my companion and best friendfor over half of my life. He saw me through every tough time and any instability that I hadfinancially and otherwise while loving me as only he knew how, unconditionally. He was mybright star at the end of the day and made my life worth living. We had a special bond,understanding, and care for each other that can never be replaced. I know he stayed with me aslong as he could, knowing how difficult the pandemic and graduate school combination was. Iwill forever be grateful to him and his love.
2

Abstract
Evolutionary reduction of visual sensing ability is common in troglobiont species where
no light filters into the habitat. Independent of light environments, parasitism is also well-known
to be associated with a reduction in eye structures. The combination of these two ecological
features is exhibited in the aptly named bat fly, a parasitic arthropod that feeds on bat hosts,
many of which are cave-roosting. In line with other parasitic arthropods, bat flies exhibit
rudimentary development of their visual system. They are derived from fully visual, free-living
ancestors, but the varying degrees of eye reduction observed throughout the clade make them a
unique group of species to study. Although both parasitic and troglobitic species are well-known
to be associated with a reduction in eye structures, the extent of gene loss and transcription
attenuations that are accompanied with eye-loss are not well-studied. In insect compound eyes,
visual perception is dependent on the number of ommatidia present and how light is focused onto
the underlying receptors. Thus far, studies of bat fly macro-morphology from different species
have described eyes containing from 0 to 57 facets. This diverse macro-morphology is thought to
reflect microstructural changes associated with low light levels such as rhabdomere
rearrangement of photoreceptor cells. In order to investigate changes in the molecular
components associated with these anatomical changes, I assembled de novo transcriptomes from
eight bat fly species and de novo genomes from seven bat fly species. These 15 samples
represent a taxonomically diverse set of species with facet numbers ranging 0 to 12. All
assemblies were annotated for opsin genes, which encode proteins that are responsible for light
detection. Thus far, our analyses of genomes reveal that a common dipteran rhodopsin, Rh1, is
present in all bat fly species, with an additional rhodopsin, Rh6, present in Cyclopodia dubia,
though Rh1 was the only opsin to have expression at the transcriptome level. Multi-level
analyses using both transcriptomes and genomes allows for confirmation of sequences and a
more comprehensive understanding of the RNA transcript expression levels in reduced eyes.
This work aims to elucidate the evolutionary trajectories of broader ectoparasite and troglobiont
trends in visual system reductions through the absence of rhodopsin paralogs and
phototransduction cascade genes.
3

TABLE OF CONTENTS
ACKNOWLEDGEMENTS 2
Abstract 3
TABLE OF CONTENTS 4
List of Tables 5
List of Figures 6
Chapter 1: Arthropod Visual Ecology and Opsin Evolution 8Arthropod Visual Systems 9Eye Evolution and Diversity in Cave Habitats 10Light Environment and Opsin Proteins 11Phototransduction Cascade 11Nycteribiidae and Streblidae 12Research Objectives 13
Chapter 2: Phototransduction Cascade Genes and Rhodopsin Paralogs found in a groupof Parasitic Troglobiont bat fly species (Streblidae, Nycteribiidae). 17
Introduction: 17Methods and Materials: 20Genome Sequencing 20Genome Assembly and Annotation of Phototransduction Genes 20Results: 22Discussion: 24Summary 28
Chapter 3: Rhodopsin Expression and Phototransduction Cascade Genes 34Introduction: 34Methods and Materials: 36Transcriptomes 36Analyses 36Results: 38Discussion: 40Summary 43
Appendix A: Macro-anatomy & Immunohistochemistry of Paratrichobius longicrus 50
Literature Cited 52
4

List of TablesTable 2.1 Genome specimen collection information. The Old World Nycteribiidae are in grey and the New World
Streblidae are in blue. 28
Table 2.2 Statistics for genome assembly of bat flies using SPAdes, ABySS, Velvet, and BUSCO. OW denotes the Old
World in grey and NW denotes the New World in blue. 28
Table 2.3 Identification of genes involved in the rhabdomeric phototransduction cascade. Data for species in green
were obtained from MinION reads. 29
Table 3.1 Transcriptome specimen collection information. Three Nycteribiidae species are colored in grey and five
Streblidae species are colored in blue. 45
Table 3.2 Statistics for transcriptome assembly of three Nycteribiidae species in grey and five Streblidae species in
blue using Trinity and BUSCO. 45
Table 3.3 Identified rhodopsin paralogs with their relative TPM from Trinity assembled bat fly transcriptomes. 46
5

List of FiguresFigure 1.1 Fly phototransduction cascade response in order to amplify a single photon of light. Rhodopsin
stimulates energy production and the G-protein-signalling pathway through the Gq protein. Arrestin binds to
rhodopsin to terminate the signal. Rhodopsin (Rh); Transient receptor potential (TRP); TRP-like (TRPL); G-protein
receptor kinase 1 or 2 (RK); Gq protein (Gq); Phospholipase C (PLC); Arrestin 1 or 2 (Arr); Protein C kinase (PKC);
Retinal degeneration C (RdgC); Diacylglycerol lipase (DAGL); Calcium/calmodulin-dependent protein kinase
II(CamKII); (CaM); Neither inactivation nor afterpotential C (NINAC); Inactivation no afterpotential D (INAD); IP3
receptor (IP3R). 15
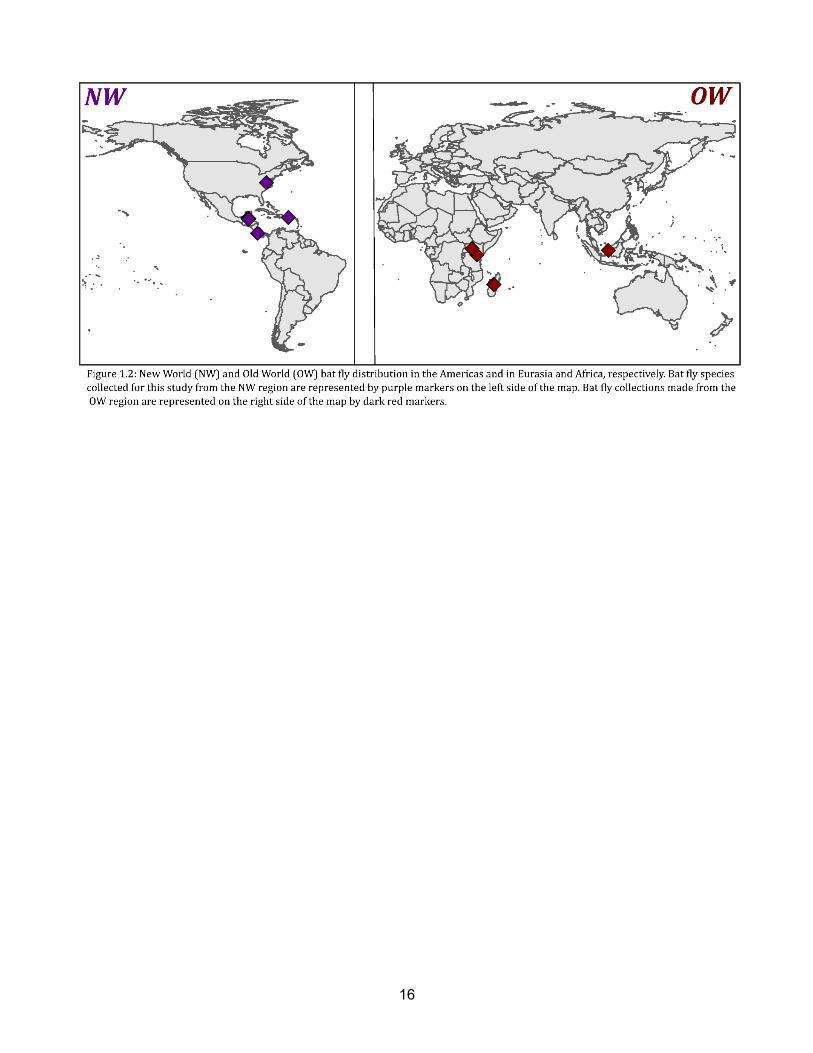
Figure 1.2 New World (NW) and Old World (OW) bat fly distribution in the Americas and in Eurasia and Africa,
respectively. Bat fly species collected for this study from the NW region are represented by purple markers on the
left side of the map. Bat fly collections made from the OW region are represented on the right side of the map by
dark red markers. 16
Figure 2.1 Rhodopsin tree as a phylogram from Rh1-Rh7 clades with bat fly opsins identified in bold. Bootstrap
values above 60 for nodes are shown. Onychopsins were used as an outgroup in RAxML. Long wavelength sensitive
(LWS) clade includes rhodopsin paralogs Rh1, Rh2, and Rh6. Ultra violet (UV) sensitive clade includes rhodopsin
paralogs Rh3 and Rh4. Short wavelength sensitive (SWS) clade includes rhodopsin paralog Rh5. 31
Figure 2.2 Species tree as a cladogram for rhodopsin paralogs using the 18s gene of each species. Bat fly species
are identified in bold. Bootstrap values above 60 for nodes are shown. Anopheles species are used as an outgroup
using RAxML. 32
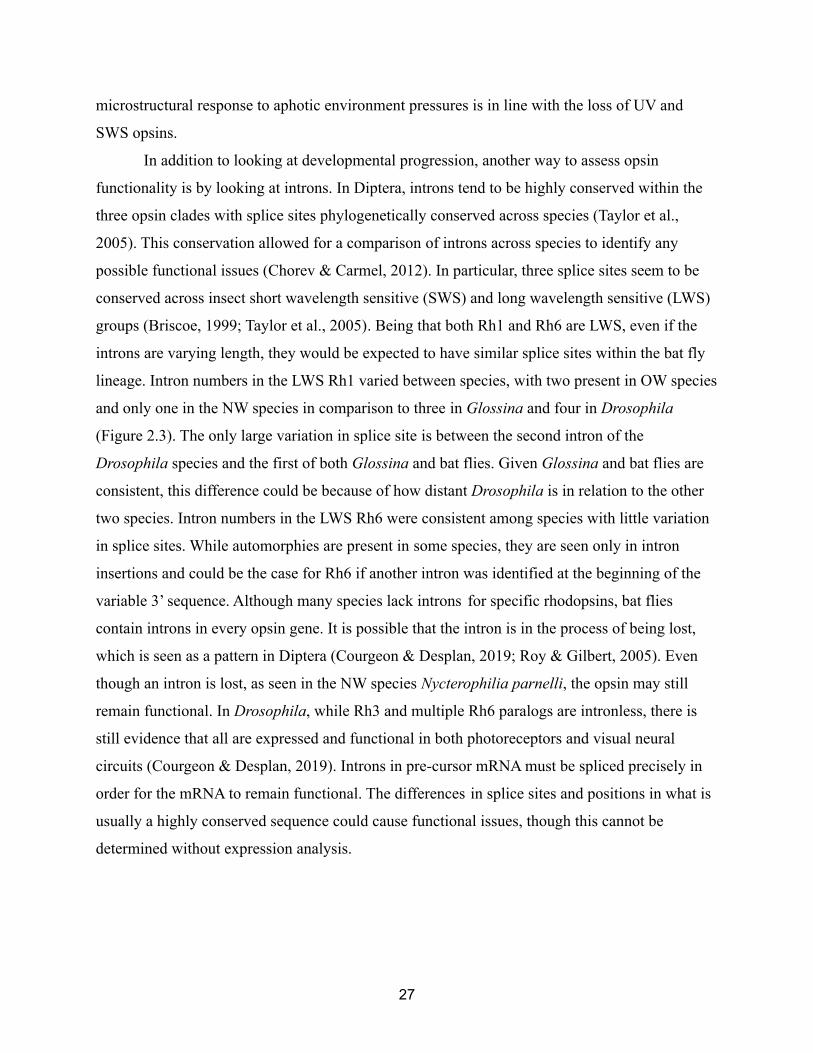
Figure 2.3 Comparison of intron splice sites and intron length of identified rhodopsins in bat flies to Glossina
fuscipes and Drosophila melanogaster. Numbers above hatch marks indicate the position of the splice site relative
to Drosophila melanogaster full Rh1 and Rh6 opsins starting at the first base pair. A) Rh1 comparison of intron
splice sites and length. Greyed out portions up to 563bp indicate the beginning of the 5’ sequence which is too
variable in opsins to make an inference. *Old world (OW) denotes all four species with an assembled genome:
Archinycteribia actena, Cyclopodia dubia, Phthridium hoogstraali, Eucampsipoda africana. New world species not
shown, Aspidoptera delatorrei, had a partial opsin sequence with no introns. B) Rh6 comparisons of intron splice
sites and length. Only one Rh6 was found in the assembled bat fly genome, Cyclopodia dubia. 33
Figure 3.1 A) Rhodopsin tree as a phylogram with select closely related species with Onychopsin as an outgroup.
Bat flies are in bold, transcriptome opsin data has been added with genomes that are identified by *. Clades
Rh2-Rh5 and Rh7 have been collapsed. B) A heatmap showing Rh1 expression in relation to facet number. The Rh1
opsin TPM column has a mean of 8.45 and the facet column has a mean of 3.63 facets. Colors are based on the
z-score indicated in the color key, showing the standard deviations away from the mean. The facet color for
Trichobius sp. indicates an unknown amount. 47
6
Figure 3.2 Fly phototransduction cascade. All transcriptome assemblies were run through PIA to identify
phototransduction components in each species. Circles represent identification of a gene; Rhodopsin (Rh, blue);
Transient receptor potential (TRP, indigo); TRP-like (TRPL, purple); Phospholipase C (PLC, yellow); Gq protein (Gq,
salmon); Protein C kinase (PKC, green); Arrestin 1 or 2 (Arr, pink); G-protein receptor kinase 1 or 2 (RK); Retinal
degeneration C (RdgC, red). 48
Figure 3.3 3D protein modeling of Trichobius corynorhini Rh1. The conserved motifs and indel are shown. DRY is on
the 4th helix (position 121) before the strand and coil. HEK is on the 6th helix (position 218) directly before
REQAKKMN (position 223) partially on the 6th helix and intracellular loop. 49
Figure A1 THUNDER image of a Paratrichobius longicrus species cleared bat fly head at a zoom of 11:1 ratio.
Antibody staining for Synapsin (488), GPCR (594), and DAPI (405). Nuclei are fluorescing at the rhabdom level. 51
7

Chapter 1: Arthropod Visual Ecology and Opsin Evolution
Arthropods inhabiting dim-light environments have eyes that have evolved hallmark
macro-morphological and micromorphological specializations. In contrast, evolution in
troglobiont species, i.e., those living in no-light environments, selectively lead to a reduction or
complete loss in visual systems (Cooper et al., 2001; Klaus et al., 2013). Light environments
have been shown to drive evolution of both eye reduction and opsins (Klaus et al., 2013; Sondhi
et al., 2021). Recent work shows higher rates of selection, including 75% of opsin duplications,
in diurnal species in comparison to their nocturnal counterparts (Sondhi et al., 2021). In a cave
setting, types of selection are mixed based on the visual features changing. Underlying genetic
and developmental mechanisms of eye reduction show select genes being changed countering
relaxed selection, while loss of pigmentation was proposed to be caused by neutral mutations
(Jeffery & Strickler, 2010; M. Protas et al., 2007). Strong directional selection has been proposed
in cave crabs where eye reduction evolves at the same pace as traits that are deemed constructive
(Klaus et al., 2013). While dim-light specializations such as wider rhabdoms, larger facets, and
optical structures optimized for increased sensitivity are seen in many nocturnal arthropods,
troglobiont species are thought to transition to complete eye loss while focusing the conserved
energy into other non-visual features that improve sensory capabilities related to resource finding
and are termed ‘constructive traits’ (Greiner, 2006; Greiner et al., 2004; Klaus et al., 2013). In a
cave setting, examples of constructive traits include those used for non-visual orientation,
navigation, and communication through enhanced chemosensory and auditory capacities (Klaus
et al., 2013; L. Mejía-Ortíz & Hartnoll, 2006).
Parasitism is also well-known to cause eye reduction and loss following a similar trend to
troglobiont species (Marshall, 1981, 1982). Ecological factors like dark environments and the
ability to perform basic needs such as feeding and reproduction with limited movement have
contributed to the eye reduction and loss trend seen in both troglobiont and parasitic species,
respectively. As separate entities, these ecological factors each lead to arthropod eye reduction.
The general question that influenced the research presented here was, how many opsin genes
remain in reduced compound eyes and are the opsin paralogs identified still functional,
especially in the complete loss of an eye? In order to answer this question, the main goal of this
thesis is to characterize what type of molecular changes are happening in species that are
experiencing the combination of the two ecological features, cave habitats and parasitism, and
8
how combined they lead to an extreme example of variation in eye reduction in the visual
systems of bat flies. In this introduction, I will review topics related to these themes, such as eye
evolution and diversity of arthropods in cave habitats and the effect of the environment on trends
at the molecular level, including the opsin proteins and the phototransduction cascade, in the
context of eye loss in the bat fly families, Streblidae and Nycteribiidae.
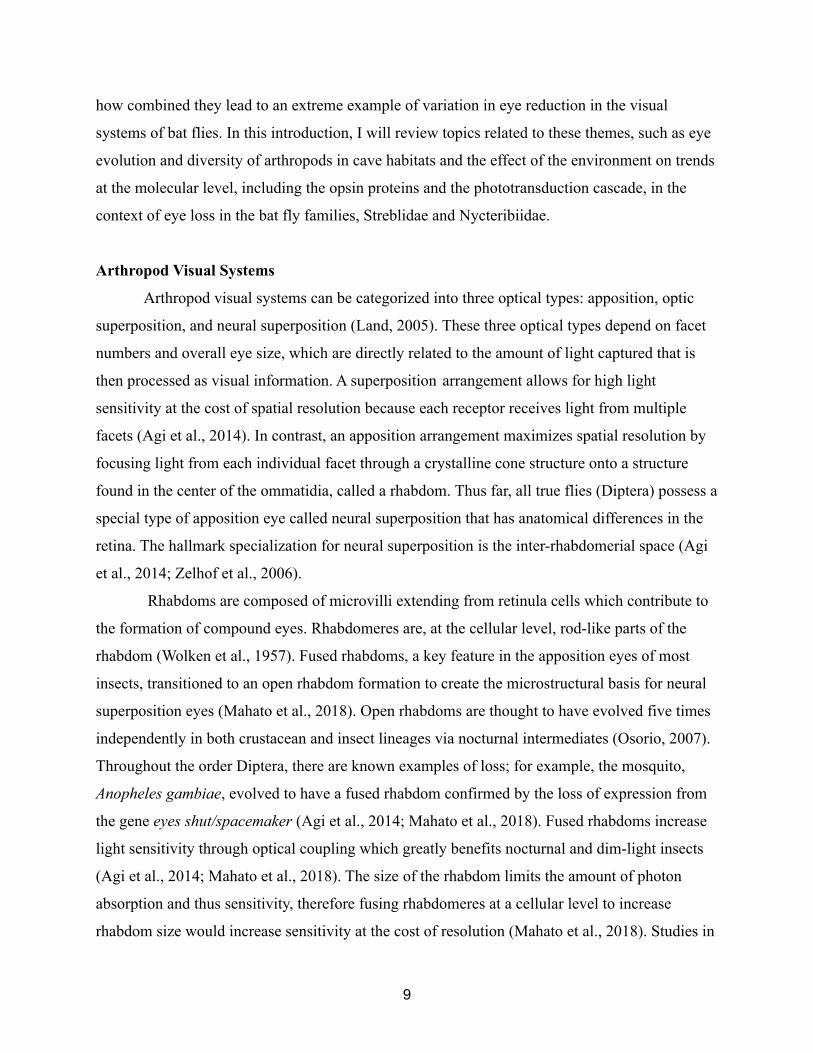
Arthropod Visual Systems
Arthropod visual systems can be categorized into three optical types: apposition, optic
superposition, and neural superposition (Land, 2005). These three optical types depend on facet
numbers and overall eye size, which are directly related to the amount of light captured that is
then processed as visual information. A superposition arrangement allows for high light
sensitivity at the cost of spatial resolution because each receptor receives light from multiple
facets (Agi et al., 2014). In contrast, an apposition arrangement maximizes spatial resolution by
focusing light from each individual facet through a crystalline cone structure onto a structure
found in the center of the ommatidia, called a rhabdom. Thus far, all true flies (Diptera) possess a
special type of apposition eye called neural superposition that has anatomical differences in the
retina. The hallmark specialization for neural superposition is the inter-rhabdomerial space (Agi
et al., 2014; Zelhof et al., 2006).
Rhabdoms are composed of microvilli extending from retinula cells which contribute to
the formation of compound eyes. Rhabdomeres are, at the cellular level, rod-like parts of the
rhabdom (Wolken et al., 1957). Fused rhabdoms, a key feature in the apposition eyes of most
insects, transitioned to an open rhabdom formation to create the microstructural basis for neural
superposition eyes (Mahato et al., 2018). Open rhabdoms are thought to have evolved five times
independently in both crustacean and insect lineages via nocturnal intermediates (Osorio, 2007).
Throughout the order Diptera, there are known examples of loss; for example, the mosquito,
Anopheles gambiae, evolved to have a fused rhabdom confirmed by the loss of expression from
the gene eyes shut/spacemaker (Agi et al., 2014; Mahato et al., 2018). Fused rhabdoms increase
light sensitivity through optical coupling which greatly benefits nocturnal and dim-light insects
(Agi et al., 2014; Mahato et al., 2018). The size of the rhabdom limits the amount of photon
absorption and thus sensitivity, therefore fusing rhabdomeres at a cellular level to increase
rhabdom size would increase sensitivity at the cost of resolution (Mahato et al., 2018). Studies in
9

nocturnal arthropods show a larger rhabdom in comparison to their diurnal relatives (Greiner et
al., 2004; Greiner, 2006; Land, 2005).
Eye Evolution and Diversity in Cave Habitats
While eye reduction in parasitic invertebrates is well studied, eye loss in invertebrate
cave species is not. The cave invertebrate, the crayfish species Orconectes australis packardi,
has been found to have complete ommatidia loss and a highly disorganized retina with more
neural processes moving toward olfaction. In contrast, a surface crayfish counterpart,
Procambarus clarkii, still has vision and ommatidia (Cooper et al., 2001; L. M. Mejía-Ortíz &
Hartnoll, 2005). In reference to eye evolution of Diptera in the dark, the closest studied species
are nocturnal wasps, mosquitoes, and bees, which specifically looked at retinal and optical
adaptations for nocturnal vision in comparison to diurnal relatives. While the retinal and optical
adaptations in nocturnal wasps, mosquitoes, and bees have been investigated, there have been
few studies focusing on adaptations to different types of dark habitats in Diptera. From these
studies there were generally two main functions for these adaptations related to dim light vision:
to increase the amount of light entering the eye and the ability to trap or increase the photon
signal once it hits the rhabdom. All of the studied nocturnal species exhibited enlarged eyes
relative to body size, larger facet sizes, and larger rhabdoms, some of which were fused together
depending on the type of optics in the eye (Greiner, 2006; Greiner et al., 2004; Jander & Jander,
2002; Land, 1997; Land et al., 1999). These invertebrate eyes span different optical types which
lead to differences in adaptations. The superposition eye of the halictid bee combined the above
traits with a ratio of corneal thickness to crystalline cone length that is up to 4.5x larger than its
diurnal counterpart and may contain a tapetum, a reflective layer within the choroid, which gives
the retina another chance to absorb photons of light (Greiner et al., 2004). Nocturnal mosquitoes
contain an atypical version of the apposition type eye where they use spatial summation from an
unusually dense packing of ommatidia and larger lens. In addition, the cornea to lens and cornea
to rhabdom distance is shortened to increase the amount of light provided while wide, fused
rhabdoms absorb it effectively (Land, 1997; Land et al., 1999). Nocturnal wasps with apposition
type optics follow the hallmark features seen in eyes from species living in dim environments:
larger eye size and rhabdom diameter; instead of larger facets, they maintain facet size and add
more facets, approximately 2000 (Greiner, 2006).
10
Light Environment and Opsin Proteins
Many studies illustrate that light availability within the environment has a large role in
eye evolution and more specifically, opsin sequence evolution. Opsins are, at a molecular level,
the protein essential to vision. When bound to a chromophore, opsins are sensitive to specific
wavelengths of light (Romhányi & Molnar, 1974; Zuker et al., 1985). Opsins are G-protein
coupled receptors (GPCRs) with seven transmembrane helices, typically characterized by a
chromophore attached to a lysine in the seventh helix (Porter et al., 2012). The wavelength that
isomerizes this chromophore, triggering the intracellular phototransduction cascade, depends on
the suite of amino acids that it interacts with (Wakakuwa et al., 2010). Evolutionary studies have
shown that arthropod visual opsins typically fall into three major clades based on the peak
absorbance of the photopigments formed. In Diptera and most insects, this process is mediated
by R-opsins classified by their wavelength sensitivity: Long Wavelength Sensitive (LWS) opsins
that form visual pigments which absorb green wavelengths of light, Short Wavelength Sensitive
(SWS) opsins that form visual pigments absorbing blue wavelengths of light, and UV-sensitive
opsins (UV) for ultraviolet light (Feuda et al., 2020; Sakai et al., 2017). The non-visual Rh7
opsin has been found to respond to a broad spectrum of light (Sakai et al., 2017). Opsin paralogs
for Drosophila melanogaster, a well-studied dipteran species, that are used for vision have been
characterized within each wavelength clade: LWS (Rh1, Rh2, and Rh6), SWS (Rh5), and UV
(Rh3 and Rh4) (Sakai et al., 2017). While ancestral arthropods are thought to have one opsin
from each clade and therefore the possibility of trichromatic vision (Koyanagi et al., 2008), this
trait isn’t advantageous for nocturnal species or those inhabiting low-light to no-light
environments, such as caves. In these types of environments species typically have
monochromatic vision, showing selective constraints on opsin gene functionality, for example
gene expression, or even gene loss (Niemiller et al., 2013; Tierney et al., 2015).
Phototransduction Cascade
The phototransduction cascade is a G-protein-signalling pathway that responds to a single
photon of light and amplifies it using a molecular process in order for varying levels of light
intensity to be transmitted to neuronal cells (Figure 1.1)(Montell, 2012). The photoactivated
visual pigment, known as rhodopsin, stimulates the GDP/GTP exchange where release of
11

guanosine diphosphate allows binding of guanosine triphosphate. The Gq protein activates
phospholipase C encoded by norepinephrine A which hydrolyzes phosphatidylinositol
4,5-bisphosphate or PIP2. This protein activation leads to the opening of transient receptor
potential (TRP) and TRP-like cation channels in the photoreceptor cells. Retinal degeneration C
contributes to calcium signaling and dephosphorylation of rhodopsin. Arrestin2 binds to the
rhodopsin and contributes to termination of signaling by blocking the rhodopsin/Gq interaction
(Figure 1.1). Drosophila visual pigments are bistable, requiring the absorption of a photon of
light to activate the rhodopsin and a second photon to convert the metarhodopsin back to the
non-activated state (Montell, 2012). Fly photoreceptors detect single photons in addition to light
adaptation by activating a certain number of channels that are closed at rest instead of the
10,000’s of channels that are open in vertebrate rods, needing to close several hundred to get a
detectable response (R. C. Hardie, 2001). The typical invertebrate photoreceptor is able to have a
rapid response to a wide range of wavelengths, while keeping sensitivity. This pathway
determines what genes are responsible for this high function and whether or not other
invertebrates have functioning vision in comparison to this model organism, Drosophila
melanogaster.
Nycteribiidae and Streblidae
Bat flies, an ectoparasite that feeds on bats, are an extreme example of a troglobiont
species (Dittmar et al., 2006). The extreme ecology of cave dwelling organisms that lead to a loss
of visual morphology coupled with the rudimentary development of visual systems seen in other
parasitic arthropods, makes bat flies a unique study organism (Dick & Patterson, 2006). While
currently both cave-dwelling and parasitic, bat flies are derived from free-living ancestors that
had complex visual systems (R. Hardie et al., 1989). It can be inferred that bat flies have reduced
eyes given that closely related taxa in the Hippoboscidae and Glossinidae have large,
well-developed eyes comprising thousands of facets (Buschbeck and Friedrich, 2008; Hardie,
1986). The observed reduction of eyes in this group leads to the question of how they are being
used and therefore what molecular components are present in each type of eye reduction.
Glossinidae, a family that is closely related to the bat flies, contains a lineage specific loss of the
dipteran Rh2 and Rh4 opsins. The common ancestors of Glossinidae, Muscidae and
Calliphoridae, show a loss of the Rh4 opsin, and the more distantly related Diopsidae has lost all
12

opsins except for Rh2 and Rh6 (Feuda et al., 2020; Kutty et al., 2010). In bat flies, the rhodopsin
paralogs expressed in reduced eyes are unknown, but given the sister clades, it is inferred that
some opsin copies are already missing (i.e., Rh2 and Rh4). A recent bat fly study confirmed this
pattern by only finding a partial Rh1 opsin in a Trichobius frequens transcriptome (Porter et al.,
2020). The following bat fly study allows for further understanding of evolutionary gene loss
across multiple species in order to extrapolate to broader ectoparasite eye loss trends. Yet, this
evolution of loss balanced with continued functionality is not well understood.
A split of ancestral bat flies created two geologically distinct groups at an early stage of
bat fly speciation, contributing to some diversification. Although bat flies have a worldwide
distribution, they are largely categorized under New World (NW) and Old World (OW) fauna
(Figure 1.2). There are main geographical differences that contribute to NW and OW, which
generally have no taxa in common. NW Streblidae are largely found in subtropical and tropical
climates while OW Nycteribidae occur in temperate climates (Dittmar et al., 2006). This
geographical split supports two distinct groups aside from the genus Basilia. Dispersal of the
genus Basilia occured after the geographical split, creating a highly variable genus (Dittmar et
al., 2006). Basilia is therefore the only NW Nycteribiidae in addition to species being identified
in the OW (Dittmar et al., 2006; Mayberry, 2014). Basilia are an incredibly variable genus that
are phylogenetically quite diverse with eyes that have zero to two facets.
Research Objectives
Bat flies all have reduced eyes and facet numbers, likely because they are parasites that
live in dim light habitats. Thus far, studies of bat fly macromorphology across species have
described eyes containing 0 up to 57 facets (Wenzel, 1975). For this study I sampled a
taxonomically diverse set of bat fly species that also have variation in the degree of eye
reduction, with total numbers of facets ranging from 0 to 12 between the species. Although
parasitism and low light environments are well-known to be associated with a reduction in eye
structures, the molecular processes involved in the evolution of eye reduction are not
well-known. Thus, this thesis aims to use a multi-level comparison of visual system molecular
components, using both genomes and transcriptomes to answer the proposed question by
identifying opsin and related phototransduction cascade genes. The objective of this study was to
elucidate whether visual macro-morphology, primarily facet number, and geographic distribution
13
corresponded to the level of reduction seen in the loss of opsin paralogs. Finally, this thesis
answers the question, are the identified opsins functional at the transcriptome level. The second
chapter of this work characterizes rhodopsin paralogs and phototransduction cascade genes in the
genomes of Streblidae and Nycteribiidae species. The final chapter looks at the functionality of
rhodopsins and phototransduction cascade genes through expression. Bat flies present an
opportunity to fill in the molecular knowledge gap in vision loss of invertebrates by studying the
evolution of genes involved in light signaling in the context of varying levels of compound eye
reduction.
14

15
16

Chapter 2: Phototransduction Cascade Genes and Rhodopsin Paralogs found in a group of
Parasitic Troglobiont bat fly species (Streblidae, Nycteribiidae).
Introduction:
Bat flies, composed of the families Nycteribiidae and Streblidae, are highly specialized
ectoparasites in the order Diptera, superfamily Hippoboscoidea (Dittmar et al., 2006). This
unique group of species is a product of two ecological features that contribute to extreme eye
loss - parasitism and cave-dwelling - making them an ideal candidate to understand the
molecular evolutionary trajectory of eye loss. The overall diversity in eye size of bat fly species
ranges from 0 - 57 facets. While bat flies are a diverse clade that are globally distributed, specific
trends in eye size exist between New World (NW) and Old World (OW) species, with the broad
range of facet numbers (0-57) occurring exclusively in the NW species and OW species
containing a narrow range (0-3) (Dittmar et al., 2015). Despite major reduction trends in
macromorphology, five morphological types of eyes have been characterized across the two
families (Dittmar et al., 2015). Facet number is thought to correlate with visual function, yet in a
light deprived environment specializations that enhance function are not based on facet number.
The main adaptations include larger facets and wider rhabdoms (Greiner, 2006; Greiner et al.,
2004; Klaus et al., 2013), a structure found in each ommatidium that is made up of microvilli
from retinula cells. A recent study described fused rhabdoms in the species Trichobius frequens
(Porter et al., 2020), a member of the genus with the least reduced compound eyes. Given the
number of facets in bat flies’ eyes are variable across species, with 57 facets as the largest
number recorded in any bat fly, comparison of facet numbers is only a starting point in
determining the evolutionary patterns involved in vision loss.
Dipteran visual systems can evolve to match environmental constraints across multiple
biological levels. Compound eye type and visual function are determined by
macromorphological and microanatomical structures, such as number of facets and rhabdomere
arrangement, respectively. Phylogenetic studies of dipterans showed that bat flies evolved from
fully visual species with open rhabdoms, a multitude of facets and multiple opsin paralogs.
Within the suborder Brachycera, species such as Lucilia cuprina and Musca domestica have
neural superposition type eyes composed of ~3,000 facets containing open rhabdoms that each
express four to five rhodopsin paralogs (Agi et al., 2014; Feuda et al., 2020; Lunau, 2014;
17

Sukontason et al., 2008), while hippoboscid species that are more closely related to bat flies have
neural superposition type eyes that only contain hundreds of facets (Jobling, 1926; Mayberry,
2014). Bat flies evolved to have rudimentary vision based on a small number or no ommatidia
and possible loss of rhodopsin paralogs (Feuda et al., 2020; Kutty et al., 2010; Mayberry, 2014).
Drosophila contain eight light sensing photoreceptor cells in each ommatidium labelled
R1-R8 (Earl & Britt, 2006; Rister & Desplan, 2011; Wernet & Desplan, 2004), that in total
express five opsin proteins (Rh1, Rh3-Rh6). The outer photoreceptors R1-R6 are arranged in a
trapezoidal shape with R7 and R8 making up the inner distal and proximal portion, respectively
(Nilsson & Kelber, 2007; Wernet et al., 2015). The photoreceptors R1-R6 are optically
independent from one another while R7 and R8 have the same optical path (Briscoe, 1999).
There are two ommatidial subtypes that, combined, express either UV-sensitive Rh3 or Rh4 in
R7, either blue sensitive Rh5 or green sensitive Rh6 in R8, and Rh1 in all R1-6 photoreceptors
(Wernet et al., 2015). In Drosophila, Rh2 is typically expressed in the ocelli, a simple eye
comprised of a single lens. The six outer photoreceptors are responsible for motion detection and
image formation and span the entire thickness of the retina, while the R7 and R8 cells are stacked
one on top of the other and primarily transmit color information (Agi et al., 2014; Kelber, 2003;
Rister & Desplan, 2011). Based on reconstructions of opsin gene loss across the dipteran
phylogeny, the Rh4 gene was lost in Hippoboscoidea, which includes the bat flies (Feuda et al.,
2020). Based on the lack of ocelli in bat flies, it is predicted that the ocelli-specific Rh2 gene is
also likely lost in this group (Dittmar et al., 2015; Kutty et al., 2010). These losses lead to the
question of whether bat flies have lost additional opsins during the evolutionary reduction of
their visual systems, which is the focus of this study.
Visual genes are highly conserved across taxonomic groups, allowing for visual opsins to
easily be identified. Opsins are a monophyletic gene family that code for proteins which are
essential to the visual response to a photon of light (Porter et al., 2012). Genes in the
phototransduction pathway, especially those in important positions related to amplification and
signalling, are critical in determining the exact mutations responsible for vision loss. Disruptions
to the G-protein signalling pathway, such as gene loss or a mutation to a protein coding region
that causes a loss of function, will result in vision loss (Yang et al., 2016). Once a visual pigment
in a fly photoreceptor cell becomes photoactivated, it stimulates GDP/GTP exchange in the Gq
protein, which activates the rest of the pathway. Essentially, phototransduction cascades serve to
18

amplify single photon responses, and to allow the cells to adapt to light intensities that differ
over many orders of magnitude (R. C. Hardie, 2001). Possession in the genome of specific,
vision related genes in this pathway, such as rhodopsin, kinases, Gq, and termination
components, imply that the visual components will be functionally expressed.
Rhodopsin paralogs identified in genomes require further analyses to determine visual
function; in addition to characterizing opsin genomic sequences, this chapter focuses on both
comparison of opsin intron structure and identification of additional phototransduction
components as proxies for functionality. Introns tend to be highly conserved in splice site
position, only varying in length; therefore, a non-functional opsin may include a loss of intron or
a change in position in comparison to closely related species (Chorev & Carmel, 2012).
Analyzing the structure of introns, a non-coding region of DNA between exons that is removed
before translation, is helpful in analysis of bat fly opsins because they tend to be highly spatially
conserved within the three opsin classes in Diptera (Spaethe, 2004; Taylor et al., 2005). For
instance, intron splice sites of Diptera, fleas and lepidopterans have a high degree of similarity
both among species and across long-wavelength sensitive opsins with varying intron length
(Briscoe, 1999; Spaethe, 2004; Taylor et al., 2005).
While a number of studies have focused on visual capability through macromorphology
of troglobiont arthropods, the associated evolution and patterns of loss in the molecular
components of vision haven’t been studied yet. In terms of eye loss, genetic work has
substantially only been done on vertebrates. Herein lies the gap of knowledge this study intends
to fill using a troglobitic arthropod, the bat fly, that has a secondary environmental pressure (e.g.
parasitism) inducing eye loss. This study sequenced the genomes of seven different species
within Nycteribiidae and Streblidae that contained eyes with varying numbers of facets ranging
from 1-12 among species. By identifying rhodopsins and phototransduction pathway components
within each, this work aims to address whether the loss at the molecular level corresponds to
either geographic distribution or reductionary trends at the morphological level. These analyses
will add to our understanding of the evolution of eye loss in both parasitic and cave invertebrates
by identifying which opsins still remain and have functional support genes for visual
phototransduction.
19

Methods and Materials:
Genome Sequencing
Genomes were sequenced from four species of Nycteribiidae and three species of
Streblidae. This sampling included both New World and Old World species (Table 2.1) (Dittmar
et al., 2006). For each species of bat fly sequenced, collected individuals were preserved in
ethanol for approximately one year stored at 4℃. DNA was extracted from individual bat flies
using the Qiagen DNeasy Blood & Tissue kit (Qiagen) following the manufacturer protocols for
tissue with the following exceptions: (1) the whole bat fly body was homogenized using a glass
mortar and pestle with liquid nitrogen prior to lysis; (2) the volume of proteinase was doubled;
and (3) the incubation time was increased to one hour. For DNA yield optimization, the sample
was eluted twice with 64ul of AE buffer. Extracted DNA quality was assessed initially using a
Qubit 3.0 Fluorometer (Thermo Fisher Scientific) or a nanodrop (ND1000) and confirmed via a
2100 Bioanalyzer system (Agilent Technologies). Only DNA with a quantifiable concentration
on the Qubit and a 260/280 value within ± 0.3 of 1.8 was sent for more precise quantification.
Five samples in total were sent to Novogene (Sacramento, CA, USA) for whole-genome
sequencing using a NovaSeq 6000 platform (Illumina® Inc.).
The remaining two samples were sequenced with MinION technology on a Nanopore
Flow Cell (Oxford Nanopore Technologies, San Francisco, CA, USA). Libraries were created
following the Native Barcoding Genomic DNA protocol using a SQK-LSK 109 ligation
sequencing kit (Oxford Nanopore Technologies) with NEBNext reagents stated in the protocol.
In a novel technique adapted to multiplex the low concentration DNA samples, each tagged
DNA library was pipetted into the primed flow cell port (EXP-FLP002) during the initial run,
and subsequent libraries were individually spiked in either every four hours, upon acquiring 1GB
of data, or when sequencing dropped off to ensure the least amount of nanopores were lost. Once
the sixth sample was pipetted in a dropwise fashion in the SpotOn port, the flow cell was allowed
to run the remainder of the 24 hours to acquire all nucleotide reads. The last sample spike was
completed if at least 800 nanopores remained active at the time of the spike.
Genome Assembly and Annotation of Phototransduction Genes
For each set of Illumina raw reads, fastQC (v0.11.9, Babraham Bioinformatics) was used
to assess sequence quality scores, sequence length distributions, and adaptor content. Raw
20

paired-end reads were trimmed with Trimmomatic and TrimGalore (v0.6.5;
https://www.bioinformatics.babraham.ac.uk/projects/trim_galore/). Trimmomatic (Bolger et al.,
2014) was used to remove any sequences below a phred score of 33 and both were used to be
sure that all adapters were removed. These reads were then processed through fastQC (v0.11.9)
again for confirmation and used as clean reads. Without any reference genomes available, reads
were de novo assembled from Illumina libraries through the National Center of Genome
Analysis Support’s (NCGAS; Indiana University, Bloomington, IN, USA) Mason Linux cluster
using ABySS (Jackman et al., 2017), SPAdes (Bankevich et al., 2012), and Velvet (Zerbino &
Birney, 2008). Although the SPAdes default settings combine kmer values for best output
already, comparison with the two other programs allowed for the best quality assembly to be
used. Best quality was determined through a combination of factors using QUAST (Gurevich et
al., 2013): number of contigs, N50, and maximum contig length. The highest combination of
these factors with priority given to N50 determined which kmer value, ranging from k50 to k90
(every odd kmer), from which assembly program was used. A second quality check was
performed using BUSCO (v3.0.2)(Simão et al., 2015) with the arthropoda_odb9 lineage using
default settings. Assemblies that met the cutoff standard, a >93% similarity threshold, were used
for the rest of the bioinformatics pipeline.
Genomes were assessed using Phylogenetically Informed Annotation (PIA) using an
e-value of 1x10^-5 and allow maximum hits up to 100 to identify any R opsins (Speiser et al.,
2014). PIA is a tool included in the Galaxy Bioinformatics Platform with servers based out of the
University of California Santa Barbara. It contains 102 vision genes in a Light Interaction
Toolkit (LIT). R opsin PIA hits were confirmed using Geneious software (Geneious Prime,
v2020.0.3). In using Geneious, known Rh1-Rh7 fly opsins from Glossina and Drosophila
mRNA transcripts were used to query assembled genome scaffolds using tblastn with a max
e-value of 1x10^-5 to identify the top 10 hits for each genome. Hits with a bit score higher than
100 were then BLAST against the nucleotide collection database in NCBI to confirm the gene as
an opsin, using a max e-value of 1x10^-10 as a significant match. Any hits that were not opsins
were removed from the dataset and the single longest representative sequence was chosen for
each isoform group. Opsin hits were then annotated using the Geneious edit feature to remove
introns and stop codons by aligning the genome sequences with annotated opsin transcriptome
sequences either from closely related Glossina species or that were assembled from bat flies
21

(Chapter 3). These sequences were confirmed with the phylogeny created by LIT using the tab to
tree function by using the rhodopsin landmarks, which are genes from model organisms. Queries
that landed within the same clade as the rhodopsin Drosophila melanogaster landmarks were
confirmed as visual opsins. Amino acid sequences were then aligned in Geneious using MAFFT
and used to reconstruct a phylogenetic tree and opsin tree through CIPRES (Miller et al., 2015)
servers using RAxML (Stamatakis, 2014; Stamatakis et al., 2005) with Onychopsins as an
outgroup. Intron identification was done through a tool in Geneious called Augustus, using a
combination of mRNA and nucleotide sequences from related species. Intron comparisons were
made through an alignment of opsin genes from all bat fly species’ assembled genomes,
Glossina fuscipes, and Drosophila melanogaster.
MinION raw reads were BLAST against known bat fly opsins as well as those of closely
related species. In addition, MinION raw reads were BLAST against landmark genes from the
PIA phototransduction cascade of both bat flies and other Diptera in Geneious software.
Specifically, this analysis looked through the phototransduction rhabdomeric pathway for visual
opsins, Gq proteins that allow the signal to be transduced, regulatory proteins such as lipase,
permeable cation channels (TRP and TRPL), and arrestins, which terminate the pathway.
Results:
Sequencing and de-novo assembly of genomes was completed for five species of bat
flies, generating unique contiguation sequences (contigs) between 16,462 bp for Phthiridium
hoogstraali and 83,414 bp for Cyclopodia dubia (Table 2.1). Sequencing coverage ranged from
41X to 62X with genome sizes from .111 to .308 Gbp. The best SPAdes program assemblies,
based on N50 values, total length, GC content, and number of contigs over 500 bp, configured
for Archinycteribia actena, Cyclopodia dubia, and Trichobius intermedius had kmer values of
K74, K66, and K82 respectively. Abyss assemblies for Nycterophilia parnelli and P. hoogstraali
had kmer values of K60 and K74 respectively. N50’s for all genomes ranged from 3460 contigs
to 35602 contigs with GC content from 16.8% to 36.14%. BUSCO, a tool to assess completeness
of the genomes through highly conserved single-copy orthologs, recovered scores above 90% for
all species, ranging from 93.0% to 98.8%. Percent fragmented sequences ranged from 0.8% to
4.1% while missing sequences ranged from 0.4% to 2.9% (Table 2.2).
22

Components of the phototransduction cascade were identified by the PIA workflow,
including all opsin hits. By conservative estimates, all five Illumina generated genomes
contained one opsin sequence in the Rh1 clade and for four of these genomes, this Rh1 was the
only opsin found. The Rh1 found in Aspidoptera delatorrei was only a partial opsin. In addition
to the Rh1 clade, Cyclopodia dubia also had an opsin sequence in the Rh6 clade of the dipteran
opsin phylogeny (Figure 2.1, 2.2). Although macromorphology was a primary portion of the
hypothesis, facet number did not appear to correlate with the number of identified opsins,
considering Cyclopodia dubia has two facets and Phthridium hoogstraali has zero facets. In
addition to opsins, all five species had transient receptor potential (TRP) and TRP-like channels,
phospholipase C (PLC), Gq protein, protein C kinase (PKC), and G-protein receptor kinase 1 or 2
(RK) present in the genome. In two of the five species, Trichobius intermedius and Nycterophilia
parnelli, signal termination proteins retinal degeneration C (RdgC) were also identified.
Rh1 genes were also identified in the MinION reads for Eucampsipoda africana and
Aspidoptera delatorrei that were BLAST separately from the assembled Illumina genomes. In
addition to this, all reads from E. africana and A. delatorrei run through PIA found only three
and four vision related phototransduction genes identified in total, respectively (Table 2.3).
These two species using MinION data only had Rh and PLC phototransduction genes in common
(Table 2.3).
Intron comparisons were made through an alignment with bat fly species to the closely
related species, Glossina fuscipes, and the model organism, Drosophila melanogaster. All intron
analyses are relative to full opsin sequences of Drosophila melanogaster (Figure 2.3). Splice
sites of the two introns found in the Rh1 opsin were the same in all OW bat fly species at 1113bp
and 1805bp (Figure 2.3A). In contrast, the NW species Nycterophilia parnelli lost the first intron
all together while maintaining the same splice site of the second intron, 1805bp. For the other
NW species, Aspidoptera delatorrei, only a partial Rh1 opsin was recovered that didn’t span any
of the conserved intron sites. Glossina fuscipes Rh1 had a total of three introns, two of which had
the same splice sites as the OW bat flies and only one of those had the same splice site as the
NW bat flies. G. fuscipes also had an additional intron in between the two with a splice site at
1385bp. All of these introns are in comparison to the four identified introns in Rh1 of Drosophila
melanogaster, with splice sites at 360bp, 1035bp, 1385bp, and 1808bp. Intron splice sites for
Rh6 of Cyclopodia dubia, 896bp and 1270bp, matched identically to Glossina fuscipes and were
23

only a few base pairs off to Drosophila melanogaster (Figure 2.3B). D. melanogaster, G.
fuscipes, and C. dubia identified only two introns each for this rhodopsin paralog.
Discussion:
The dipteran families Streblidae and Nytceribiidae are a speciose group. All of the
species in this troglobitic and parasitic group of insects have reduced eyes, but exhibit variable
degrees of reduction and loss between species. Troglobiont arthropods show an evolutionary
reduction in eye-related macromorphological features as well as genetic factors controlling
visual capacity (Feuda et al., 2020; Klaus et al., 2013). This pattern is most clearly seen in
extensive research of the fish species, Astyanax mexicanus, where fully visual surface fish are
compared to their cave counterparts adapted to perpetual darkness (Keene et al., 2016). The basis
for eye loss is easily studied in this model species where the cave fish diverges from normal
vertebrate eye development when it is first born, leading to complete eye loss from the
downregulation of Pax and hedgehog gene families (Krishnan & Rohner, 2017; Yamamoto et al.,
2004). These genetic factors controlling the development and maintenance of vision undergo
mutations that favor vision loss in cave vertebrates and have evolved in parallel across divergent
taxonomic groups (Culver, 1982; Wilkens et al., 2000). This type of genetic mutation is not well
known for cave dwelling invertebrates. A recent publication that studied the genetics of the
isopod Asellus aquaticus compared two independent origins of cave population to a surface
population of the same species (M. E. Protas et al., 2011; Re et al., 2018). Despite evolving
independently, both cave taxa have characteristic eye loss and depigmentation in comparison to
the surface species (Re et al., 2018).
The identified opsins from the seven bat fly genomes presented here are in line with the
rhodopsin losses documented in closely related hippoboscid species (Feuda et al., 2020; Taylor et
al., 2005). While the model organism, Drosophila melanogaster, has visual rhodopsin paralogs
(Rh1-Rh6) that respond to SWS (Rh5), LWS (Rh1, Rh2, and Rh6), and UV light (Rh3 and Rh4),
the more closely related ancestors to Streblidae and Nycteribiidae have lost some of these
paralogs (Sakai et al., 2017). For example, species in the Tephritidae lineage lost the SWS opsin,
Rh5, and the ocelli based opsin, Rh2. In Diopsidae there was an even more extensive opsin loss
with the loss of both SWS, UV and one LWS opsin (Feuda et al., 2020; Kutty et al., 2010). In the
Glossinidae, the sister clade to Hippoboscidae, there was a lineage specific loss of Rh4 and a
24

species specific loss in Glossina morsitans of Rh2 (Feuda et al., 2020). Comparatively, bat flies
do not have ocelli therefore there is a specific morphological loss that corresponds to the loss of
Rh2 (Dittmar et al., 2015). As troglobiont species, the loss of the UV and SWS clade rhodopsins
(Rh3-Rh5) in bat flies suggests that those wavelengths are no longer present in the environment.
Correspondingly, the rhodopsin paralog still present is likely being tuned to the dominant
wavelengths in the environment. Thus far, the results show that Rh6 is still present in one species
and therefore has been lost in most of the bat fly lineage; Rh1 is present in all studied species and
is clustering in the dipteran Rh1 clade in the rhodopsin phylogeny (Figure 2.1). Because
Rh2-Rh5 were not identified, the phylogenetic timeline of their loss would indicate before
diversification in the bat fly lineage.
In order to make accurate inferences from the presence or absence of genes, genome
quality and coverage need to be assessed. Of the seven study species, only two that were
sequenced through MinION and had FastQC that was below the phred threshold of 33 were not
assembled and therefore do not have quality statistics. The genome length metrics that provide a
standard measure of quality include N50, which calculates the summation of all sequence lengths
that are above 50% of the total assembly length, and the largest contig (Bradnam et al., 2013).
Both of these metrics, which show the ability of the assembler to combine reads into large
sequences without a high rate of fragmentation or misalignment, in combination with the high
percent completed and low percent fragmented BUSCO statistics suggest that these genomes
have been properly sequenced and assembled. Genome coverage, another important statistic in
relation to quality, showed all genomes were deeply sequenced in order to attain available reads
from the sample with the largest contig just under 3.0 kbp. These metrics are important in order
to help assess the validity of rhodopsins identified as well as attribute meaning to those not
identified. One of the metrics that seems to be uniformly skewed is the GC content. While in
most Diptera, GC content tends to be on the lower side, meaning below 50% (Mizuno &
Kanehisa, 1994), bat flies in this study are uniformly at 40% or below. GC content is highly
correlated to genome size and chromosomal structure leading to variability among species. In
particular, small genomes and those from species dependent on a host tend to be GC poor due to
the environment and metabolic resources (Foerstner et al., 2005; Rocha & Danchin, 2002).
Lower GC content is also correlated with higher mutations and substitutions from selection
(Chen et al., 2014; Hershberg, 2016), suggesting that these genomes have higher mutation rates.
25

This bias is an interesting finding in bat flies given higher mutation rates in combination with
relaxed constraint and relaxed environmental pressures in the dark suggests a possible
mechanism to rhodopsin or phototransduction gene function and loss.
The genome quality metrics will also enable a better understanding of phototransduction
genes identified. Functionality of the identified opsins will be partially attributed to identification
of supporting genes in visual signal transmission. For all of the assembled genomes, all PIA
pathway components were identified except for arrestin and rdgC. The components missing in
the MinION sequences, including Gq, do not signify a loss due to the poor quality identified via
the FastQC. Both of these components have to do with termination of signal from the
photoactivated rhodopsin. Although rdgC was identified in the genomes of two species (Table
2.4), the overall lack of these genes suggests that either the signal is continuously being
amplified or that the lifetime of the activated rhodopsin is increased (Yau & Hardie, 2009).
Loosely related studies in vertebrates link loss of these termination components to deterioration
of functional performance and slower photoresponse recovery (Song et al., 2011). Tying these
two ideas together, the opsins could be in a state of functional decline. This hypothesis will be
further investigated by quantifying opsin expression levels in the next chapter (Chapter 3).
The developmental determination of the eight photoreceptor cells in Drosophila
ommatidia are done in a pairwise fashion after the founder cell R8: R2 and R5, R3 and R4, R1
and R6, and finally R7. Given this order of photoreceptor cell development Rh3 and Rh4 have a
similar onset of expression as do Rh5 and Rh6 (Earl & Britt, 2006; Wernet et al., 2015; Wernet &
Desplan, 2004). Since Rh4 from R8 cells were lost in all previously studied species of
Hippoboscoidae, it is probable that this gene was lost before the bat fly lineage. The lack of
identification of Rh3 and Rh5 in bat flies, though both are found in other species of
Hippoboscoidae, could be attributed to receptor cell loss and, in part, the loss of Rh4 from R8
cells. If R7 and R8 cells fused, evolving from open to closed rhabdoms in bat flies, then loss of
any of Rh3-Rh5 paralogs is a possibility considering their close onset. The loss of these
rhodopsins, Rh3-Rh5, in an aphotic environment implies they are no longer needed in terms of
visual tasks, more specifically in terms of color vision. During the evolution of open to fused
rhabdoms the inner R7 and R8 cells, that are responsible for color vision, could have been lost in
favor of R1-R6 which are responsible for motion detection and image formation. Though there
needs to be more work done in bat flies to ascertain the loss of R7 and R8 cells, the evolutionary
26
microstructural response to aphotic environment pressures is in line with the loss of UV and
SWS opsins.
In addition to looking at developmental progression, another way to assess opsin
functionality is by looking at introns. In Diptera, introns tend to be highly conserved within the
three opsin clades with splice sites phylogenetically conserved across species (Taylor et al.,
2005). This conservation allowed for a comparison of introns across species to identify any
possible functional issues (Chorev & Carmel, 2012). In particular, three splice sites seem to be
conserved across insect short wavelength sensitive (SWS) and long wavelength sensitive (LWS)
groups (Briscoe, 1999; Taylor et al., 2005). Being that both Rh1 and Rh6 are LWS, even if the
introns are varying length, they would be expected to have similar splice sites within the bat fly
lineage. Intron numbers in the LWS Rh1 varied between species, with two present in OW species
and only one in the NW species in comparison to three in Glossina and four in Drosophila
(Figure 2.3). The only large variation in splice site is between the second intron of the
Drosophila species and the first of both Glossina and bat flies. Given Glossina and bat flies are
consistent, this difference could be because of how distant Drosophila is in relation to the other
two species. Intron numbers in the LWS Rh6 were consistent among species with little variation
in splice sites. While automorphies are present in some species, they are seen only in intron
insertions and could be the case for Rh6 if another intron was identified at the beginning of the
variable 3’ sequence. Although many species lack introns for specific rhodopsins, bat flies
contain introns in every opsin gene. It is possible that the intron is in the process of being lost,
which is seen as a pattern in Diptera (Courgeon & Desplan, 2019; Roy & Gilbert, 2005). Even
though an intron is lost, as seen in the NW species Nycterophilia parnelli, the opsin may still
remain functional. In Drosophila, while Rh3 and multiple Rh6 paralogs are intronless, there is
still evidence that all are expressed and functional in both photoreceptors and visual neural
circuits (Courgeon & Desplan, 2019). Introns in pre-cursor mRNA must be spliced precisely in
order for the mRNA to remain functional. The differences in splice sites and positions in what is
usually a highly conserved sequence could cause functional issues, though this cannot be
determined without expression analysis.
27

Summary
The bat fly visual system may have functioning rhodopsins based on analysis of
molecular components in the genomes of both Nycteribiidae and Streblidae species. Given
genome assembly quality and Rh1 and Rh6 phylogenetic clustering among closely related
species in dipteran rhodopsin clades, the rhodopsins identified are real. Functionality of these
opsins may be preliminarily determined via introns and phototransduction cascade genes. While
most genomes were lacking the terminating components of the cascade, all other components
involved in photoactivation and amplification of the rhodopsin signal were identified, though this
pattern of gene absence may signify a deterioration in the functional performance. Another
analysis of functionality - intron comparison - showed a disparity in the splice site of Rh6 when
comparing bat fly LWS opsins to closely related species. Based on phylogenetic reconstructions,
two LWS opsins were found in these bat fly species (Rh1 and Rh6), while Rh2 is expected to
have been lost early in the lineage based on morphology (e.g. loss of ocelli). Neither blue nor
UV-sensitive opsins (Rh3-Rh5) were identified in any of the bat fly genomes investigated. This
loss may be due to environmental constraints or the changes in photoreceptor cells when the
rhabdoms transitioned from open to a fused configuration. Given the calculated BUSCO
statistics, the genomes were properly assembled suggesting the low GC content may be
indicative of mutations and substitutions or a product of the small size of the genome. The
transcriptome level of analysis in the next chapter will help to elucidate the visual function of
these rhodopsins more fully.
28

Table 2.1 Genome specimen collection information. The Old World Nycteribiidae are in grey and
the New World Streblidae are in blue.
Family Genus Species Facet #
Geographic
Range Collection Site
Nycteribiidae Archinycteribia actena 1 OW Greater Sunda Islands
Nycteribiidae Cyclopodia dubia 2 OW Madagascar
Nycteribiidae Eucampsipoda africana 1 OW Kenya
Nycteribiidae Phthiridium hoogstraali 0 OW Kenya
Streblidae Aspidoptera delatorrei 8 NW Belize
Streblidae Nycterophilia parnelli 1 NW Belize
Streblidae Trichobius intermedius 7 to 12* NW Puerto Rico
*Range based facets seen in multiple Trichobius intermedius species
OW = Old World, NW = New World
Table 2.2 Statistics for genome assembly of bat flies using SPAdes, ABySS, Velvet, and BUSCO. OW denotes the Old World
in grey and NW denotes the New World in blue.
Species
Geographic
Range
Genome
Coverage
Genome
Size (Gbp) N50
Kmer
Value Complete Fragmented Missing
GC
Content
Largest
Contig (bp)
Archinycteribia
actena OW 60X 0.133 8982 K74 97.50% 1.10% 1.40% 16.80% 2971818
Cyclopodia
dubia OW 41X 0.308 2460 K66 93.00% 4.10% 2.90% 26.69% 81918
Phthiridium
hoogstraali OW 58X 0.126 19861 K74 98.80% 0.80% 0.40% 29.77% 594335
Nycterophilia
parnelli NW 62X 0.111 24824 K60 97.30% 1.80% 0.90% 35.47% 430720
Trichobius
intermedius NW 59X 0.147 35602 K82 96.80% 1.90% 1.30% 36.14% 512805
29

Table 2.3 Identification of genes involved in the rhabdomeric phototransduction cascade.
Species in green were obtained from MinION reads.
Genus, Species Facet # Rh TRP TRPL PLC Gq PKC Arr RK RdgC
Archinycteribia actena 1 Օ Օ Օ Օ Օ Օ X Օ X
Cyclopodia dubia 2 Օ Օ Օ Օ Օ Օ X Օ X
Eucampsipoda africana 1 Օ X X Օ X Օ X X X
Phthridium hoogstraali 0 Օ Օ Օ Օ Օ Օ X Օ X
Aspidoptera delatorrei 8 Օ Օ Օ Օ X X X X X
Nycterophilia parnelli 1 Օ Օ Օ Օ Օ Օ X Օ Օ
Trichobius intermedius 7 to 12* Օ Օ Օ Օ Օ Օ X Օ Օ
*Range based facets seen in multiple Trichobius intermedius species
Օ = Presence, X = Absence
Rh = rhodopsin, TRP = transient receptor potential, TRPL = TRP-like, PLC = phospholipase C, Gq = Gq
protein, PKC = protein C kinase, Arr = arrestin 1 or 2, RK = receptor kinase 1 or 2, RdgC = retinal
degeneration C
30

31

32

33

Chapter 3: Rhodopsin Expression and Phototransduction Cascade Genes
Introduction:
Loss of complex visual traits including hallmark structural changes (e.g. strongly curved,
thickened lenses, and a closed rhabdom) are prominently seen in cave dwelling (e.g. troglobiont)
and parasitic arthropods (Warrant, 2019). The perpetual darkness in caves coupled with a
parasite's limited need to be mobile leads to both macro-morphologic eye loss and a reduction in
visual genes (Chapter 2) across divergent taxonomic groups. Bat flies (Diptera; Streblidae and
Nycteribiidae), being both parasitic and cave-dwelling arthropods, have a unique set of macro
and micro-morphological features related to vision. Loss at the level of macromorphology is seen
through the numbers of facets within each eye, which is thought to correlate directly with visual
function in arthropods. In bat fly species, facets range from zero (e.g. no eyes) up to 57 facets
largely based on taxonomy and either Old World (OW) or New World (NW) geographic
distributions (Dittmar et al., 2015). At the level of micromorphology, flies typically have
structures found at the center of each ommatidium, called rhabdoms, which consist of eight cells
arranged in an open trapezoidal pattern (Rister & Desplan, 2011; Wernet & Desplan, 2004). In
contrast, based on the one species that has been studied, bat flies have more retinula cells (11-18)
and fused rhabdoms (Porter et al., 2020). Both of these trends are also observed more broadly in
troglobiont species, which tend to have fewer facets of larger sizes and wider or fused rhabdoms
(Greiner, 2006; Greiner et al., 2004; Klaus et al., 2013).
These morphologic trends of reduction and loss in bat flies are paralleled at the molecular
level (Chapter 2). Rhodopsins, or R-type opsins, are proteins in the G-protein coupled receptor
(GPCR) superfamily that are generally expressed in rhabdomeric photoreceptors of arthropods
and molluscs (Lampel et al., 2005; Porter et al., 2012). Multiple rhodopsin paralogs have been
characterized from hippoboscid taxa closely related to the bat flies (Kunz, 2013). The dipteran
rhodopsin phylogeny showed a loss of Rh4 in the superfamily Hippoboscoidea, suggesting that,
as members of this group, bat flies will likely not have this paralog (Feuda et al., 2020). In
addition to this loss, bat flies also lack ocelli, and correspondingly should lack the
ocelli-dependent Rh2 opsin (Rister & Desplan, 2011). Studies of bat fly genomes confirmed the
absence of these two opsin genes, as well as the loss of the UV-sensitive rhodopsins Rh3 and
Rh4, and the blue-sensitive rhodopsin Rh5 (Chapter 2). At the genome level, the loss of
34

rhodopsin paralogs in each bat fly species did not correlate with their facet number, yet visual
function is implied by the lack of nonsense mutations in the remaining gene sequences (Rh1,
Rh6) as well as the presence of phototransduction pathway genes, including Gq proteins that
allow the signal to be transduced and regulatory proteins such as lipase and arrestins, which
terminate the pathway (Chapter 2). There is another trend at the molecular level identified in
Chapter two regarding the number of introns in batfly Rh1 genes in comparison to the closely
related species, Glossina fuscipes. In OW bat fly species the Rh1 gene had two introns, while in
the NW species Nycterophilia parnelli only one was identified (Chapter 2). Considering introns
in Diptera are highly conserved, the loss of an intron or the change in a splice site could cause
issues regarding function. Expression data is key to understanding whether these opsins are still
being transcribed.
The convergence of traits in response to an aphotic environmental pressure is seen in the
macromorphological loss of eyes across a wide taxonomic group of subterranean animals
(Culver, 1982; Wilkens et al., 2000). Considering the processes underlying trait reduction (e.g.
eye and facet size) and augmentation (e.g. wider rhabdoms) seem to be different (e.g. directional
selection and purifying selection) (Klaus et al., 2013; McGaugh et al., 2014; M. E. Protas et al.,
2011; Sondhi et al., 2021), expression levels will vary based on which process is at play. Given
one ommatidium can contain as many as 18 retinula cells (Porter et al., 2020) that each express
opsins, the loss of a whole facet will presumably have a substantial effect on expression levels.
To date, visual function has been determined through transcriptome studies in a number of
publications for subterranean arthropods. Expression patterns are most clearly seen through
comparison of drastic environments of a well-studied freshwater crayfish, with an estimated 450
species, of which approximately 45 are obligate cave-dwellers (Stern et al., 2017).
All bat fly species are parasites that live in dim light and have reduced eyes, but exhibit
variable degrees of reduction and loss between species. In this study I sampled a taxonomically
diverse set of bat fly species with a total number of facets ranging from 0 to 9 among species.
The overall aim of this research was to determine if the opsin paralogs identified in bat fly
genomes were still functional, especially in species that have completely lost eyes, and whether
the identified opsins evolved under selection. Towards this goal, this chapter explores whether
the opsins and phototransduction genes identified in bat fly genomes are expressed, and whether
expression levels correlated to the degree of eye reduction (i.e. facet number). Additionally,
35

expression levels of genes shown to control the fused versus open arrangement of the rhabdom,
including extracellular matrix protein spacemaker (EYS) and Prominin homologs (Mahato et al.,
2018; Zelhof et al., 2006), will be investigated across species to correlate expression with
potential changes in micromorphology. Identification of genes in the phototransduction cascade
and visual opsins, Rh1 and Rh6, from bat fly genomes indicate that their eyes are likely to be
functional (Chapter 2); however, expression data are needed from transcriptomes to verify that
DNA is being transcribed. This study will contribute to our understanding of the process of
reduction in compound eyes through a multi-level analysis of the genome and transcriptome.
Methods and Materials:
Transcriptomes
Transcriptomes were sequenced from three species of Nycteribiidae and five species of
Streblidae (Table 3.1). Opportunistic sampling allowed for sequencing of multiple individuals in
only one Streblidae species, Trichobius johansonae, while all other species had one sample.
Upon collection, individuals were placed in RNAlater and shipped on dry ice before being frozen
at -80 degrees celsius to ensure long-term preservation. RNA from each homogenized individual
was extracted using the Qiagen RNeasy Mini Kit (Qiagen) following manufacturer protocols
including the optional second elution and DNase digestion. RNA quality was preliminarily
determined using a Qubit 3.0 Fluorometer (Thermo Fisher Scientific) high sensitivity solution
and then confirmed via a 2100 Bioanalyzer system (Agilent Technologies). RNA quality showed
an arthropod characteristic collapse of the 28S peak and 18S was used as a proxy for RNA
integrity (DeLeo et al., 2018). Eukaryotic transcriptome libraries were created using rRNA
depletion and sequenced at a Novogene facility (Sacramento, CA, USA) for whole-transcriptome
sequencing using a NovaSeq 6000 S4 platform (Illumina® Inc.), generating 30-32M reads for
each species.
Analyses
For each set of Illumina raw reads, fastQC (v0.11.9, Babraham Bioinformatics) was used
to assess sequence quality scores, sequence length distributions, and adaptor content. Raw reads
were trimmed using Trimmomatic (Bolger et al., 2014) and any sequences under a phred score of
28 were removed. Cleaned reads for each species were assembled into a de novo assembly using
36

Trinity software with built in fastQC (v2.6.6) (Bolger et al., 2014) on the National Center of
Genome Analysis Support’s (NCGAS; Indiana University, Bloomington, IN, USA) Mason Linux
cluster. Default settings were used to remove non-random base pairs added by primers and the
minimum contig base pair length was changed to 300bp. Best quality was determined through a
combination of factors using the Trinity software and QUAST (Gurevich et al., 2013): number of
reads, GC content, N50, and maximum contig length. A second quality check was performed
using BUSCO (v3.0.2)(Simão et al., 2015) with the arthropoda_odb9 lineage using default
settings (Table 3.2). Assemblies that met a similarity threshold in a range (6.2%-92%)
determined by other diptera transcriptomes in the focal BUSCO (Simão et al., 2015) were used
for the rest of the bioinformatics pipeline.
Using Geneious software (Geneious Prime, v2020.0.3), known Rh1-Rh7 fly opsins from
Glossina and Drosophila sequences were used to query assembled transcriptome scaffolds using
tblastn with a max e-value of 1x10^-5 to identify the top 10 hits for each genome. Hits with a bit
score higher than 100 were then BLAST against the nucleotide collection database in NCBI to
confirm the gene as an opsin, using a max e-value of 1x10^-10 as a significant match. A single
representative sequence was used in the case of isoforms and any hits that were not opsins were
removed from the dataset. These hits were then confirmed via the assessment of the whole
transcriptome assembly using Phylogenetically Informed Annotation (PIA) in order to identify
any R opsins and phototransduction cascade genes (Speiser et al., 2014). PIA is a tool included
in the Galaxy Bioinformatics Platform with servers based out of the University of California
Santa Barbara (UCSB). In the phototransduction cascade, Gqɑ subunit binds to the
photoactivated opsin and initiates the amplification via downstream components such as
phospholipase C (PLC), protein kinase (PKC), and transient receptor protein (TRP &
TRPL)(Fein & Cavar, 2000; R. C. Hardie, 2001). The termination of this signal by
phosphorylation of rhodopsin and blocking the rhodopsin-Gq interaction is done by retinal
degeneration C (rdgC) and arrestin (Arr or Arr2)(Montell, 2012). The phylogeny created by PIA
using the tab to tree function confirmed all identified genes through the landmarks, which are
genes from model organisms. Queries that landed within the same clade as the rhodopsin
Drosophila melanogaster landmarks, were confirmed as visual opsins. Opsin hits were then
annotated using the Geneious edit feature and transcriptome sequences from closely related
37

Glossina species. Geneious software was also used to search for EYS and prominin via BLAST
and NCBI.
Dipteran opsins that totaled 485 sequences were pulled out of NCBI. All amino acid
sequences from identified opsins in the transcriptomes and genomes with select species from
NCBI were then aligned in Geneious software using MAFFT and used to reconstruct an opsin
tree through CIPRES (Miller et al., 2015) servers using RAxML (Stamatakis, 2014; Stamatakis
et al., 2005) with Onychopsins as an outgroup (Hering et al., 2012). Kallisto on Galaxy was used
under default settings to check expression levels for opsin sequences and a pseudo alignment was
used to quantify the abundance of transcripts from clean reads (Afgan et al., 2018). Reads per
kilobase of transcript per million (TPM) mapped reads were calculated for six out of the eight
transcriptomes where opsins were present using default settings and without normalization
(Mortazavi et al., 2008)(Table 3.3). TPM for Trichobius johansonae was calculated as the mean
of the TPM values from the two sequenced individuals. A heatmap of expression levels in
comparison to facets numbers was made using RStudio (V.1.2.1335). Bowtie (Afgan et al., 2018)
on Galaxy was used to check for Rh6 in Basilia species due to collaborators' unpublished data
identifying Rh6 in a Basilia species (Aradema, pers comm.).
Tests of neutrality were conducted on the patterns of codon substitutions in the protein
coding regions of Rh1 of the bat fly clade using MEGA X (overall average option)(Kumar et al.,
2018; Stecher et al., 2020). The Nei-Gojobori Z-test (Nei & Gojobori, 1986) with 1,000
bootstrapping replicates was used to compare the relative per-site abundance of amino acid
altering (nonsynonymous) and non-altering (synonymous) substitutions.
Results:
Sequencing and de-novo transcriptome assembly was generated for eight bat fly species
for a total of between 20,076 and 53,151 contiguation sequences (contigs) across species (Table
3.2). N50’s for all transcriptomes ranged from 1738 bp to 3115 bp, a normal range for non-model
invertebrates (Riesgo et al., 2012). The average contig length ranged from 1400 to 2276 bp with
GC content from 32.6% to 40.1%. BUSCO, a tool to assess completeness of genomes through
highly conserved single-copy orthologs, scores ranged from 72.2% to 94.3%, with only two
species below 80% among the sequenced species. Those two species, Trichobius corynorhini and
Trichobius sp., had 11% fragmented sequences and 13.6-16.8% missing sequences. Another
38

transcriptome to note, Speiseria ambiqua, had a high percentage of missing sequences ( >10%)
and 8.3% fragmentation (Table 3.2).
Phototransduction pathway components mediated by R opsins and Gqɑ subunits were
identified by the PIA workflow. Through conservative estimates, one Rh1 opsin sequence was
present in six of the eight species (Figure 3.1A). Of the eight species, only two did not have
rhodopsin present, Nycteribia schmidlii and Speiseria ambigua, confirmed through analyses in
PIA, phylogeny, and BLAST (Table 3.3). In addition to not having rhodopsins present, TRP-like
cation channel mediated components were not identified in the N. schmidlii and S. ambigua
transcriptomes. N. schmidlii is also missing Gq subunits from the PIA pathway (Figure 3.2). All
species had TRP channels, phospholipase C (PLC), protein C kinase (PKC), G-protein receptor
kinase 1 or 2 (RK) present. In three of the eight species - Megistopoda aranea, Speiseria
ambigua, and Trichobius corynorhini - signal termination proteins retinal degeneration c and
arrestin 2 were identified. Opsins identified through PIA were found only in the Rh1 rhodopsin
clade of the dipteran opsin phylogeny. All rhodopsins clustered closely in the genomes and
transcriptomes with strong bootstrap values (e.g. > 90%) for each clade (Figure 3.1). All
rhodopsins were identified without stop codons and with hallmarks of a functional opsin at the
sequence level, including the g-protein coupled receptor binding site and a lysine where the
chromatophore attaches. Expression levels of the Rh1 opsin varied among species, with the two
Basilia species and Trichobius johansonae having the lowest TPMs (1.39 - 3.69)(Table 3.3).
Trichobius johansonae’s final TPM was the mean of the two individual sample TPMs for Rh1
(4.12 and 3.25). Two of the transcriptomes did not contain rhodopsin transcripts. The Rh1 in the
final three transcriptomes ranged from 13.4 to 29 TPM (Table 3.3). Rhodopsins were assessed to
have biologically relevant expression levels with a TPM greater than 1. The heatmap (Figure
3.1B) shows expression levels across species in comparison to facet number. The TPM column
has a mean of 8.45 and the facet column has a mean of 3.63 facets with colors based on standard
deviations away from the mean (Figure 3.1B).
Bowtie did not yield any matches for Diptera Rh6 in either Basilia anceps or Basilia sp.
even though it was identified in unpublished genome data from a different Basilia species
(Aradema, pers comm.). Neither the extracellular matrix protein EYS nor prominin were
identified in any of the assembled transcriptomes.
39

The selection analyses of the Rh1 genes in all bat fly species, amounting to 12 nucleotide
sequences and a total of 574 positions, reject neutrality with a probability of dN = dS of 0.00 and a
-4.3025 statistic. The negative statistic indicated more dS, or more synonymous substitutions,
which is consistent with purifying selection removing a subset of amino acid altering mutations
that disrupt the gene product’s function.
Discussion:
This study allows for an interesting look at the intermediary molecular processes
happening in troglobiont species’ vision loss at the transcriptome level. Given that the
transcriptomes are high quality assemblies, opsin functionality can be inferred up to the
transcription level. The expression of the Rh1 opsins indicate further evidence that one rhodopsin
paralog is present and is likely being tuned to the dominant wavelengths in the environment. Rh1
makes up a vast majority (~90%) of the visual pigments in the arthropod compound eye
(Johnson & Pak, 1986; Paulsen, 1984; Salcedo et al., 1999) making it the likely candidate to be
the rhodopsin paralog being tuned to whatever wavelengths are left in the environment. Rh1 is
also structurally significant for the development of rhabdomeres (Wang & Montell, 2007).
Without microvilli arrangement in the retinula cell, photoreceptor structure and ability is lost all
together. Rh6 was not identified in any of the transcriptomes meaning it is not being expressed in
these species, although preliminary data has shown Rh6 is still present in the genome of some
Basilia species (Aradema, pers comm.). Specifically, R opsins have been found to use only Gq
mediated pathways (Fein & Cavar, 2000). The phototransduction cascade is a way to amplify the
response to a single photon of light needing both a rhodopsin and Gq for initiation. N. schmidlii is
a good example of loss, where no rhodopsin paralogs are expressed, verified by a lack of
expression of Rh and Gq in the phototransduction pathway in addition to the expression of fewer
phototransduction genes (Figure 3.2). A similar finding is observed with S. ambigua which has
also lost any opsin expression, though the expression pattern across phototransduction pathway
genes differs (Figure 3.2). In absence of a rhodopsin, it seems the phototransduction pathway is
functioning as if one were identified. This is only feasible if a rhodopsin is present to
photoisomerize in response to a photon of light and activate the channel.
Similar to the identification of phototransduction genes in the genomes (Chapter 2), the
transcriptomes lacked Arr and RdgC expression in most species, although Rh1 is clearly being
40

transcribed. Considering these components are involved in the termination of the cascade this
suggests that the activated rhodopsin signal is repeatedly being amplified (Yau & Hardie, 2009).
The functional implications of this are unknown; it could be that the rhodopsin lifetime in these
species was increased or the opsin was in an intermediary state of decline with a slower recovery
time after the degradation of rhodopsin (Song et al., 2011; Wang & Montell, 2007).
Alternatively, it is also possible that the amount of opsin quenched by arrestin was at
undetectable levels. TPM indicates functional Rh1 opsins in all species in which it was
identified. Comparison through TPM may be skewed because opsins are not only expressed in
photoreceptors, but other tissues with non-visual functions (Terakita, 2005; Velarde et al., 2005).
Another study regarding TPM showed an artificial deflation of all genes outside the top three
expressed when protocols used rRNA depletion (Zhao et al., 2020). Considering opsin
expression is not among the top three genes, this gives a margin of safety when inferring that
expression over one TPM is biologically relevant (Table 3.3).
In order to make accurate inferences regarding biologically relevant expression levels,
sequence verification of opsin functionality is important. Coupled with the clustering of the
identified opsins in the dipteran Rh1 clade (Figure 3.1), the rhodopsin paralogs display certain
conserved sequences and putative phosphorylation sites. There is a conserved indel
(insertion-deletion) among functional arthropod opsins, REQAKKMN, in the the third loop of
the cytoplasmic domain linked to G-protein signaling (Porter et al., 2006). All Rh1 opsins
identified contain this indel except B. anceps, that has Serine (S) instead of Arginine (R) at the
beginning of the indel due to a point mutation in the nucleotide sequence. In addition, all Rh1
opsins contain two conserved motifs, HEK and DRY. The conserved motif HEK found in the
third cytoplasmic loop is involved in an interaction between rhodopsin and the Gq protein
(Gärtner, 2000). The DRY motif found in the third helix of the opsin, is highly conserved in
arthropod GPCRs, and is likely a control site keeping rhodopsin in an inactive conformation
(Palczewski, 2006).
For an eye to remain functional, natural selection should maintain expression levels, with
variations within species being from differences in environmental factors, because it tends to
favor mutations that decrease expression variance (Bedford & Hartl, 2009; Gilad et al., 2006). If
selection is relaxed and is not maintaining functional eyes, then mutations may cause an increase
in expression variance given evidence that random mutations change expression levels (Hinaux
41

et al., 2013; Metzger et al., 2015, 2016; Stern & Crandall, 2018). Theoretically, expression levels
should have little variance in a troglobiont species if the eyes are functional since they are
exposed to the same aphotic environment. Yet, this doesn’t hold true for bat flies and it may not
be because of loss of function. Bat flies are ideal candidates for this study because of their range
of visual loss and intermediary phenotypes. Generally, altered expression patterns in vision
related gene families, pax and hedgehog are clearly important in the reduction of eyes of
cave-dwelling animals (Yamamoto et al., 2004). In a transcriptome-wide expression analysis, one
study found four independent vision loss events with individual expression patterns shown to
cluster by eye function over phylogeny (Gross et al., 2019; Stern & Crandall, 2018). Even
though all sequence-based signatures looked at in this study show function in the data, without
antibody labeling it is not possible to conclude that these transcribed opsin genes are being
translated. Ambylopsid eyeless cave fish appear to have a loss of function in rhodopsin given the
increased rates of nonsynonymous mutations in comparison to their surface cave fish counterpart
(Niemiller et al., 2013).
Yet, bat flies have increased rates of synonymous substitutions indicating strong
purifying selection which has been shown to reduce genetic diversity and has the ability to cause
a transient increase in frequency of mutations (Cvijović et al., 2018). This is consistent with the
lack of stop codons and intron conservation identified in Chapter 2 and with Rh1 transcript
presence in this chapter. Overall, this finding implies that the bat fly Rh1 clade is both functional
and being maintained by purifying selection.
Reduced numbers of facets have clade specific trends; NW species’ facets span the whole
0-57 range while OW species contain three facets at most (Dittmar et al., 2015). The number of
facets is directly correlated to opsin expression levels because of the large number of retinula
cells per facet each expressing rhodopsin. While eye specific augmentation (e.g. fewer facets of
larger sizes which typically have fused rhabdoms - Greiner, 2006; Greiner et al., 2004; Klaus et
al., 2013), also correlates with rhodopsin expression, the effect is relatively reduced. As
described above in Drosophila, R1-R8 cells are arranged in a trapezoidal pattern in each
ommatidium with R7 and R8 cells, responsible for color vision, creating the inner portion (Rister
& Desplan, 2011). R7 expresses the UV-sensitive Rh3 and Rh4 while R8 expresses the Rh5 or
Rh6, blue or green-sensitive respectively (Wernet et al., 2015). Three of these rhodopsin
paralogs, Rh3-Rh5, were not identified in the genome chapter (Chapter 2), leading to the idea
42

that evolution of fused rhabdoms caused a possible loss of the inner R7 and R8 cells. Loss of
EYS expression leads to a fused arrangement, while an open arrangement requires an expression
pattern in photoreceptors in both adult and developmental stages of life (Mahato et al., 2018).
Considering neither EYS nor prominin expression was identified in the transcriptome
assemblies, this suggests that all of the studied bat fly species have closed rhabdoms. This can be
further analyzed in future studies through expression of transcription factors by looking at the
markers prospero, senseless, and spalt during developmental transition from pupal to adult life
stages (Wernet et al., 2015).
Bat flies are an inherently difficult model to work with as there is no way to maintain a
population in a lab and instead require opportunistic sampling. Given this, most species had only
one sample for expression and could have been collected in variable environmental conditions
that may result in light-induced gene expression (Stern & Crandall, 2018). All species but one,
Trichobius johansonae, had only one sample making it difficult to ascertain whether these
expression data are species specific or individual specific. In addition to this, the small, varying
size of the bat fly required RNA extractions to be done using a whole bat fly in lieu of only eye
structures, making comparisons between species relatively difficult. This type of size-constraint
also includes the eye size to body size ratio where larger eyes lead to a higher expression (Wu et
al., 2020). The most important quality metric here is the N50 value (Riesgo et al., 2012)
considering BUSCO scores for 42 arthropod transcriptomes were all lower than the ideal 95%
standard (< 92%) (Simão et al., 2015). Quality transcriptome assessment of assemblies are
important when making conclusions regarding expression.
Summary
At the transcription level, most of the studied bat fly species expressed a verified
rhodopsin paralog (Rh1) with functionality based on identified phosphorylation sites and
conserved regions used in the initial rhodopsin-based interactions of the phototransduction
cascade. Toward the termination of Rh1 signal in the cascade, the loss of RdgC and arrestin in
most species suggests a degradation of rhodopsin and a slower recovery from
photoisomerization. Given this, identified rhodopsins contained biologically relevant expression
levels (>1) assessed through TPM. Though expression levels were variable between each
species, there was a trend directly related to facet number (0-9). The lack of expression levels for
43

EYS and prominin suggests that all of the studied species possessed closed rhabdoms, although
future anatomical studies are needed to confirm this hypothesis. Further functional studies should
use multiple replicates of species to focus on the number of retinula cells in each facet in order to
correlate rhodopsin expression and use antibody labeling to attribute function. Though more
work needs to be done, this study has produced a solid molecular foundation in order to
understand both broader ectoparasite trends and intermediary molecular processes for the
evolution of eye loss through a multi-level analysis of the genome and transcriptome.
44

Table 3.1 Transcriptome specimen collection information. Three Nycteribiidae species arecolored in grey and five Streblidae species are colored in blue.
Family Genus Species Facet #Geographic
Range Collection Site
Nycteribiidae Nycteribia schmidlii 0 OW Kenya
Nycteribiidae Basilia anceps 2 NW Belize
Nycteribiidae Basilia sp 0 to 2* NW Belize
Streblidae Megistopoda aranea 9 NW Belize
Streblidae Speiseria ambigua 9 NW Costa Rica
Streblidae Trichobius corynorhini 6 NW Virgina, USA
Streblidae Trichobius johansonae 1 NW Belize
Streblidae Trichobius sp. Unknown NW Puerto Rico
*Range based on closely related speciesOW = Old World, NW = New World
Table 3.2 Statistics for transcriptome assembly of three Nycteribiidae species in grey and five Streblidae species inblue using Trinity and BUSCO.
SpeciesGeographic
Range
AverageContig
Length (bp) N50 GC Content
LargestContig
(bp) Complete Fragment Missing
Nycteribia schmidlii OW 1656 2127 36.66% 28050 94.30% 2.50% 3.20%
Basilia anceps NW 2078.86 2834 35.99% 18772 91.80% 2.40% 5.80%
Basilia sp. NW 1804.06 2457 35.42% 16621 92.10% 3.40% 4.50%
Megistopoda aranea NW 1956.69 2587 32.60% 15023 88.50% 4.20% 7.30%
Speiseria ambigua NW 1708.01 2238 40.12% 13486 81.30% 8.30% 10.40%
Trichobius corynorhini NW 1400.28 1738 36.47% 14440 72.20% 11.00% 16.80%
Trichobius johansonae NW 2275.65 3115 39.70% 18178 87.30% 2.70% 10.00%
Trichobius sp. NW 1596.5 2042 39.15% 9589 74.90% 11.50% 13.60%
OW = Old World, NW = New World
45

Table 3.3 Identified rhodopsin paralogs with their relativeTPM from Trinity assembled bat fly transcriptomes.
Species Facet # Opsin TPM
Nycteribia schmidlii 0 X NA
Basilia anceps 2 Rh1 1.39372
Basilia sp. 0 to 2* Rh1 2.47739
Megistopoda aranea 9 Rh1 28.9629
Speiseria ambigua 9 X NA
Trichobius corynorhini 6 Rh1 13.3776
Trichobius johansonae 1 Rh1 3.69274
Trichobius sp. Unknown Rh1 22.5069
*Range based on closely related speciesTPM = transcripts per million, X = nothing identified, NA = not
applicable
46

47

48

49

Appendix A: Macro-anatomy & Immunohistochemistry of Paratrichobius longicrus
Preliminary antibody labeling was done in a Paratrichobius longicrus species in the
family Streblidae in order to ascertain the function of rhodopsin at the translational level. The
rhabdom was targeted for G-protein coupled receptors (GPCR) to confirm opsins, DAPI in order
to confirm separate cells via nuclei, and synapses to look at the neuronal network.
Bat flies collected from Belize were preserved in paraformaldehyde (PFA). Bat fly heads
were separated from the thorax and cleared overnight using TDE dilution (10-90%, 97%) and
placed in H2O2 for four hours. Cleared heads were fixed with 4% PFA by creating a small
non-intrusive puncture in the head with a needle. Samples were left in PFA overnight before
starting cryosection preservation 15% sucrose and 30% sucrose each left in 4℃ overnight.
Samples were frozen in tissue embedding material and sectioned at 10 microns and placed on a
slide. P. longicrus was stained with primary antibodies for synapsin (SYN1, A-6442, rabbit host)
and GPCRs (RGS21, SAB1408534, mouse host) at a 1:500 dilution with blocking buffer for at
least 8 hours at 4℃. Secondary antibodies, anti-rabbit 594 and anti-mouse 488, in blocking
buffer at a 1:500 dilution were left for 8 hours at 4℃. Slides were mounted with DAPI prolong
gold and imaged with Leica THUNDER using 405, 488, and 594 channels with a zoom factor
11:1.
P. longicrus THUNDER images identified 24 facets with labeled nuclei in the rhabdom
showing cell structure (Figure A1). This imaging adds to the knowledge regarding degrees of
reduction and specifically, morphology.
50
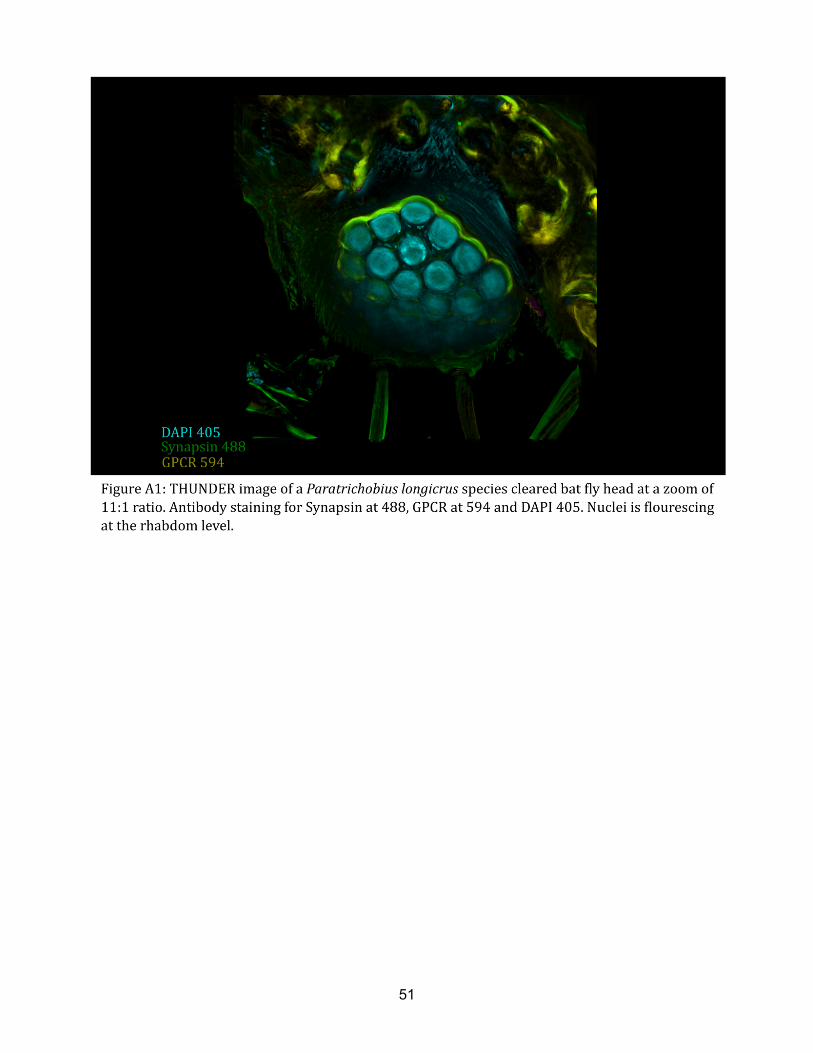
51

Literature CitedAfgan, E., Baker, D., Batut, B., van den Beek, M., Bouvier, D., Čech, M., Chilton, J., Clements,
D., Coraor, N., Grüning, B. A., Guerler, A., Hillman-Jackson, J., Hiltemann, S., Jalili, V.,
Rasche, H., Soranzo, N., Goecks, J., Taylor, J., Nekrutenko, A., & Blankenberg, D.
(2018). The Galaxy platform for accessible, reproducible and collaborative biomedical
analyses: 2018 update. Nucleic Acids Research, 46(W1), W537–W544.
https://doi.org/10.1093/nar/gky379
Agi, E., Langen, M., Altschuler, S. J., Wu, L. F., Zimmermann, T., & Hiesinger, P. R. (2014). The
Evolution and Development of Neural Superposition. Journal of Neurogenetics, 28(3–4),
216–232. https://doi.org/10.3109/01677063.2014.922557
Bankevich, A., Nurk, S., Antipov, D., Gurevich, A. A., Dvorkin, M., Kulikov, A. S., Lesin, V. M.,
Nikolenko, S. I., Pham, S., Prjibelski, A. D., Pyshkin, A. V., Sirotkin, A. V., Vyahhi, N.,
Tesler, G., Alekseyev, M. A., & Pevzner, P. A. (2012). SPAdes: A New Genome
Assembly Algorithm and Its Applications to Single-Cell Sequencing. Journal of
Computational Biology, 19(5), 455–477. https://doi.org/10.1089/cmb.2012.0021
Bedford, T., & Hartl, D. L. (2009). Optimization of gene expression by natural selection.
Proceedings of the National Academy of Sciences, 106(4), 1133–1138.
https://doi.org/10.1073/pnas.0812009106
Bolger, A. M., Lohse, M., & Usadel, B. (2014). Trimmomatic: A flexible trimmer for Illumina
sequence data. Bioinformatics, 30(15), 2114–2120.
https://doi.org/10.1093/bioinformatics/btu170
Bradnam, K. R., Fass, J. N., Alexandrov, A., Baranay, P., Bechner, M., Birol, I., Boisvert, S.,
Chapman, J. A., Chapuis, G., Chikhi, R., Chitsaz, H., Chou, W.-C., Corbeil, J., Del
Fabbro, C., Docking, T. R., Durbin, R., Earl, D., Emrich, S., Fedotov, P., … Korf, I. F.
(2013). Assemblathon 2: Evaluating de novo methods of genome assembly in three
vertebrate species. GigaScience, 2(1), 10. https://doi.org/10.1186/2047-217X-2-10
52

Briscoe, A. D. (1999). Intron splice sites of Papilio glaucus PglRh3 corroborate insect opsin
phylogeny k. 9.
Chen, H., Sun, S., Norenburg, J. L., & Sundberg, P. (2014). Mutation and Selection Cause
Codon Usage and Bias in Mitochondrial Genomes of Ribbon Worms (Nemertea). PLoS
ONE, 9(1), e85631. https://doi.org/10.1371/journal.pone.0085631
Chorev, M., & Carmel, L. (2012). The Function of Introns. Frontiers in Genetics, 3.
https://doi.org/10.3389/fgene.2012.00055
Cooper, R. L., Li, H., Long, L. Y., Cole, J. L., & Hopper, H. L. (2001). Anatomical comparisons of
neural systems in sighted epigean and troglobitic crayfish species. JOURNAL OF
CRUSTACEAN BIOLOGY, 21(2), 15.
Courgeon, M., & Desplan, C. (2019). Coordination of neural patterning in the Drosophila visual
system. Current Opinion in Neurobiology, 56, 153–159.
https://doi.org/10.1016/j.conb.2019.01.024
Culver, D. C. (1982). Cave Life: Evolution and Ecology. Harvard University Press.
https://doi.org/10.4159/harvard.9780674330214
Cvijović, I., Good, B. H., & Desai, M. M. (2018). The Effect of Strong Purifying Selection on
Genetic Diversity. Genetics, 209(4), 1235–1278.
https://doi.org/10.1534/genetics.118.301058
DeLeo, D. M., Pérez-Moreno, J. L., Vázquez-Miranda, H., & Bracken-Grissom, H. D. (2018).
RNA profile diversity across arthropoda: Guidelines, methodological artifacts, and
expected outcomes. Biology Methods and Protocols, 3(1), bpy012.
https://doi.org/10.1093/biomethods/bpy012
Dick, C. W., & Patterson, B. D. (2006). Bat flies: Obligate ectoparasites of bats. In S. Morand, B.
R. Krasnov, & R. Poulin (Eds.), Micromammals and Macroparasites (pp. 179–194).
Springer Japan. https://doi.org/10.1007/978-4-431-36025-4_11
Dittmar, K., Morse, S. F., Dick, C. W., & Patterson, B. D. (2015). Bat fly evolution from the
53

Eocene to the Present (Hippoboscoidea, Streblidae and Nycteribiidae). In S. Morand, B.
R. Krasnov, & D. T. J. Littlewood (Eds.), Parasite Diversity and Diversification (pp.
246–264). Cambridge University Press. https://doi.org/10.1017/CBO9781139794749.017
Dittmar, K., Porter, M. L., Murray, S., & Whiting, M. F. (2006). Molecular phylogenetic analysis of
nycteribiid and streblid bat flies (Diptera: Brachycera, Calyptratae): Implications for host
associations and phylogeographic origins. Molecular Phylogenetics and Evolution, 38(1),
155–170. https://doi.org/10.1016/j.ympev.2005.06.008
Earl, J. B., & Britt, S. G. (2006). Expression of Drosophila rhodopsins during photoreceptor cell
differentiation: Insights into R7 and R8 cell subtype commitment. Gene Expression
Patterns, 6(7), 687–694. https://doi.org/10.1016/j.modgep.2006.01.003
Fein, A., & Cavar, S. (2000). Divergent mechanisms for phototransduction of invertebrate
microvillar photoreceptors. Visual Neuroscience, 17(6), 911–917.
https://doi.org/10.1017/S0952523800176102
Feuda, R., Goulty, M., Zadra, N., Gasparetti, T., Rosato, E., Segata, N., Rizzoli, A., Pisani, D.,
Ometto, L., & Stabelli, O. R. (2020). The diverging evolutionary history of opsin genes in
Diptera [Preprint]. Evolutionary Biology. https://doi.org/10.1101/2020.06.29.177931
Foerstner, K. U., von Mering, C., Hooper, S. D., & Bork, P. (2005). Environments shape the
nucleotide composition of genomes. EMBO Reports, 6(12), 1208–1213.
https://doi.org/10.1038/sj.embor.7400538
Gärtner, W. (2000). Invertebrate visual pigments. In Handbook of Biological Physics (Vol. 3, pp.
297–388). Elsevier. https://doi.org/10.1016/S1383-8121(00)80010-X
Gilad, Y., Oshlack, A., & Rifkin, S. A. (2006). Natural selection on gene expression. Trends in
Genetics, 22(8), 456–461. https://doi.org/10.1016/j.tig.2006.06.002
Greiner, B. (2006). Visual adaptations in the night-active waspApoica pallens. The Journal of
Comparative Neurology, 495(3), 255–262. https://doi.org/10.1002/cne.20882
Greiner, B., Ribi, W. A., & Warrant, E. J. (2004). Retinal and optical adaptations for nocturnal
54

vision in the halictid bee Megalopta genalis. Cell and Tissue Research, 316(3), 377–390.
https://doi.org/10.1007/s00441-004-0883-9
Gross, J. B., Sun, D. A., Carlson, B. M., Brodo-Abo, S., & Protas, M. E. (2019). Developmental
transcriptomic analysis of the cave-dwelling crustacean, Asellus aquaticus [Preprint].
Genetics. https://doi.org/10.1101/845990
Gurevich, A., Saveliev, V., Vyahhi, N., & Tesler, G. (2013). QUAST: Quality assessment tool for
genome assemblies. Bioinformatics, 29(8), 1072–1075.
https://doi.org/10.1093/bioinformatics/btt086
Hardie, R. C. (2001). Phototransduction in Drosophila melanogaster. Journal of Experimental
Biology, 204(20), 3403–3409. https://doi.org/10.1242/jeb.204.20.3403
Hardie, R., Vogt, K., & Rudolph, A. (1989). The compound eye of the tsetse fly (Glossina
morsitans morsitans and Glossina palpalis palpalis). Journal of Insect Physiology, 35(5),
423–431. https://doi.org/10.1016/0022-1910(89)90117-0
Hering, L., Henze, M. J., Kohler, M., Kelber, A., Bleidorn, C., Leschke, M., Nickel, B., Meyer, M.,
Kircher, M., Sunnucks, P., & Mayer, G. (2012). Opsins in Onychophora (Velvet Worms)
Suggest a Single Origin and Subsequent Diversification of Visual Pigments in
Arthropods. Molecular Biology and Evolution, 29(11), 3451–3458.
https://doi.org/10.1093/molbev/mss148
Hershberg, R. (2016). Codon Usage and Translational Selection. In Encyclopedia of
Evolutionary Biology (pp. 293–298). Elsevier.
https://doi.org/10.1016/B978-0-12-800049-6.00178-5
Hinaux, H., Poulain, J., Da Silva, C., Noirot, C., Jeffery, W. R., Casane, D., & Rétaux, S. (2013).
De Novo Sequencing of Astyanax mexicanus Surface Fish and Pachón Cavefish
Transcriptomes Reveals Enrichment of Mutations in Cavefish Putative Eye Genes. PLoS
ONE, 8(1), e53553. https://doi.org/10.1371/journal.pone.0053553
Jackman, S. D., Vandervalk, B. P., Mohamadi, H., Chu, J., Yeo, S., Hammond, S. A., Jahesh,
55

G., Khan, H., Coombe, L., Warren, R. L., & Birol, I. (2017). ABySS 2.0:
Resource-efficient assembly of large genomes using a Bloom filter. Genome Research,
27(5), 768–777. https://doi.org/10.1101/gr.214346.116
Jander, U., & Jander, R. (2002). Allometry and resolution of bee eyes (Apoidea). Arthropod
Structure & Development, 30(3), 179–193.
https://doi.org/10.1016/S1467-8039(01)00035-4
Jeffery, W., & Strickler, A. (2010). Development as an Evolutionary Process in Astyanax
Cavefish. In E. Trajano, M. Bichuette, & B. Kapoor (Eds.), Biology of Subterranean
Fishes (pp. 141–168). Science Publishers. https://doi.org/10.1201/EBK1578086702-c6
Jobling, B. (1926). A Comparative Study of the Structure of the Head and Mouth Parts in the
Hippoboscidae (Diptera Pupipara). Parasitology, 18(3), 319–349.
https://doi.org/10.1017/S003118200000528X
Johnson, E. C., & Pak, W. L. (1986). Electrophysiological study of Drosophila rhodopsin
mutants. Journal of General Physiology, 88(5), 651–673.
https://doi.org/10.1085/jgp.88.5.651
Keene, A. C., Yoshizawa, M., & McGaugh, S. E. (Eds.). (2016). Biology and evolution of the
Mexican cavefish. Academic Press/Elsevier.
Kelber, A. (2003). Colour Vision in Diurnal and Nocturnal Hawkmoths. Integrative and
Comparative Biology, 43(4), 571–579. https://doi.org/10.1093/icb/43.4.571
Klaus, S., Mendoza, J. C. E., Liew, J. H., Plath, M., Meier, R., & Yeo, D. C. J. (2013). Rapid
evolution of troglomorphic characters suggests selection rather than neutral mutation as
a driver of eye reduction in cave crabs. Biology Letters, 9(2), 20121098.
https://doi.org/10.1098/rsbl.2012.1098
Koyanagi, M., Nagata, T., Katoh, K., Yamashita, S., & Tokunaga, F. (2008). Molecular Evolution
of Arthropod Color Vision Deduced from Multiple Opsin Genes of Jumping Spiders.
Journal of Molecular Evolution, 66(2), 130–137.
56

https://doi.org/10.1007/s00239-008-9065-9
Krishnan, J., & Rohner, N. (2017). Cavefish and the basis for eye loss. Philosophical
Transactions of the Royal Society B: Biological Sciences, 372(1713), 20150487.
https://doi.org/10.1098/rstb.2015.0487
Kumar, S., Stecher, G., Li, M., Knyaz, C., & Tamura, K. (2018). MEGA X: Molecular Evolutionary
Genetics Analysis across Computing Platforms. Molecular Biology and Evolution, 35(6),
1547–1549. https://doi.org/10.1093/molbev/msy096
Kunz, T. H. (2013). Ecology of Bats. Springer.
https://public.ebookcentral.proquest.com/choice/publicfullrecord.aspx?p=5588034
Kutty, S. N., Pape, T., Wiegmann, B. M., & Meier, R. (2010). Molecular phylogeny of the
Calyptratae (Diptera: Cyclorrhapha) with an emphasis on the superfamily Oestroidea
and the position of Mystacinobiidae and McAlpine’s fly. Systematic Entomology, 35(4),
614–635. https://doi.org/10.1111/j.1365-3113.2010.00536.x
Lampel, J., Briscoe, A. D., & Wasserthal, L. T. (2005). Expression of UV-, blue-,
long-wavelength-sensitive opsins and melatonin in extraretinal photoreceptors of the
optic lobes of hawkmoths. Cell and Tissue Research, 321(3), 443–458.
https://doi.org/10.1007/s00441-004-1069-1
Land, M. F. (1997). VISUAL ACUITY IN INSECTS. Annual Review of Entomology, 42(1),
147–177. https://doi.org/10.1146/annurev.ento.42.1.147
Land, M. F. (2005). The optical structures of animal eyes. Current Biology, 15(9), R319–R323.
https://doi.org/10.1016/j.cub.2005.04.041
Land, M. F., Gibson, G., Horwood, J., & Zeil, J. (1999). Fundamental differences in the optical
structure of the eyes of nocturnal and diurnal mosquitoes. Journal of Comparative
Physiology A: Sensory, Neural, and Behavioral Physiology, 185(1), 91–103.
https://doi.org/10.1007/s003590050369
Lunau, K. (2014). Visual ecology of flies with particular reference to colour vision and colour
57

preferences. Journal of Comparative Physiology A, 200(6), 497–512.
https://doi.org/10.1007/s00359-014-0895-1
Mahato, S., Nie, J., Plachetzki, D. C., & Zelhof, A. C. (2018). A mosaic of independent
innovations involving eyes shut are critical for the evolutionary transition from fused to
open rhabdoms. Developmental Biology, 443(2), 188–202.
https://doi.org/10.1016/j.ydbio.2018.09.016
Marshall, A. G. (1981). The ecology of ectoparasitic insects. Academic Press.
Marshall, A. G. (1982). Ecology of Insects Ectoparasitic on Bats. In T. H. Kunz (Ed.), Ecology of
Bats (pp. 369–401). Springer US. https://doi.org/10.1007/978-1-4613-3421-7_10
Mayberry, J. R. (2014). Through the Eyes of Bat Flies. 162.
McGaugh, S. E., Gross, J. B., Aken, B., Blin, M., Borowsky, R., Chalopin, D., Hinaux, H., Jeffery,
W. R., Keene, A., Ma, L., Minx, P., Murphy, D., O’Quin, K. E., Rétaux, S., Rohner, N.,
Searle, S. M. J., Stahl, B. A., Tabin, C., Volff, J.-N., … Warren, W. C. (2014). The
cavefish genome reveals candidate genes for eye loss. Nature Communications, 5(1),
5307. https://doi.org/10.1038/ncomms6307
Mejía-Ortíz, L., & Hartnoll, R. (2006). A new use for useless eyes in cave crustaceans.
Crustaceana, 79(5), 593–600. https://doi.org/10.1163/156854006777584313
Mejía-Ortíz, L. M., & Hartnoll, R. G. (2005). Modifications of Eye Structure and Integumental
Pigment in Two Cave Crayfish. Journal of Crustacean Biology, 25(3), 480–487.
https://doi.org/10.1651/C-2569
Metzger, B. P. H., Duveau, F., Yuan, D. C., Tryban, S., Yang, B., & Wittkopp, P. J. (2016).
Contrasting Frequencies and Effects of cis—And trans -Regulatory Mutations Affecting
Gene Expression. Molecular Biology and Evolution, 33(5), 1131–1146.
https://doi.org/10.1093/molbev/msw011
Metzger, B. P. H., Yuan, D. C., Gruber, J. D., Duveau, F., & Wittkopp, P. J. (2015). Selection on
noise constrains variation in a eukaryotic promoter. Nature, 521(7552), 344–347.
58

https://doi.org/10.1038/nature14244
Miller, M. A., Schwartz, T., Pickett, B. E., He, S., Klem, E. B., Scheuermann, R. H., Passarotti,
M., Kaufman, S., & O’Leary, M. A. (2015). A RESTful API for Access to Phylogenetic
Tools via the CIPRES Science Gateway. Evolutionary Bioinformatics, 11, EBO.S21501.
https://doi.org/10.4137/EBO.S21501
Mizuno, M., & Kanehisa, M. (1994). Distribution profiles of GC content around the translation
initiation site in different species. FEBS Letters, 352(1), 7–10.
https://doi.org/10.1016/0014-5793(94)00898-1
Montell, C. (2012). Drosophila visual transduction. Trends in Neurosciences, 35(6), 356–363.
https://doi.org/10.1016/j.tins.2012.03.004
Mortazavi, A., Williams, B. A., McCue, K., Schaeffer, L., & Wold, B. (2008). Mapping and
quantifying mammalian transcriptomes by RNA-Seq. Nature Methods, 5(7), 621–628.
https://doi.org/10.1038/nmeth.1226
Nei, M., & Gojobori, T. (1986). Simple methods for estimating the numbers of synonymous and
nonsynonymous nucleotide substitutions. Molecular Biology and Evolution, 3(5),
418–426. https://doi.org/10.1093/oxfordjournals.molbev.a040410
Niemiller, M. L., Fitzpatrick, B. M., Shah, P., Schmitz, L., & Near, T. J. (2013). Evidence for
repeated loss of selective constraint in rhodopsin of Amblyopsidae cavefishes (Teleostei:
Amblyopsidae): Loss of function in rhodopsin of cavefishes. Evolution, 67(3), 732–748.
https://doi.org/10.1111/j.1558-5646.2012.01822.x
Nilsson, D.-E., & Kelber, A. (2007). A functional analysis of compound eye evolution. Arthropod
Structure & Development, 36(4), 373–385. https://doi.org/10.1016/j.asd.2007.07.003
Osorio, D. (2007). Spam and the evolution of the fly’s eye. BioEssays, 29(2), 111–115.
https://doi.org/10.1002/bies.20533
Palczewski, K. (2006). G Protein–Coupled Receptor Rhodopsin. Annual Review of
Biochemistry, 75(1), 743–767.
59

https://doi.org/10.1146/annurev.biochem.75.103004.142743
Paulsen, R. (1984). Spectral characteristics of isolated blowfly rhabdoms. Journal of
Comparative Physiology A, 155(1), 47–55. https://doi.org/10.1007/BF00610930
Porter, M. L., Blasic, J. R., Bok, M. J., Cameron, E. G., Pringle, T., Cronin, T. W., & Robinson, P.
R. (2012). Shedding new light on opsin evolution. Proceedings of the Royal Society B:
Biological Sciences, 279(1726), 3–14. https://doi.org/10.1098/rspb.2011.1819
Porter, M. L., Cronin, T. W., Dick, C. W., Simon, N., & Dittmar, K. (2020). Visual system
characterization of the obligate bat ectoparasite Trichobius frequens (Diptera:
Streblidae). Arthropod Structure & Development, 101007.
https://doi.org/10.1016/j.asd.2020.101007
Porter, M. L., Cronin, T. W., McClellan, D. A., & Crandall, K. A. (2006). Molecular
Characterization of Crustacean Visual Pigments and the Evolution of Pancrustacean
Opsins. Molecular Biology and Evolution, 24(1), 253–268.
https://doi.org/10.1093/molbev/msl152
Protas, M., Conrad, M., Gross, J. B., Tabin, C., & Borowsky, R. (2007). Regressive Evolution in
the Mexican Cave Tetra, Astyanax mexicanus. Current Biology, 17(5), 452–454.
https://doi.org/10.1016/j.cub.2007.01.051
Protas, M. E., Trontelj, P., & Patel, N. H. (2011). Genetic basis of eye and pigment loss in the
cave crustacean, Asellus aquaticus. Proceedings of the National Academy of Sciences,
108(14), 5702–5707. https://doi.org/10.1073/pnas.1013850108
Re, C., Fišer, Ž., Perez, J., Tacdol, A., Trontelj, P., & Protas, M. E. (2018). Common Genetic
Basis of Eye and Pigment Loss in Two Distinct Cave Populations of the Isopod
Crustacean Asellus aquaticus. Integrative and Comparative Biology, 58(3), 421–430.
https://doi.org/10.1093/icb/icy028
Riesgo, A., Andrade, S. C. S., Sharma, P. P., Novo, M., Pérez-Porro, A. R., Vahtera, V.,
González, V. L., Kawauchi, G. Y., & Giribet, G. (2012). Comparative description of ten
60

transcriptomes of newly sequenced invertebrates and efficiency estimation of genomic
sampling in non-model taxa. Frontiers in Zoology, 9(1), 33.
https://doi.org/10.1186/1742-9994-9-33
Rister, J., & Desplan, C. (2011). The retinal mosaics of opsin expression in invertebrates and
vertebrates. Developmental Neurobiology, 71(12), 1212–1226.
https://doi.org/10.1002/dneu.20905
Rocha, E. P. C., & Danchin, A. (2002). Base composition bias might result from competition for
metabolic resources. Trends in Genetics, 18(6), 291–294.
https://doi.org/10.1016/S0168-9525(02)02690-2
Romhányi, G., & Molnar, L. (1974). Optical polarisation indicates linear arrangement of
rhodopsin oligosaccharide chain in rod disk membranes of frog retina. Nature,
249(5456), 486–488. https://doi.org/10.1038/249486a0
Roy, S. W., & Gilbert, W. (2005). The pattern of intron loss. Proceedings of the National
Academy of Sciences, 102(3), 713–718. https://doi.org/10.1073/pnas.0408274102
Sakai, K., Tsutsui, K., Yamashita, T., Iwabe, N., Takahashi, K., Wada, A., & Shichida, Y. (2017).
Drosophila melanogaster rhodopsin Rh7 is a UV-to-visible light sensor with an
extraordinarily broad absorption spectrum. Scientific Reports, 7(1), 7349.
https://doi.org/10.1038/s41598-017-07461-9
Salcedo, E., Huber, A., Henrich, S., Chadwell, L. V., Chou, W.-H., Paulsen, R., & Britt, S. G.
(1999). Blue- and Green-Absorbing Visual Pigments of Drosophila: Ectopic Expression
and Physiological Characterization of the R8 Photoreceptor Cell-Specific Rh5 and Rh6
Rhodopsins. The Journal of Neuroscience, 19(24), 10716–10726.
https://doi.org/10.1523/JNEUROSCI.19-24-10716.1999
Simão, F. A., Waterhouse, R. M., Ioannidis, P., Kriventseva, E. V., & Zdobnov, E. M. (2015).
BUSCO: Assessing genome assembly and annotation completeness with single-copy
orthologs. Bioinformatics, 31(19), 3210–3212.
61
https://doi.org/10.1093/bioinformatics/btv351
Sondhi, Y., Ellis, E. A., Bybee, S. M., Theobald, J. C., & Kawahara, A. Y. (2021). Light
environment drives evolution of color vision genes in butterflies and moths.
Communications Biology, 4(1), 177. https://doi.org/10.1038/s42003-021-01688-z
Song, X., Vishnivetskiy, S. A., Seo, J., Chen, J., Gurevich, E. V., & Gurevich, V. V. (2011).
Arrestin-1 expression level in rods: Balancing functional performance and photoreceptor
health. Neuroscience, 174, 37–49. https://doi.org/10.1016/j.neuroscience.2010.11.009
Spaethe, J. (2004). Early Duplication and Functional Diversification of the Opsin Gene Family in
Insects. Molecular Biology and Evolution, 21(8), 1583–1594.
https://doi.org/10.1093/molbev/msh162
Speiser, D. I., Pankey, M. S., Zaharoff, A. K., Battelle, B. A., Bracken-Grissom, H. D., Breinholt,
J. W., Bybee, S. M., Cronin, T. W., Garm, A., Lindgren, A. R., Patel, N. H., Porter, M. L.,
Protas, M. E., Rivera, A. S., Serb, J. M., Zigler, K. S., Crandall, K. A., & Oakley, T. H.
(2014). Using phylogenetically-informed annotation (PIA) to search for light-interacting
genes in transcriptomes from non-model organisms. BMC Bioinformatics, 15(1), 350.
https://doi.org/10.1186/s12859-014-0350-x
Stamatakis, A. (2014). RAxML version 8: A tool for phylogenetic analysis and post-analysis of
large phylogenies. Bioinformatics, 30(9), 1312–1313.
https://doi.org/10.1093/bioinformatics/btu033
Stamatakis, A., Ludwig, T., & Meier, H. (2005). RAxML-III: A fast program for maximum
likelihood-based inference of large phylogenetic trees. Bioinformatics, 21(4), 456–463.
https://doi.org/10.1093/bioinformatics/bti191
Stecher, G., Tamura, K., & Kumar, S. (2020). Molecular Evolutionary Genetics Analysis (MEGA)
for macOS. Molecular Biology and Evolution, 37(4), 1237–1239.
https://doi.org/10.1093/molbev/msz312
Stern, D. B., Breinholt, J., Pedraza‐Lara, C., López‐Mejía, M., Owen, C. L., Bracken‐Grissom,
62

H., Fetzner, J. W., & Crandall, K. A. (2017). Phylogenetic evidence from freshwater
crayfishes that cave adaptation is not an evolutionary dead‐end. Evolution, 71(10),
2522–2532. https://doi.org/10.1111/evo.13326
Stern, D. B., & Crandall, K. A. (2018). The Evolution of Gene Expression Underlying Vision Loss
in Cave Animals. Molecular Biology and Evolution, 35(8), 2005–2014.
https://doi.org/10.1093/molbev/msy106
Sukontason, K. L., Chaiwong, T., Piangjai, S., Upakut, S., Moophayak, K., & Sukontason, K.
(2008). Ommatidia of blow fly, house fly, and flesh fly: Implication of their vision
efficiency. Parasitology Research, 103(1), 123–131.
https://doi.org/10.1007/s00436-008-0939-y
Taylor, S. D., de la Cruz, K. D., Porter, M. L., & Whiting, M. F. (2005). Characterization of the
Long-Wavelength Opsin from Mecoptera and Siphonaptera: Does a Flea See?
Molecular Biology and Evolution, 22(5), 1165–1174.
https://doi.org/10.1093/molbev/msi110
Terakita, A. (2005). The opsins. Genome Biology, 6(3), 213.
https://doi.org/10.1186/gb-2005-6-3-213
Tierney, S. M., Cooper, S. J. B., Saint, K. M., Bertozzi, T., Hyde, J., Humphreys, W. F., & Austin,
A. D. (2015). Opsin transcripts of predatory diving beetles: A comparison of surface and
subterranean photic niches. Royal Society Open Science, 2(1), 140386.
https://doi.org/10.1098/rsos.140386
Velarde, R. A., Sauer, C. D., O. Walden, K. K., Fahrbach, S. E., & Robertson, H. M. (2005).
Pteropsin: A vertebrate-like non-visual opsin expressed in the honey bee brain. Insect
Biochemistry and Molecular Biology, 35(12), 1367–1377.
https://doi.org/10.1016/j.ibmb.2005.09.001
Wakakuwa, M., Terakita, A., Koyanagi, M., Stavenga, D. G., Shichida, Y., & Arikawa, K. (2010).
Evolution and Mechanism of Spectral Tuning of Blue-Absorbing Visual Pigments in
63

Butterflies. PLoS ONE, 5(11), e15015. https://doi.org/10.1371/journal.pone.0015015
Wang, T., & Montell, C. (2007). Phototransduction and retinal degeneration in Drosophila.
Pflügers Archiv - European Journal of Physiology, 454(5), 821–847.
https://doi.org/10.1007/s00424-007-0251-1
Warrant, E. (2019). Invertebrate Vision. In Encyclopedia of Animal Behavior (pp. 64–79).
Elsevier. https://doi.org/10.1016/B978-0-12-809633-8.01303-0
Wenzel, R. L. (1975). The streblid batflies of Venezuela (Diptera: Streblidae). Brigham Young
University Science Bulletin., 20, 1–177. https://doi.org/10.5962/bhl.part.5666
Wernet, M. F., & Desplan, C. (2004). Building a retinal mosaic: Cell-fate decision in the fly eye.
Trends in Cell Biology, 14(10), 576–584. https://doi.org/10.1016/j.tcb.2004.09.007
Wernet, M. F., Perry, M. W., & Desplan, C. (2015). The evolutionary diversity of insect retinal
mosaics: Common design principles and emerging molecular logic. Trends in Genetics,
31(6), 316–328. https://doi.org/10.1016/j.tig.2015.04.006
Wilkens, H., Culver, D. C., & Humphreys, W. F. (Eds.). (2000). Subterranean ecosystems (1st
ed). Elsevier.
Wolken, J. J., Capenos, J., & Turano, A. (1957). PHOTORECEPTOR STRUCTURES. The
Journal of Biophysical and Biochemical Cytology, 3(3), 441–448.
https://doi.org/10.1083/jcb.3.3.441
Wu, M., Bao, R., & Friedrich, M. (2020). Evolutionary conservation of opsin gene expression
patterns in the compound eyes of darkling beetles. Development Genes and Evolution,
230(5–6), 339–345. https://doi.org/10.1007/s00427-020-00669-2
Yamamoto, Y., Stock, D. W., & Jeffery, W. R. (2004). Hedgehog signalling controls eye
degeneration in blind cavefish. Nature, 431(7010), 844–847.
https://doi.org/10.1038/nature02864
Yang, J., Chen, X., Bai, J., Fang, D., Qiu, Y., Jiang, W., Yuan, H., Bian, C., Lu, J., He, S., Pan,
X., Zhang, Y., Wang, X., You, X., Wang, Y., Sun, Y., Mao, D., Liu, Y., Fan, G., … Shi, Q.
64

(2016). The Sinocyclocheilus cavefish genome provides insights into cave adaptation.
BMC Biology, 14(1), 1. https://doi.org/10.1186/s12915-015-0223-4
Yau, K.-W., & Hardie, R. C. (2009). Phototransduction Motifs and Variations. Cell, 139(2),
246–264. https://doi.org/10.1016/j.cell.2009.09.029
Zelhof, A. C., Hardy, R. W., Becker, A., & Zuker, C. S. (2006). Transforming the architecture of
compound eyes. Nature, 443(7112), 696–699. https://doi.org/10.1038/nature05128
Zerbino, D. R., & Birney, E. (2008). Velvet: Algorithms for de novo short read assembly using de
Bruijn graphs. Genome Research, 18(5), 821–829. https://doi.org/10.1101/gr.074492.107
Zhao, S., Ye, Z., & Stanton, R. (2020). Misuse of RPKM or TPM normalization when comparing
across samples and sequencing protocols. RNA, 26(8), 903–909.
https://doi.org/10.1261/rna.074922.120
Zuker, C. S., Cowman, A. F., & Rubin, G. M. (1985). Isolation and structure of a rhodopsin gene
from D. melanogaster. Cell, 40(4), 851–858.
https://doi.org/10.1016/0092-8674(85)90344-7
65