Bassok - Redshirting in Kindergarten
38
Transcript of Bassok - Redshirting in Kindergarten

Bassok - Redshirting in Kindergarten
1 CEPWC Working Paper Series No. 4. October 2012.
Available at http://curry.virginia.edu/research/centers/cepwc/publications. Curry School of Education | Frank Batten School of Leadership and Public Policy | University of Virginia
THE EXTENT, PATTERNS, AND POTENTIAL IMPLICATIONS OF KINDERGARTEN
“REDSHIRTING”
By Daphna Bassok & Sean F. Reardon
According to scholarly and popular reports, “academic redshirting” in kindergarten—the
practice of delaying a child’s entry into kindergarten for a year—has become increasingly common
(Bazelon 2008; Paul 2010; Weil 2007; Graue and DiPerna 2000). In the past, nearly all children
entered kindergarten at age five, but a recent New York Times article noted that in 2008, 17 percent
of kindergarten entrants were at least six years old (Paul, 2010). The shift towards later school entry
is partially explained by changes in school entry laws, but may also be due to an increase in the
prevalence of redshirting (Deming & Dynarski, 2008). Some accounts suggest parents increasingly
delay kindergarten entry because they believe their child is not developmentally ready for the
demands of the classroom (Cosden, Zimmer, & Tuss, 1993; Graue, Kroeger, & Brown, 2002; Noel
& Newman, 2003). Others argue that redshirting reflects parents’ strategic desire to ensure their
child enters kindergarten older, taller, and with higher levels of social and cognitive skills than their
classmates. (Frey, 2005; Graue et al., 2002; Matlack, 2011).
A number of other papers have attempted to estimate the effect of redshirting on individual
outcomes ((Bedard & Dhuey, 2006; Black, Devereux, & Salvanes, 2008; Datar, 2006a; Dhuey &
Lipscomb, 2008; Dobkin & Ferreira, 2010; Elder, 2010; Evans, Morrill, & Parente, 2010;
Fredriksson & Ockert, 2005; Jurges & Schneider, 2007; Morrison, Smith, & Dow-Ehrensberger,
1995; Puhani & Weber, 2007; Stipek, 2002). Our paper attempts to fill a hole in the redshirting
literature by carefully describing the prevalence and correlates of redshirting. A better understanding
of the rates and correlates of redshirting is important for several reasons. First, existing research and
media reports differ widely in their estimates of the prevalence of redshirting. We are able to
provide more credible estimates (and from more recent cohorts) than prior research. Second, a
Bassok - Redshirting in Kindergarten
2 CEPWC Working Paper Series No. 4. October 2012.
Available at http://curry.virginia.edu/research/centers/cepwc/publications. Curry School of Education | Frank Batten School of Leadership and Public Policy | University of Virginia
parent’s decision to delay their child’s entry into kindergarten may have important consequences for
the child’s experience in school, their learning, and later life outcomes. While we do not attempt in
this paper to estimate the effects of redshirting on learning and later life outcomes, we do provide
evidence describing how the decision to redshirt affects a child’s relative rank (in age, physical
development, and pre-K school readiness) among his or her kindergarten cohort peers. Third, the
decisions by some parents to delay their children’s school entry affect the composition of
kindergarten classrooms. If classroom composition affects student learning (via altered curricula,
instruction, or peer relations), then redshirting may impact school experiences, learning, and later life
outcomes even for those students who enter kindergarten on time. The potential for such
externalities makes an examination of individual redshirting behavior a matter of public policy
interest. Fourth, even if redshirting has no effect on students’ learning, it may affect the measured
patterns of achievement and achievement gaps. If high-income and/or white students are more
likely to redshirt than their lower-income and non-white peers, then income and race will be
correlated with age within a kindergarten cohort; this may lead to bias in estimates of income or
racial achievement gaps.
In this paper we leverage data from two large, nationally-representative datasets to address
three related issues: (1) How prevalent is redshirting?; (2) Who redshirts? What child, family, and
school context characteristics are associated with redshirting? and; (3) How does redshirting affect
the composition of kindergarten cohorts, both at the national and the school level? We find that
only 4 percent of children delay kindergarten, a lower number than typically reported. Male, white
and high SES children are most likely to delay kindergarten. However, given the low redshirting
rates nationwide, redshirting has only modest effects on the magnitude of national kindergarten-
entry achievement gaps. At the local level, we find high variation in redshirting practices, with
schools serving more high-income and white children displaying higher rates of redshirting. We
Bassok - Redshirting in Kindergarten
3 CEPWC Working Paper Series No. 4. October 2012.
Available at http://curry.virginia.edu/research/centers/cepwc/publications. Curry School of Education | Frank Batten School of Leadership and Public Policy | University of Virginia
show that, as expected, high rates of redshirting are associated with increases in age variation within
kindergarten cohorts. This variation may lead to meaningful differences in peer composition and
learning experiences for children, although our exploratory results show that higher within-school
redshirting rates are not associated with a wider distribution of cognitive skills at school entry.
Background
How Prevalent is Redshirting?
In the early half of the 20th century, as kindergarten became institutionalized as part of the
public school system, the percentage of five year olds enrolled rose from approximately 0 to 60
percent. (Cuban, 1992). More recently, however, the trend has reversed. The percentage of six year
olds enrolled in first grade or above has gradually dropped from 96 percent in 1968 to 83 percent in
2010 (Deming & Dynarski, 2008; Paul, 2010). In part, this shift in age is explained by changes in
school entry laws. Between 1975 and 2000, 22 states increased the minimum entry age for
kindergarten (Stipek, 2002). However, policy shifts in entry laws only partially explain why children
are entering kindergarten at a later age. Changes in the prevalence of kindergarten “redshirting”—
delaying a child’s kindergarten entry for a year for developmental or social reasons--may also play a
part.
In recent years, several studies have provided estimates of redshirting based on nationally-
representative data. Byrd, Weitzman, & Auinger, (1997) find that in a national sample of children
ages 7 to 17 born in the late 1970s, approximately 12 percent are “old-for-grade” and have never
repeated grades (their proxy for redshirting). Using parent-reported data from the National
Household Education Survey (NHES) of 1993 and 1995, Zill, Loomis, & West, (1997) report that
approximately 9 percent of first and second graders born in the late 1980s delayed kindergarten
entry. Lincove & Painter (2006), who use retrospective data from the National Education
Longitudinal Study of 1988 (a cohort of students born in the mid-1970s), also report redshirting

Bassok - Redshirting in Kindergarten
4 CEPWC Working Paper Series No. 4. October 2012.
Available at http://curry.virginia.edu/research/centers/cepwc/publications. Curry School of Education | Frank Batten School of Leadership and Public Policy | University of Virginia
rates around 9 percent but base these estimates only on children with summer birthdays (for whom
redshirting is likely most common). Finally, estimates from the kindergarten cohort of the Early
Childhood Longitudinal Study (ECLS-K), which tracks a nationally-representative sample of
children who entered kindergarten in 1998 (born in the early 1990s) are lower; 5 percent if
calculations are based on children’s age at kindergarten entry and 7 percent if parents’ reports of are
used (Datar, 2006a).
These studies, which place the national red-shirting rate between 5 and 12 percent, rely on
data from cohorts born in the mid-1970s through the early 1990s, with the lowest estimated rates for
the more recent birth cohorts. Kindergarten entry behaviors may have shifted due to changes in
kindergarten cutoff dates and kindergarten entry exams, increased understanding about child
development, large-scale expansions in preschool opportunities and increased school-level
accountability (Barnett, Epstein, Friedman, Sansanelli, & Hustedt, 2009; Jacob, 2005; Shonkoff &
Phillips, 2000; Stipek, 2002). In addition, these studies rely on retrospective parental reports or fairly
crude proxies to identify redshirting and most do not account for differences across states in school
entry laws (Datar, 2006a is an exception). To date, none of the nationally-representative studies
have used prospective data that allows researchers to directly observe children’s school entry
decisions, and to model them based on their observed characteristics before age five. The current
study leverages prospective, nationally representative data to provide more recent and reliable
estimates of redshirting.
Who Redshirts?
The popular press emphasizes that white children, boys, and children from families with
more resources are over-represented among redshirters, a claim confirmed by earlier research
(Datar, 2006b; Dobkin & Ferreira, 2010; Zill et al., 1997). Data from the National Household

Bassok - Redshirting in Kindergarten
5 CEPWC Working Paper Series No. 4. October 2012.
Available at http://curry.virginia.edu/research/centers/cepwc/publications. Curry School of Education | Frank Batten School of Leadership and Public Policy | University of Virginia
Education Survey of 2007 shows that of parents with children ages 3-5 not yet enrolled in school
indicates that 3 percent of parents with a high school diploma or less planned to delay kindergarten
entry compared to 12 percent of parents with a Bachelor’s degree, and that white parents were more
than twice as likely to plan to redshirt relative to Black and Hispanic parents (O’Donnell & Mulligan,
2008).
No study we are aware of has examined whether kindergarten entry decisions relate to
measures of children’s cognitive, social and physical development. If the children who redshirt are
those with the lowest academic or social skills at the time when they are eligible to enroll, their
delayed entry will tend to compress the skill distribution of a kindergarten cohort. Conversely, if
those who enter late are disproportionately from more advantaged backgrounds and have higher
social and cognitive skills, their decisions may widen the skill distribution of a kindergarten cohort.
In the current study we examine whether redshirting children appear “less ready” on a variety of
parent, caregiver and direct measures of development relative to similar-aged children who start
kindergarten when eligible. We also explore whether racial, gender, and socioeconomic differences
in redshirting behavior can be partly explained by differences in children’s development and school
readiness.
Finally, we provide some simple descriptive analysis of the extent to which redshirting
practices differ across schools nationwide. When parents make kindergarten entry decisions they are
likely influenced by their neighbors and friends, preschool teachers, kindergarten teachers and
others. Norms around redshirting likely differ meaningfully across communities. Indeed, in their
investigation of delayed kindergarten entry across Wisconsin school districts, Graue and DiPerna
(2000) found rates varying from 3 to 94 percent. We therefore supplement our national description
of redshirting with a school-level analysis, exploring how much redshirting varies and whether
schools’ demographic composition explains this variation.
Bassok - Redshirting in Kindergarten
6 CEPWC Working Paper Series No. 4. October 2012.
Available at http://curry.virginia.edu/research/centers/cepwc/publications. Curry School of Education | Frank Batten School of Leadership and Public Policy | University of Virginia
Does Redshirting Affect the Composition of Kindergartener Cohorts?
Although individual parents make kindergarten entry decisions based on the costs and benefits they
perceive for their own child and family, the aggregated decisions of parents could have ramifications
for the learning experiences of all children, over and above any individual impacts. In this paper we
consider two mechanisms by which redshirting may lead to these types of aggregated impacts. First,
redshirting could impact students’ experiences in kindergarten by influencing the range of children’s
cognitive, social, and physical development within kindergarten classrooms. When some individuals
adhere to school entry laws while others do not, the range of ages within a kindergarten cohort may
spread beyond the expected 12-month range.1 Greater within-grade age variation may have positive
or negative implications for children, depending on the characteristics of children who redshirt. If
children with the lowest levels of school readiness are most likely to redshirt, then redshirting
patterns may narrow the developmental range within classrooms; if those with the highest levels of
readiness are most likely to redshirt, however, redshirting may widen classrooms’ developmental
ranges. Both a narrowing or expanding of the developmental distribution within a classroom may
impact childrens’ learning experiences through changes in their peer group or in their teachers’
pedagogical choices. In the current paper we describe how redshirting relates to the within-school
distribution of kindergarten students’ ages as well as cognitive skills at school entry.
Beyond any effect on the learning experiences within particular schools, redshirting could
also influence observed achievement gaps both at school entry and beyond. If high-income and/or
white students are more likely to redshirt, then income and race will be correlated with age within a
kindergarten cohort, which could, mechanically, lead to expansions in observed achievement gaps.
In order to estimate this mechanical impact of redshirting patterns on measured achievement gaps,
we leverage a unique feature of a national dataset to conduct simulations in which we compare
Bassok - Redshirting in Kindergarten
7 CEPWC Working Paper Series No. 4. October 2012.
Available at http://curry.virginia.edu/research/centers/cepwc/publications. Curry School of Education | Frank Batten School of Leadership and Public Policy | University of Virginia
achievement gaps at school entry to achievement gaps in a scenario in which redshirting is
completely eliminated.
To summarize, the current paper adds to the previous literature in several ways. First, we
provide more reliable and current information about the extent of redshirting nationwide, and the
characteristics of children who delay school entry. Second, we examine whether the decision to
delay kindergarten is related to children’s demographic characteristics, to measures of their pre-
kindergarten development, and to school contexts. Finally, we examine the extent to which
redshirting effects the composition of kindergarten cohorts, both within schools and nationwide.
Data
This paper utilizes data from two cohorts of the Early Childhood Longitudinal Study. The Birth
Cohort (ECLS-B), which is the primary dataset for our analysis, is the first study to track a large,
nationally-representative sample from birth to school entry. The base sample includes
approximately 10,700 infants born in 2001. Data were collected at five time points and each wave
includes direct child assessments as well as parent interviews. Wave 4 was conducted in the fall of
2006 when the majority of the sample began kindergarten. Approximately a quarter of the sample
was not yet age-eligible for kindergarten in their state or was age eligible but did not enroll. The fifth
round of data collection tracked the subsample of children who entered kindergarten in the fall of
2007. We therefore observe each child both in the year they turn five (2006) and in the year they
enter kindergarten (2006 or 2007), regardless of whether these occur in the same or different years.
This allows us to observe each child’s developmental characteristics in the fall of the year they were
eligible for kindergarten and in the year they actually enrolled.2
We observe each child's month of birth as well as their state of residence at age five. We use
these two pieces of information, combined with data on state kindergarten cut-off dates, to
determine whether the child was age eligible for kindergarten in fall 2006 and the distance (in

Bassok - Redshirting in Kindergarten
8 CEPWC Working Paper Series No. 4. October 2012.
Available at http://curry.virginia.edu/research/centers/cepwc/publications. Curry School of Education | Frank Batten School of Leadership and Public Policy | University of Virginia
months) between their birthday and the state cut-off. Data on state kindergarten cut-off dates,
collected by the Education Commission of the States, is presented in Table 1. Entry cut-off dates
vary from as early as July 1 (Indiana) to January 1 (Connecticut), with a modal entry cut-off date of
September 1. Nine states do not have a state-mandated kindergarten entry cut-off. These states,
which typically allow individual districts to determine their own kindergarten entry policies, are
omitted from most of our analyses.3
We use data on gender, race and family socio-economic status to examine whether the rate
of compliance with kindergarten entry laws varies across groups. In addition, the data include several
measures of children's "school readiness," including measures of cognitive and social development
The combination of measures available in the ECLS-B allows us to assess the extent to which
kindergarten entry decisions are based on children’s cognitive, social, and physical development as
well as parents’ perceptions of their readiness. The direct cognitive assessments provide measures of
children’s pre-literacy and mathematics ability when the children are approximately 48 to 60 months
old.4 These assessments measure skills including phonological awareness, letter recognition, print
conventions, number sense, counting, and pattern understanding.
In addition to direct assessments, the ECLS-B surveyed each child's primary care provider
(preschool teacher, babysitter, etc.) and included a series of questions about the child's behavior,
social skills and maturity. The items, which are modified from the Preschool and Kindergarten
Behavioral Scales, Second Edition, ask caregivers whether the child makes friends easily, shares toys,
works independently and acts impulsively. We use factor analysis to construct a single measure from
the twenty teacher-reported measures and standardize it with mean 0 and standard deviation 1.
Higher values indicate better adjustment and social skills.5 Parents also answer similar questions
about their child’s social skills. We construct an analogous factor and find the correlation with the
provider-reported assessments is modest (0.35).
Bassok - Redshirting in Kindergarten
9 CEPWC Working Paper Series No. 4. October 2012.
Available at http://curry.virginia.edu/research/centers/cepwc/publications. Curry School of Education | Frank Batten School of Leadership and Public Policy | University of Virginia
Finally, parents were asked about their child’s proficiency on a set of “basic” skills which
include letter and color recognition as well as counting. We constructed a variable that ranges from 0
to 3 depending on the number of the basic skills the child could demonstrate across the following
three measures: (1) child knows (at least) some of the letters of the alphabet; (2) child can identify
the colors red, yellow, blue, and green by name and; (3) child can count up to 10 or higher. Just
over 70 percent of the children in our sample met all three of these basic skills, and an additional 18
percent met two of three.
For the purpose of this study, the key strength of the ECLS-B is that it provides prospective
information about an age cohort of children prior to kindergarten entry, and includes several direct
measures of child development. It allows us to more accurately measure the correlates of delayed
school entry than has previously been possible, and also to simulate scenarios in which all children
start kindergarten when age eligible. A limitation of the dataset, however, is that it does not allow us
to observe groups of kindergarteners nested within the same school or neighborhood. Rates of
redshirting likely differ substantially across schools and communities. In order to assess this, and to
explore whether redshirting impacts the composition of incoming kindergartener’s cohorts within
their school, we use the Early Childhood Longitudinal Study, Kindergarten Cohort (ECLS-K), which
includes data on a nationally representative sample of kindergarteners in fall, 1998.
Our ECLS-K sample includes all first-time public school kindergarteners with a completed
parent survey in fall 1998, a sample of approximately 12,000 children. We define each child as a
redshirter if they entered kindergarten for the first time a year or more after they were first eligible,
as calculated based on their date of birth and their state’s kindergarten entry cutoff in 1998 (Datar,
2006b).6 We aggregate the individual redshirting variable for all children attending kindergarten in
the same school to construct a school level measure, and we use the same approach to construct
measures of each school’s racial and socio-economic composition. On average, we observe 18

Bassok - Redshirting in Kindergarten
10 CEPWC Working Paper Series No. 4. October 2012.
Available at http://curry.virginia.edu/research/centers/cepwc/publications. Curry School of Education | Frank Batten School of Leadership and Public Policy | University of Virginia
children per school. We explore whether schools’ redshirting rate is related to the age-spread of
kindergarteners in a school, defined as the difference between the 10th and 90th percentile, and
similarly the spread of school-entry academic abilities as measured by literacy and mathematics test
scores that are comparable to those used in the ECLS-B.
Finally, as a check on our estimate of the extent of redshirting, we also use data from the
October Supplement of the Current Population Survey (CPS). The CPS surveys a nationally
representative sample of households annually; in October, parents are surveyed regarding the age
and school enrollment status of their children (U.S. Department of Commerce, 2006). Although the
CPS does not include children’s birthdates, we can estimate the proportion of redshirters by
examining the proportion of 6-year-olds enrolled in kindergarten in October 2006 and adjusting this
number for the proportion we would expect to be enrolled if all students enrolled when eligible in
their state.
Methods
How Many Children Redshirt?
We classify ECLS-B children as redshirters if they are born before their state’s cut-off date
for kindergarten enrollment, but do not enroll in kindergarten until 2007 (a year after they are
eligible).7 We classify children as on-time entrants if they are born before their state’s cut-off and
enroll in kindergarten in 2006 or if they are born after their state’s cutoff and enroll in 2007. Finally,
we classify children as “greenshirters” (early entrants) if they are born after their state’s cutoff and
enroll in 2006. We then describe the prevalence of each of these behaviors within our nationally
representative sample.
Who Redshirts?
We provide basic descriptive statistics about the rates of redshirting across socio-economic
and racial groups within the ECLS-B. We then use regression to estimate the relationship between
Bassok - Redshirting in Kindergarten
11 CEPWC Working Paper Series No. 4. October 2012.
Available at http://curry.virginia.edu/research/centers/cepwc/publications. Curry School of Education | Frank Batten School of Leadership and Public Policy | University of Virginia
observable child and family characteristics and kindergarten entry practices for children born in the
three months before or after their state’s kindergarten entry cut-off. For each child we calculate the
difference (in months) between the child's birth date and the kindergarten cut-off in their state (we
call this difference Di).8 We then fit logistic regression models of the form
( ( )
( ))
We fit one model for those who turned five before their state’s cutoff date in 2006; this model
allows us to examine the prevalence and correlates of redshirting as a function of the distance
between their birthdate and the cutoff date. We fit a separate, indentical model, predicting
greenshirting, for those who turned five after their state’s cutoff date in 2006.
While the ECLS-B allows us to examine child-level correlates of redshirting, we use the
ECLS-K to estimate the association between school-level covariates and redshirting rates. We fit a
set of random-intercept logit models predicting redshirting based on schools’ racial and socio-
economic composition. In these models, we center school characteristics around their state
averages, so that the coefficients correspond to average within-state associations between school
characteristics and redshirting rates.
The impact of redshirting on the composition of kindergartener cohorts
We conduct three types of analyses to address our final research question about the extent to which
redshirting impacts the composition of kindergarten cohorts. First, using the ECLS-B we estimate
how redshirting impacts redshirters’ relative position on various developmental measures (e.g.
height, pre-literacy score at school entry) within the national cohort. We know that by redshirting,
children shift from being among the youngest students in a class to being among the oldest. We
leverage a design feature of the ECLS-B to assess to what extent redshirting leads to similar
positional shifts with respect to physical and cognitive development.
Bassok - Redshirting in Kindergarten
12 CEPWC Working Paper Series No. 4. October 2012.
Available at http://curry.virginia.edu/research/centers/cepwc/publications. Curry School of Education | Frank Batten School of Leadership and Public Policy | University of Virginia
To do this we first combine data from Waves 4 and 5 to construct a synthetic kindergarten
entry cohort. For any given outcome (i.e. pre-literacy performance) we create a new variable which
is set to the 2006 value of the outcome if the child entered kindergarten in 2006 (older compliers
and greenshirters) and the 2007 value if the child entered a year later (young compliers and
redshirters). Note that in order to account for variation in dates of assessment we first regressed
each relevant outcome on month of assessment, and used the residual, which is the component that
is unrelated to assessment timing. Under the assumption that patterns of redshirting and
greenshirting do not change significantly from 2006 to 2007, the distribution of this new variable
approximates the true range of abilities among a kindergarten entry cohort.
We then assign each redshirter two rankings. The first is their percentile on a given outcome
relative to all children within the synthetic kindergarten cohort, controlling for the month in which
they were assessed. This ranking tells us how redshirters are performing relative to other first-time
kindergarteners in the fall of the year when they begin school. The second ranking aims to measures
where the redshirters would fall on this same distribution, had they started kindergarten when they
first became eligible. Recall that children who begin kindergarten in 2007 are assessed both at age
five and again at age six. We use each redshirter’s age five score to approximate their performance
had they started kindergarten in 2006, and again assign them a percentile rank relative to the
synthetic kindergarten entry cohort. By constructing these two ranking scores and comparing them,
we can estimate the extent to which redshirting changes an individual child’s relative placement
within a cohort of kindergarteners, holding constant the enrollment decisions of other children.
This first simulation approximates the comparison of interest for an individual parent, who
decides the timing of his or her own child’s school entry, but who does not control the decisions of
other parents. In a second set of analyses we model the counterfactual distribution of test scores a
cohort would have in kindergarten if no one redshirted. We are able to do this because we know
Bassok - Redshirting in Kindergarten
13 CEPWC Working Paper Series No. 4. October 2012.
Available at http://curry.virginia.edu/research/centers/cepwc/publications. Curry School of Education | Frank Batten School of Leadership and Public Policy | University of Virginia
who redshirted, and we know their test score in the fall of the year when they would have been in K
had they not redshirted. We construct a hypothetical “no redshirting” kindergarten cohort similar to
the synthetic kindergarten cohort described above except that in the hypothetical cohort all redshirters
are assigned their scores from 2006, the year when they could have entered kindergarten, rather than
2007, the year they actually entered.9 We then compare the distribution of scores in this hypothetical
cohort to that in the observed synthetic kindergarten cohort and assess the extent to which
eliminating redshirting altogether would narrow national achievement gaps between key
demographic subgroups.
The preceding analysis describes how national patterns of redshirting might affect national
patterns of measured achievement gaps. In order to provide some (admittedly crude) assessment of
extent to which redshirting impacts the range of developmental outcomes within schools, we use the
ECLS-K data and fit school-level regression models predicting the range of school-entry literacy and
math scores (adjusted for each child’s month of assessment) based on the rate of redshirting within
the school.
Results
The Extent of Redshirting
Table 2 breaks down our sample into four categories based on kindergarten entry behaviors.
The first column shows the percentage of children turn five in 2006 prior to the kindergarten cut-off
in their state and who, in compliance with the law, begin kindergarten in 2006. The second column
shows a second group of compliers who begin kindergarten in 2007 because their fifth birthday falls
after the 2006 state cut-off. The final columns show two types of non-compliers. The first, shown
in column 3, are the greenshirters: children born after the cut-off who enter in 2006 nonetheless.
Redshirters, shown in column 4, are children who are age-eligible for kindergarten in 2006 but who
delay and do not actually enroll until 2007.

Bassok - Redshirting in Kindergarten
14 CEPWC Working Paper Series No. 4. October 2012.
Available at http://curry.virginia.edu/research/centers/cepwc/publications. Curry School of Education | Frank Batten School of Leadership and Public Policy | University of Virginia
The first row of the table shows that, on average, about 94 percent of children comply with
kindergarten entry laws (70% who enroll on time in 2006 and 24 in 2007). Two percent fall in the
“greenshirters” category.10 On average, these children who enroll “early” have kindergarten
experiences that are significantly different from “complier” children: 14 percent of “greenshirters”
are home schooled for kindergarten, 18 percent attend private schools, and 22 percent attend
transitional classrooms (i.e. transitional kindergarten, two-year kindergarten, pre-first grade, etc.).
The comparable figures among children who entered kindergarten the year they were age-eligible are
2, 11 and 2 percent, respectively.
We find that 4 percent of children redshirted in 2006, according to the ECLS-B data. This is
lower rate than reported in other studies (Datar, 2006b; Lincove & Painter, 2006; Stipek, 2002; Zill
et al., 1997). As a check on this estimate of the extent of redshirting, we estimate the percent of
redshirters in fall 1998 using the ECLS-K data and the 2006 October Supplement of the Current
Population Survey (CPS). Using ECLS-K data, we estimate that 5.5 percent of first time
kindergarteners are redshirters. The CPS data show that in October, 2006, the year that the ECLS-B
children turned five, 15 percent of six-year-olds were enrolled in kindergarten and an additional one
percent were attending preschool or pre-kindergarten. Some six-year olds in kindergarten in
October 2006 turned five after the 2005 kindergarten cutoff date in their state, however, and so
enrolled on time in kindergarten in 2006. For instance, a child born on October 1st, 2000, in a state
with a September 1st kindergarten cut-off, was not eligible for kindergarten until fall 2006, but would
have been 6 at the time of the CPS survey. Based on the cutoff dates reported in Table 1 above, we
estimate that eight percent of six year olds fall into this category,11,12 meaning that we would expect
to see eight percent of six year olds in kindergarten in October, based strictly on their states’ cut-off.
In addition, the CPS indicates that three percent of six-year-olds are repeating kindergarten, and so
should not considered redshirters, as they were five when they first entered kindergarten. Once we
Bassok - Redshirting in Kindergarten
15 CEPWC Working Paper Series No. 4. October 2012.
Available at http://curry.virginia.edu/research/centers/cepwc/publications. Curry School of Education | Frank Batten School of Leadership and Public Policy | University of Virginia
account for these kindergarten repeaters and the eight percent who are compliers, we are left with
approximately 5 percent of six-year-olds who should properly be classified as redshirters. This
figure is well-aligned with the evidence from the ECLS-B. Thus, all three of our sources suggest
that redshirting rates are between 4 and 5.5 percent.
Who Redshirts?
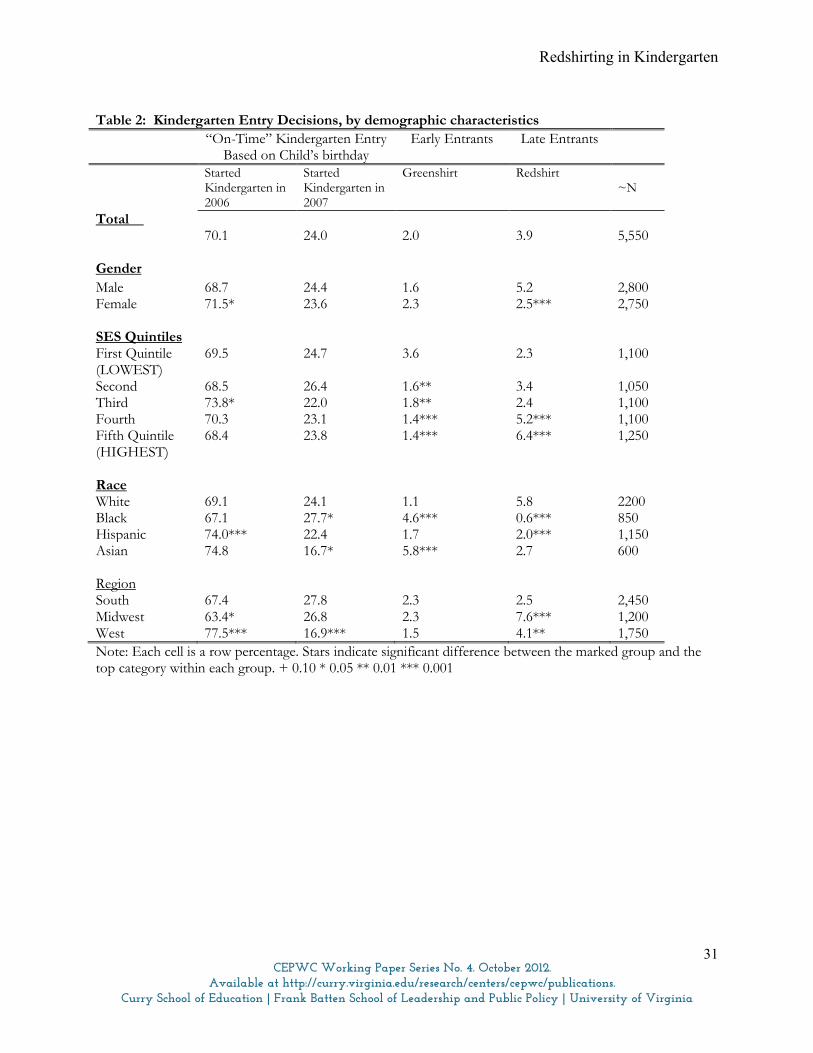
Redshirting and child demographics. The remainder of Table 2 highlights differences in
school entry patterns across groups. Redshirting is twice as likely among boys as it is among girls.
While 2.3 percent of children in the lowest SES quintile delay kindergarten entrance, the figure is 6.4
among children in the highest quintile. The differences across racial groups are particularly striking.
Nearly 6 percent of white children are classified as redshirters. In contrast, fewer than 1 percent of
black children delay entry. The figures for Hispanic and Asian children are only 2 and 2.7 percent,
respectively. The patterns for greenshirting, or early entrance, are largely the reverse. Low-SES
children and Black and Asian children are more likely than high-SES, white, and Hispanic children
to start kindergarten before they are legally eligible.
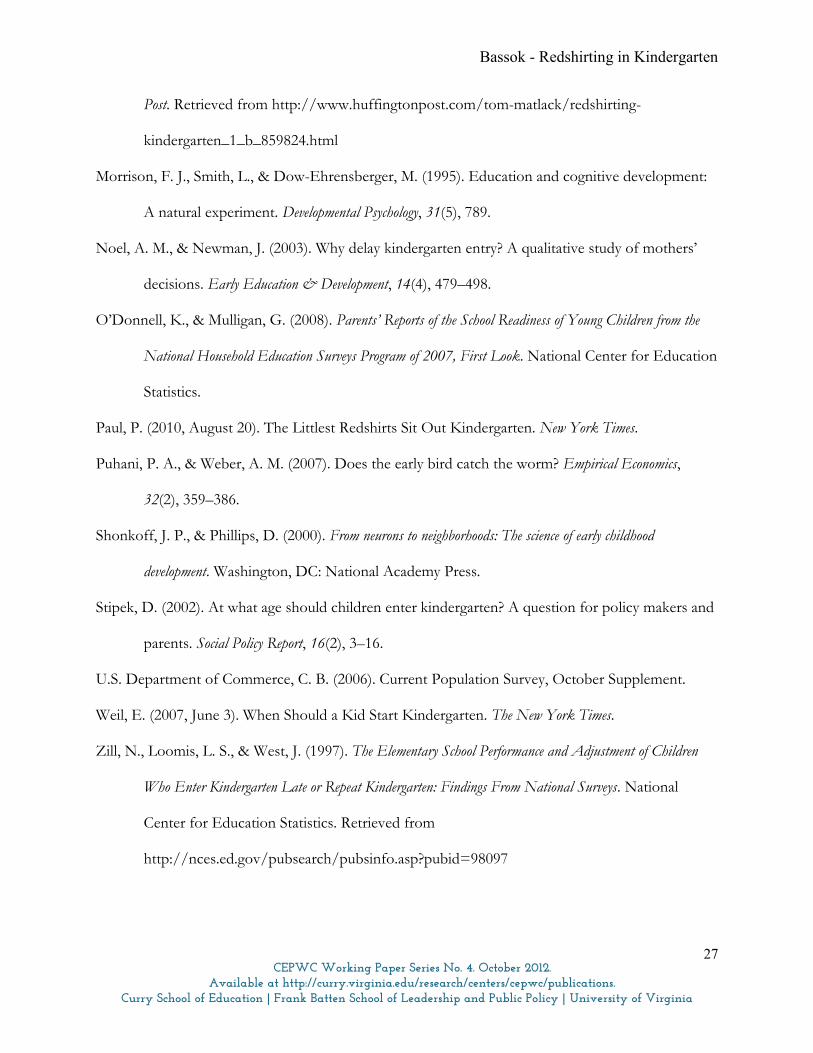
Figure 1 expands on these findings graphically. It shows the relationships between
kindergarten enrollment patterns and children’s age at the kindergarten cut-off date, based on the
logistic regression models. Nearly all children born 5 or more months before their state cut-off
enter kindergarten in 2006. The likelihood of starting kindergarten in 2006 drops rapidly for
children who are more proximate to the cut-off date and among children born in the month before
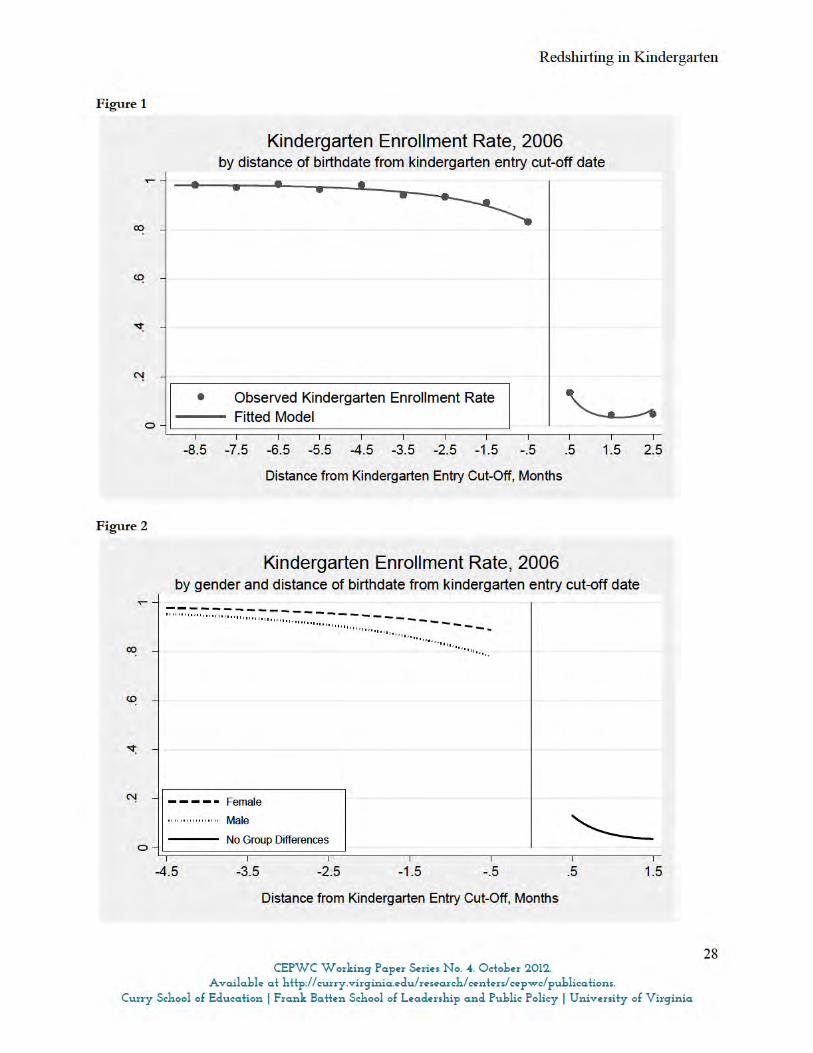
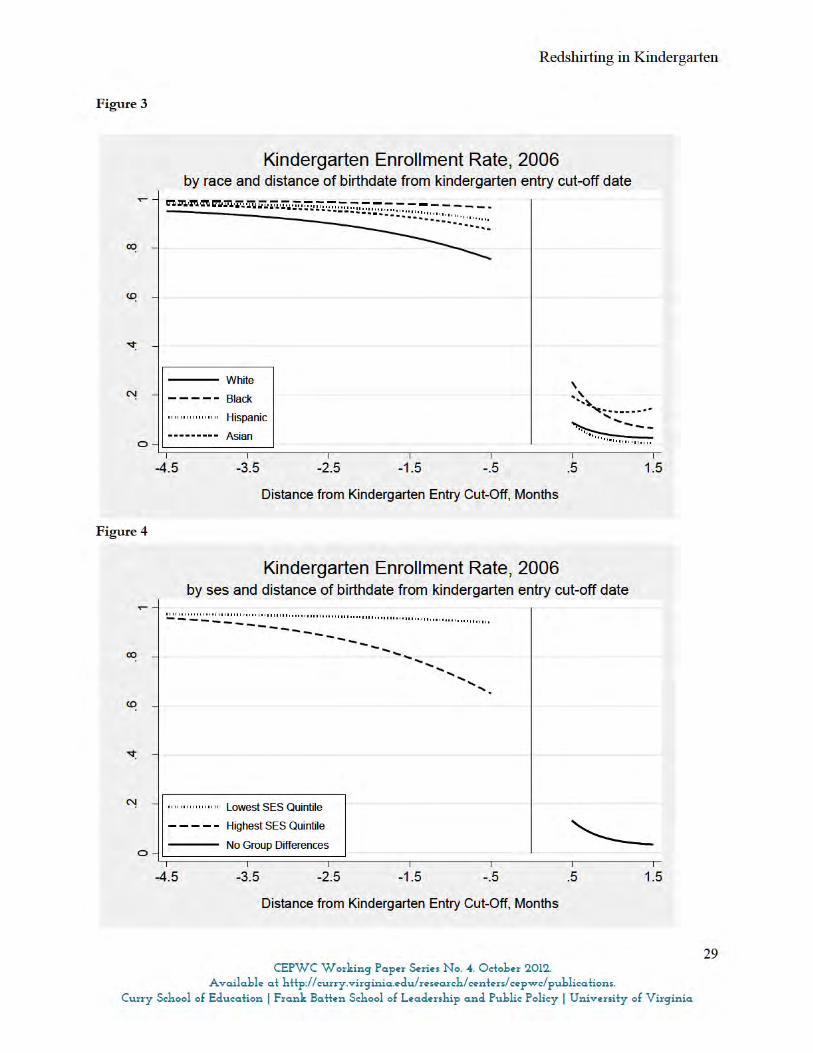
the cut-off, about 80 percent actually enroll “on time.” Figures 3-5 show the same information,
broken down by gender, race and SES. The gap in the likelihood of redshirting is most pronounced
for children with birthdays just before their state cut-offs, particularly between low and high SES
children.
Because the bulk of non-compliance behavior occurs in the months before and after the cut-
Bassok - Redshirting in Kindergarten
16 CEPWC Working Paper Series No. 4. October 2012.
Available at http://curry.virginia.edu/research/centers/cepwc/publications. Curry School of Education | Frank Batten School of Leadership and Public Policy | University of Virginia
off, we focus on children born within three months of their states’ cut-off for the regression
analyses examining the associations between child characteristics and redshirting behavior. The first
two columns of Table 3 show results from a series of linear probability models predicting
kindergarten entry in 2006.13 These models provide information about bivariate relationships
between child characteristics and kindergarten entrance behaviors. Each model is numbered, and the
results can be read horizontally. For instance, the first row shows the coefficients on “female” from
the two models predicting redshirting and greenshirting Among children who will turn 5 in the 3
months before their state’s kindergarten cut-off, boys are 6 percentage points more likely to redshirt.
Among those who turn five in the 3 months after the state cutoff, gender is not significantly
associated with early kindergarten entry. The associations between demographic characteristics and
kindergarten entrance are consistent with the patterns in Table 2.
In the lower panel we present results from models that examine whether kindergarten entry
decisions are also systematically related to measures of child development collected during the year
ECLS-B children turned four. We might expect that parents of children with lower social or
cognitive skills would be more likely to delay their child’s kindergarten entry, and similarly that
children with stronger social or cognitive skills would enter early. In general, we do not observe
these patterns. We find no relationship between redshirting or early entrance and children’s social
skills as measured by either their parents or their teachers. Similarly, there is no relationship between
entry behaviors and parents’ assessment of their children’s basic skills. We do observe a weak
association between entrance behaviors and children’s direct mathematics and reading assessment:
children with higher pre-literacy and –math scores are slightly more likely to redshirt than those with
lower scores, though this relationship is only marginally significant (p<.10).
Finally, children who had very low birth weights are more likely to delay kindergarten. In
additional models, not shown, we find no relationship between kindergarten entry timing and their
Bassok - Redshirting in Kindergarten
17 CEPWC Working Paper Series No. 4. October 2012.
Available at http://curry.virginia.edu/research/centers/cepwc/publications. Curry School of Education | Frank Batten School of Leadership and Public Policy | University of Virginia
age four height, weight, or body mass index. We therefore posit that the significant relationship
with low birth weight and kindergarten entrance may be capturing a host of developmental
outcomes rather than a simple measure of physical development. With the exception of very low
birth weight and the “counterintuitive” (and only marginally significant) mathematics and reading
results, our measures of child development are not significant predictors of redshirting or early
entrance.
Columns 3 and 4 report the coefficients from multivariate regression models that include all
the demographic and developmental variables within a single model. The gender, race, and
socioeconomic differences in redshirting persist mostly unchanged even in the multivariate models
controlling for developmental characteristics. The results remain largely unchanged if we also
account for family structure, poverty, and other family characteristics (results not shown). Once we
account for SES and other demographic covariates, children’s math and reading ability are no longer
related to their likelihood of starting kindergarten on time. We still observe that children with very
low birth weight are more likely to delay kindergarten, however, no other measures of child
development are related to the entry decision.14
Redshirting and school context. Next we explore whether there is local variation in
redshirting rates. Recall that in order to do this we must turn to an earlier (fall 1998) cohort of
kindergarteners. As noted above, we find that in 1998 approximately 5.5 percent of first-time
kindergarteners redshirted. There is a great deal of local variation in redshirting, including schools
with no redshirters and schools where over 25 percent of sampled children are classified as delayed
kindergarten entrants. As shown in Table 4, school-level racial and family-income composition are
strongly predictive of redshirting rates, with higher rates in schools serving greater proportions of
high-income and white students. For instance, as shown in Figure 5, in schools serving students
whose mean household income is $20,000, median redshirting rates were approximately 4 percent
Bassok - Redshirting in Kindergarten
18 CEPWC Working Paper Series No. 4. October 2012.
Available at http://curry.virginia.edu/research/centers/cepwc/publications. Curry School of Education | Frank Batten School of Leadership and Public Policy | University of Virginia
compared to a median redshirting rate of 7 percent in schools serving students with mean household
income of $100,000. One fifth of schools serving high-income students had redshirting rates of
15% or greater (if most redshirting students were born in the three months prior to the state cutoff
date, this implies that as many as 60% of those born within three months of the cutoff date were
redshirters). In additional analyses (available upon request) we find that within schools, individual
children’s family income is unassociated with redshirting, though racial differences in delayed school
kindergarten persist even within schools.
Implications for Aggregate Cohort Composition and Achievement Gaps
Our results so far highlight three key points. The first is that the overall rate of redshirting
in the United States is low (4-5%), lower than most prior estimates. Second, kindergarten entry
behaviors vary substantially across demographic groups, but we find no evidence that these gaps are
explained by developmental differences across children. Third, redshirting rates vary substantially
among schools, and vary strongly with school mean socioeconomic status. In this final results
section we discuss the implications of these findings for individual children, for national
achievement gaps, and for the within-school distribution of age and cognitive ability at school entry.
Implications for redshirters’ rankings. We start by estimating how redshirters’ relative
standing at school entry within a national kindergarten cohort would differ had they entered
kindergarten when they were first age eligible. By definition, redshirting will have a substantial
impact on a child’s relative age in a cohort. As shown in Table 5, on average if redshirting children
entered kindergarten when eligible, they would typically rank at the 24th percentile of the age
distribution in their cohort. By waiting a year, their age “rank” rises, on average, to the 96th
percentile. Our analysis explores the extent to which such shifts also occur for other developmental
outcomes, measured at kindergarten entry. On average, children who redshirt would be in the 40th
percentile of pre-literacy skills, had they started school in the fall of 2006 when they were first

Bassok - Redshirting in Kindergarten
19 CEPWC Working Paper Series No. 4. October 2012.
Available at http://curry.virginia.edu/research/centers/cepwc/publications. Curry School of Education | Frank Batten School of Leadership and Public Policy | University of Virginia
eligible.15 We estimate that by 2007, when they actually enter school, their rank rises more than 20
percentile points, to the 63rd percentile. Similar patterns hold for their math scores as well as their
physical development.
The table shows that postponing kindergarten by a year makes a substantial difference in a
redshirting child’s relative position relative to his or her cohort peers. It is worth noting that the
redshirters’ performance at age 5 would not place them, on average, at the bottom end of the
national distribution for any of the developmental outcomes. In fact, had they entered “on time”
these children would typically be between the 39th and 48th percentile with respect to literacy, math,
height and weight. This suggests that by delaying kindergarten these children may be contributing to
an expansion of the skill distribution in the national kindergarten cohort.
Implications for national achievement gaps. For the remainder of this section we turn to
these aggregate, rather than individual, implications of redshirting. Recall that the structure of the
ECLS-B allows us to accurately simulate a scenario in which all would-be redshirters enroll in
kindergarten when first eligible, and compare the distribution of developmental outcomes at school
entry in this scenario to the observed distribution in our synthetic kindergarten cohort. Our earlier
findings show that white, wealthy and male children are much more likely to redshirt than their
minority, poor or female peers. They are therefore systematically older at kindergarten entry, and in
turn are also systematically older whenever they take achievement tests that are used to measure
achievement gaps. Black and Asian students also “greenshirt” which further broadens the age gaps
between children by race. These patterns may lead mechanically to a widening of the measured
achievement gaps among children when they enter kindergarten.
In Table 6 we present results from OLS regressions estimating math and reading Z-scores
(M=0, SD=1) on race, gender and SES separately. We run these models in two different ways. First
we use children’s cognitive scores at kindergarten entry. These models approximate the
Bassok - Redshirting in Kindergarten
20 CEPWC Working Paper Series No. 4. October 2012.
Available at http://curry.virginia.edu/research/centers/cepwc/publications. Curry School of Education | Frank Batten School of Leadership and Public Policy | University of Virginia
achievement gap (in standard deviation units) among a kindergarten cohort, accounting for state
fixed effects. We then run the same models but assign the redshirters their fall 2006 outcomes.
The first column shows the substantial gaps in math ability among the synthetic kindergarten
entry cohort. Black children perform more than half of a standard deviation lower on this
assessment than white children, and Hispanic children are doing even worse. Asian students appear
to perform somewhat better than their white peers, and girls slightly outperform boys, although
these patterns are not statistically significant. The largest gaps are evident for socioeconomic status.
Children in the lowest SES quintile score more than a standard deviation below those in the highest
SES quintile. The gaps in reading (shown in the third column) follow similar overall trends, and
here the patterns are significant for both Asians and girls.
Columns two shows the math achievement gap when we assign the redshirters their 2006
rather than 2007 score. As expected, in nearly all cases, the groups of children who are most likely
to redshirt (i.e. whites, males and high-SES children) decrease their relative advantage compared to
other children under this scenario. Racial gaps between white children and black and Hispanic
children narrow in the “no red shirting” scenario, as do SES gaps. In addition, the extent to which
Asian children and girls outperformed their white and male peers increases in the no redshirting
scenario. That said, the magnitude of the differences between the models is very small. Because
relatively few children delay kindergarten, redshirting does not meaningfully exacerbate national
achievement gaps as measured in kindergarten.
Implications for the within-school distribution of developmental measures at school entry. A
second way we hypothesize delayed school entry may influence aggregate achievement is by inducing
a change in within school peer composition. Although at the national level redshirting does not
appear to be prevalent enough to induce meaningful differences in cohort composition, it is possible
that in schools where redshirting is common, the practice meaningfully alters children’s peer groups
Bassok - Redshirting in Kindergarten
21 CEPWC Working Paper Series No. 4. October 2012.
Available at http://curry.virginia.edu/research/centers/cepwc/publications. Curry School of Education | Frank Batten School of Leadership and Public Policy | University of Virginia
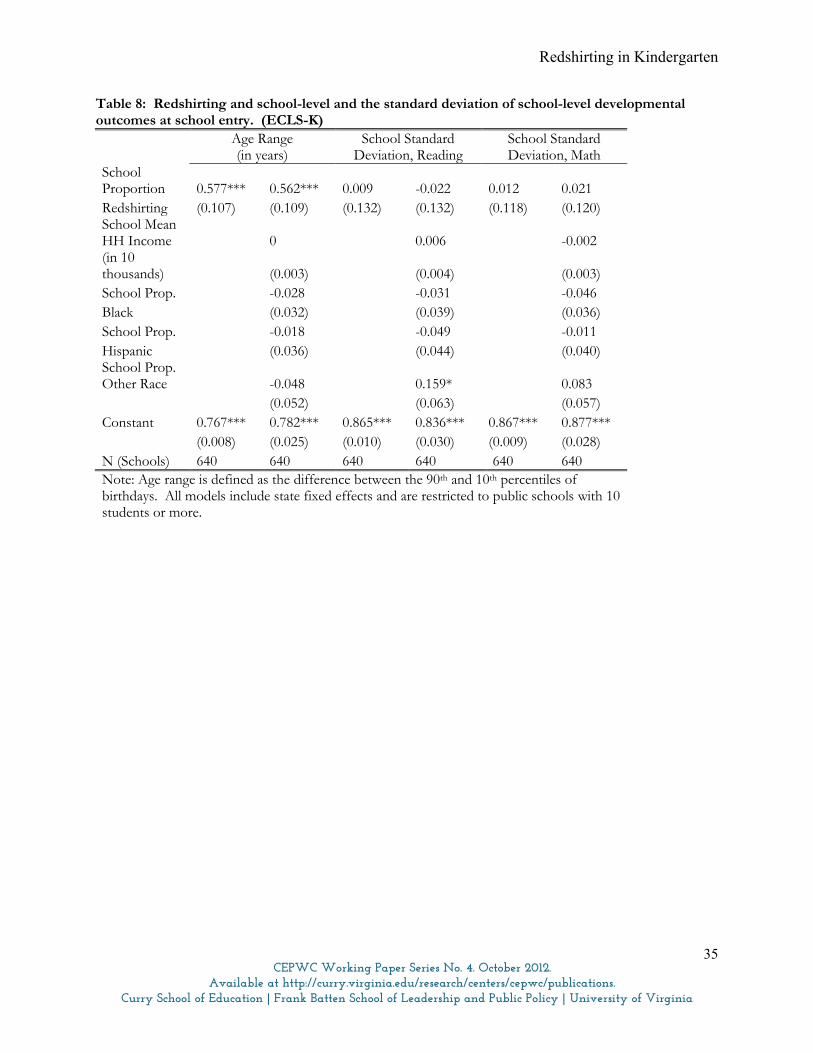
and learning experiences. Using data from the ECLS-K, presented in Table 7, we find that
redshirting substantially expands the age distribution of kindergarteners within a school: a 10
percentage point increase in the proportion of redshirters widens the 90th/10th percentile age range
within a school by 0.06 years. Somewhat surprisingly however, we find no evidence of an
association between within-school redshirting patterns and the distribution of cognitive measures
assessed at school entry. Our point estimates suggest that a 10 percentage point difference in the
redshirting rate is associated with a roughly 0.001 difference in the within-school reading standard
deviation of math or reading scores—a trivial, and statistically insignificant, association. Because
these estimates are based on cross-sectional associations, however, they should not be interpreted as
conclusive evidence that redshirting has no effect of the variation of test scores within a classroom.
Discussion
Our investigation of delayed kindergarten entrance adds to the literature on school entry in
several ways. First we leverage a large, nationally-representative dataset to provide a detailed
exploration of families' decisions to delay kindergarten entry. Unlike previous studies that only
observe children once they enter kindergarten or later in life, our study makes use of data on a full
age-cohort of five year olds, some of whom do and do not enter kindergarten in 2006. In addition,
we have access to parent, care-giver and direct assessments of children’s development prior to age
five, so we can carefully examine whether parents decisions about kindergarten entry are related to
observable measures of child development.
Our findings show that nationwide approximately 4 to 5.5 percent of children delay
kindergarten, a lower rate than previously reported. We demonstrate that the likelihood of
redshirting is much higher among children whose birthday falls in the months before the cut-off and
that redshirting varies substantially across gender, race and SES. Very poor and black families rarely
delay kindergarten entry despite the fact that these families are more likely to indicate concerns

Bassok - Redshirting in Kindergarten
22 CEPWC Working Paper Series No. 4. October 2012.
Available at http://curry.virginia.edu/research/centers/cepwc/publications. Curry School of Education | Frank Batten School of Leadership and Public Policy | University of Virginia
about their children’s school readiness. The findings are consistent with our initial hypothesis that
low-income families may view redshirting as prohibitively expensive. Giannarelli and Barsimantov
(2000) report that, on average, low-income families spend 16 percent of their earnings on child-care.
Within this context, the patterns we observe are not surprising.
We also examine whether rates of redshirting, as well as the gaps in these rates across
groups, are explained in part by observable measures of child development including parent and
teacher reports and direct assessments. We find little evidence that this is the case. In fact, children
who redshirt tend to perform better during pre-kindergarten than many of their similarly-aged
complier peers, although these differences are eliminated if we account for SES. The absence of a
relationship between nearly all of the developmental measures and the likelihood of delayed
kindergarten entry suggests parents’ decisions to red-shirt may be driven more by concerns about
their child’s relative age or relative physical development in their classroom than their actual
cognitive or behavioral development. The evidence on the impact of relative age on student
learning trajectories is mixed, and recent research (Black et al., 2008; Deming & Dynarski, 2008;
Dobkin & Ferreira, 2010) suggests benefits from delayed school admission may be counteracted by
losses associated with one less year in the labor force. Still, parents’ desire to give their child an edge
in what they perceive as a competitive environment may make it appealing for those who can afford
it to give their child the “gift of time.”(Gesell, 1940)
Given the differences in redshirting practices across groups, it seems plausible that
redshirting would lead, mechanically, to exacerbated national achievement gaps. Our own results
suggest that while redshirting substantially impacts an individual child’s initial standing within a
kindergarten cohort, it does not meaningfully widen achievement gaps. This is because, at the
national level, the incidence of redshirting is low enough that its impact is not large. This should not
necessarily be interpreted to mean that redshirting bestows benefits for selected individuals without
Bassok - Redshirting in Kindergarten
23 CEPWC Working Paper Series No. 4. October 2012.
Available at http://curry.virginia.edu/research/centers/cepwc/publications. Curry School of Education | Frank Batten School of Leadership and Public Policy | University of Virginia
causing any negative repercussions for the group. Our work shows that differential redshirting
patterns systematically cause white, high SES, boys to be older relative to their peers. To the extent
that relative age affects learning experiences within a classroom, poor, black and Hispanic children
may be negatively impacted by redshirting. Unfortunately, we cannot test that hypothesis with our
data.
Even if redshirting does not meaningfully alter national achievement it is plausible that it has
meaningful implications for learning experiences as well as achievement in certain communities
where redshirting levels are high. A child’s position within their own classroom or school will likely
have a greater effect on their early development than their relative standing among a national
sample. The ECLS-K data allowed us to measure, first, to what extent redshirting rates vary locally,
and second whether within school redshirting rates are related to changes in the composition of
kindergarten cohorts. We find that indeed, redshirting rates vary substantially between schools and
that the racial and socio-economic composition of schools is strongly related to redshirting. In
future work it would be worthwhile to explore how school-level redshirting norms are formed, and
to what extent kindergarten teachers (or preschool teachs in the communities surrounding these
schools) transmit these normas to parents through their advice about school entry timing.
Finally, we find a strong relationship between schools’ redshirting rates and the range of ages
among the kindergarteners within a school, which in turn could translate to meaningful differences
in learning experiences. Unfortunately, we do not have data that allows us to explore that
hypothesis. We do show, however, that at the school level, redshirting is not related to meaningful
differences in the distribution of cognitive assessment scores at school entry. These admittedly
crude results show that even at the school level, redshirting is not associate with meaningful changes
in cohort composition, at least with respect to the assessment scores we considered. Taken together
then, the findings suggest that the policy implications of current redshirting practices are more

Bassok - Redshirting in Kindergarten
24 CEPWC Working Paper Series No. 4. October 2012.
Available at http://curry.virginia.edu/research/centers/cepwc/publications. Curry School of Education | Frank Batten School of Leadership and Public Policy | University of Virginia
limited than media reports suggest.
It is worth noting that our study, and particularly the within-school analysis, does suffer
from several data limitations. In particular, the within-school analysis does not measure the effect of
redshirting on school level composition. Unlike the ECLS-B, which allows us to observe redshirters
both in the year they were eligible for kindergarten and the year they enrolled, in the ECLS-K we
observe a single snapshot of a kindergarten cohort. This means that although we can measure the
association between schools’ redshirting rates and various characteristics of their incoming
kindergarten cohorts, we have no way to compare that to a counterfactual scenario in which
redshirters started on time. Further, the children in the ECLS-K started kindergarten nearly 15 years
ago, in a period that preceded large state preschool expansions as well as No Child Left Behind.
While our analysis provides a detailed account of which types of children redshirt in more recent
years, it is difficult to know whether similar patterns existed in 1998. Soon-to-be-released ECLS
data from the 2010 will allow researchers to assess changes over time in within-school patterns of
redshirting.
Bibliography
Barnett, W. S., Epstein, D. J., Friedman, A. H., Sansanelli, R., & Hustedt, J. T. (2009). The State of
Preschool, 2009. National Institute for Early Education Research.
Bazelon, E. (2008, August 1). The Downside of Redshirting: The trouble with older kindergarten.
Slate. Retrieved from http://www.slate.com/id/2196423/
Bedard, K., & Dhuey, E. (2006). The Persistence of Early Childhood Maturity: International
Evidence of Long-Run Age Effects*. The Quarterly Journal of Economics, 121(4), 1437–1472.
Black, S. E., Devereux, P. J., & Salvanes, K. G. (2008). Too young to leave the nest: The effects of
school starting age. NBER working paper.

Bassok - Redshirting in Kindergarten
25 CEPWC Working Paper Series No. 4. October 2012.
Available at http://curry.virginia.edu/research/centers/cepwc/publications. Curry School of Education | Frank Batten School of Leadership and Public Policy | University of Virginia
Byrd, R. S., Weitzman, M., & Auinger, P. (1997). Increased Behavior Problems Associated With
Delayed School Entry and Delayed School Progress. Pediatrics, 100(4), 654–661.
doi:10.1542/peds.100.4.654
Cosden, M., Zimmer, J., & Tuss, P. (1993). The Impact of Age, Sex, and Ethnicity on Kindergarten
Entry and Retention Decisions. Educational Evaluation and Policy Analysis, 15(2), 209–222.
Cuban, L. (1992). Why some reforms last: The case of the kindergarten. American Journal of Education,
100(2), 166–194.
Datar, A. (2006a). The impact of kindergarten entrance age policies on the childcare needs of
families. Journal of Policy Analysis and Management, 25(1), 129–153.
Datar, A. (2006b). Does delaying kindergarten entrance give children a head start? Economics of
Education Review, 25(1), 43–62.
Deming, D., & Dynarski, S. (2008). The lengthening of childhood. Journal of Economic Perspectives,
22(3), 71–92.
Dhuey, E., & Lipscomb, S. (2008). What makes a leader? Relative age and high school leadership.
Economics of Education Review, 27(2), 173–183.
Dobkin, C., & Ferreira, F. V. (2010). Do school entry laws affect educational attainment and labor
market outcomes? Economics of Education Review, 29(1), 40–54.
Elder, T. E. (2010). The Importance of Relative Standards in ADHD Diagnoses: Evidence Based on
Exact Birth Dates. Journal of Health Economics, 29(5), 641–656.
Evans, W. N., Morrill, M. S., & Parente, S. T. (2010). Measuring Inappropriate Medical Diagnosis
and Treatment in Survey Data: The Case of ADHD among School-Age Children. Journal of
Health Economics, 29(5), 657–673.

Bassok - Redshirting in Kindergarten
26 CEPWC Working Paper Series No. 4. October 2012.
Available at http://curry.virginia.edu/research/centers/cepwc/publications. Curry School of Education | Frank Batten School of Leadership and Public Policy | University of Virginia
Fredriksson, P., & Ockert, B. (2005). Is early learning really more productive? the effect of school
starting age on school and labor market performance. Institute for the Study of Labor, Discussion
Paper Series.
Frey, N. (2005). Retention, social promotion, and academic redshirting. Remedial and Special Education,
26(6), 332.
Gesell, A. (1940). The first five years of life: a guide to the study of the preschool child, from the Yale clinic of child
development. New York: Harper & Bros. Retrieved from
http://www.getcited.org/pub/101170878
Giannarelli, L., & Barsimantov, J. (2000). Child care expenses of America’s families. Assessing the New
Federalism. Urban Institute.
Graue, M. E., & DiPerna, J. (2000). Redshirting and Early Retention: Who Gets the“ Gift of Time”
and What Are Its Outcomes? American Educational Research Journal, 509–534.
Graue, M. E., Kroeger, J., & Brown, C. (2002). Living the’gift of time’. Contemporary Issues in Early
Childhood, 3(3), 338–353.
Jacob, B. A. (2005). Accountability, incentives and behavior: The impact of high-stakes testing in the
Chicago Public Schools. Journal of Public Economics, 89(5-6), 761–796.
Jurges, H., & Schneider, K. (2007). What can go wrong will go wrong: birthday effects and early
tracking in the German school system. CESIFO Working Paper.
Lincove, J. A., & Painter, G. (2006). Does the age that children start kindergarten matter? Evidence
of long-term educational and social outcomes. Educational Evaluation and Policy Analysis, 28(2),
153.
Matlack, T. (2011, May 15). Redshirting Kindergarten: Why are so many parents holding their boys
back? Is it really good for them? And what impact is it having on everybody else? Huffington
Bassok - Redshirting in Kindergarten
27 CEPWC Working Paper Series No. 4. October 2012.
Available at http://curry.virginia.edu/research/centers/cepwc/publications. Curry School of Education | Frank Batten School of Leadership and Public Policy | University of Virginia
Post. Retrieved from http://www.huffingtonpost.com/tom-matlack/redshirting-
kindergarten_1_b_859824.html
Morrison, F. J., Smith, L., & Dow-Ehrensberger, M. (1995). Education and cognitive development:
A natural experiment. Developmental Psychology, 31(5), 789.
Noel, A. M., & Newman, J. (2003). Why delay kindergarten entry? A qualitative study of mothers’
decisions. Early Education & Development, 14(4), 479–498.
O’Donnell, K., & Mulligan, G. (2008). Parents’ Reports of the School Readiness of Young Children from the
National Household Education Surveys Program of 2007, First Look. National Center for Education
Statistics.
Paul, P. (2010, August 20). The Littlest Redshirts Sit Out Kindergarten. New York Times.
Puhani, P. A., & Weber, A. M. (2007). Does the early bird catch the worm? Empirical Economics,
32(2), 359–386.
Shonkoff, J. P., & Phillips, D. (2000). From neurons to neighborhoods: The science of early childhood
development. Washington, DC: National Academy Press.
Stipek, D. (2002). At what age should children enter kindergarten? A question for policy makers and
parents. Social Policy Report, 16(2), 3–16.
U.S. Department of Commerce, C. B. (2006). Current Population Survey, October Supplement.
Weil, E. (2007, June 3). When Should a Kid Start Kindergarten. The New York Times.
Zill, N., Loomis, L. S., & West, J. (1997). The Elementary School Performance and Adjustment of Children
Who Enter Kindergarten Late or Repeat Kindergarten: Findings From National Surveys. National
Center for Education Statistics. Retrieved from
http://nces.ed.gov/pubsearch/pubsinfo.asp?pubid=98097

Redshirting in Kindergarten
30 CEPWC Working Paper Series No. 4. October 2012.
Available at http://curry.virginia.edu/research/centers/cepwc/publications. Curry School of Education | Frank Batten School of Leadership and Public Policy | University of Virginia
Figure 5
Table 1: State cut-offs for kindergarten entry, 2005
Cut-Off State
July 1 IN Aug 1 HI Aug 15 AK Aug 31 DE, KS, WA Sept 1 AL, AZ, FL, GA, ID, IL, MD, MN, MS, ND, NM, OK, OR, RI, SC, SD, TX,
WI, WV Sept 2 UT Sept 10 MT Sept 15 AR, IA, WY Sept 30 LA, NV, TN, VA Oct 1 KY Oct 15 ME, NE Oct 16 NC Dec 1 MI Dec 2 CA Dec 31 DC Jan 1 CT No State Cut-Off CO, MA, MO, NH, NJ, NY, OH, PA, VT
Source: Education Commission of the States, http://www.ecs.org/clearinghouse/58/28/5828.pdf
Redshirting in Kindergarten
31 CEPWC Working Paper Series No. 4. October 2012.
Available at http://curry.virginia.edu/research/centers/cepwc/publications. Curry School of Education | Frank Batten School of Leadership and Public Policy | University of Virginia
Table 2: Kindergarten Entry Decisions, by demographic characteristics
“On-Time” Kindergarten Entry Based on Child’s birthday
Early Entrants Late Entrants
Started Kindergarten in 2006
Started Kindergarten in 2007
Greenshirt Redshirt ~N
Total
70.1 24.0 2.0 3.9 5,550
Gender
Male 68.7 24.4 1.6 5.2 2,800 Female 71.5* 23.6 2.3 2.5*** 2,750 SES Quintiles First Quintile (LOWEST)
69.5 24.7 3.6 2.3 1,100
Second 68.5 26.4 1.6** 3.4 1,050 Third 73.8* 22.0 1.8** 2.4 1,100 Fourth 70.3 23.1 1.4*** 5.2*** 1,100 Fifth Quintile (HIGHEST)
68.4 23.8 1.4*** 6.4*** 1,250
Race White 69.1 24.1 1.1 5.8 2200 Black 67.1 27.7* 4.6*** 0.6*** 850 Hispanic 74.0*** 22.4 1.7 2.0*** 1,150 Asian 74.8 16.7* 5.8*** 2.7 600 Region South 67.4 27.8 2.3 2.5 2,450 Midwest 63.4* 26.8 2.3 7.6*** 1,200 West 77.5*** 16.9*** 1.5 4.1** 1,750
Note: Each cell is a row percentage. Stars indicate significant difference between the marked group and the top category within each group. + 0.10 * 0.05 ** 0.01 *** 0.001

Redshirting in Kindergarten
32 CEPWC Working Paper Series No. 4. October 2012.
Available at http://curry.virginia.edu/research/centers/cepwc/publications. Curry School of Education | Frank Batten School of Leadership and Public Policy | University of Virginia
Table 3: Differences in the likelihood of starting kindergarten in 2006, by demographic and developmental characteristics
Bivariate Models Multivariate Models
Model # Redshirt Greenshirt Redshirt Greenshirt
Female 1 -0.060* 0.032 -0.057* 0.040+
(0.026) (0.024) (0.026) (0.023)
Black 2 -0.136*** 0.091* -0.096*** 0.090*
(0.026) (0.041) (0.023) (0.044)
Hispanic
-0.129*** -0.017 -0.108*** -0.024
(0.028) (0.024) (0.032) (0.022)
Asian
-0.114** 0.175** -0.132** 0.220**
(0.037) (0.068) (0.044) (0.076)
p(F-Test)
.000 .004 .000 .001
SES 3 0.069*** -0.010 0.058* -0.013
(0.018) (0.014) (0.023) (0.016)
Midwest 4 0.069 0.067+ 0.010 0.049
(0.044) (0.037) (0.046) (0.035)
South
-0.059+ 0.040 -0.063+ 0.028
(0.030) (0.027) (0.035) (0.025)
p(F-Test)
.001 .164 .048 .347
Social Skills 5 -0.020 -0.010 -0.007 -0.013 (Parents)
(0.015) (0.011) (0.015) (0.012)
Social Skills 6 -0.006 0.002 -- -- (Teacher)
(0.019) (0.010)
Basic Skills 7 0.009 0.006 -0.008 0.019
(Parent)
(0.013) (0.016) (0.018) (0.016)
Math 8 0.026+ 0.018+ 0.004 0.015
(0.014) (0.010) (0.022) (0.015)
Reading 9 0.024+ 0.011 -0.009 0.001
(0.013) (0.013) (0.018) (0.023)
Low Birth 10 -0.035 0.025 -0.003 0.045 Wgt
(0.026) (0.032) (0.027) (0.033)
V. Low Birth
0.084* -0.006 0.123** -0.024 Wgt.
(0.041) (0.031) (0.040) (0.028)
p(F-Test)
.027 .698 .007 .205
Note: + 0.10 * 0.05 ** 0.01 *** 0.001; Results shown in columns 1 and 2 are from 10 separate regression models (linear probability models). The first column shows the coefficient from the model predicting redshirting based on all those born within the three months prior to their state’s cutoff date. The second shows the coefficient on the covariate from the model predicting greenshirting based on all those born within the three months after to their state’s cutoff date. Each model includes a variable indicating the number of months between the child’s birthday and the cut-off date. Excluded groups, by model, are: males, white children, none, and western states. The race model includes children who are multiple and other races, but due to small sample sizes, these groups are not shown. For similar reasons, results for the Northeastern region are not shown. Columns 3 and 4 show results from multivariate models. The teacher reported measure of social skills is excluded from these models because it is only available for children who experienced non-relative care at age four, and therefore leads to a substantial drop in sample size. However, models which include this variable provide very similar results. All analyses are weighted.

Redshirting in Kindergarten
33 CEPWC Working Paper Series No. 4. October 2012.
Available at http://curry.virginia.edu/research/centers/cepwc/publications. Curry School of Education | Frank Batten School of Leadership and Public Policy | University of Virginia
Table 4: School-level predictors of redshirting practices, 1998 Kindergarten Cohort (ECLS-K)
1 2 3
Intercept -3.273 *** -3.285 *** -3.290 ***
(0.062)
(0.063)
(0.063) School Mean HH Income 0.071 **
0.047 +
(in 10 thousands) (0.022)
(0.027) School Proportion Black
-0.477
-0.232
(0.297)
(0.330) School Proportion Hispanic
-1.258 *** -0.951 *
(0.360)
(0.401) School Proportion Other Race
-1.216 + -1.219 +
(0.626)
(0.630)
Between-School Variance of Intercepts 0.966
0.963
0.962 Number of Students 12100
12100
12100
Number of Schools 685 685 685
Note: Sample restricted to public schools. Table 5: Redshirting and relative position: Redshirters’ observed and counterfactual percentile ranks in synthetic kindergarten entry cohort, by developmental outcome
Literacy Math Height Weight Age
Avg. observed percentile rank of redshirters:
62.8 66.5 68.5 57.8 95.6
(29.4) (30.4) (26.1) (24.6) (5.1)
Avg. counterfactual percentile rank of redshirters had they entered school in 2006:
40.6 47.8 41.0 38.9 24.0
(32.3) (31.5) (29.3) (24.4) (18.7)
Note: Row 1 shows the observed percentile ranking of redshirters within the synthetic kindergarten entry cohort. Row 2 shows their percentile in the hypothetical case in which they entered kindergarten when they were first eligible.

Redshirting in Kindergarten
34 CEPWC Working Paper Series No. 4. October 2012.
Available at http://curry.virginia.edu/research/centers/cepwc/publications. Curry School of Education | Frank Batten School of Leadership and Public Policy | University of Virginia
Table 7: Achievement gaps at Kindergarten entry, with and without Redshirting
Math Reading
Synthetic kindergarten cohort (observed)
Hypothetical kindergarten cohort with no redshirting
Synthetic kindergarten cohort (observed)
Hypothetical kindergarten cohort with no redshirting
Race Black -0.599*** -0.567*** -0.391*** -0.365*** (0.054) (0.054) (0.052) (0.052) Hispanic -0.758*** -0.740*** -0.640*** -0.624*** (0.050) (0.049) (0.053) (0.053) Asian 0.108 0.132+ 0.262*** 0.286*** (0.067) (0.068) (0.066) (0.068) Gender Female 0.025 0.050 0.113** 0.135*** (0.039) (0.039) (0.039) (0.039) SES SES Q1 -1.237*** -1.202*** -1.251*** -1.235*** (0.057) (0.056) (0.060) (0.060) SES Q2 -0.941*** -0.917*** -0.886*** -0.869*** (0.057) (0.057) (0.057) (0.057) SES Q3 -0.668*** -0.635*** -0.648*** -0.625*** (0.056) (0.055) (0.054) (0.053) SES Q4 -0.468*** -0.461*** -0.467*** -0.472*** -1.237*** -1.202*** (0.055) (0.055) N 5200 5200 5200 5200
Note: + 0.10 * 0.05 ** 0.01 *** 0.001; Columns 1 & 3 show results for the synthetic kindergarten entry cohort. Column 2 & 4 show similar results except that all redshirting students are assigned their test score at age 5 to simulate a scenario where all redshirters begin school when they are legally eligible. Excluded groups, by model, are: white children , males, and children whose family place in highest SES quintile. The race model includes children who are multiple and other races, but due to small sample sizes, these groups are not shown. All analyses are weighted and (as per NCES requirements) sample sizes are rounded to the nearest 50. Models are adjusted for month of assessment and sampling weights.
Redshirting in Kindergarten
35 CEPWC Working Paper Series No. 4. October 2012.
Available at http://curry.virginia.edu/research/centers/cepwc/publications. Curry School of Education | Frank Batten School of Leadership and Public Policy | University of Virginia
Table 8: Redshirting and school-level and the standard deviation of school-level developmental outcomes at school entry. (ECLS-K)
Age Range (in years)
School Standard Deviation, Reading
School Standard Deviation, Math
School Proportion 0.577*** 0.562*** 0.009 -0.022 0.012 0.021
Redshirting (0.107) (0.109) (0.132) (0.132) (0.118) (0.120) School Mean HH Income 0 0.006 -0.002 (in 10 thousands)
(0.003)
(0.004)
(0.003)
School Prop.
-0.028
-0.031
-0.046
Black
(0.032)
(0.039)
(0.036)
School Prop.
-0.018
-0.049
-0.011
Hispanic
(0.036)
(0.044)
(0.040) School Prop. Other Race
-0.048
0.159*
0.083
(0.052)
(0.063)
(0.057)
Constant 0.767*** 0.782*** 0.865*** 0.836*** 0.867*** 0.877***
(0.008) (0.025) (0.010) (0.030) (0.009) (0.028)
N (Schools) 640 640 640 640 640 640
Note: Age range is defined as the difference between the 90th and 10th percentiles of birthdays. All models include state fixed effects and are restricted to public schools with 10 students or more.
Redshirting in Kindergarten
36 CEPWC Working Paper Series No. 4. October 2012.
Available at http://curry.virginia.edu/research/centers/cepwc/publications. Curry School of Education | Frank Batten School of Leadership and Public Policy | University of Virginia
1 Note that redshirting need not lead to an expansion of the age distribution. For instance, if all children in the bottom 10 percent of the age distribution redshirted, it would make the median age in the cohort older, but would not change the width of the age range. 2 We adjust these measures to take into account differences in the timing of when students were assessed, though because most students were assessed within a three-month span and because assessment month is largely uncorrelated with the included covariates, the adjustments for assessment date make little difference in our results. 3 The sample for the bulk of our analysis includes approximately 5,300 children. This drop in sample size from the Wave 1 sample size of nearly 10,700 stems primarily from attrition over time. Approximately 6,550 children have data available at kindergarten entry as well as cognitive scores from Wave 3. We lose about 1,250 additional children by dropping children residing in states without a set kindergarten entry law in 2005. 4 Note that in all models that include Wave 4 developmental outcomes we control for month of assessment, although doing so does not impact our results as redshirting status and assessment month are uncorrelated. Models controlling for age of assessment also yield nearly identical results. 5 Because not all children have a regular non-parental care arrangement at Wave 3, this provider-reported measure of social development is only available for a subsample of the data (~3,350 children). 6 For students living in a state that allows districts to determine cut-off dates, we use the kindergarten cut-off as reported by the school principal. If this data is unavailable, we classify children based on parent reports of delayed school entry. 7 In practice, our definition of “kindergarten entry” in 2006 includes all children who were enrolled in kindergarten or higher, including children enrolled in traditional kindergarten programs, children who skip kindergarten and start school in first grade, children who start homeschooling in 2006, etc. 8 Recall that the ECLS-B provides information on each child’s month of birth but not on their day of birth. Ideally, we would like to know each child’s actual day of birth to precisely calculate the distance between their exact age and their state’s kindergarten cut-off. Instead, we assign each child a birth date at the middle date of the month in which they were born. We then calculate the difference between the assigned birth date and the state cutoff date (in months). In states where the state cut-off is in the middle of the month, we drop children who were born during the cut-off month. For example, in North Carolina the kindergarten cut-off date is October 16th. We drop children from North Carolina born in October, because we cannot distinguish whether their birth date put them just below or just above their state cut-off. 9 Unfortunately, the ECLS-B does not have the data to assign early entrants a 2007 score in order to estimate how their outcomes would have differed had they not “greenshirted.” However, the number of greenshirters is very small so is unlikely to affect our results substantially. 10 Note that at Wave 3 when the children were age four, approximately 2 percent of parents indicated that their children were already enrolled in Kindergarten. The bulk of these children (70 percent) were born in the first half of 2001, with 15 percent born in January. Despite this, at Wave 4, nearly all these children (86 percent) are coded as first time kindergarteners and only 5 children are coded as first graders. 11 Calculations are available from authors upon request.

Redshirting in Kindergarten
37 CEPWC Working Paper Series No. 4. October 2012.
Available at http://curry.virginia.edu/research/centers/cepwc/publications. Curry School of Education | Frank Batten School of Leadership and Public Policy | University of Virginia
12 We exclude states without a state cut-off from this calculation. In those states, approximately 14 percent of six year olds are enrolled in kindergarten or preschool. 13 We present findings from OLS regressions for ease of interpretation. Findings from logit models are quite similar. Results are also robust to narrowing and expanding the distance from the cut-off. 14 None of the multivariate results are sensitive to changes in model specification. For instance, it may be the case that the likelihood of redshirting (or early entrance) also differs depending on when the cut-off occurs. Accounting for cut-off month does not influence our estimates, however. We also run models that include state fixed effects. Estimates from these models describe within-state associations between child characteristics and entry practices. Including the fixed effects ensures that our results are not driven by cross-state variations either in timing of the cut-off or in any other characteristics that differ across states and may influence kindergarten entry decisions. The same patterns persist in the “within-state” framework. 15 Note that while our bivariate analysis compared redshirters to other children born within three months of their states’ kindergarten cutoff, here we are considering redshirters relative to the full kindergarten entry cohort.