
Technical Note: A mobile sea-going mesocosm system – new ...

vol. 180, no. 2 the american naturalist august 2012
Direct and Indirect Ecosystem Effects of EvolutionaryAdaptation in the Trinidadian Guppy
(Poecilia reticulata)
Ronald D. Bassar,1,*,† Regis Ferriere,2,3,* Andres Lopez-Sepulcre,1,2 Michael C. Marshall,4
Joseph Travis,5 Catherine M. Pringle,4 and David N. Reznick1
1. Department of Biology, University of California, Riverside, California 92521; 2. Laboratoire Ecologie et Evolution, CNRS UniteMixte de Recherche 7625, Ecole Normale Superieure, Paris, France; 3. Department of Ecology and Evolutionary Biology, University ofArizona, Tucson, Arizona 85721; 4. Odum School of Ecology, University of Georgia, Athens, Georgia 30602; 5. Department ofBiological Sciences, Florida State University, Tallahassee, Florida 32306
Submitted April 14, 2011; Accepted April 1, 2012; Electronically published June 22, 2012
Online enhancements: supplementary information PDF. Dryad data: http://dx.doi.org/10.5061/dryad.pj846h4f.
abstract: Ecological and evolutionary processes may interact onthe same timescale, but we are just beginning to understand how.Several studies have examined the net effects of adaptive evolutionon ecosystem properties. However, we do not know whether theseeffects are confined to direct interactions or whether they propagatefurther through indirect ecological pathways. Even less well under-stood is how the combination of direct and indirect ecological effectsof the phenotype promotes or inhibits evolutionary change. We cou-pled mesocosm experiments and ecosystem modeling to evaluate theecological effects of local adaptation in Trinidadian guppies (Poeciliareticulata). The experiments show that guppies adapted to life withand without predators alter the ecosystem directly through differ-ences in diet. The ecosystem model reveals that the small total indirecteffect of the phenotype observed in the experiments is likely a com-bination of several large indirect effects that act in opposing direc-tions. The model further suggests that these indirect effects can re-verse the direction of selection that direct effects alone exert backon phenotypic variation. We conclude that phenotypic divergencecan have major effects deep in the web of indirect ecological inter-actions and that even small total indirect effects can radically changethe dynamics of adaptation.
Keywords: food webs, evolution, eco-evolutionary feedback, indirecteffects.
Introduction
There is growing evidence that evolutionary responses toecological change can be measured over observable time(Hendry and Kinnison 1999; Fussmann et al. 2007). Awell-known example is found in work on the Galapagos
* These authors contributed equally to this work.† Corresponding author; e-mail: [email protected].
Am. Nat. 2012. Vol. 180, pp. 167–185. ! 2012 by The University of Chicago.0003-0147/2012/18002-52975$15.00. All rights reserved.DOI: 10.1086/666611
ground finch Geospiza fortis evolving in response to fluc-tuating rainfall and correlated changes in available foodresources (Grant and Grant 2002). Reznick and Ghal-ambor’s (2001) review summarizes 47 studies demonstrat-ing or implying rapid evolution in morphology, physiol-ogy, phenology, behavior, and life-history traits.
The realization that evolution can be rapid enough tohappen in ecological time opens the door to the possibilitythat ecology and evolution are processes interlocked withone another in a dynamic feedback loop (Roughgarden1971; Metz et al. 1992; Heino et al. 1998; Sinervo et al.2000; Dieckmann and Ferriere 2004; Dercole and Rinaldi2008), a notion tracing back to Chitty’s (1960) and Pi-mentel’s (1961) ideas of genetic feedback and cycling se-lection. Theory and laboratory experiments on simple eco-logical systems suggest that the interplay of ecology andevolution on a common timescale generates ecological pat-terns that are not predicted when the evolutionary dy-namics are ignored (Loeuille et al. 2002; Yoshida et al.2003; Dieckmann and Ferriere 2004; Dercole and Rinaldi2008). While understanding the selective action of eco-logical factors has long been a focus of evolutionary bi-ology, there is now a pressing need for integrative studiesto quantify the effect of adaptive trait evolution on com-munity and ecosystem dynamics, understand the pathsthrough which these effects are manifested, and explorethe subsequent feedback to a new selective milieu (Fuss-mann et al. 2007; Schoener 2011).
Several experimental studies in the field or using in situmesocosms have shown that adaptation in a target speciescan have demonstrable ecological effects on its surround-ing community or ecosystem (Post et al. 2008; Harmonet al. 2009; Palkovacs et al. 2009; Bassar et al. 2010). Noneof these studies have evaluated the individual ecological
This content downloaded from 128.192.10.126 on Mon, 24 Jun 2013 13:13:58 PMAll use subject to JSTOR Terms and Conditions

168 The American Naturalist
pathways through which these net effects were generated.The ecological effects of adaptation may be mediated bydirect pathways that involve the physical interaction of thetarget species with another species, as in predation, par-asitism, or interference competition. The ecological effectsof adaptation may also be mediated by indirect pathwaysand thus represent second- or higher-order effects throughwhich the target species interact with other communitymembers via a shared resource, as in exploitative com-petition, a common predator or mutualist that influencesall of them, or through an induced change in the physicalenvironment, such as changes in the amount of availablelimiting nutrients (Wootton 1994; Werner and Peacor2003).
This is a pressing issue for understanding both ecologyand evolution. If ecological effects of evolutionary changein a target species are largely restricted to direct pathways,those effects will have a limited scope on community struc-ture and ecosystem processes. Alternatively, if they prop-agate through the web of indirect ecological interactions,they can have more profound and global effects on com-munity dynamics and ecosystem function.
We know that indirect effects triggered by ecological(nonevolutionary) factors can have considerable impacton community organization and ecosystem processes(Strauss 1991; Wootton 1994; Schmitz 2009) and that mul-tiple indirect effects can swamp the influence of directecological effects (Stone and Roberts 1991; Miller 1994).We know little about the efficacy of either indirect eco-logical effects as agents of selection or the extent to whichadaptive evolution will feed back into ecology via indirecteffects. Miller and Travis (1996) predicted that evolutionwould proceed differently under different combinations ofdirect and indirect ecological effects, a prediction sup-ported by terHorst’s (2010) experiments. If Miller andTravis’s logic were taken further, applying it to a case inwhich the direct and indirect effects of a species on itsecosystem changes as it evolves and adapts to its environ-ment, then it suggests that the associated direct and in-direct effects would also change, which in turn wouldchange the selection on and subsequent evolution of thetarget species. Thus, the logic suggests that indirect effectscould ultimately alter the results expected solely from con-sidering direct effects alone.
The goal of this study is to integrate mesocosm exper-iments and mathematical modeling in order to decoupleand evaluate the direct and indirect ecological effects ofadaptive phenotypic divergence in a focal species, the Trin-idadian guppy (Poecilia reticulata). Guppies function asprimary and secondary consumers in the ecosystem. Weemploy different phenotypes of guppies that represent theoutcome of genetic adaptation to different predatory en-vironments. While direct ecological effects can be mea-
sured relatively easily, experimentally documenting indi-rect effects in complex webs of species interactions is morechallenging. Theoretical and empirical studies indicate thatpredicting the sign and magnitude of indirect effects in anecosystem from knowledge of direct effects alone is non-trivial (Leroux and Loreau 2010). The problem is exac-erbated in communities with a significant number of om-nivores that exploit several trophic levels (Polis and Strong1996). Because indirect effects represent, by definition, twoor more links (second- or higher-order effects), they areoften not quantifiable through simple observational stud-ies. When there are two or more possible indirect pathwaysbetween two ecosystem components, experimental studiesthat document indirect effects measure the total effect ofall possible indirect links in the system. If two or moreseparate indirect links have an opposing influence, thenthis may show up as a small and possibly nonsignificanttotal indirect effect, even though the effect of each indi-vidual pathway may be very large.
Our study overcomes these difficulties by combiningcontrolled experiments with the numerical analysis of amechanistic model of ecosystem dynamics. Our approachinvolves a replicated, factorial experiment in mesocosmsin which we manipulate guppy presence, phenotype, anddensities. Our different phenotypes were guppies adaptedto high- versus low-predation environments. Our differentguppy population densities were representative of averagedensities observed in natural high-predation (low density)and low-predation (high density) environments. We usedelectric exclosures that excluded guppies and their directeffects to quantify the total indirect effect of guppies. Wethen used these results to parameterize the ecosystemmodel and hence evaluate the contributions of each in-direct ecological pathway to the total indirect effect ofguppies. This three-pronged approach allows us to esti-mate the direct ecological effect of phenotypic divergencewhile controlling for the effect mediated by the differencein population density between phenotypes and then com-pute the indirect ecological effects of phenotypic diver-gence and compare them with the direct ecological effect.We use these results to discuss the potential for direct andindirect ecological effects of the phenotype to feed backon guppy adaptive evolution and thus close the eco-evo-lutionary feedback loop.
Methods
In guppies, phenotypic divergence is associated with en-vironments that differ in fish community composition andrisk of predation. Guppies from low-predation (LP) com-munities coexist with the killifish (Rivulus hartii), whichmay prey on smaller size classes of guppies (Haskins et al.1961). Guppies from high-predation (HP) communities
This content downloaded from 128.192.10.126 on Mon, 24 Jun 2013 13:13:58 PMAll use subject to JSTOR Terms and Conditions

Ecosystem Effects of Evolutionary Adaptation 169
coexist with a variety of predatory fish species, includingthe pike cichlid (Crenichla alta) and the wolf fish (Hopliasmalabaricus), that prey on adult size classes of guppies(Haskins et al. 1961; Reznick and Endler 1982).
LP and HP guppies differ genetically in their life-historyadaptations to these divergent predation regimes (Reznick1982). Guppies from HP communities mature at a youngerage and a smaller size than their LP counterparts (Reznick1982; Reznick and Endler 1982). HP guppies also havemore, smaller offspring than LP fish and overall investmore resources in reproduction (Reznick 1982; Reznickand Endler 1982). The higher death and birth rates in HPenvironments combine to cause lower overall populationdensities and populations dominated by small young fishin comparison to LP environments (Reznick et al. 1996,2001; Rodd and Reznick 1997). Moreover, many of theadaptive genetic differences between HP and LP guppieswill evolve on ecologically relevant timescales. Reznick andBryga (1987) and Reznick et al. (1997, 1990) report sig-nificant changes in time intervals of 4–11 years. Guppiesin HP versus LP environments can differ in their impacton the ecosystem because of their differences in populationdensity or size structure, their evolved differences in howthey utilize their environment, such as diet, or other dif-ferences in phenotype, such as the excretion of nutrients.In a replicated common garden mesocosm experiment,mesocosms stocked with LP guppies had lower standingstocks of algae and more invertebrates compared with me-socosms stocked with HP guppies after only 28 days(Bassar et al. 2010). Gut content analysis from guppies inthe mesocosms and from the wild showed that LP guppiesconsume more algae and fewer invertebrates than HP gup-pies (Bassar et al. 2010). Not surprisingly, given their re-spective diets, LP guppies had lower nitrogen excretionrates than HP guppies.
These differences between LP and HP phenotypes inecosystem effects could simply be the result of differencesin dietary preference (direct, first-order effect). However,because HP guppies also consume more invertebrates thanLP guppies, they may strengthen a trophic cascade thatleads to increased algal stocks (second-order, consumptiveindirect effect). Also, increased algal stocks could resultfrom the increased nutrient recycling rates seen in HPguppies (second-order nonconsumptive indirect effect).Higher-order indirect effects of guppy phenotype couldalso control ecosystem processes. This would be the caseif higher invertebrate consumption by HP guppies wouldweaken the nutrient recycling pathway of invertebrate ex-cretion, a third-order effect resulting from the combina-tion of a direct consumptive effect and an indirect non-consumptive effect.
Experimental Setting
We used 16 flow-through mesocosms (!3 m # 0.5 m)near a natural stream in the Arima Valley on the islandof Trinidad. Details of their construction can be found inthe study by Bassar et al. (2010), which describes a differentset of results from this experiment. Here we summarizetheir key features. The benthic substrate consisted of amixture of sand and gravel set to a depth of !5 cm. Flowingwater came from a nearby fish-free spring and was set toan average depth of 16 cm. We allowed the mesocosms tosit with running water for 8 days to allow the buildup ofepilithon and detritus. After this period, we inoculated themesocosms with samples of the stream invertebrate com-munity collected from low flow rate sections of a nearbymidpredation stream. We collected invertebrates from anarea comparable to the total benthic area of all 16 me-socosms. We removed large predatory taxa (primarily odo-nates) from these collections to avoid artifacts due to un-evenly distributing rare predators that could haveunpredictable effects on the individual mesocosms.
We ran this experiment twice, first using guppies fromHP and LP localities from the Guanapo drainage and thenfrom the Aripo drainage. In each trial, guppies were added8 days after invertebrates to allow the latter to acclimateand disperse within the mesocosms. Each mesocosm re-ceived one of five guppy treatments. Four mesocosms re-ceived no guppies (no fish), and the remaining mesocosmsreceived one of four crossed phenotype by density factors(LPLD, low predation–low density; LPHD, low predation–high density; HPLD, high predation–low density; HPHD,high predation–high density). Treatments were arrangedin three spatial blocks with one treatment replicate perblock except one block that received two no-fish treat-ments. High-density (24 individuals) and low-density (12individuals) treatments were chosen to reflect the naturaldensities for HP and LP localities, on the basis of previoussurveys of these communities (Reznick and Endler 1982;Rodd and Reznick 1997; Reznick et al. 2001); the sex ratiosand size structure of the fish populations in each treatmentwere the mean of the size distributions across HP and LPsites (Reznick and Endler 1982; Reznick et al. 2001). De-tails of initial and final densities and biomass of guppiesin each fish treatment are reported by Bassar et al. (2010).Twenty-eight days after the guppy introduction, we mea-sured the responses of the ecosystem to the different guppytreatments.
We were able to partition the net effects of each fisheffect on algae (fish presence, phenotype, and density) intofirst-order and higher-order components by excluding fishfrom a small portion (4%) of each mesocosm, using elec-trified exclosures (Pringle and Blake 1994; Connelly et al.2008). Exclosure plots consisted of -cm copper12 # 50
This content downloaded from 128.192.10.126 on Mon, 24 Jun 2013 13:13:58 PMAll use subject to JSTOR Terms and Conditions

170 The American Naturalist
frames attached to Speedrite Viper 3000 electric fencechargers delivering 3 J every 2 s (for details, see Pringleand Blake 1994; Connelly et al. 2008). Nonelectrified con-trol plots consisted of an identical, nonelectrified copperwire frame. Weekly observations confirmed that while gup-pies frequented the nonelectrified plots, they never enteredthe electrified exclosures.
We measured chlorophyll a accrual in each exclosureby placing five ceramic tiles (5 cm # 5 cm) as substrateand collecting them at weekly intervals. On the final sam-pling (day 28), we collected two tiles per exclosure. Tileswere scrubbed and chlorophyll a measured using standardfluorometric techniques (Steinman et al. 2006). We mea-sured leaf decomposition rate by placing five leaf packs ineach plot, removing and drying one leaf pack weekly, andregressing the natural log–transformed percent remainingagainst time. The slope of this regression was used as ameasure of the decay rate (k; Benfield 2006). Leaf packswere constructed by attaching 3.0 g of dried blackstickleaves (Pachystachys coccinea) by their petioles using binderclips. On the final day of the experiment (day 28), wesampled the benthic invertebrate community and benthicorganic matter (BOM) by sealing off a circular area of thebenthos with an 11.75-cm-diameter polyvinyl chloridepipe and collecting all the material inside it after sievingthrough a 63-mm sieve. Samples were stained with rosebengal for 24 h, and invertebrates were separated from theBOM under a dissecting scope. Invertebrates were iden-tified to the family or genus level, counted, and measuredfor length. Biomass estimates were obtained using knownlength-mass regression equations (Feller and Warwick1988; Benke et al. 1999; Baumgartner and Rothhaupt2003). We present analyses of biomass estimates for non-predatory taxa. We also report analyses of the mean sizeand count for the most common of these taxa (Chiron-omidae) to examine which of these factors were respon-sible for changes in biomass. The remaining BOM wasdried and ashed in a muffle furnace to obtain ash-free drymass.
Statistical Analyses
We analyzed the final biomass of ecosystem compartmentsusing linear mixed models. We included fish treatmenttype as a fixed effect with five levels (no fish, LPLD, LPHD,HPLD, HPHD) and plot type as a fixed effect with twolevels (electrified and nonelectrified). We treated meso-cosm identity as a random effect nested within fish treat-ment to estimate the proper error and degrees of freedomfor the treatment effect (Kutner et al. 2005). We includeddrainage of origin and spatial block as fixed effects. In-teractions between drainage and treatment and plot typewere initially included in the model. We used separate
error variances for the exclosure or treatment effects if alikelihood ratio test indicated that they were different. Wefit the complete fixed effects model with alternative errorstructures using restricted maximum likelihood. Once themost parsimonious error structure was chosen, we em-ployed maximum likelihood techniques and used theAkaike information criterion (AIC) to decide the removalof fixed effects. Models were selected using an DAICc of4. The best model was then rerun using restricted maxi-mum likelihood to obtain unbiased fixed effects parameterestimates.
We used a series of planned, partial interaction contraststo separate and test the direction and magnitude of eco-system effects attributable to guppy presence, phenotype,and density. All contrasts included both the treatmentmain effect and the treatment by exclosure type interac-tion. We calculated three contrasts for each fish treatmentmain effect: net contrast, direct contrast, and indirect con-trast. The net (direct ! indirect) contrast between twotreatments was constructed to represent the difference be-tween nonelectrified plots of the treatments of interest.The indirect contrast was calculated from the differencebetween the electrified plots of the treatments of interest.We calculated the direct contrast by subtracting the in-direct contrast from the net contrast.
Mechanistic Model
We built a mathematical model of ecosystem dynamics toestimate the indirect effects of phenotypic divergence thatare mediated by one or more ecosystem variables betweenfish and algae. The model describes the dynamics throughtime of the concentration of dissolved nutrients (nitrogen),the biomass of benthic organic material (BOM), primaryproducers, invertebrates, and fish (fig. 1). As intended byexperimental design, in the model the effect of leaf packswas neglected. We parameterized and initialized the modelwith data from the experiment and other independent datasets (table A1). Parameters for which no reliable mea-surements were available were estimated by fitting the eco-system model to all the experimental data at once (seeappendix). Model fitting followed the standard scheme ofsensitivity analysis to select identifiable parameters andestimation of identifiable parameters by least squares. Thiswas done here by using the R package FME (Soetaert andPetzoldt 2010). The FME algorithm computes approxi-mate estimates of parameter uncertainty by linearizationof the model around the best-fit parameters and providessamples of the data-dependent probability distribution ofthe parameters by using a Markov chain Monte Carlo(MCMC) method.
We used the fitted model to repeat the experiment insilico and compute the outcome of fish exclusion by elec-
This content downloaded from 128.192.10.126 on Mon, 24 Jun 2013 13:13:58 PMAll use subject to JSTOR Terms and Conditions

Ecosystem Effects of Evolutionary Adaptation 171
Figure 1: Structure of the ecosystem model. Primary producers arerestricted to periphyton (P) and are possibly limited by nitrogen (N).Other ecosystem compartments are detritus as benthic organic matter(D), invertebrates (I), and fish (F). Nutrients move up the food chainby fixation by primary producers ( ), predation on primary pro-FN, P
ducers and detritus by invertebrates ( , ) and fish ( , ),F F F FP, I D, I P, F D, F
and predation on invertebrates by fish ( ). Fish and invertebratesFI, F
return nutrient to N by respiration and excretion ( , ). TheF FF, N I, N
nutrient flow from primary producers to detritus is driven byFP, D
mortality; from invertebrates to detritus is driven by egestionFI, D
and mortality; from fish to detritus is driven by egestion only:FF, D
fish biomass lost by mortality is small and leaves the system ( ).FF, loss
Invertebrates that emerge are lost from the system ( ). Decom-FI, loss
position causes a two-way flow between N and D ( ) involvingFD, N
mineralization from D to N and immobilization from N to D. Thewater flow brings nutrient and detritus in ( , ) and outF FN, in D, in
( , ) of the system.F FN, out D, out
tric exclosures for each fish treatment. We assumed thatnitrogen, BOM, and invertebrates were well mixedthroughout the entire system, including both plot types,and that the exclusion of fish from the (small) electrifiedexclosures and its impact on periphyton within the exclo-sures had no significant feedback effect on the global eco-system dynamics. Thus, periphyton dynamics in both typesof exclosures were driven by the global mesocosm dynam-ics of nitrogen, BOM, invertebrates, and fish, and the
model predicted the effect of fish exclusion on algal growthand stock (see appendix). Indirect and direct contrastswere measured via the same contrast matrix used for theexperimental analysis; confidence intervals were computedby using the MCMC-generated sample of the parameterdistribution.
Since we explicitly modeled the mechanisms contrib-uting to the fluxes between ecosystem compartments, wewere able to directly evaluate the effect of fish phenotypemediated by fish predation (direct effect) and the twocomponents of the total indirect effect (see fig. 1): theeffect mediated by invertebrate predation (trophic cascade)and the effect mediated by nutrient uptake (i.e., produc-tion). The mathematical derivation is presented in the ap-pendix, and the general result is encapsulated in equation(A11). The model further allowed us to partition the latterinto its three components: the effects mediated by fishexcretion, invertebrate excretion, and remineralization viadecomposition. This was done by recalculating the indirecteffect mediated by nutrient uptake while controlling forthe change in fish excretion, in invertebrate excretion, andin decomposition due to fish phenotype (see supplemen-tary information and eqq. [S18]–[S21], available online).The differences between the uncontrolled effect and eachcontrolled effect provided an estimate of the contributionof the corresponding ecosystem pathway (fish excretionor invertebrate excretion or decomposition) to the indirecteffect mediated by nutrient uptake. We performed MonteCarlo simulations using samples of the probability distri-bution of model parameters to obtain estimates of un-certainty (standard error) for all estimated direct and in-direct effects.
Results
Experimental Results: Net, Direct,and Total Indirect Effects
Algae. The net effect of adding guppies was to decreasealgal biomass, a result driven by a large negative directeffect of guppies consuming algae that was 333% largerthan the indirect effect (fig. 2A; tables 1, S1 [tables S1–S8are available in the supplementary information]). The totalindirect effect of adding guppies to the mesocosms wasalso negative (fig. 2A; tables 1, S1), which is contrary tothe expectations of a trophic cascade or nutrient enrich-ment by guppies, whether we assume that the consump-tion of invertebrates reduces invertebrate consumption ofalgae or whether we assume that the addition of guppiescauses an increase in the rate of nitrogen cycling. Doublingthe density of guppies reduced the amount of algae in themesocosms, which also was driven mainly by a large neg-ative direct effect that was 250% larger than the total in-
This content downloaded from 128.192.10.126 on Mon, 24 Jun 2013 13:13:58 PMAll use subject to JSTOR Terms and Conditions

Figure 2: A–D, Contrast estimates ("1 SE) for planned comparisons of fish, phenotype, density, and mean difference estimates for phenotypesat natural density for primary producer chlorophyll a (A), invertebrate biomass (B), benthic organic matter (BOM; C), and leaf decompositionrates (D). Contrasts are constructed as fish (fish–no fish), phenotype (high predation [HP]–low predation [LP]), density (high density–lowdensity), and natural (HP at low density–LP at high density). Positive contrast estimates reflect higher means for mesocosms with guppies,HP, high density, and HP at low density. Natural represents the contributions of the combined density- and trait-mediated effects as thedifference between HP phenotype at low densities (HPLD) and LP phenotype at high densities (LPHD; HPLD " LPHD). These differences
This content downloaded from 128.192.10.126 on Mon, 24 Jun 2013 13:13:58 PMAll use subject to JSTOR Terms and Conditions

Ecosystem Effects of Evolutionary Adaptation 173
represent the combined effects that would be seen in natural populations of these phenotypes and hence represent the combination ofecological and evolutionary effects. E, Partition of net effects of guppies, phenotype, and density on algal biomass from model mimickingthe exclosure experimental design. F, Exact partition (eq. [A11]) of guppy phenotype net effect on algal biomass into the direct effectmediated by fish predation on algae, the total indirect effect, and the indirect effects mediated by invertebrate predation on algae (PI) andby algal nutrient uptake (All Nutr.). The effect mediated by algal nutrient uptake has itself three components: change in fish excretion (FN),change in invertebrate excretion (IN), and change in decomposition (DN). In E and F, mean values were computed by Monte Carlosimulations sampling the probability distribution of model parameters. Small differences in the calculation of the direct and indirect effectsbetween E and F result from E being calculated from contrasts and F from exact partitioning of effects. For mathematical definition andderivation of indirect effects, see appendix and supplementary information (available online). Three asterisks, ; two asterisks,P ! .001 P !
; one asterisk, ; dagger, ..01 P ! .05 P ! .10
direct effect. Increased guppy density increased algal stand-ing stocks slightly through indirect effects (fig. 2A; tables1, S1) and, although nonsignificant, was able to slightlyoffset the negative direct effect.
HP guppies consumed substantially fewer diatoms thanLP guppies (Bassar et al. 2010) and caused an increase onalgal stocks compared with mesocosms with LP guppies.This increase was caused mostly by a significant, positivedirect effect of the phenotype that was 218% larger thanthe total indirect effect (fig. 2A; tables 1, S1). Either in-creased consumption of invertebrates or increased nutrientexcretion rates of HP guppies should yield positive indirecteffects of the phenotype on chlorophyll a if either of thesepathways were important. However, we found that thetotal indirect effect of the HP phenotype was to decreasethe amount of chlorophyll a in the mesocosms (fig. 2A;tables 1, S1). This is the case even though HP guppiesdirectly decreased the biomass of invertebrates (fig. 2B;tables 1, S2) and excreted nitrogen at a higher rate thanLP guppies (Bassar et al. 2010).
Invertebrates. Adding guppies to the mesocosms decreasedinvertebrate biomass via a large direct effect that was 720%larger than the corresponding total indirect effect (fig. 2B;tables 1, S2). HP guppies decreased invertebrate biomassmore relative to LP guppies, again mostly through a directeffect that was 345% larger than the corresponding non-significant total indirect effect (fig. 2B; tables 1, S2). Therewere no significant effects of variation in guppy densityon invertebrate biomass (fig. 2B; tables 1, S2). The su-perficially similar effects of adding guppies and exchangingLP with HP guppies on invertebrate biomass were actuallycaused by different mechanisms. The decrease in inver-tebrate biomass caused by adding guppies to mesocosmsarose from a decrease in the average individual mass ofinvertebrates (tables 1, S3). In contrast, exchanging HPguppies for LP guppies produced no change in the averagesize of individual chironomids but, instead, decreased thetotal number of chironomids (tables 1, S4).
Benthic Organic Matter and Leaf Decomposition. Addingguppies to the mesocosms decreased BOM through direct
pathways and increased BOM by the same amount throughindirect pathways, leading to no observed net effect BOM(fig. 2C; tables 1, S5). Doubling guppy density increasedBOM, mostly as a function of direct effects that were 703%larger than the total indirect effect (fig. 2C; tables 1, S5).HP guppies caused a decrease in the total amount of BOM(fig. 2C; tables 1, S5). This decrease was mostly caused bya significant direct effect that was 159% larger than theopposing total indirect effect (fig. 2C). Exchanging HPguppies for LP guppies decreased the rate at which leavesdecomposed (fig. 2D; tables 1, S6) in the mesocosmsmostly as a function of a direct effect that was 181% largerthan the total indirect effect (fig. 2D; tables 1, S6).
Model Analysis: Estimating Indirect Effectsof Phenotype on Algal Stock
The simulations of the experimental approach yielded net,direct, and indirect effects of fish, phenotype, density, andnatural treatments on algal biomass (fig. 2E) that are con-sistent with the experimental results (fig. 2E). For fishphenotype, the net positive effect is almost entirely due tothe direct effect mediated by fish predation, in agreementwith the experimental result (total indirect effect of phe-notype not significantly different from 0; fig. 2A). Themodel allows direct calculation of these effects (appendix;eq. [A11]) and partitioning the total indirect effect intofirst- and higher-order indirect effects (fig. 2F). Althoughthe total indirect effect is very small compared with thenet and direct effects (!0.5% of the net effect; fig. 2E), themodel reveals that there are two potentially large indirecteffects of guppies on algae that tend to compensate oneanother (PI and All Nutr. in fig. 2F). First, because guppiesalso eat invertebrates and some invertebrates graze on al-gae, this indirect effect causes an increase in algae abun-dance (trophic cascade). However, the positive effect onalgae mediated by guppy predation on invertebrates ismore than compensated by the negative indirect effectmediated by nutrient uptake. These effects are similar insize, and because they oppose each other in direction, theyalmost cancel.
The greater attack rate of HP fish on invertebrates is
This content downloaded from 128.192.10.126 on Mon, 24 Jun 2013 13:13:58 PMAll use subject to JSTOR Terms and Conditions

This content downloaded from 128.192.10.126 on Mon, 24 Jun 2013 13:13:58 PMAll use subject to JSTOR Terms and Conditions

Ecosystem Effects of Evolutionary Adaptation 175
Figure 3: Observed and predicted trajectories for the state variables (g N m"2) in all five treatments. Predicted values are for least squaresbest fit of the ecosystem model given by equations (A1)–(A7). Fish state variables J, K, and L are estimated independently but added upin the graph to express total fish biomass. Although fish biomass is expressed as total dry mass g m"2 in the model, it is here converted,for illustrative purposes, to g N m"2 (multiplying by ). Data is jittered on the X-axis for clarity. HD, high density; LD, low density;c p 0.09F
HP, high predation; LP, low predation.
critical for generating this result. The model shows thatthe total influence of HP fish on nutrient dynamics wasnegative (All Nutr. in fig. 2F). But this and other mesocosmexperiments have also shown that HP guppies excrete nu-trients at higher rates than LP guppies in mesocosm ex-periments (Palkovacs et al. 2009; Bassar et al. 2010), whichimplies that HP guppies may produce positive effects onnutrient uptake. Using the model to partition the totaleffect of HP fish on nutrient uptake among its ecologicalpathways (fish excretion, invertebrate excretion, decom-position; fig. 2F), we found that the effect mediated byfish excretion was, in fact, small (in magnitude !10% ofthe direct effect) and negative (FN in fig. 2F). This reflectsthe fact that the effect of faster excretion in HP was offsetby lower density compared with LP (see fig. 3). Further-more, this negative effect was dramatized by the additionof an eightfold negative effect mediated by invertebrateexcretion (IN in fig. 2F). Thus, the total effect of HPguppies on algal stocks includes significant loss of nutrientinput by invertebrates (IN in fig. 2F) that nearly balancesthe trophic cascade from fish to invertebrates to algae (PIin fig. 2F), while the indirect effects mediated by fish ex-cretion (FN in fig. 2F) and decomposition (DN in fig. 2F)make only minor contributions to the total indirect effect.
Discussion
In a previous article, we showed that guppies modify com-munity structure and ecosystem processes as a functionof their phenotype and density (Bassar et al. 2010). How-ever, because guppy phenotypes differ in both the foodresources consumed and the rates of nutrient excretion,we were unable to distinguish these separate contributionsto the ecosystem effects. Here we combine experimentaland modeling approaches to partition these effects intodirect and indirect pathways shaped by trophic links andthe nutrient cycle.
The experimental results show that omnivorous guppiesprimarily influence the stream communities and ecosystemprocesses by directly consuming invertebrates and periph-yton but that indirect processes modulate the magnitudeof the overall net effect. Further, we show that all net,direct, and total indirect effects of phenotype differenceare as strong as or stronger than the corresponding net,direct, and total indirect effects of doubling the density offish. The ecosystem model allowed us to evaluate the con-
tribution of four indirect pathways to the effect of guppyphenotype on primary production: trophic cascade, guppynutrient excretion, invertebrate nutrient excretion, and de-composition (fig. 4). The model outputs suggest that atleast the first three of these effects are relatively large, butbecause they act in opposition to one another, they com-bine to produce a small total indirect effect of the phe-notype. HP guppies caused a trophic cascade that wasalmost compensated by the indirect effect on nutrient cy-cling. The compensation was possible because the effecton nutrient cycling mediated by invertebrate excretion wasnegative and sufficiently large. Consuming invertebratesnot only releases predation pressure on algae, it also de-creases fertilization by invertebrate excretion (ordecomposition).
Our ability to interpret the patterns produced by theexclosures as the net indirect effect on algae relies on therebeing no effects of the exclosure on invertebrates. Forexample, had invertebrates increased their grazing on algaein response to the absence of guppies in the electrifiedplots, then our measured indirect effects of guppies onalgae would be confounded by a direct effect of inverte-brates on algae that is an experimental artifact. This artifactwould have shown up as an indirect effect on the inver-tebrates. However, our results show that the indirect effecton compartments other than algae were not significant(table 1; fig. 2).
Direct versus Indirect Ecological Effects of Adaptation
Understanding the interactions among species in com-munities is important because “Without them, predictionsand insights into the nature and dynamics of complex foodwebs or communities are crude at best” (Laska and Woot-ton 1998, p. 473). To this end, community ecologists havelong struggled with determining the relative role of directand indirect interactions among organisms in structuringand determining the stability of communities. One keyproblem has been generalizing the results from simple one-predator and two-prey systems to more complex com-munities. When more than two functional groups are pre-sent in the system, the number of possible indirect linksincreases in a combinatorial fashion. This increases thelikelihood that indirect effects will become more importantin determining the dynamics of the system, but it is gen-erally unclear whether the dynamics would be determined
This content downloaded from 128.192.10.126 on Mon, 24 Jun 2013 13:13:58 PMAll use subject to JSTOR Terms and Conditions

176 The American Naturalist
Figure 4: Model estimation of the direct and four indirect effects offish phenotype on algal biomass. The direct effect is fish (F) predationon algae (P). The indirect effects are invertebrate (I) predation, up-take of nutrient (N) cycled by fish, invertebrates, and decomposition(D). Arrow thickness is proportional to the effect size, as measuredby the expected value of the corresponding contrast (see fig. 2E, 2F).A positive effect indicates higher algal biomass with the high-predation phenotype (HP) compared with the low-predation phe-notype (LP).
Table 1: Contrast F values from linear mixed models analysis of experimental results
Fish contrast Phenotype Density
Variable Net Direct Indirect Net Direct Indirect Net Direct Indirect
Algal stocks 105.60""" 25.11""" 3.62† 5.17" 7.10" 2.40 6.89" 7.69" 1.97Nonpredatory inverts 6.14" 6.51" .50 3.18† 4.59" 1.29 .93 .04 1.27Chironomid:
Count 2.87 1.38 .02 9.00"" 3.30† .12 2.59 1.23 .00Size 5.68" 6.64" 1.48 .00 .92 1.74 .54 1.71 1.17
Benthic organic matter .00 2.20 3.42† 2.85 4.49" 2.26 4.99" .84 .02Leaf decomposition .42 1.66 .74 5.35" 1.61 .68 .00 .04 .06
" .P ! .05"" .P ! .01""" .P ! .001† .P ! .10
by many indirect effects, each of small size, or by a fewof large size. Empirically measuring the direction and mag-nitude of these links has been elusive in most systems.Answering this question requires a combination of ex-perimental manipulations and mathematical modeling ofthe interactions among community members, as we havedone here (Laska and Wootton 1998).
While community interactions that are a function ofnumerical dynamics between species are well studied(Wootton 1994), we know far less about how interactionschange in response to local adaptation by members of thecommunity (Fussmann et al. 2007; Haloin and Strauss2008). We have shown with regard to guppies that suchphenotype-mediated effects can often be larger than nu-merical effects. However, numerical and phenotype-mediated effects are often confounded in nature (Strausset al. 2008), as they are in natural guppy populations. LPguppies live at higher densities than HP guppies in naturalstreams. There are readily observable differences in theecosystem parameters between upstream (where LP gup-pies reside) and downstream (where HP guppies reside)locations; the associations of those differences with sub-stantial differences in guppy density could suggest that thedifferences in guppy density would be likely responsiblefor the ecosystem distinctions. However, we have shownhere that there are substantially different effects of eachphenotype on the ecosystem, effects that are often as strongor stronger than the effects of doubling density. Thus,exchanging LP for HP guppies creates qualitatively differ-ent effects on the ecosystem than the effects of simplydoubling the density of a hypothetical “average” guppyphenotype. As a result, accurately assessing the role ofguppies in these ecosystems requires separating the effectsof phenotype from those of density. If our results representa more general phenomenon in adaptation, they may addto the call for a heavier component of evolutionary biologyin community and ecosystem ecology (Ferriere et al. 2004;
Johnson and Stinchcombe 2007; Haloin and Strauss 2008;Loreau 2010; Schoener 2011).
Our mechanistic model suggests that the direct ecolog-
This content downloaded from 128.192.10.126 on Mon, 24 Jun 2013 13:13:58 PMAll use subject to JSTOR Terms and Conditions

Ecosystem Effects of Evolutionary Adaptation 177
Figure 5: Derivatives of the direct and indirect effects of phenotype on algal biomass with respect to guppy dietary preference (degree ofherbivory). HP, high-predation fish; LP, low-predation fish. Derivatives are defined as responses to a small decrease in herbivory in HP anda small increase in herbivory in LP; negative derivatives thus indicate selection for less herbivory in HP and more herbivory in LP. Thederivatives of the net effects (not shown) obtained by summing derivatives of direct and indirect effects. The derivatives’ uncertainty isestimated by using Markov chain Monte Carlo samples of the probability distribution of the estimated model parameters; dotted linesindicate "1 SE. Derivatives and their uncertainty are calculated around the observed (estimated) degree of herbivory (0.31 for HP, 1.41for LP, indicated by thin dotted vertical lines). For computational details, see supplementary information (available online).
ical effect and the indirect ecological effects (second-orderor higher-order effects) caused by phenotypic change inone member of the community may actually be of similarmagnitude. We were only able to detect these potentialindirect effects by combining experimental manipulationsof organismal characters and mechanistic modeling of eco-system dynamics. With the experiment alone, we wouldhave concluded that the largest effect of the guppy phe-notype is the direct effect of the difference in guppy dieton algal biomass and that the (total) indirect effect is rel-atively small and in opposite direction to a trophic cascade.Adding the mechanistic model revealed that the relativelysmall total indirect effect may in fact be the sum of largeindirect effects that are in the direction predicted by ob-served differences in guppy diet but almost cancel. Thus,empirical studies comparing the relative magnitudes of neteffects and direct effects in ecological webs may errone-ously conclude that indirect pathways are unimportant.
The various effects of the phenotype on the ecosystemare determined by differences in dietary preference andnutrient excretion rates. Nutrient recycling consequencesof trophic cascades are rarely considered in studies of in-direct effects but may be important when nutrient cyclingis fast or when the consumer is omnivorous (Leroux andLoreau 2010). This may be particularly important when
the primary invertebrate prey are detritivores that do noteat algae (Leroux and Loreau 2010), as in our mesocosms,where the most abundant invertebrates are chironomids.Because our model does not distinguish between fine andcoarse detrital matter, with chironomids playing a key rolein the transition from the latter to the former, the con-tribution of decomposition to the indirect pathwaythrough invertebrates and nutrient may even have beenunderestimated. Indeed, invertebrate effects on detritus(e.g., variation in shredding rate among invertebrates, aneffect not included in the model) could also contributesignificantly to the indirect effects of fish adaptation onprimary production.
Differences in the dietary preference cause the changesin the consumptive effects of guppies and their inverte-brate prey. However, it is unclear whether the differencesin guppy excretion rates are themselves driven by the di-etary preference as well. HP guppies consume more in-vertebrates and excrete nitrogen at higher rates than LPguppies. If consuming invertebrates leads to higher ratesof nutrient excretion, then the indirect effect of guppynutrient excretion could itself be explained by adaptationsrelated to dietary preference. Alternatively, higher excre-tion rates in HP guppies could be independent from dietand may reflect broader physiological adaptations (e.g.,
This content downloaded from 128.192.10.126 on Mon, 24 Jun 2013 13:13:58 PMAll use subject to JSTOR Terms and Conditions

178 The American Naturalist
metabolic rate) to living in high-resource and high-mor-tality-risk environments (Ricklefs and Wikelski 2002).
Evolutionary Feedback
As the phenotypic state of a population evolves, its eco-logical state (e.g., density) and its environment change. Asthe environment changes, selective pressures on the phe-notype may change, resulting in an evolutionary feedbackof ecological dynamics on trait evolution. The reciprocalinterplay of ecological and evolutionary dynamics has beenanalyzed in mathematical models (Mylius and Diekmann1995; Metz et al. 2008; Jones et al. 2009) and demonstratedin the laboratory (Yoshida et al. 2003). There are a fewexperimental studies in the wild (or in in situ mesocosms)that suggest that the coupling of ecological and evolu-tionary dynamics may play an important role in jointlyshaping adaptation and ecosystem function (Post et al.2008; Harmon et al. 2009; Palkovacs et al. 2009; Bassar etal. 2010). But there is not a single system in nature wherea complete characterization of direct and indirect dynamicfeedbacks between ecology and evolution has beenachieved.
With the guppy system, we can take a step closer topredicting the eco-evolutionary dynamics driven by thefull eco-evolutionary feedback loop. Our mechanisticmodel can be used to predict how much the direct andindirect ecological effects of phenotype difference can feedback evolutionarily and contribute to the evolution of thatdivergence. While a comprehensive analysis is beyond thescope of this article, some initial insights are possible. Letus assume that, all else being equal, reduced algal stockselects against herbivory and increased algal stock selectsfor herbivory; let us assume further that the degree ofherbivory can evolve independently of other adaptive traitsthat are known to differ between LP and HP phenotypes.Then, to predict the direction of selection on LP and HPherbivory, we examine how the difference in algal stockbetween phenotypes changes if HP becomes less herbiv-orous or LP becomes more herbivorous. This is achievedby computing the derivatives of the net ecological effectto a small decrease of HP herbivory or a small increaseof LP herbivory (fig. 5).
The results show that our predictions about further evo-lution in the system are altered when we take the indirectecological effects seriously. To see this, recall that the de-rivative of the net ecological effect is the sum of derivativesof the direct and indirect effects. By computing the directand indirect effects derivatives over a range of LP and HPdegrees of herbivory that includes current values, we findthat the sign of the derivatives of the indirect effect toeither higher LP herbivory or lower HP herbivory is alwaysopposite of the sign of the derivatives of the direct effect
(fig. 5). In HP, the direct effect’s derivative is positive,while the indirect effect’s derivative is negative and largerin magnitude. The net effect’s derivative is therefore neg-ative, which means that less herbivory in HP reduces thedifference in algal stock. Thus, algal stock in the HP pop-ulation decreases, which may select for even less herbivoryin HP. Had we neglected the indirect ecological effect andequated the net effect with the direct effect, we would havemade the exact opposite prediction. Likewise, in LP, theselection pressure generated by the indirect effect domi-nates and opposes selection by the direct effect. The netecological effect’s derivative is positive, which indicatesthat less herbivory is favored. In contrast, the direct effect’sderivative is negative and would have by itself predictedselection for more herbivory.
The general lesson from this computational exercise isthat although the total indirect ecological effect may besmall in magnitude, its derivative with respect to pheno-type can be large—and it is the derivative, not the rawvalue, that determines the contribution to the evolutionaryfeedback. In the mathematical model of our system, thederivative of the total indirect effect is large because severalindirect effects are large and vary strongly with respect tophenotype. This underscores the importance for the cor-rect assessment of evolutionary feedbacks of extending theanalysis of the total indirect effect to its mechanistic com-ponents along each ecological pathway. Future studies alsoneed to investigate how indirect ecological effects feed backevolutionarily on genetic variation in fish traits other thanforaging behavior.
Acknowledgments
We are indebted to D. F. Fraser and S. A. Thomas forconstructing the mesocosms and advice on the experiment.We thank the Ramdeen family for the use of their landand water. S. Grabinski, Y. Reynoso, and many field andlaboratory technicians helped to process samples. S. Con-nelly provided advice on the use of electric exclosures. D.DeAngelis and J. Stegen advised the model constructionand helped gather parameter estimates. C. Dalton, R. El-Sabaawi, and T. Heatherly provided unpublished data. M.Alkins-Koo, R. Hernandez, Simla Tropical Research Sta-tion, and the University of the West Indies provided hous-ing and logistical support. We are grateful to three anon-ymous reviewers for their constructive criticisms. Onereviewer’s insightful suggestions helped us to greatly im-prove the scope of the mathematical method for parti-tioning direct and indirect effects. This research wasfunded by a National Science Foundation Frontiers in In-tegrative Biological Research grant (EF0623632), theFrench Agence Nationale de la Recherche (EVORANGEproject), and the Institut Universitaire de France.
This content downloaded from 128.192.10.126 on Mon, 24 Jun 2013 13:13:58 PMAll use subject to JSTOR Terms and Conditions

Ecosystem Effects of Evolutionary Adaptation 179
APPENDIX
Mathematical Ecosystem Model
Model Description
The ecosystem structure shown in figure 1 translates into a system of ordinary differential equations in which flowrates determine the rates of variation of each ecosystem state variable. Given mesocosm depth (mean, 160 mm), N ismeasured as a concentration per unit area (g m"2). The nutrient (N) content of periphyton (cP), invertebrates (cI),and fish (cF) is assumed constant, and P, I, and D are measured as grams of nutrient (N) per unit area. The fishpopulation is structured into three stages, and the model describes the dynamics of female biomass (g dry mass perunit area) in each stage: immatures, J; small adults, K; and large adults, L. Transitions between stages are driven byindividual growth and reproduction. The fish population is connected to the rest of the ecosystem by fish predation(on invertebrates, periphyton, and detritus), fish excretion, and fish egestion. Although the state variables J, K, and Lmeasure the biomass of the female population, ecosystem processes are influenced by the total (female and male) fishbiomass, under the assumption of a constant, even sex ratio in all three stages. Model construction is summarizedhereafter and expounded in more detail in the supplementary information.
The rates of change of N (dissolved nitrogen), P (periphyton), I (invertebrates), and D (detritus) are given by
dNp F " F ! F " F ! F ! F , (A1)N, in N, out D, N N, P I, N F, Ndt
dPp F " F " F " F , (A2)N, P P, D P, I P, Fdt
dIp F ! F " F " F " F " F , (A3)P, I D, I I, N I, D I, loss I, Fdt
dDp F " F " F ! F " F ! F " F ! F . (A4)D, in D, out D, N P, D D, I I, D D, F F, Ddt
The flow rates denoted generically by F are modeled under the following assumptions.1. The system is well mixed and spatially homogeneous. Import and export of material (nutrient, detritus) occur
at constant rates. Hence , , , and . Decomposition assumes a constantF p N F p j N F p D F p j DN, in 0 N, out N D, in 0 D, out D
microbial fraction q in detritus and constant rates m and n of mineralization and immobilization; hence F pD, N
.qD(m " nN)2. Nutrient limitation of algal growth is described by a Monod function; maximal growth rate g and half-FN, P
saturation constant h are constant. Light limitation is characterized by a constant light extinction coefficient k. Hence."kPF p g[(1 " e )/(h ! N)]NN, P
3. The functional (trophic) response of invertebrates on detritus and periphyton is Holling Type I, with constant,prey-specific feeding rates fID and fIP: , . Assimilation rates are constant and prey specific:F p f P(I/c ) F p f D(I/c )P, I IP I D, I ID I
jID and jIP for invertebrates feeding on detritus and periphyton, respectively.4. The fish feeding rate fYZ (Y p stage p J, K, L; Z p prey type p D, P, I) is stage and prey specific and best
described by the Crowley-Martin functional response (de Villemereuil and Lopez-Sepulcre 2011; see below). Assimilationrates jFD, jFP, and jFI are constant and prey specific; they are independent of stage but differ between phenotypesuniformly across prey types, with a reduction factor d for assimilation in LP compared with HP. Hence
F p c [f (1 ! x )J ! f (1 ! x)K ! f (1 ! x)L],Z, F Z JZ J KZ LZ
F p (1 " j )c f (1 ! x )J ! (1 " j )c f (1 ! x)K ! (1 " j )c f (1 ! x)L,! ! !F, D FZ Z JZ J FZ Z KZ FZ Z LZ[ ] [ ] [ ]ZpD, P, I ZpD, P, I ZpD, P, I
where xJ and x are the male-to-female ratios of individual mass in stage J and in stages K and L.5. Mortality of algae and invertebrates occurs at constant rates and fluxes nutrient to the detritus compartment.
Invertebrates that emerge (individual probability eI) are lost from the system at constant rate mI. Assumptions 4 and5 lead to , , . In the experiment, dead fishF p m P F p (1 " j )F ! (1 " j )F ! m e I F p m (1 " e )IP, D P I, D IP P, I ID D, I I I I, loss I I
This content downloaded from 128.192.10.126 on Mon, 24 Jun 2013 13:13:58 PMAll use subject to JSTOR Terms and Conditions

180 The American Naturalist
are immediately replaced by fish of similar mass, making fish mortality negligible in effect; the mortality rate mF isthus small and independent of stage or phenotype, and the contribution to detritus is neglected.
6. The excretion rate of invertebrates rI is constant, and . The excretion rate of fish is constant and stageF p r II, N I
specific; hence , where rJ and rKL are the respiration rates of juvenile andF p c [r (1 ! x )J ! r (1 ! x)(K ! L)]F, N F J J KL
adult fish, respectively.The fish population dynamics are driven by
dJ "1p (1 ! x ) (vr K ! r L) ! b J " aJ " m J, (A5)J K L J Fdt
dKp aJ ! b K " vr K " bK " m K, (A6)K K Fdt
dLp bK ! b L " r L " m L. (A7)L L Fdt
Fish dynamics are linked to the rest of the ecosystem through the balance between assimilation and respiration,Crowley-Martin functional responses are given byb p (1/c )(j c f ! j c f ! j c f ) " r (Y p J, K, L).Y F FD D YD FP P YP FI I YI Y
a (Z/c )YZ Zf p (A8)YZ[1 !! a t (X/c )][1 ! s(1 ! x )J/w ! s(1 ! x)(K ! L)/w ]YX YX X J J KLXpD, P, I
(Y p J, K, L; Z p D, P, I). Attack rates aYZ and handling times tYZ are stage and prey specific; they also differ betweenphenotypes (de Villemereuil and Lopez-Sepulcre 2011; see below). Periphyton and detritus represent a greater fractionof the diet in LP compared with HP (Zandona et al. 2011); attack rates on periphyton and detritus were thus modeledby multiplicatively applying degrees of herbivory, HLP and HHP, to the estimated attack rates on invertebrates. Degreesof herbivory are assumed to be stage independent. The handling time of periphyton and detritus was shorter than thehandling time of invertebrates and thus modeled by applying a reduction factor z to the latter (with z independentof stage or phenotype). Finally, the Crowley-Martin functional response (eq. [A8]) describes competition between fishoccurring within stage and between juveniles and adults, with an intensity denoted by s. wJ and wKL denote meanindividual mass in juveniles ( ) and in adults ( ).w p (w ! w)/2 w p [(w ! w )/2 ! w ]/2J 0 KL max max
Defining , we have when the assimilation-respiration balance is positive and whenr p max {0, b } r p b r p 0Y Y Y Y Y
the balance is negative. Positive assimilation-respiration balance results in growth and/or reproduction. In juveniles,growth leads to reproductive maturity at rate a, given by (de Roos et al. 2007, 2008)
r " mJ Ja p , (A9)1"m /rJ J1 " (w /w)0
where mJ denotes intrinsic mortality in juveniles, w0 is mass at birth, and w is mass at maturity. Small adult femaleschannel a fraction n of their biomass production, rK, into reproduction. Females in stage K grow into stage L at rateb, given by (de Roos et al. 2007, 2008)
(1 " v)r " mK Kb p , (A10)1"m /(1"v)rK K1 " (w/w )max
where mK denotes intrinsic mortality in small adults and wmax is the asymptotic mass.
Parameters and Initial Values
Parameter values are listed with their units in table A1 and commented on in table S8. Parameters for which noreliable estimates were available from this or other experiments, natural streams, or literature data were estimated bymodel fitting. To this end, we used the experimental data that were available for each replicate of each treatment:upstream concentration of nitrogen (day 28); chlorophyll a measured on tiles sampled on days 7, 14, 21, and 28 (cleantiles are introduced on day 0); invertebrates ash-free dry mass (AFDM) measured on day 28; BOM AFDM measuredon day 28; and wet mass and size structure of guppy population on day 28. Estimates of initial values were availablefor detritus (D) and fish (J, K, L in low-density and high-density treatments). Assuming a relatively small amount of
This content downloaded from 128.192.10.126 on Mon, 24 Jun 2013 13:13:58 PMAll use subject to JSTOR Terms and Conditions

Ecosystem Effects of Evolutionary Adaptation 181
algal growth between day 0 and day 7, we approximated initial periphyton (P) by a value (0.02 g N m"2) close to theminimum of P that was measured on day 7 across treatments and replicates. Initial values for nutrient concentration(N) and invertebrates (I) were chosen to be consistent with measurements at the end of the experiment (for moredetails, see supplementary information). The overall fit of the model is the result of an optimization process over allstate variables and therefore a compromise among state variables.
Analysis of Direct and Indirect Effects
We analyzed the phenotype effects on algal biomass first by mimicking the electric exclosure experimental design. Tosimulate the dynamics of periphyton within electric exclosures, we use equation (A2) as a submodel in which con-sumption by fish (FPF) is set to 0, and N and I are externally forced by the N(t) and I(t) trajectories that the fullmodel generates. Then, we calculated the contrasts on day 28, as done with the experimental results.
Then, we used the full model to directly calculate the net, direct, and total indirect effects of fish phenotype andto partition the latter into first- and second-order indirect effects (i.e., that involve two or three links in the flownetwork between fish and periphyton (fig. 1). To this end, we use equation (A2) to establish (for details, see supple-mentary information)
T T T
HP LP HP LP HP LP"F "F "F "F F FP, F P, F P, I P, I N, P N, Plog P (T) " log P (T) p " dt ! " dt ! " dt, (A11)HP LP " " "P P P P P PHP LP HP LP HP LPtp0 tp0 tp0
where T is time at the end of the experiment ( ), the left-hand side is the net effect on algal stock measuredT p 28on log scale, the first integral on the right-hand side measures the direct effect of fish predation, and the second andthird integrals sum up to the total indirect effect. The latter is thereby partitioned into the (first-order) indirect effectmediated by invertebrate predation (second integral) and the indirect effect mediated by nutrient uptake (third integral).
The indirect effect mediated by nutrient uptake can be partitioned further into (first- and higher-order) indirecteffects mediated by the flows that contribute to N, that is, fish excretion , invertebrate excretion , and decom-F FF, N I, N
position . To this end, we recalculate the third integral while removing the effect of fish phenotype on each flowFD, N
in turn. Then, for each flow, the indirect effect mediated by that flow is estimated by the difference between theoriginal integral and the recalculated integral. For details about numerical implementation, see supplementaryinformation.
This content downloaded from 128.192.10.126 on Mon, 24 Jun 2013 13:13:58 PMAll use subject to JSTOR Terms and Conditions
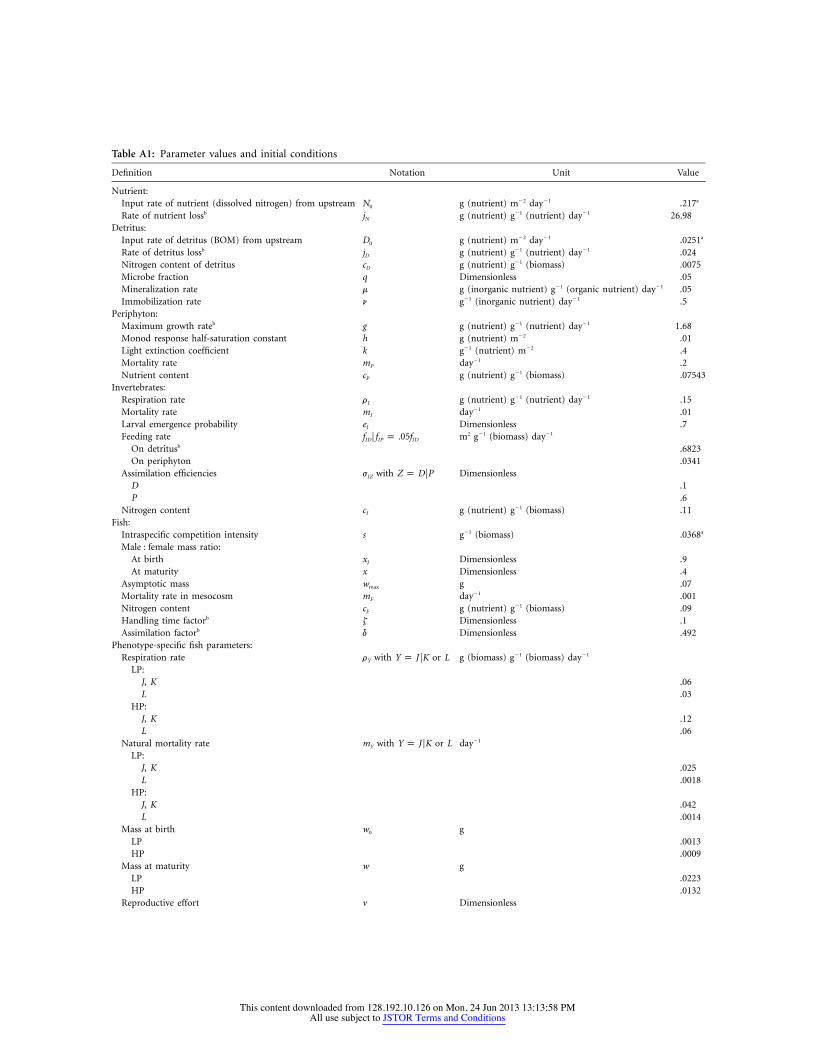
Table A1: Parameter values and initial conditions
Definition Notation Unit Value
Nutrient:Input rate of nutrient (dissolved nitrogen) from upstream N0 g (nutrient) m"2 day"1 .217a
Rate of nutrient lossb jN g (nutrient) g"1 (nutrient) day"1 26.98Detritus:
Input rate of detritus (BOM) from upstream D0 g (nutrient) m"2 day"1 .0251a
Rate of detritus lossb jD g (nutrient) g"1 (nutrient) day"1 .024Nitrogen content of detritus cD g (nutrient) g"1 (biomass) .0075Microbe fraction q Dimensionless .05Mineralization rate m g (inorganic nutrient) g"1 (organic nutrient) day"1 .05Immobilization rate n g"1 (inorganic nutrient) day"1 .5
Periphyton:Maximum growth rateb g g (nutrient) g"1 (nutrient) day"1 1.68Monod response half-saturation constant h g (nutrient) m"2 .01Light extinction coefficient k g"1 (nutrient) m"2 .4Mortality rate mP day"1 .2Nutrient content cP g (nutrient) g"1 (biomass) .07543
Invertebrates:Respiration rate rI g (nutrient) g"1 (nutrient) day"1 .15Mortality rate mI day"1 .01Larval emergence probability eI Dimensionless .7Feeding rate f Ff p .05fID IP ID m2 g"1 (biomass) day"1
On detritusb .6823On periphyton .0341
Assimilation efficiencies jIZ with Z p DFP DimensionlessD .1P .6
Nitrogen content cI g (nutrient) g"1 (biomass) .11Fish:
Intraspecific competition intensity s g"1 (biomass) .0368a
Male : female mass ratio:At birth xJ Dimensionless .9At maturity x Dimensionless .4
Asymptotic mass wmax g .07Mortality rate in mesocosm mF day"1 .001Nitrogen content cF g (nutrient) g"1 (biomass) .09Handling time factorb z Dimensionless .1Assimilation factorb d Dimensionless .492
Phenotype-specific fish parameters:Respiration rate rY with or LY p JFK g (biomass) g"1 (biomass) day"1
LP:J, K .06L .03
HP:J, K .12L .06
Natural mortality rate mY with or LY p JFK day"1
LP:J, K .025L .0018
HP:J, K .042L .0014
Mass at birth w0 gLP .0013HP .0009
Mass at maturity w gLP .0223HP .0132
Reproductive effort v Dimensionless
This content downloaded from 128.192.10.126 on Mon, 24 Jun 2013 13:13:58 PMAll use subject to JSTOR Terms and Conditions

Ecosystem Effects of Evolutionary Adaptation 183
Table A1 (Continued)
Definition Notation Unit Value
LP .5HP .8
Attack rate (on invertebrates) aY with Y p JFKFL m2 day"1
LP:J 15.510a
K 15.871a
L 16.019a
HP:J 31.424a
K 32.347a
L 32.738a
Handling time (of invertebrates) tY with Y p JFKFL day g"1 (biomass prey)LP:
J 2.023a
K 1.446a
L 1.211a
HP:J 2.194a
K 1.512a
L 1.223a
Degree of herbivoryb DimensionlessLP 1.408HP .31
Assimilation efficiencies jFZ with Z p DFPFI DimensionlessLP:
D .148P .295I .443
HP:D .3P .6I .9
Initial conditions (at ):t p 0N g m"2 .01D g (nutrient) m"2 .022P g (nutrient) m"2 .02I g (nutrient) m"2 .03J g (biomass) m"2
LD .045HD .098
K g (biomass) m"2
LD .148HD .278
L g (biomass) m"2
LD 0HD 0
Note: All biomass are measured in dry mass. BOM, benthic organic matter; LP, low predation; HP, high predation; LD, low density; HD, high density. Forreferences, see table S8.
aParameter values are averages over mesocosm replicates.bParameters were estimated by model fitting.
Literature Cited
Bassar, R. D., M. C. Marshall, A. Lopez-Sepulcre, E. Zandona, S. K.Auer, J. Travis, C. M. Pringle, et al. 2010. Local adaptation inTrinidadian guppies alters ecosystem processes. Proceedings of theNational Academy of Sciences of the USA 107:3616–3621.
Baumgartner, D., and K. Rothhaupt. 2003. Predictive length–drymass regressions for freshwater invertebrates in a pre-alpine lakelittoral. International Review of Hydrobiology 88:453–463.
Benfield, E. F. 2006. Decomposition of leaf material. Pages 711–720in F. R. Hauer and G. A. Lamberti, eds. Methods in stream ecology.Academic Press, San Diego.
Benke, A. C., A. D. Huryn, L. A. Smock, and J. B. Wallace. 1999.Length-mass relationships for freshwater macroinvertebrates inNorth America with particular reference to the southeasternUnited States. Journal of the North American Benthological So-ciety 18:308–343.
This content downloaded from 128.192.10.126 on Mon, 24 Jun 2013 13:13:58 PMAll use subject to JSTOR Terms and Conditions

184 The American Naturalist
Chitty, D. 1960. Population processes in the vole and their relevanceto general theory. Canadian Journal of Zoology 38:99–113.
Connelly, S., C. M. Pringle, R. J. Bixby, R. Brenes, M. R. Whiles, K.R. Lips, S. Kilham, et al. 2008. Changes in stream primary producercommunities resulting from large-scale catastrophic amphibiandeclines: can small-scale experiments predict effects of tadpole loss?Ecosystems 11:1262–1276.
Dercole, F., and S. Rinaldi. 2008. Analysis of evolutionary processes:the adaptive dynamics approach and its applications. PrincetonUniversity Press, Princeton, NJ.
de Roos, A. M., T. Schellekens, T. van Kooten, K. van de Wolfshaar,D. Claessen, and L. Persson. 2007. Food-dependent growth leadsto overcompensation in stage-specific biomass when mortality in-creases: the influence of maturation versus reproduction regula-tion. American Naturalist 170:E59–E76.
———. 2008. Simplifying a physiologically structured populationmodel to a stage-structured biomass model. Theoretical Popula-tion Biology 73:47–62.
de Villemereuil, P. B., and A. Lopez-Sepulcre. 2011. Consumer func-tional responses under intra- and inter-specific interference com-petition. Ecological Modelling 222:419–426.
Dieckmann, U., and R. Ferriere. 2004. Adaptive dynamics and evolv-ing biodiversity. Pages 188–224 in R. Ferriere, U. Dieckmann, andD. Couvet, eds. Evolutionary conservation biology. CambridgeUniversity Press, Cambridge.
Feller, R. J., and R. M. Warwick. 1988. Energetics. Pages 181–196 inR. P. Higgins and H. Thiel, eds. Introduction to the study ofmeiofauna, Smithsonian Institute Press, Washington, DC.
Ferriere, R., U. Dieckmann, and D. Couvet. 2004. Evolutionary con-servation biology. Cambridge University Press, Cambridge.
Fussmann, G. F., M. Loreau, and P. A. Abrams. 2007. Eco-evolu-tionary dynamics of communities and ecosystems. FunctionalEcology 21:465–477.
Grant, P. R., and B. R. Grant. 2002. Unpredictable evolution in a 30-year study of Darwin’s finches. Science 296:707–711.
Haloin, J. R., and S. Y. Strauss. 2008. Interplay between ecologicalcommunities and evolution: review of feedbacks from microe-volutionary to macroevolutionary scales. Annals of the New YorkAcademy of Sciences 1133:87–125.
Harmon, L. J., B. Matthews, S. Des Roches, J. M. Chase, J. B. Shurin,and D. Schluter. 2009. Evolutionary diversification in sticklebackaffects ecosystem functioning. Nature 458:1167–1170.
Haskins, C. P., E. F. Haskins, J. J. McLaughlin, and R. E. Hewitt.1961. Polymorphism and population structure in Lebistes reticu-lata, a population study. Pages 320–395 in W. F. Blair, ed. Vertebratespeciation. University of Texas Press, Austin.
Heino, M., J. A. J. Metz, and V. Kaitala. 1998. The enigma of fre-quency-dependent selection. Trends in Ecology & Evolution 13:367–370.
Hendry, A. P., and M. T. Kinnison. 1999. Perspective: the pace ofmodern life: measuring rates of contemporary microevolution.Evolution 53:1637–1653.
Johnson, M. T. J., and J. R. Stinchcombe. 2007. An emerging synthesisbetween community ecology and evolutionary biology. Trends inEcology & Evolution 22:250–257.
Jones, E. I., R. Ferriere, and J. L. Bronstein. 2009. Eco-evolutionarydynamics of mutualists and exploiters. American Naturalist 174:780–794.
Kutner, M. H., C. J. Nachtsheim, J. Neter, and W. Li. 2005. Appliedlinear statistical models. McGraw-Hill, New York.
Laska, M. S., and J. T. Wootton. 1998. Theoretical concepts andempirical approaches to measuring interaction strength. Ecology79:461–476.
Leroux, S. J., and M. Loreau. 2010. Consumer-mediated recyclingand cascading trophic interactions. Ecology 91:2162–2171.
Loeuille, N., M. Loreau, and R. Ferriere. 2002. Consequences of plant-herbivore coevolution on the dynamics and functioning of eco-systems. Journal of Theoretical Biology 217:369–381.
Loreau, M. 2010. Linking biodiversity and ecosystems: towards aunifying ecological theory. Philosophical Transactions of the RoyalSociety B: Biological Sciences 365:49–60.
Metz, J. A. J., S. D. Mylius, and O. Diekmann. 2008. When doesevolution optimize? Evolutionary Ecology Research 10:629–654.
Metz, J. A. J., R. M. Nisbet, and S. A. H. Geritz. 1992. How shouldwe define fitness for general ecological scenarios? Trends in Ecology& Evolution 7:198–202.
Miller, T. E. 1994. Direct and indirect species interaction in an earlyold-field plant community. American Naturalist 143:1007–1025.
Miller, T. E., and J. Travis. 1996. The evolutionary role of indirecteffects in communities. Ecology 77:1329–1335.
Mylius, S. D., and O. Diekmann. 1995. On evolutionarily stable lifehistories, optimization and the need to be specific about densitydependence. Oikos 74:1–12.
Palkovacs, E. P., M. C. Marshall, B. A. Lamphere, B. R. Lynch, D. J.Weese, D. F. Fraser, D. N. Reznick, et al. 2009. Experimental eval-uation of evolution and coevolution as agents of ecosystem changein Trinidadian streams. Philosophical Transactions of the RoyalSociety B: Biological Sciences 364:1617–1628.
Pimentel, D. 1961. Animal population regulation by the genetic feed-back mechanism. American Naturalist 95:65–79.
Polis, G. A., and D. R. Strong. 1996. Food web complexity andcommunity dynamics. American Naturalist 147:813–846.
Post, D. M., E. P. Palkovacs, E. G. Schielke, and S. I. Dodson. 2008.Intraspecific variation in a predator affects community structureand cascading trophic interactions. Ecology 89:2019–2032.
Pringle, C. M., and G. A. Blake. 1994. Quantitative effects of atyidshrimp (Decapoda: Atyidae) on the depositional environment ina tropical stream: use of electricity for experimental exclusion.Canadian Journal of Fisheries and Aquatic Sciences 51:1443–1450.
Reznick, D., M. J. Butler, and H. Rodd. 2001. Life-history evolutionin guppies. VII. The comparative ecology of high- and low-pre-dation environments. American Naturalist 157:126–140.
Reznick, D., and J. A. Endler. 1982. The impact of predation on lifehistory evolution in Trinidadian guppies (Poecilia reticulata). Evo-lution 36:160–177.
Reznick, D. N. 1982. The impact of predation on life history evolutionin Trinidadian guppies: genetic basis of observed life history pat-terns. Evolution 36:1236–1250.
Reznick, D. N., and H. Bryga. 1987. Life-history evolution in guppies(Poecilia reticulata). 1. Phenotypic and genetic changes in an in-troduction experiment. Evolution 41:1370–1385.
Reznick, D. N., H. Bryga, and J. A. Endler. 1990. Experimentallyinduced life-history evolution in a natural population. Nature 346:357–359.
Reznick, D. N., M. J. Butler, F. H. Rodd, and P. Ross. 1996. Life-history evolution in guppies (Poecilia reticulata). 6. Differentialmortality as a mechanism for natural selection. Evolution 50:1651–1660.
Reznick, D. N., and C. K. Ghalambor. 2001. The population ecologyof contemporary adaptations: what empirical studies reveal about
This content downloaded from 128.192.10.126 on Mon, 24 Jun 2013 13:13:58 PMAll use subject to JSTOR Terms and Conditions
Ecosystem Effects of Evolutionary Adaptation 185
the conditions that promote adaptive evolution. Genetica 112:183–198.
Reznick, D. N., F. H. Shaw, F. H. Rodd, and R. G. Shaw. 1997.Evaluation of the rate of evolution in natural populations of gup-pies (Poecilia reticulata). Science 275:1934–1937.
Ricklefs, R. E., and M. Wikelski. 2002. The physiology/life-historynexus. Trends in Ecology & Evolution 17:462–468.
Rodd, F. H., and D. N. Reznick. 1997. Variation in the demographyof guppy populations: the importance of predation and life his-tories. Ecology 78:405–418.
Roughgarden, J. 1971. Density-dependent natural selection. Ecology52:453–468.
Schmitz, O. 2009. Indirect effects in communities and ecosystems:the role of trophic and nontrophic interactions. Pages 289–295 inS. A. Levin, ed. The Princeton guide to ecology. Princeton Uni-versity Press, Princeton, NJ.
Schoener, T. W. 2011. The newest synthesis: understanding the in-terplay of evolutionary and ecological dynamics. Science 331:426–429.
Sinervo, B., E. Svensson, and T. Comendant. 2000. Density cyclesand an offspring quantity and quality game driven by naturalselection. Nature 406:985–988.
Soetaert, K., and T. Petzoldt. 2010. Inverse modelling, sensitivity andMonte Carlo analysis in R using package FME. Journal of StatisticalSoftware 33:1–28.
Steinman, A. D., G. A. Lamberti, and P. R. Leavitt. 2006. Biomassand pigments of benthic algae. Pages 357–380 in F. R. Hauer andG. A. Lamberti, eds. Methods in stream ecology. Academic Press,London.
Stone, L., and A. Roberts. 1991. Conditions for a species to gainadvantage from the presence of competitors. Ecology 72:1964–1972.
Strauss, S. Y. 1991. Direct, indirect and cumulative effects of threenative herbivores on a shared host plant. Ecology 72:543–558.
Strauss, S. Y., J. A. Lau, T. W. Schoener, and P. Tiffin. 2008. Evolutionin ecological field experiments: implications for effect size. EcologyLetters 11:199–207.
terHorst, C. P. 2010. Evolution in response to direct and indirectecological effects in pitcher plant inquiline communities. AmericanNaturalist 176:675–685.
Werner, E. E., and S. D. Peacor. 2003. A review of trait-mediatedindirect interactions in ecological communities. Ecology 84:1083–1100.
Wootton, J. T. 1994. The nature and consequences of indirect effectsin ecological communities. Annual Review of Ecology and Sys-tematics 25:443–466.
Yoshida, T., L. E. Jones, S. P. Ellner, G. F. Fussmann, and N. G.Hairston. 2003. Rapid evolution drives ecological dynamics in apredator-prey system. Nature 424:303–306.
Zandona, E., S. K. Auer, S. S. Kilham, J. H. Howard, A. Lopez-Sepulcre, M. P. O’Connor, R. D. Bassar, et al. 2011. Diet qualityand prey selectivity correlate with life histories and predation re-gime in Trinidadian guppies. Functional Ecology 25:964–973.
Associate Editor: Franz J. WeissingEditor: Mark A. McPeek
1, Common shubunkin, a variety of Carassius auratus; 2, gold and white goldfish, Carassius auratus; 3, variegated medaka, Oryzias latipes;4, rubra platy, Platypoecilus maculatus; 5, male guppy, Lebistes reticulatus; 6, zebra fish, Brachydanio rerio. From “The Development ofHereditary Color Patterns in Fish” by H. B. Goodrich (American Naturalist, 1935, 69:267–277).
This content downloaded from 128.192.10.126 on Mon, 24 Jun 2013 13:13:58 PMAll use subject to JSTOR Terms and Conditions


![Chemical Engineering Journal · [23] Mesocosm Meat processing wastewater Glyceria maxima TN: 46–49 New Zealand [24] Mesocosm Nutrient solution Canna sp., Calamus sp. TN: 76.94;](https://static.fdocuments.us/doc/165x107/60948f4f85c3c96d7a4daeca/chemical-engineering-journal-23-mesocosm-meat-processing-wastewater-glyceria-maxima.jpg)


