Basis of Design Report
310
REGION 5 RAC2 REMEDIAL ACTION CONTRACT FOR Remedial, Enforcement Oversight, and Non-Time Critical Removal Activities at Sites of Release or Threatened Release of Hazardous Substances in Region 5 BASIS OF DESIGN REPORT Lincoln Park/Milwaukee River Channel Sediments Site Milwaukee, Wisconsin Final Remedial Design (Phase I) WA No. 065-RDRD-2508/Contract No. EP-S5-06-01 March 2011 PREPARED FOR U.S. Environmental Protection Agency PREPARED BY CH2M HILL Ecology and Environment, Inc. Environmental Design International, Inc. Teska Associates, Inc. FOR OFFICIAL USE ONLY
Transcript of Basis of Design Report

REGION 5 RAC2R E M E D I A L A C T I O N C O N T R A C T F O R
Remedial, Enforcement Oversight, and Non-Time Critical Removal Activities at Sites of Release or Threatened Release of Hazardous Substances in Region 5
BASIS OF DESIGN REPORTLincoln Park/Milwaukee River Channel Sediments Site Milwaukee, Wisconsin Final Remedial Design (Phase I)
WA No. 065-RDRD-2508/Contract No. EP-S5-06-01
March 2011
PREPARED FOR
U.S. Environmental Protection Agency
PREPARED BY
CH2M HILL Ecology and Environment, Inc. Environmental Design International, Inc. Teska Associates, Inc. FOR OFFICIAL USE ONLY

BASIS OF DESIGN REPORT
LINCOLN PARK / MILWAUKEE RIVER CHANNEL SEDIMENTS SITE Milwaukee, WI
Final Remedial Design (Phase I)
WA No. 065-RDRD-2508 / Contract No. EP-S5-06-01
March 2011

MKE/110050005 III
Contents
Acronyms and Abbreviations ................................................................................................... v 1. Introduction .................................................................................................................. 1-1
1.1 General ................................................................................................................. 1-1 1.2 Site Description ................................................................................................... 1-1
1.2.1 Physical Site Characteristics ................................................................. 1-2 1.3 Project Background ............................................................................................ 1-3 1.4 Recent Investigations ......................................................................................... 1-4 1.5 Remedial Action Objectives .............................................................................. 1-4 1.6 Design ................................................................................................................... 1-5
2. Basis of Design ............................................................................................................. 2-1 2.1 Sediment Characterization ................................................................................ 2-1
2.1.1 Data Evaluation Summary ................................................................... 2-1 2.1.2 Results ..................................................................................................... 2-4
2.2 Moss-American Borrow Material Sampling ................................................... 2-4 2.2.1 Field Activities ....................................................................................... 2-5 2.2.2 Analytical and Geotechnical Results .................................................. 2-5
2.3 Sediment Solidification Treatability Study ..................................................... 2-5 2.3.1 Sampling and Analysis ......................................................................... 2-6 2.3.2 Results ..................................................................................................... 2-7
2.4 Value Engineering Screening ............................................................................ 2-7 2.5 Compliance with Applicable Federal, State, and Local Regulations ......... 2-8
2.5.1 Federal ..................................................................................................... 2-9 2.5.2 State and Local ..................................................................................... 2-12
3. Design Approach, Assumptions, and Parameters ................................................. 3-1 3.1 Site Preparation ................................................................................................... 3-1
3.1.1 Mobilization, Staging, and Temporary Facilities .............................. 3-1 3.1.2 Pre-Excavation Sediment Delineation ................................................ 3-1 3.1.3 Water Bypass Systems .......................................................................... 3-2
3.2 Flow Bypass during Construction .................................................................... 3-3 3.3 Excavation ............................................................................................................ 3-4
3.3.1 Sediment Dewatering ............................................................................ 3-4 3.3.2 Excavation Sequencing ......................................................................... 3-5 3.3.3 Excavation Production Rate ................................................................. 3-6
3.4 Sediment Staging/Decontamination ............................................................... 3-6 3.5 Water Treatment Process ................................................................................... 3-7 3.6 Offsite Disposal ................................................................................................... 3-7 3.7 Creek and Western Oxbow Restoration .......................................................... 3-8
3.7.1 Estabrook Park Dam ............................................................................. 3-8 3.7.2 Hydrology and Hydraulics .................................................................. 3-8 3.7.3 Flood Improvements ............................................................................. 3-8 3.7.4 Stormwater Outfalls and Utility Conflicts ......................................... 3-9 3.7.5 Bank Restoration .................................................................................. 3-10

LINCOLN PARK/MILWAUKEE RIVER—BASIS OF DESIGN REPORT
IV MKE/110050005
3.7.6 Lincoln Creek Bottom Design ............................................................ 3-11 3.7.7 Western Oxbow Bottom Design ......................................................... 3-11 3.7.8 Target Fisheries..................................................................................... 3-12
4. Performance Monitoring and Operations and Maintenance Requirements .... 4-1 4.1 Restoration Operation and Maintenance ......................................................... 4-1 4.2 Water Quality Monitoring and Control ........................................................... 4-1 4.3 Post-excavation Activities .................................................................................. 4-2
5. Project Delivery Strategy ............................................................................................ 5-1 5.1 Remedial Design ................................................................................................. 5-1
5.1.1 Preliminary Design ................................................................................ 5-1 5.1.2 Prefinal/Final Design ............................................................................ 5-1
5.2 Remedial Action .................................................................................................. 5-2 5.3 Subcontract Delivery Strategy ........................................................................... 5-2
6. Construction Schedule ................................................................................................ 6-1 7. Cost Estimate ................................................................................................................ 7-1 8. References ..................................................................................................................... 8-1 Appendixes A Design Specifications (under separate cover) B Design Drawings (under separate cover) C Sediment Modeling D Design Calculations E Moss-American Borrow Material Sampling F Sediment Solidification Treatability Study G Value Engineering Screening H Risk-Based Cleanup I Temporary Earthen and Sheetpile Cutoff Modeling J Hydraulic Modeling K Bank Stabilization L Construction Schedule M Construction Schedule Comparison N Cost Estimate
Figures
1 Site Location Map 2 Lincoln Park/Milwaukee River Wastewater Management Flow Chart
Tables
1 Project Stakeholders ...................................................................................................... 1-2 2 Summary of Estimated Sediment Volume and Mass of PCBs ............................... 2-4 3 Summary of Temporary Cutoff Recommendations ................................................. 3-4 4 Offsite Disposal Volumes ............................................................................................ 3-7

Acronyms and Abbreviations
3D three-dimensional
AOC area of concern
BODR Basis of Design Report
BUI Beneficial Use Impairment
CAA Clean Air Act
CFR Code of Federal Regulations
CWA Clean Water Act
ft3/second cubic feet per second
GAC granular activated carbon
GLNPO Great Lakes National Project Office
HEC-RAS Hydrologic Engineering Centers River Analysis System
mg/kg milligrams per kilogram
mg/L milligrams per liter
MMSD Milwaukee Metropolitan Sewerage District
MVS Mining Visualization System
NPDES National Pollutant Discharge Elimination System
PCB polychlorinated biphenyl
RA remedial action
RCRA Resource Conservation and Recovery Act
RI remedial investigation
SHPO State Historical Preservation Office
SOP standard operating procedure
START Superfund Technical Assessment and Response Team
STN Sullivan International/T N & Associates, Inc., Joint Venture Team
TSCA Toxic Substances Control Act
TSS total suspended solids
USC United States Code
USEPA U.S. Environmental Protection Agency
USFWS U.S. Fish and Wildlife Service
WDNR Wisconsin Department of Natural Resources WPDES Wisconsin Pollutant Discharge Elimination System yd3 cubic yards
MKE/110050005 V

SECTION 1
Introduction
1.1 General The Basis of Design Report (BODR) for the Phase I Lincoln Park/Milwaukee River Channel Sediments Site (Lincoln Park/Milwaukee River Site), Milwaukee Estuary Area of Concern (AOC), in Milwaukee, Wisconsin, has been prepared for the U.S. Environmental Protection Agency (USEPA) Great Lakes National Program Office (GLNPO) under Contract No. EP-S5-06-01. The report includes elements specified in the Statement of Work, dated May 18, 2010, for Work Assignment No. 065-RDRD-2508.
The purpose of the BODR is to establish the remedial design parameters for the remediation of contaminated sediments at the Lincoln Park/Milwaukee River Site. Based on evaluations of the site conditions and potential alternatives and costs, GLNPO and the Wisconsin Department of Natural Resources (WDNR), in consultation with Milwaukee County, selected a remedy for the Lincoln Park/Milwaukee River Site that includes excavation to remove sediments contaminated with polychlorinated biphenyls (PCBs) and offsite disposal of the material.
1.2 Site Description Figure 1 shows the boundaries of the Lincoln Park/ Milwaukee River Site, which is within the Milwaukee Estuary AOC between Lincoln Creek downstream of Green Bay Road, the western oxbow of the Milwaukee River, and the Milwaukee River downstream of the confluence with Lincoln Creek to the Estabrook Park Dam. The Lincoln Park/Milwaukee River Site was divided into five zones during the Estabrook Impoundment sediment remediation pre-design study (WDNR, 2005). The zones (Figure 1) consist of the following:
• Zone 1: Lincoln Creek from Green Bay Road to the confluence with the Milwaukee River
• Zone 2: Entire western oxbow in the Milwaukee River, which contains the main sediment deposit
• Zones 3, 4, and 5: Milwaukee River from the confluence of the western oxbow downstream to Estabrook Park Dam
The remedial design (Phase I) focuses on Zones 1, 2, and the northwestern part of Zone 3. Zones 2 and 3 are divided into subzones 2a, 2b, and 3a for the remedial design as shown in the drawings (Appendix B). Zones 4 and 5 and the remaining portion of Zone 3 will be addressed separately in the future. The Estabrook Park Dam forms the downstream boundary of the Lincoln Park/Milwaukee River Site, and backs up water approximately 2.5 miles to a point 0.3 mile upstream of Silver Spring Road on the Milwaukee River, creating a 103-acre impoundment. The Estabrook Park Dam also has an impact on Lincoln Creek to a point about 0.5 mile upstream of the confluence with the Milwaukee River. The Estabrook Park Dam was built on a limestone outcrop in the river channel in 1936, and has a
MKE/110050005 1-1

LINCOLN PARK/MILWAUKEE RIVER SITE—BASIS OF DESIGN REPORT
hydraulic height of 8 feet and maximum storage of 700 acre-feet. The Estabrook Park Dam, which is owned and operated by Milwaukee County, was historically kept open during the winter and closed in the summer. The water pool behind the Estabrook Park Dam also has historically been lowered in anticipation of high flows. The bottom draw design of the Estabrook Park Dam and periodic opening and closing of the dam has caused some contaminated sediment to be released downstream, and some compaction of the remaining sediment upstream within the impoundment due to dewatering/wetting cycles.
Inspections by WDNR have identified the need for significant repair work on the Estabrook Park Dam. WDNR issued a Repair or Abandon Order to Milwaukee County on July 28, 2009. The order establishes deadlines for Milwaukee County to meet related to outstanding maintenance and repair requirements. The order also gives Milwaukee County the option to decide whether to abandon the dam. The decision for repair or abandonment is the responsibility of Milwaukee County, the owner of the dam. The dam will remain open until it is repaired or abandoned. Table 1 lists the project stakeholders.
TABLE 1 Project Stakeholders Lincoln Park/Milwaukee River Basis of Design Report
Entity Role/Responsibility
Federal
USEPA–GLNPO Lead federal agency
State
Wisconsin Department of Natural Resources
Lead nonfederal sponsor
Local
Milwaukee County Property owner
1.2.1 Physical Site Characteristics The regional geology of the site is dominated by the effects of multiple glacial advances and retreats. Coarse-grained (sand and gravel) glacial outwash deposits predominate along the Milwaukee River, which occupies the course of a former glacial outwash channel. Surface and near-surface deposits outside the area immediately along the Milwaukee River tend to be dominantly fine-grained (silt and clay) glacial till deposits (Sullivan International/T N & Associates, Inc., Joint Venture Team [STN], 2009).
1.2.1.1 Zone 1—Lincoln Creek
Sediment thickness in Lincoln Creek tends to be dominated by coarser-grained sediments like sand and gravel overlain by clay and silt. The thickness and characteristics of the sediments in Zone 1 vary depending on their relative location with respect to main channel flow and the morphology of the underlying substrate. Sediment thickness in Zone 1 varies from less than 1 foot to 4 feet (near the mouth of Lincoln Creek); however, most measured sediment thicknesses within Zone 1 ranged from less than 1 foot to approximately 2 feet.
1-2 MKE/110050005

SECTION 1—INTRODUCTION
1.2.1.2 Zones 2 and 3a—Western Oxbow
The sediment in Zone 2 varies from less than 1 foot to 9.5 feet. Sediments tend to be fine-grained (silts and clays) in the upper interval, and sandy in the lower interval with thin, interbedded sandy intervals of 1 foot or less. Sediment in the main channel is generally sandy with some silt. Variability in soil profiles between adjacent borings indicates the interbedded units are likely limited in horizontal extent.
Bulk characteristic profiling of sediments indicates the fine-grained sample intervals tend to be predominately silts (60 to 70 percent), while the coarse-grained intervals are predominantly fine- to medium-grained sand (greater than 90 percent) (STN, 2009).
1.3 Project Background Contaminated sediment is a major contributor to use impairments within the Milwaukee Estuary AOC (WDNR, 1994). The following Beneficial Use Impairments (BUIs) occur within the AOC:
• Restrictions on fish and wildlife consumption • Degradation of fish and wildlife populations • Fish tumors or other deformities • Bird or animal deformities or reproduction problems • Degradation of benthos • Restrictions on dredging activities • Eutrophication or undesirable algae • Beach closings/recreational restrictions • Degraded aesthetics • Degradation of phytoplankton and zooplankton populations • Loss of fish and wildlife habitat
Fish consumption advisories are in place, such as those in effect from Grafton to the mouth of the Milwaukee River, because of PCB contamination.
A 1997 PCB mass balance study of the site estimated that the Lincoln Park/ Milwaukee River sediments hold over 100,000 cubic yards (yd3) of sediment contaminated with an estimated 5,200 kilograms (11,500 pounds) of PCBs such as Aroclor-1242 (Baird and Associates, 1997). The mass balance study determined the Lincoln Park/Milwaukee River Site contributes the greatest mass loading of PCBs to the Milwaukee River and Harbor, and that remediation of contaminated sediment within the area is expected to result in a long-term reduction in PCB mass transport in the Milwaukee River of up to 70 percent. BUIs specifically associated with the Lincoln Park/Milwaukee River Site include restrictions on fish and wildlife consumption, degradation of fish and wildlife populations, degradation of benthos, and restrictions on dredging activities.
From March 2008 through August 2008, through funding from WDNR, approximately 4,700 yd3 of contaminated sediment/soil was removed from the area immediately adjacent to the Blatz Pavilion Lagoon (Zone 3) and backfilled. The Blatz Pavilion Lagoon area is isolated from the other contaminated areas in Zones 1 through 5 and has easy public access. WDNR selected the Blatz Pavilion Lagoon site to be the first area remediated.
MKE/110050005 1-3
LINCOLN PARK/MILWAUKEE RIVER SITE—BASIS OF DESIGN REPORT
1.4 Recent Investigations The aforementioned WDNR predesign study of the Lincoln Park/Milwaukee River Site began in 2000 under a grant from GLNPO. Water and sediment samples were collected on 12 dates between October 2001 and September 2003. Sediment samples were collected using a core sampler and a Ponar dredge sampler. A total of 246 sediment samples were used to map the occurrence and distribution of PCBs, polynuclear aromatic hydrocarbons, and metals in the impoundment sediments. Other data collected included water depth, sediment thickness, sediment total organic content, and geotechnical characteristics.
GLNPO and the Superfund Technical Assessment and Response Team (START) contractor, STN, conducted additional sediment sampling activities in February 2008 and March 2009 to support the remedial investigation (RI). Additional sediment sampling activities supported assessment of sediment thickness, horizontal and vertical extent of PCB contamination, and the nature of the contaminants. In February 2008, 33 sediment samples were collected from Zone 2 for chemical and physical analysis. In March 2009, 18 sediment samples were collected from Zones 1, 2, and 3 for chemical analysis. In addition, sediment thickness was surveyed at over 250 locations in Zones 1 and 2 using direct-push technology and manual poling techniques. The results of the investigation are summarized in the Final Focused Remedial Investigation (STN, 2009).
A feasibility study was conducted in December 2009. The Feasibility Study Report (CH2M HILL, 2009) presents the remedial action (RA) objectives, technology screening, and alternatives development and evaluation. Following submittal of the report, GLNPO and WDNR (in consultation with Milwaukee County) selected a remedial alternative.
1.5 Remedial Action Objectives Based on previous evaluations of the site conditions, feasible alternatives, potential costs, and input from federal, state, and local stakeholders, an excavation and offsite disposal remedy will be implemented at the Lincoln Park/Milwaukee River Site. The purpose of the remediation project is to address the following RA objectives:
• Support removal of BUIs within the Milwaukee Estuary AOC:
− Fish and wildlife consumption advisories − Degradation of benthos − Restrictions on dredging − Degradation of fish and wildlife habitat
• Minimize potential human health and environmental risks associated with remedial activities, to the extent practical.
• Upon completion of remedial activities, improve habitat of the site through restoration efforts.
An RA level of 1 milligram per kilogram (mg/kg) or part per million PCB in sediment was determined for the Lincoln Park/ Milwaukee River Site. The level is consistent with what was established previously at other reaches within the Milwaukee Estuary AOC (Blatz
1-4 MKE/110050005

SECTION 1—INTRODUCTION
Pavilion Site [NRT, 2007]) and is considered to be protective to human health and the environment.
1.6 Design Excavation and offsite disposal supports removal of BUIs within the Milwaukee Estuary AOC and delisting of the AOC by removing the contaminated sediment from the site and improving the habitat in the area after the RA is complete. In addition, excavation and offsite disposal is beneficial in minimizing residual risk and the transport of contaminated sediment downstream.
The selected RA consists of the following main activities:
• Mechanical excavation and dewatering/solidifying of sediment • Water treatment • Offsite disposal • Habitat restoration
Sediment contaminated with PCBs at concentrations exceeding 1 mg/kg will be excavated using mechanical rather than hydraulic methods because of the shallow water depth across the site (including exposed sediments) and the feasibility of dewatering the targeted portions of the site. The target excavation areas will be isolated to prevent the downstream migration of contaminated sediment during excavation by installing temporary sheet pile at the north and south Milwaukee River confluences and temporary sheet pile or earthen cutoffs at the confluence of Lincoln Creek and the western oxbow. A temporary bypass system for Lincoln Creek will also be necessary. Measures will be taken to avoid impacts to threatened and endangered species according to guidelines. Sediment with in situ PCB concentrations less than 50 mg/kg will be disposed of in a Subtitle D solid waste facility. Sediment with in situ PCB concentrations equal to or greater than 50 mg/kg will be disposed of at a facility permitted to accept Toxic Substances Control Act (TSCA) waste.
Surveys will be conducted periodically during the work to verify the target excavation depths are being attained. Post-excavation sediment verification sampling of PCB concentrations will be performed and analyzed using an onsite mobile laboratory.
Solidification testing performed both onsite and in a laboratory indicates that most sediment passes the paint filter test without a drying agent. However, some sediment in the main channels of Lincoln Creek and the Milwaukee River may require further solidification prior to disposal at the time of excavation to meet landfill requirements. If necessary, this sediment will be mechanically mixed in place with a drying agent and loaded directly into trucks for offsite disposal (non-TSCA material) or placed on a staging pad before loading into trucks (TSCA material).
Water encountered during the RA will be managed in three different ways. Water that is diverted before entering the limits of work or water that is gravity drained from undisturbed areas within the limits of work will be discharged to the Milwaukee River with energy dissipation at the outfall. Water (surface water, precipitation, or groundwater) that enters disturbed areas within the work area will be treated to remove total suspended solids (TSS), or TSS and PCBs, depending on circumstances of the work, and discharged to the Milwaukee River with energy dissipation at the outfall under the Chapter 30 permit or
MKE/110050005 1-5

LINCOLN PARK/MILWAUKEE RIVER SITE—BASIS OF DESIGN REPORT
1-6 MKE/110050005
individual WPDES Wastewater Discharge permit. Wastewater generated during decontamination of trucks and equipment, or from the dewatering process on the staging pad, or precipitation that falls on the staging pad, will be treated for TSS and PCBs and discharged to the Milwaukee River with energy dissipation at the outfall under the individual WPDES wastewater discharge permit. Treatment will consist of sand filters and granular activated carbon (GAC).
Restoration will include stream bank stabilization and grading to shape the post-excavation surface in some locations. Stream bank stabilization will include plantings to support re-establishment of vegetation and long-term slope stability. Existing outfalls will be protected and maintained and, in some cases, additional rock aprons will be constructed to minimize erosion.
Disruption to the benthic community will occur during the excavation activities. This is unavoidable, and re-establishment of aquatic organisms will occur naturally after the remedial activities and restoration activities have been completed.
Appendix A contains design specifications, and Appendix B contains design drawings.

SECTION 2
Basis of Design
This section summarizes the technical parameters upon which the design is based.
2.1 Sediment Characterization The findings of the field investigation relative to the nature and extent of contamination in the Lincoln Park/Milwaukee River Site are summarized below and described in further detail in the Final Focused Remedial Investigation (STN, 2009). The highest PCB concentrations were observed in sediment from the western oxbow lagoon (Zone 2) and on the west bank of the Milwaukee River below the oxbow (Zone 3). In Zone 2, PCB concentrations are generally higher at depth when compared to PCB concentrations in the surface sediment. The concentrations at depth do not generally correlate with surface sediment concentrations, consistent with the depositional nature of the area. The average PCB concentration in Zone 1 was 1.52 mg/kg. The average PCB concentration in Zone 2 varied by subsection. The average concentration in Zone 2a was 29.3 mg/kg. The average concentration in Zone 2b was 6.76 mg/kg. The average concentration in Zone 3a was 6.87 mg/kg.
2.1.1 Data Evaluation Summary The RI data were evaluated by using a three-dimensional (3D) interpolation method to delineate the horizontal and vertical extent of sediment containing total PCB concentrations equal to or greater than 1 mg/kg, and equal to or greater than 50 mg/kg. The computer application Mining Visualization System (MVS) v9.22 by CTECH (www.ctech.com) was used to interpolate PCB concentrations. The PCB concentration distribution was modeled within a 3D mesh using a geostatistical process called kriging. The models use expert systems to analyze the spatial distribution and number of field data points; construct a multidimensional variogram, which is a best fit to the dataset being analyzed; and then perform kriging in the domain of the model. One of the fundamental design criteria used in developing the variogram and kriging algorithms was to produce modeled distributions that honor the measured distributions as closely as possible.
2.1.1.1 Chemical Dataset
The dataset included analytical results from sediment core samples collected from 2001 through 2003, as well as 2008 and 2009, resulting in 187 samples from 94 locations (CH2M HILL, 2009). Sediment grab samples collected to represent sediment surface concentrations were not included within the dataset as they are not representative of concentrations within the entire sediment profile and therefore could lead to skewed model results at depths greater than 0.5 foot. This resulted in eliminating two grab sample locations (5 × 1 and 5 × 3) within Zone 1 originally collected by WDNR in 2003.
MKE/110050005 2-1

LINCOLN PARK/MILWAUKEE RIVER SITE—BASIS OF DESIGN REPORT
2.1.1.2 Surveys and Volume Estimates
During February 2008 and March 2009, START conducted sediment sampling activities in support of the RI. The sampling activities are described in detail in the Final Focused Remedial Investigation report (STN, 2009). Sampling was conducted primarily in Lincoln Creek (Zone 1) and the western oxbow (Zones 2 and 3a) to determine sediment thickness, horizontal and vertical extent of PCB contamination, and the nature of contaminants.
During the February 2008 sampling event, 33 sediment samples for PCB analysis from varying depths were collected from the western oxbow area at 12 locations. A few samples were analyzed for bulk properties, including specific gravity, moisture content, and Atterberg limits. In addition to sampling, sediment thickness was determined using direct-push technology equipment and manual probing techniques. Each of the sampling and probing locations was surveyed. During the March 2009 sampling, 7 sediment samples from 6 locations in Lincoln Creek (Zone 1), and 11 samples from 6 locations in the western oxbow (Zones 2 and 3a) were collected for PCB analysis. Sediment bathymetric and thickness surveys conducted in Zones 1, 2, and 3a were determined using manual poling at over 300 locations. All sampling and poling locations were surveyed to document their spatial coordinates. The horizontal control used was the Wisconsin Height Modernization monument by I-43 and Hampton Avenue. The vertical control used was the chiseled cross on the bridge over the river at Hampton Avenue, just north of the Blatz Pavilion.
In June and October 2010, topographic survey data were collected along Lincoln Creek and the western oxbow of the Milwaukee River in Lincoln Park. The data were used to support restoration design of the creek and oxbow, including hydraulic modeling of the areas to evaluate construction sequencing and restoration effects on flood levels in and adjacent to the Lincoln Park/Milwaukee River Site. The survey data were collected in North American Vertical Datum of 1988, but were converted to National Geodetic Vertical Datum of 1929 (used for design elevations) to be consistent with Milwaukee County survey data and the hydraulic models. The surveying effort consisted of the following:
• Cross Sections
− Elevation changes of 6 inches or less were measured on cross sections in Lincoln Creek and the western oxbow of the Milwaukee River in Lincoln Park, at all grade breaks and at frequent spacing.
− 10 cross sections were completed along Lincoln Creek, including 4 at the antenna bridge.
− 11 cross sections were completed along the western oxbow of the Milwaukee River, including 2 at the northern bridge along the Milwaukee River Parkway and 4 at the southern bridge.
• Profiles
− A profile was created of the Lincoln Creek thalweg (deepest continuous line along the channel) and water surface from 200 feet upstream of the Green Bay Avenue Bridge to the confluence with the western oxbow.
2-2 MKE/110050005

SECTION 2—BASIS OF DESIGN
− A thalweg and a water surface profile were created of the channel in the western oxbow of Lincoln Park from 200 feet upstream of the northern bridge on the Milwaukee River Parkway to 200 feet downstream of the southern Milwaukee River Parkway Bridge (200 feet downstream of the confluence with the main stem of the Milwaukee River, near the Blatz Pavilion).
− Thalweg data points were collected at all grade breaks and at frequent spacing to capture elevation changes of 6 inches or less. Water surface data points were collected at all grade breaks and frequent spacing to capture elevation changes of less than 2 inches.
• Miscellaneous Structures
− Storm sewer outfalls, bridge abutments, communication conduits that cross Lincoln Creek, and similar structures were surveyed to locate the coordinates of the structures and to identify their elevations.
The 2010 survey data combined with the 2008 and 2009 survey data were used to develop the top of sediment elevations for the design area.
2.1.1.3 Interpolation Methods
Key attributes of the MVS-based interpolation approach for delineation of the extent of PCB concentrations are discussed in this subsection.
Total PCB concentrations were represented as point values located at corresponding horizontal coordinates (northing and easting) for each sampling station. The vertical position was represented by the sample midpoint depth below the top of the sediment surface. Analytical results from quality assurance/quality control samples were excluded.
Interpolation of PCB data was performed within a 3D mesh representing each individual zone (Zones 1, 2, and 3a). One 3D mesh was used for Zone 1 (Lincoln Creek), two separate 3D meshes for Zone 2 resulting in two subzones (Zones 2a and 2b), and one 3D mesh for Zone 3 (Zone 3a). During interpolation to each of the 3D meshes, the complete PCB dataset was used to prevent potentially different interpolation results at zone and subzone boundaries.
The 3D meshes of each zone and subzone were constructed with a normalized, flat-top sediment surface, which was necessary because PCB concentrations were correlated with sediment stratigraphy measured in depth, rather than elevation. The lower boundary of the 3D mesh was defined by the bottom of the sediment surface as determined by probe refusal reported for 267 locations collected in 2008 and 2009 (CH2M HILL, 2009). The resultant mesh thickness at each horizontal coordinate approximates the sediment thickness as determined by the probe refusal depths.
Each zone-specific model was built on convex hull-bounded grids limited to the areal extent of each subzone with Z-spacing at each grid node set to a maximum depth of 0.5 foot to represent the minimum sample interval and provide appropriate vertical resolution of the 3D mesh.
MKE/110050005 2-3

LINCOLN PARK/MILWAUKEE RIVER SITE—BASIS OF DESIGN REPORT
The selected grid density used within each zone and subzone was a compromise between providing the highest detailed resolution and maintaining reasonable model run times. Model grid resolution was also limited by the spatial density of field data and resulted in the following grid resolutions: Zone 1 = 100 × 200 nodes, Zones 2a and 2b = 100 × 100 nodes, and Zone 3a = 100 × 50 nodes.
2.1.2 Results Once the 3D distribution of PCB concentrations was modeled, the area and volume of sediment with PCB concentrations equal to or greater than 1 mg/kg was calculated using the MicroStation Geopak tool using survey data discussed in Section 2.1.1.2. Sediment volume with PCB concentrations equal to or greater than 50 mg/kg was estimated from the MVS model and includes the volume of sediment out to the nearest sample locations that are less than 50 mg/kg. Table 2 summarizes the area, volume of sediment, and total mass of PCBs at concentrations equal to or exceeding 1 and 50 mg/kg. Appendix C contains a visual representation of this information and Appendix D contains the calculations. Volumes reported include material to be removed associated with 3:1 (horizontal to vertical) side slopes to account for typical construction methods and overburden sediment required to be removed above the sediment exceeding the target PCB concentration.
TABLE 2 Summary of Estimated Sediment Volume and Mass of PCBs Lincoln Park/Milwaukee River Basis of Design Report
Zone
Total Sediment Volume
(yd3)
Lateral Area Exceeding 1 mg/kg
(ft2)
Volume >1 and < 50 mg/kg
(yd3)
Volume > 50 mg/kg
(yd3)
Total Mass of PCBs (lb)
1 9,300 271,700 9,200 0 39
2a 42,000 287,300 23,700 9,100 2,685
2b 56,500 463,700 38,100 4,600 807
3a 11,900 135,500 11,300 600 228
Total 119,700 1,158,200 82,300 14,300 3,759
Notes:
yd3 = cubic yards ft2 = square feet lb = pound
2.2 Moss-American Borrow Material Sampling The Moss-American Site comprises 88 acres at the intersection of Brown Deer and Granville Roads on the northwest side of Milwaukee, WI. The site includes a former creosote facility, in operation from 1921 to 1976, which operated as a wood-preserving facility treating railroad ties with a creosote and fuel-oil mixture. Contaminants of concern include polychlorinated aromatic hydrocarbons and organic compounds such as benzene, toluene, ethyl benzene, and xylene. The remedy included excavation and treatment of contaminated
2-4 MKE/110050005

SECTION 2—BASIS OF DESIGN
soils, removal, and offsite disposal of contaminated sediments from the Little Menomonee River, and collection and treatment of contaminated site groundwater. A field investigation was conducted on April 29, 2010, in accordance with the Moss American Stockpile Soil Sampling Plan (CH2M HILL, 2010a). The purpose of the investigation was to collect data to characterize the chemical and physical characteristics of the Moss-American Superfund Site stockpiled soil sources for potential reuse during the RA at the Lincoln Park/Milwaukee River Site. Three separate stockpiles were considered and sampled for potential material reuse and consisted of the Leon stockpile (9,500 yd3), Calumet access road (1,900 yd3), and Calumet soil stockpile (16,800 yd3). Potential reuse options during the Lincoln Park/Milwaukee River Site RA include the following two primary uses:
1. Fill material such as shoreline restoration.
2. Construction of haul roads, equipment staging pads, and material handling pads in designated upland areas.
2.2.1 Field Activities Procedures and methodologies for collecting soil samples were consistent with the Field Sampling Plan. Each sample was collected for chemical and geotechnical analysis including PCB aroclors, SVOCs, pesticides, herbicides, target analyte list metals, total organic carbon, and particle size. Sampling included collecting 10 soil samples from the 3 stockpiles at the Moss-American Superfund Site (Appendix E). Three samples (MA-SO01-1.0/2.0, MA-SO02-2.0/3.0, and MA-SO03-3.0/4.0) were collected within the Leon stockpile consisting of used road base material. Three samples (MA-SO04-1.0/2.0, MA-SO05-1.0/2.0, and MA-SO06-1.0/2.0) were collected within the Calumet access road to represent an estimated 1,500 feet of road base material. Four samples (MA-SO07-1.0/2.0, MA-SO08-1.0/2.0, MA-SO09-1.0/2.0, and MA-SO10-1.0/2.0) were collected within the Calumet soil stockpile to represent an estimated 16,800 yd3 of excavated flood plain soil.
2.2.2 Analytical and Geotechnical Results Summarized geotechnical data and analytical data are provided in Tables E-1 and E-2, respectively, in Appendix E. Analytical data results were each compared to their respective Threshold Effect Concentration values of the WDNR sediment quality guidelines. Threshold Effect Concentration is defined as the upper limit concentration in sediments at which toxicity to benthic dwelling organisms are predicted to be unlikely. Analytical results from the 10 samples collected within the stockpiles are below their respective Threshold Effect Concentration values (Table E-2).The results indicate that the stockpiled soils at the Moss-American Site are an acceptable source of borrow materials for the Lincoln Park/Milwaukee River Site.
2.3 Sediment Solidification Treatability Study A sediment solidification treatability study was conducted to support evaluation of the sediment at the site. The overall objective of the sediment treatability study was to evaluate whether the sediments will dewater naturally (by gravity drainage) in a timely manner as to enable them to be directly loaded and acceptable for landfill disposal; and if not, then determine the percentage of solidification amendment and type of solidification amendment
MKE/110050005 2-5
LINCOLN PARK/MILWAUKEE RIVER SITE—BASIS OF DESIGN REPORT
to render the excavated sediment acceptable for landfill disposal. Amendments used in the study were selected based on evaluating a range of types of materials for consideration during construction. The study is summarized below and additional details are provided in the Sediment Solidification Treatability Study Summary (Appendix F).
The specific objectives were the following:
1. Determine the minimum amount of dewatering time needed to pass a paint filter test and physical properties of the mixed material (slump, unconfined compressive strength, and moisture content) to characterize it for mechanical handling, transportation, and disposal at the disposal facility.
2. Determine the minimum percentage by weight or by volume depending on the drying agent required to be mixed with the sediment that will result in passing a paint filter test both when the mixed material is loaded into the truck and when the mixed material arrives at the disposal facility.
2.3.1 Sampling and Analysis Sampling activities included collecting sediment samples from each of the zones representative of the depth of sediment to be excavated and transported for offsite disposal. Sediment samples collected at each location were sent to CH2M HILL’s Applied Sciences Laboratory for testing in accordance with the Sediment Solidification Treatability Study Field Sampling Plan (CH2M HILL, 2010b) standard operating procedure (SOP) No. 1 and were used for onsite field testing in accordance with SOP No. 2. The activities and results are summarized in Appendix F.
Sediment samples were collected from 14 locations. Two sediment samples in the same area were combined to make seven total samples for testing. The raw untreated sediment was analyzed by the laboratory for grain size, percent moisture, and paint filter (pass/not pass). In addition, the raw untreated sediment was mixed in the laboratory with three proportions (5, 10, and 15 percent) of Portland Cement and three proportions (1, 2, and 3 percent) of superabsorbent polymer to determine the minimum percentage to pass paint filter and to support evaluation of the curing time and compressive strength for placement in the landfill. A detailed description of the procedure is provided in SOP No. 1 (Appendix F).
In addition, paint filter and slump testing was conducted onsite on the raw untreated sediment. Slump testing supported evaluation of initial strength of the sediment in comparison to landfill requirements for slump. Initial paint filter tests were conducted after the sample was collected. If the sediment failed initial paint filter testing, it was mixed onsite with three different proportions (10, 20, and 30 percent) of sawdust and used to determine the moisture content and slump. Sawdust was tested in the field because the mixture is based on volume rather than weight, resulting in a more qualitative approach to testing and implementation during construction. In addition, the volume of sediment and sawdust estimated to be required to conduct the testing is more cost effectively managed in the field than shipping it to a laboratory. Subsequent paint filter tests (if initial test failed) were completed within 24 hours. The tests were performed onsite by the field team and helped determine the proportion of the sawdust (if any) that to reduce the moisture content and the slump. A detailed description of the procedure is provided in SOP No. 2 (Appendix F).
2-6 MKE/110050005
SECTION 2—BASIS OF DESIGN
2.3.2 Results With the exception of one field sample, the sediment samples passed paint filter without the addition of a drying agent in the field and the laboratory. The seventh sample passed paint filter after 1 day (Appendix F). Moisture content of the sediment samples generally correlates with the proportion of silt/clay in the sediment. The greater the percentage of silt/clay in the sediment, the greater the moisture content because the silt/clay holds the moisture.
Sawdust as a drying agent showed the shortest time to pass paint filter using a mixture of 30 percent by volume when compared to the other proportions. Slump tests were generally 2 inches or less, except for LP-SB-01-02, when mixed with sawdust, indicating sediment will pass typical landfill criteria of 2 inches or less (specific landfill requirements to be determined). The addition of PC reduced the moisture content, whereas the addition of SAP generally did not change the moisture content of the sediment. The addition of PC increased the strength of sediment that contains greater than 50 percent silt/clay, but did not increase the strength of sediment with greater than 50 percent sand and gravel. The addition of SAP did not increase the strength of the sediment.
2.4 Value Engineering Screening The planned scope of the value engineering screening included an evaluation of cost and functional relationships, concentrating on high-cost areas. Following development of the preliminary design, the scope of the value engineering screening was modified in discussions with USEPA.
The value engineering screening focused on specific components of the design and associated alternatives or improvements to these components. The specific components included dewatering and Lincoln Creek bypass during the RA, sustainability during and after the RA, and restoration after the construction. The value engineering screening was performed by an independent technical review team from CH2M HILL that was otherwise not participating in the remedial design. The results of the value engineering screening are summarized in a screening table in Appendix G. The table includes a description of each item, benefits, drawbacks, relative potential cost savings, and comments. Items evaluated for incorporation into the design are discussed below.
• Use products with recycled and bio-based (instead of petroleum-based) contents. Recycled and bio-based fuels help to reduce emissions from internal combustion equipment and vehicles. The RA will include excavation equipment and trucking to and from disposal facilities, so use of alternative fuels to reduce emissions can provide a significant overall reduction in emissions. However, accessibility of fuel may be limited and cost of fuel may outweigh the emissions benefit. Therefore, this will be incorporated into the subcontractor bid package as an optional item, and one that will be used to differentiate subcontractors during the bidding process.
• Establish minimally intrusive and well-designed traffic patterns for onsite activities and plans to reduce offsite traffic congestion. Avoid tree removal in staging areas or intermittent uncontaminated zones, and retrieve and transplant native, noninvasive plants. Traffic patterns and access points for onsite activities will be restricted by the locations of floodplains, wetlands, and cultural resources as well as park facilities. In
MKE/110050005 2-7

LINCOLN PARK/MILWAUKEE RIVER SITE—BASIS OF DESIGN REPORT
addition, the TSCA staging pad is located to minimize tree removal. Restrictions and proposed locations are indicated on the drawings; however, the design is structured to allow subcontractor flexibility where appropriate. Traffic patterns and staging areas will be proposed by the subcontractor and approved by USEPA, WDNR, and Milwaukee County.
• Plan for elimination of treatment train components that will become unnecessary if site conditions change and/or bench-scale test alternative chemicals to warrant change. Elimination of treatment train components can reduce the cost of operation and maintenance. Wastewater streams for the project will include treatment for TSS or treatment for TSS and PCBs. A flowchart has been developed to support management of the wastewater stream. The flowchart provides options to reduce treatment train components based on field observations. The chart will be incorporated into the site plans and permit applications.
• Use superabsorbent polymer instead of other solidification material. Superabsorbent polymer results in reduced volume and weight when considered against several other drying agents because it provides similar effectiveness at a smaller percentage. However, the cost of superabsorbent polymer compared to other drying agents is higher and may outweigh the reduced volume and weight. Superabsorbent polymer is currently being evaluated as a drying agent in the sediment solidification treatability testing.
• Avoid over compaction of banks as a result of construction work. Overcompaction of banks will hinder establishment of vegetation. Therefore, the specifications are being used to prevent over compaction hindering future establishment of vegetation.
• Plan for managing the transition period between restoration and Estabrook Park Dam repair/operation. Site conditions, regulations, and technology options may change during the period following restoration and may differ significantly from those considered during the time of design. Monitor these changes and periodically reevaluate these practices annually. The design assumes a backwater environment, but the schedule for Estabrook Park Dam repair and operation has not yet been determined. As a result, the period between restoration and dam operation may affect the viability of restoration components. The design balances the need to provide instant stabilization in the near term while accounting for this area being submerged once the dam is closed to create the impoundment.
2.5 Compliance with Applicable Federal, State, and Local Regulations
The Feasibility Study Report, Lincoln Park/Milwaukee River Channel Sediments Site, Milwaukee Estuary Area of Concern (CH2M HILL, 2009) identified the potentially applicable federal, state, and local regulations applicable to the RA. The list was refined based on the review of recent site data and specific components of this design project. The regulations that affect the implementation of the RA at the Lincoln Park/Milwaukee River Site are related to specific components of the project and are discussed below.
2-8 MKE/110050005
SECTION 2—BASIS OF DESIGN
2.5.1 Federal
2.5.1.1 Resource Conservation and Recovery Act
The Resource Conservation and Recovery Act (RCRA) was passed in 1976 and amended by the Solid Waste Disposal Act by including provisions for hazardous waste management, under 42 United States Code (USC) §321 et seq. RCRA controls the management of hazardous waste from inception to ultimate disposal. RCRA applies to RAs that generate hazardous waste.
Sediment to be excavated within the Lincoln Park/Milwaukee River Site do not have to be managed as containing listed hazardous waste because specific documentation of the release of a listed waste to the sediments is not available and because the sediments are not characteristic waste. For these reasons, RCRA is not a requirement for contaminated sediments if the sediments are remediated under the Clean Water Act (CWA) Section 404. RCRA specifically excludes sediments managed under a Section 404 permit, as follows:
40 CFR 261(g). Dredged material that is not a hazardous waste. Dredged material that is subject to the requirements of a permit that has been issued under 404 of the Federal Water Pollution Control Act (33 USC 1344) or Section 103 of the Marine Protection, Research, and Sanctuaries Act of 1972 (33 USC 1413) is not a hazardous waste.
Therefore, requirements for hazardous waste and hazardous waste facilities under 40 Code of Federal Regulations (CFR), Parts 260 through 264, do not need to be met and are not requirements for the dredged sediment. In addition, land disposal restrictions only apply to hazardous wastes that are intended for land disposal, and because the sediments are not hazardous waste, these restrictions do not apply and are not requirements for the sediment.
2.5.1.2 Toxic Substances Control Act
TSCA regulates the remediation of soil contaminated with PCBs under 40 CFR 761.61(a), Self-implementing On-site Cleanup and Disposal of PCB Remediation Waste; however, this section specifically excludes remediation of sediment from the self-implementing rules. As a result, the TSCA self-implementing rules are not requirements for the Lincoln Park/Milwaukee River Site. Contaminated sediments are addressed under 40 CFR 761.61(b), Performance-Based Disposal per instruction from USEPA’s GLNPO. Application for risk-based disposal approval and a risk-based evaluation were prepared by CH2M HILL for USEPA (Appendix H). A TSCA Notification and Certification is being prepared separately in consultation with USEPA Region 5 Land and Chemicals Division and GLNPO risk assessment personnel. That documentation will be submitted by GLNPO with the final cleanup plan to satisfy the risk-based disposal notification provisions of TSCA.
TSCA also requires materials contaminated with PCBs at concentrations of 50 mg/kg or greater to be disposed of at either a hazardous waste landfill permitted under RCRA or at a chemical waste landfill permitted under TSCA. The sediment removed from the Lincoln Park/Milwaukee River Site with PCBs at in situ concentrations of 50 mg/kg or greater will be disposed of according to the TSCA requirements. Currently, it is estimated that approximately 14,300 yd3 of sediment to be removed exceeds 50 mg/kg at the Lincoln Park/Milwaukee River Site.
MKE/110050005 2-9

LINCOLN PARK/MILWAUKEE RIVER SITE—BASIS OF DESIGN REPORT
During excavation activities, the subcontractor will handle and stockpile TSCA sediments separately from non-TSCA sediments for the duration that TSCA sediments remain on site until disposed of at a facility permitted to accept TSCA waste. TSCA also states that soil contaminated with PCBs at concentrations of 50 mg/kg or greater in bulk may be stored onsite for up to 180 days (40 CFR 761.65), provided that controls are in place for prevention of dispersal by wind or generation of leachate. The storage site requirements include a foundation below the liner, a liner, a cover, and a run-on control system. The project will be designed to meet the requirements for storage of sediment with concentrations of 50 mg/kg or greater. Storage of the sediment will include controls to prevent dispersal by wind and minimize generation of leachate. In addition, sediment storage areas include a foundation and a stormwater run-on control system.
2.5.1.3 Clean Air Act
The Clean Air Act (CAA), 40 CFR, Parts 50 through 99, is intended to protect the quality of air and to promote public health. Title I of the Act directs USEPA to publish national ambient air quality standards for “criteria pollutants.” The National Ambient Air Quality Standards, Section 109, provides specific requirements for air emissions including, but not limited to, particulates, volatile organic compounds, and hazardous air pollutants. USEPA also has provided national emission standards for hazardous air pollutants under Title III of the CAA. Hazardous air pollutants are designated hazardous substances under the Comprehensive Environmental Response, Compensation, and Liability Act. The CAA amendments of 1990 greatly expanded the national emission standards for hazardous air pollutants by designating 179 new hazardous air pollutants and directing USEPA to attain maximum achievable control technology standards for emission sources.
Activities that can cause particulate emissions include sediment stabilization if drying reagents such as sawdust or Portland Cement are used, and stockpiling of dewatered TSCA sediments at the staging/dewatering pad prior to transportation. Although airborne particulates associated with stabilization and dewatering techniques are not likely to be generated, some airborne particulates may be created if sediments dry before disposal. Therefore, best available dust suppression practices, such as spraying with clean water and covering sediment and soil stockpiles, will be used, as necessary, to control potential particulate emissions. A plan to mitigate dust during the RA will be included as part of the site management plan and health and safety plan.
Based on discussions with the WDNR and the permits previously required for the Blatz Pavilion RA, no state or federal air quality permits are required for this project. It is currently WDNR’s recommendation that air construction/operation permits for compliance with NR 406, 407, and 445 are inapplicable because no active treatment will be performed on the sediments that could result in air emissions.
2.5.1.4 Clean Water Act
The CWA, 33 USC §1251 to 1376 and 33 CFR Part 323, provides regulations for the discharge of pollutants into the waters of the United States. The CWA required USEPA to set water quality standards for all contaminants in surface waters and requires that permits be obtained for the discharge of pollutants from a point source into navigable waters. The CWA also regulates dredged and fill discharges to waters or jurisdictional wetlands.
2-10 MKE/110050005

SECTION 2—BASIS OF DESIGN
Regulations promulgated under the authority of the CWA require permits for dredging or excavating sediments in navigable water. The applicable permits include the Section 404 and 401 permits authorized by the United States Army Corps of Engineers and are included as part of the Chapter 30 joint permit application discussed in Section 2.5.2.1.
The National Pollutant Discharge Elimination System (NPDES) is a federal program that originated in the CWA, but has since been delegated to the states. WDNR is authorized to administer the NPDES permit program, which requires permits for the discharge of treated municipal effluent, treated industrial effluent, and stormwater. In Wisconsin, the discharge permit program is called the WPDES. Stormwater discharge from the project area will be regulated under a WPDES construction stormwater permit as well as local stormwater regulations. Wastewater managed during the RA will be discharged under an individual WPDES permit. Based on the WPDES permit criteria, it is likely that WPDES limits for TSS and PCBs in water will be set at 10 to 40 milligrams per liter (mg/L) and 0.8 micrograms per liter, pending the wastewater source. Additional information regarding state and local WPDES stormwater and wastewater discharge requirements are discussed in Sections 2.5.2.2 and 2.5.2.3, respectively.
2.5.1.5 Fish and Wildlife Coordination Act
The Fish and Wildlife Coordination Act, 50 CFR, Part 402, and 16 USC §661 et seq., §742a, and §2901, was enacted to protect the present fish and wildlife when actions result in the control or structural modification of a natural stream or body of water. The statute requires that any action taken involves consideration of the effect that water-related projects would have on fish and wildlife, and that actions are made to prevent loss or damage to these resources. To comply with these requirements, CH2M HILL consulted with the U.S. Fish and Wildlife Service (USFWS) and WDNR regarding the impacts on fish and wildlife resources and measures to mitigate these impacts. The details of these consultations will be documented in the Wisconsin Chapter 30 permit application.
2.5.1.6 Endangered Species Act
The Endangered Species Act of 1973, 16 USC §1531 et seq. and 15 CFR, Part 930, requires that federal agencies ensure that any action authorized, funded, or carried out by the agency is not likely to jeopardize the continued existence of any threatened or endangered species and will not destroy or adversely modify critical habitat. CH2M HILL reviewed the USFWS technical assistance website for federally listed threatened and endangered species. According to the website, no federally listed threatened or, endangered, or candidate species are known to occur in Milwaukee County (USFWS, 2010).
WDNR has initiated a Natural Heritage Inventory search for known state-listed threatened or endangered species and habitats within the Lincoln Park/Milwaukee River Site. WDNR identified two species, Butler’s gartersnake (Thamnophis butleri) and greater redhorse (Moxostoma valenciennesi), as potentially occurring within the Milwaukee River near the project vicinity. Management of Butler’s gartersnake will occur through implementation of Tier 1 Voluntary Actions (WDNR, 2005) for protecting Butler’s gartersnake habitat during the RA, as well as a WDNR-granted incidental take authorization. Although the Natural Heritage Inventory review revealed the presence of the greater redhorse within the vicinity of the Milwaukee River, the habitat within the immediate project area was determined by the
MKE/110050005 2-11

LINCOLN PARK/MILWAUKEE RIVER SITE—BASIS OF DESIGN REPORT
WDNR to be not suitable for the greater redhorse, and, therefore, no mitigation is required for this species. The details of these consultations will be documented in the Wisconsin Chapter 30 permit application.
2.5.1.7 National Historic Preservation Act
The National Historic Preservation Act, 16 USC §661 et seq. and 36 CFR, Part 800, provides protection and procedures for preserving scientific, historical, and archaeological data (cultural resources) that might be destroyed. In implementing the RA, adverse effects to cultural resources are to be avoided. Areas having the potential for cultural resources have been identified within portions of the Lincoln Park/Milwaukee River Site. Those locations are limited to stream banks and not within the waterways. Per the Wisconsin State Historical Preservation Office (SHPO) requirements, areas within the project site not previously cleared for cultural resource will undergo a Phase I archaeological reconnaissance survey in spring 2011, prior to the remedial activities. In preparation for the Phase I field investigation, CH2M HILL has submitted a Wisconsin Public Lands Field Archaeological Permit application to the Wisconsin SHPO. Following the Phase I survey, CH2M HILL will prepare a report to meet guidelines established by the Wisconsin SHPO and submit required documentation as part of the Chapter 30 permit application package (Section 2.5.2.1).
2.5.2 State and Local
2.5.2.1 Wisconsin Chapter 30 Permit Sections 30.12 (Structures and deposits in navigable waters) and 30.20 (Removal of material from beds of navigable waters) contained in Chapter 30 of the Wisconsin State Statutes requires permits for work performed in navigable waterways such as, removal of materials and placement of structures (such as fill material, steel sheet pilings, and coffer dams, etc.) within the bed of a waterway as well as impacts to wetlands. The Chapter 30 permit is also a joint state/federal permit application submitted through the WDNR, which incorporates the requirements of federal Section 10 of the Rivers and Harbor Act of 1899 and Sections 404/401 of the CWA. A Section 401 certification is necessary for all projects requiring a Section 404 permit and is part of the Section 404 permit review process. Any special conditions required by WDNR become part of the United States Army Corps of Engineers Section 404 permit. Because the Lincoln Park/Milwaukee River Site is designated as a navigable waterway, the conditions of the Section 404 permit and Section 401 certification will be required. Typical requirements include actions to avoid or minimize wetland and other natural resource impacts, as well as control of resuspension of sediments and erosion during dredging operations. Unavoidable impacts during dredging must be minimized, and impacts that cannot be minimized must be mitigated.
Wisconsin Wetland Inventory maps have been consulted and temporary impacts to wetlands located adjacent to the dredge extent are expected in areas where bank stabilization will be implemented. Additional minor temporary impacts may occur from access roads to Lincoln Creek and the Milwaukee River. Adjustments to the access road locations to minimize wetland impacts will be attempted and coordinated in conjunction with an onsite wetland survey in the spring of 2011. Project impacts to wetlands will be temporary, and wetlands will be restored according to the site restoration plan.
2-12 MKE/110050005

SECTION 2—BASIS OF DESIGN
The Chapter 30 permit will also regulate diverted water, as well as, discharge from dewatering the construction area. Water that is diverted before entering the limits of work or water that is gravity drained from undisturbed areas within the limits of work will be discharged to the Milwaukee River with energy dissipation at the outfall. Water discharges from contact with PCB sediment will be treated and discharged under the WPDES wastewater discharge permit. The flowchart indicating what water streams will require which treatment will be included in the WPDES permit and referenced in the Chapter 30 permit (Figure 2).
The project will obtain a WDNR general permit for dredging operations as part of the Chapter 30 permit application. The Chapter 30 permit application package will include a narrative description and series of construction drawings to describe the following:
• Project description • Methods of sediment removal and disposal • Schedule and sequence of work • Erosion and stormwater control measures • Wetland and cultural resources potential impacts • Site restoration plan • Emergency action plan
2.5.2.2 WPDES Stormwater Discharge Permit
To meet the requirements of the federal Clean Water Act, WDNR developed the WPDES Stormwater Discharge Permit Program, which is regulated under the authority of Chapter NR 216, Wisconsin Administrative Code. The WPDES Stormwater Program regulates discharge of stormwater in Wisconsin from construction sites, industrial facilities, and selected municipalities. Erosion control measures will be implemented prior to the start of site remediation activities. The controls will include, but are not limited to, silt fence, filter fabric for sewer inlet protection, and construction entrances and exits. Silt fence installed around the dewatering pad and temporary staging and decontamination areas will be installed with “loop-arounds” to double as a voluntary conservation measure to reduce the potential of Butler’s gartersnakes from entering the construction area. Stormwater and erosion control plans prepared under the WPDES stormwater discharge permit will also be submitted to the City of Milwaukee and Glendale to obtain individual city stormwater discharge permits.
2.5.2.3 WPDES Wastewater Discharge Individual Permit
The WDNR Chapter 30 and individual WPDES wastewater discharge permit will establish water quality criteria requirements for dewatering activities from the excavation areas into the Milwaukee River. Water diverted from Lincoln Creek upstream of the project site using the gravity bypass system, as well as, storm sewer outfall discharge not in contact with PCB sediment disturbed excavated areas will not require a permit.
Water encountered during the RA will be managed in three different ways as depicted on Figure 2. Water that is diverted before entering the limits of work or water that is gravity drained from undisturbed areas within the limits of work will be discharged to the Milwaukee River with energy dissipation at the outfall. Currently, a total of four stormwater outfalls empty into Zones 1 and 2 and will be rerouted to the extent practicable to avoid
MKE/110050005 2-13

LINCOLN PARK/MILWAUKEE RIVER SITE—BASIS OF DESIGN REPORT
contact with the work area. Water (surface water, precipitation, or and groundwater) that enters disturbed work areas will be collected, and treated to remove TSS or TSS and PCBs, depending on circumstances of the work, and discharged to the Milwaukee River with energy dissipation at the outfall under the Chapter 30 permit or individual WPDES Wastewater Discharge permit. Wastewater from decontamination of trucks and equipment, or from the dewatering process on the staging pad or precipitation that falls on the staging pad, will be treated for TSS and PCBs and discharged to the Milwaukee River with energy dissipation at the outfall under the individual WPDES Wastewater Discharge permit. Treatment will consist of sand filters and GAC.
2-14 MKE/110050005
SECTION 3
Design Approach, Assumptions, and Parameters
3.1 Site Preparation Site preparation includes mobilization of equipment, setup of trailers, staging areas, and other temporary facilities, delineation activities, water bypass system construction, and other activities required prior to initiating sediment excavation. All staging and truck routing plans will require approval prior to start of work. The proposed design assumes the Milwaukee River Parkway will be closed between Hampton Avenue (South) and Lawn Avenue (North) to automobile and foot traffic during the entire construction schedule.
3.1.1 Mobilization, Staging, and Temporary Facilities Special considerations will be taken for truck traffic access into and around the site, including, but not limited to, weight restrictions. Truck traffic associated with construction activities will not be allowed to travel east on Hampton Avenue because of recent improvements to the road surface of Hampton Avenue. Temporary access roads along the west side of Lincoln Creek and the oxbow area will be needed. The areas available for staging and possible temporary access road locations are shown on the drawings. Equipment will not be allowed to be staged in the floodplain, in wetlands, or in culturally sensitive areas. Temporary decontamination pads will be allowed in the floodplain as long as supporting equipment is either outside the floodplain or mobile to be removed in case of a flood. Staging and other areas impacted during the remedial activities will be restored to pre-existing conditions.
Perimeter fencing will be installed during the RA to provide site access control and restrict exposure to PCBs from direct contact. As shown on the drawings, the perimeter fencing will be on the west and south sides of Lincoln Creek and the oxbow based on the location of public facilities and restricting access from these areas to the site. The area is posted with advisory signs to warn the public about contact with the sediments and fish consumption. Pre-project surveying will be conducted for the RA area including the two areas where the temporary earthen cutoffs will be placed. Pre-project surveying will provide elevations for post-project verification that earthen cutoff material has been removed.
3.1.2 Pre-excavation Sediment Delineation The estimated volume of sediment with PCB concentrations greater than 1 mg/kg, but less than 50 mg/kg (non-TSCA sediment), is approximately 82,300 yd3. The estimated volume of sediment with PCB concentrations equal to or greater than 50 mg/kg (TSCA) is 14,300 yd3. Prior to excavation, further delineation of the TSCA sediment will be conducted by CH2M HILL to refine the extent of excavation for TSCA sediment. Based on pre-excavation
MKE/110050005 3-1

LINCOLN PARK/MILWAUKEE RIVER SITE—BASIS OF DESIGN REPORT
delineation activities, the limits of the TSCA excavation will be refined to the next sample below 50 mg/kg.
During the additional delineation activities, samples will also be collected for analysis to characterize the waste for disposal. The pre-excavation delineation and waste characterization activities will be included in the Field Sampling Plan, Health and Safety Plan, and Quality Assurance Project Plan.
3.1.3 Water Bypass Systems To prepare for excavation activities, the targeted excavation areas will be isolated by installing a temporary system to bypass Lincoln Creek water around the excavation areas in Lincoln Creek. The excavation subcontractor will be provided a minimum bypass capacity to maintain as determined by CH2M HILL, but the method of the bypassing the water (gravity, pumping, type of piping, layout) will be determined by the excavation subcontractor, with approval by CH2M HILL and the project stakeholders. In addition, the Site Management Plan prepared by CH2M HILL will detail preparations for and response to emergencies during construction caused by storm events.
3.1.3.1 Lincoln Creek and North Oxbow The first bypass system will be installed for Lincoln Creek and Zone 2a of the oxbow. The isolation system will consist of a temporary earthen cutoff at the north end of Zone 1 (near Green Bay Avenue) and the south end of Zone 1 (near the confluence of Zones 1 and 2), temporary sheet piling at the north end of Zone 2a (near the Milwaukee River Parkway), and temporary sheet piling adjacent to the earthen cutoff at the junction of Zones 1, 2a, and 2b. The maximum elevations of the earthen cutoffs and temporary sheet pile have been designed to prevent upstream flooding (Appendix I). The subcontractor will be required to design the earthen cutoffs at the north and south ends of Zone 1 (near Green Bay Avenue) to be constructed of materials native to Lincoln Creek and to wash away in the event of a major storm.
The bypass system may consist of either a gravity flow system or a pressurized (pump) system. Overall, the site topography is relatively flat; however, there is enough topographic relief to allow water to flow by gravity from the north to the south. A gravity flow system consisting of several large-diameter pipes could be installed through the north earthen cutoff and placed on the stream bed down to and through the south earthen cutoff at the junction of Zones 1, 2a, and 2b. When required, a pipe or pipes could be shut off, drained, and repositioned so construction activities could take place where the pipes had been previously positioned.
A pressure system would involve a set of pumps and associated suction and discharge piping. The discharge piping may be installed in the stream bed, possibly on the east side of Lincoln Creek, and then, just before the access bridge across Lincoln Creek, the piping could be directed overland to the east and discharge to the Milwaukee River.
3.1.3.2 Western and Southern Oxbow After construction is complete on Lincoln Creek and Zone 2a of the oxbow, the temporary sheet piling at the north end of Zone 2a at the junction of Zones 1, 2a, and 2b will be
3-2 MKE/110050005

SECTION 3—DESIGN APPROACH, ASSUMPTIONS, AND PARAMETERS
adjusted to direct flow from Lincoln Creek to the east through Zone 2a, and the temporary sheet piling at the north end of Zone 2a will be removed. New temporary sheet piling will be installed at the east end of Zone 3a to complete the isolation of the remaining western and southern oxbow areas.
3.2 Flow Bypass during Construction Flow bypass from the western Milwaukee River oxbow will occur by setting temporary sheet piling at the inflow and outflow locations to the oxbow. Flow will be contained to the main Milwaukee River channel during low flow and smaller storm events. Earthen cutoffs on Lincoln Creek will support bypass of Lincoln Creek during the RA.
The temporary earthen and sheet pile cutoff structures needed during the remedial action were modeled. The assumptions used in the model and the results of the modeling are included in the memorandum Lincoln Park Sediment Removal: Temporary Earthen and Sheetpile Cutoff Modeling (CH2M HILL, 2010c) (Appendix I). Updated Hydrologic Engineering Centers River Analysis System (HEC-RAS) hydraulic models of the Milwaukee River and Lincoln Creek were used to simulate the effect of the temporary earthen cutoff and sheet pile cutoff structures on the river systems (Appendix J). The goal of the analysis was to (1) determine the top elevation of the temporary earthen cutoff and sheet pile cutoff structures to provide a dry excavation, and (2) minimize the potential water level increases if a major storm event were to occur during construction. The height of the cutoff structures was balanced by the need to keep the construction area dry to maintain a short construction period, while minimizing impacts from major storm events.
The flows used in this analysis were obtained from the FEMA Flood Insurance Study (FEMA, 2008) and were not adjusted except for calculation of the 2-year flows. The flows were used to compare water levels in Lincoln Creek and the western oxbow with and without the temporary earthen and sheet pile cutoffs in place.
Average flow rates for Lincoln Creek and the Milwaukee River were reviewed to compare how monthly average flow rates vary throughout the year. The months of July through February historically experience the lowest monthly average flows, while the months of March through June historically experience the highest monthly average flows; however, flood flows could occur during any month. Appendix I includes additional information on flow rates.
The HEC-RAS models received from the WDNR were updated with 2010 June and October survey data and are now referred to as the pre-project models. Details of the 2010 model updates can be found in the memorandum Lincoln Park Sediment Remediation Pre-Project Lincoln Creek and Milwaukee River HEC-RAS Models (CH2M HILL, 2010d) located in Appendix J. The pre-project models are used as the baseline condition for comparing model results with the temporary earthen cutoff and sheet pile cutoff structures in place.
A summary of the modeled temporary cutoffs, the type of cutoff, and the recommended maximum elevation of the cutoffs is included in Table 3. The surveyed cross section of Lincoln Creek upstream of Green Bay Road has a low-point elevation of 610.91 feet, and the surveyed cross section at the confluence with the Milwaukee River has a low-point elevation of 609.71 feet. Therefore, the recommended maximum cutoff elevation is approximately 6 to
MKE/110050005 3-3

LINCOLN PARK/MILWAUKEE RIVER SITE—BASIS OF DESIGN REPORT
10 feet above the bed of the creek or river. The maximum cutoff elevation of the earthen cutoffs will be set at 6 feet above the bed of Lincoln Creek to minimize material within the creek bed. The maximum cutoff elevation of the temporary sheet pile cutoffs will adhere to the recommendations from the modeling.
TABLE 3 Summary of Temporary Cutoff Recommendations
Stage of Construction Type of Cutoff
Recommended Maximum
Cutoff Elevation
Temporary Rise in 100-Year
Return Period Water Level
Approximate Duration of Construction (24 hours a day, 7 days a week)
1—(Zone 1) Lincoln Creek cutoffs 1A and 1C (Upstream of Green Bay Avenue Bridge and at confluence with Milwaukee River western oxbow)
Earthen 1A: 619.0 feet 1C: 617.0 feet
0.00 foota Stage1:
(2 months)
1—(Zone 2a) Milwaukee River western oxbow cutoffs 1B and 1D
Sheet Pile 1B: 620.0 feet 1D: 620.0 feet
0.01 foot
2—(Zone 2b, 3a) Milwaukee River western oxbow cutoffs 2A and 2B
Sheet Pile 2A: 620.0 feet
2B: 620.0 feet
0.01 footb Stage 2:
(2 months)
2—(Zone 2b, 3a) Lincoln Creek rerouting
None (Re-routing of Lincoln Creek)
N/A 0.00 foot
a Earthen cutoff to wash away with a 100-year return period storm event. b Impact 0.04 foot within Lincoln Park property; 0.01 foot elsewhere.
The subcontractor will be required to provide a minimum of 100 cubic feet per second (ft3/second) bypass capability either through pumping or gravity flow. Construction could occur at any time during the year; however, the intensity of water management will vary depending upon seasonal conditions and the actual flows that occur during the project.
The subcontractor will be required to provide a plan for how the subcontractor will manage a flood during the construction process. The plan will be in accordance with the design and site plans.
3.3 Excavation For design purposes, it is assumed that the Estabrook Park Dam will remain open until construction activities are complete.
3.3.1 Sediment Dewatering Once an excavation area is isolated from the river, natural dewatering will be encouraged for a short period of time. Additional dewatering will be implemented by creating depressions or trenches and putting sump(s) in low spots to collect water. The water will be
3-4 MKE/110050005

SECTION 3—DESIGN APPROACH, ASSUMPTIONS, AND PARAMETERS
pumped from the excavation and treated as appropriate to meet the Chapter 30 or WPDES requirements before being discharged to the Milwaukee River. The effort will minimize the amount of drying agent added to the sediment in order to meet the landfill requirements. The sediment will be mechanically mixed in place with a drying agent, as necessary, until it passes the paint filter test. Additional mixing may be performed on the TSCA material to meet landfill requirements for strength, as necessary. Dust control measures will be provided by the subcontractor, if necessary.
Paint filter testing of sediment samples in the field during solidification testing indicates that six of seven samples passed the paint filter without addition of drying agent (Appendix F). The subcontractor will be provided with the results of the solidification testing. The amount of drying agent needed will be determined in the field by the subcontractor. The type of drying agent will be proposed by the excavation subcontractor and approved by CH2M HILL and the project stakeholders based on cost of amendment, resulting cost of sediment transportation and disposal, time required to meet landfill requirements, effectiveness in meeting landfill requirements, and impacts to health, safety, and the environment. Drying agents evaluated during the solidification testing include sawdust (field), Portland Cement (laboratory), and superabsorbent polymer (laboratory).
After drying, the non-TSCA sediment will be direct-loaded into trucks for offsite disposal at a RCRA Subtitle D landfill and the TSCA sediment will be placed onto a staging/ dewatering pad for loading and transportation to an offsite RCRA Subtitle C or TSCA landfill for disposal. Non-TSCA- and TSCA-contaminated sediment will be transported on the estimated trucking sequencing as described below.
3.3.2 Excavation Sequencing Excavation will be conducted to design elevations as shown on the design drawings (Appendix B) and in accordance with the design specifications (Appendix A). In addition, confirmation sampling supported by visual characterization by the engineer will be used as methods to evaluate the extent of sediment to be excavated. Visual characterization support includes referencing boring logs and laboratory results from the RI regarding soil type. Excavation will start at the upstream end of Lincoln Creek and the eastern end of the north oxbow area (Zones 1 and 2a). TSCA areas, whose limits were refined during pre-excavation sampling, will be excavated as quickly as possible and relocated to the staging/dewatering pad to minimize the possibility of sediment relocation during a storm event. Sampling for PCBs will be conducted according to the confirmation sampling plan to determine if the RA levels have been met. The excavation/PCB testing process will be repeated, as necessary, until RA levels have been achieved. Once excavation of contaminated sediment has been verified as complete, restoration will follow as described below.
After work is completed in Zones 1 and 2a and the temporary sheet piling has been readjusted and removed, excavation in Zones 2b and 3a will begin and will follow the same procedure discussed above.
Elevations will be confirmed in the field during excavation using a geographic positioning system with an accuracy of ± 0.1 foot. Post-excavation surveying will be conducted on the final excavation limits with an accuracy of ± 0.1 foot by a licensed land surveyor. Post-restoration surveying is discussed below.
MKE/110050005 3-5

LINCOLN PARK/MILWAUKEE RIVER SITE—BASIS OF DESIGN REPORT
3.3.3 Excavation Production Rate The estimated average excavation production rate for this remedy is approximately 1,570 yd3 per day using 24-hour days, 7 days per week. Approximately 32 tandem-axle dump trucks (12-yard soil capacity) hauling 4 loads per day equates to 1,570 cubic yards. This rate assumes some areas require excavation to remove non-TSCA sediments on top of TSCA sediments.
3.4 Sediment Staging / Decontamination Non-TSCA sediment will be intermittently staged within the creek bed near temporary access roads built on the creek bed, which will be constructed to provide access for the trucks and prevent trucks and equipment from driving directly on the sediment. Temporary access roads will be built using portable mats or plates. Details of the temporary access road construction materials and layout will be proposed by the subcontractor for approval by CH2M HILL and the project stakeholders. The sediment will be direct-loaded to trucks for offsite disposal using the temporary roads for access. After the truck is loaded and before it leaves the site, the outside of the truck, undercarriage, and tires will be rinsed to remove any extraneous dirt on a truck decontamination staging pad. Trucks will be required to have built-in covers or tarps over the waste.
As previously described, all TSCA-contaminated sediment will be transported to the constructed staging/dewatering pad and staged for future loading to trucks for offsite disposal. Due to the long distance the TSCA disposal trucks are required to travel to the disposal facility, the trucks will be loaded and decontaminated in the afternoon so that they are ready to leave early the next day. Trucks hauling TSCA-contaminated sediments are estimated to load approximately five trucks per day. Those five trucks will depart early the next day. The procedure will be followed until all the TSCA soil has been sent offsite for disposal.
The size of the staging/decontamination pad will depend on several factors that include the volume of sediment to be removed, rate of removal versus rate of loading and transport to offsite landfills, required frequency of waste confirmation sampling, and overall project schedule. Approximate sizing (500 feet long by 200 feet wide) for the TSCA-contaminated sediment staging/decontamination pad has been determined for costing purposes based on the volume of TSCA-contaminated sediment to stage and additional area required for truck decontamination. The TSCA staging/decontamination pad will be constructed at the identified area and will be constructed of an aggregate layer, woven geotextile, sand layer, and high-density polyethylene liner. The pad will be sloped to a slump where water will be collected and pumped to the water treatment system. The curb height and sump size are designed to accommodate a 25-year, 24-hour duration design storm without causing runoff to the surrounding area.
Soil stockpiled on the pad will be covered with plastic sheeting except during loading of trucks for offsite disposal.
3-6 MKE/110050005
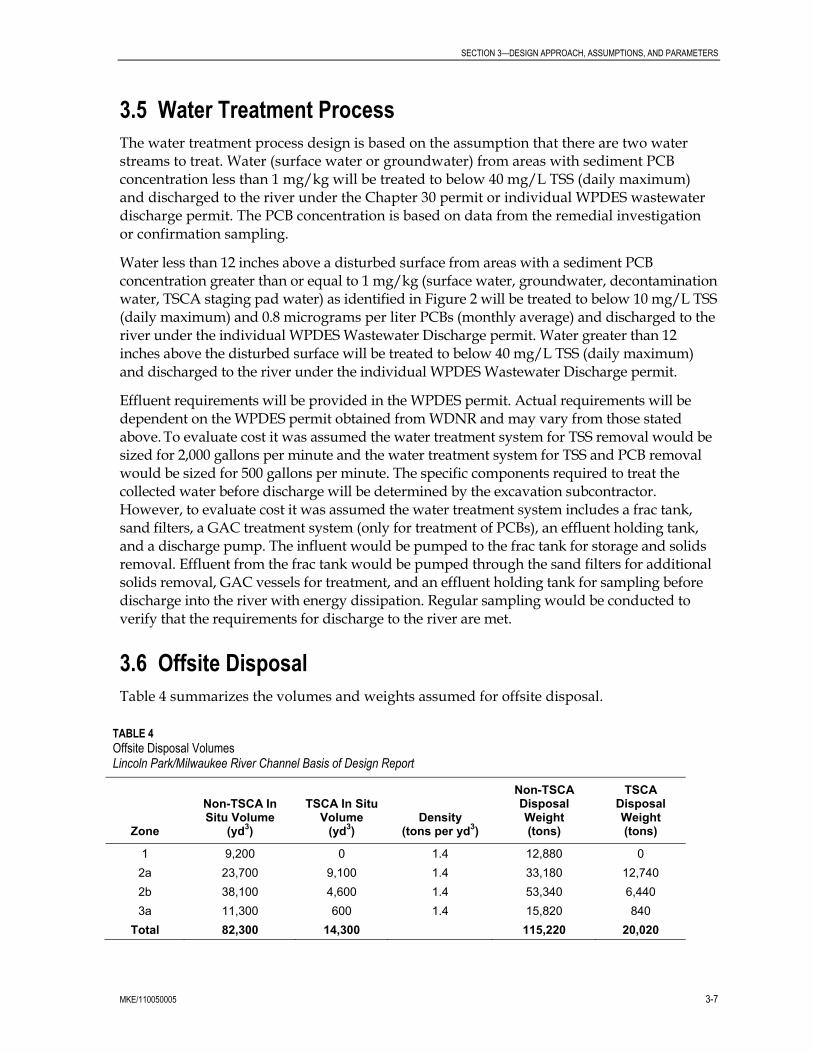
SECTION 3—DESIGN APPROACH, ASSUMPTIONS, AND PARAMETERS
3.5 Water Treatment Process The water treatment process design is based on the assumption that there are two water streams to treat. Water (surface water or groundwater) from areas with sediment PCB concentration less than 1 mg/kg will be treated to below 40 mg/L TSS (daily maximum) and discharged to the river under the Chapter 30 permit or individual WPDES wastewater discharge permit. The PCB concentration is based on data from the remedial investigation or confirmation sampling.
Water less than 12 inches above a disturbed surface from areas with a sediment PCB concentration greater than or equal to 1 mg/kg (surface water, groundwater, decontamination water, TSCA staging pad water) as identified in Figure 2 will be treated to below 10 mg/L TSS (daily maximum) and 0.8 micrograms per liter PCBs (monthly average) and discharged to the river under the individual WPDES Wastewater Discharge permit. Water greater than 12 inches above the disturbed surface will be treated to below 40 mg/L TSS (daily maximum) and discharged to the river under the individual WPDES Wastewater Discharge permit.
Effluent requirements will be provided in the WPDES permit. Actual requirements will be dependent on the WPDES permit obtained from WDNR and may vary from those stated above. To evaluate cost it was assumed the water treatment system for TSS removal would be sized for 2,000 gallons per minute and the water treatment system for TSS and PCB removal would be sized for 500 gallons per minute. The specific components required to treat the collected water before discharge will be determined by the excavation subcontractor. However, to evaluate cost it was assumed the water treatment system includes a frac tank, sand filters, a GAC treatment system (only for treatment of PCBs), an effluent holding tank, and a discharge pump. The influent would be pumped to the frac tank for storage and solids removal. Effluent from the frac tank would be pumped through the sand filters for additional solids removal, GAC vessels for treatment, and an effluent holding tank for sampling before discharge into the river with energy dissipation. Regular sampling would be conducted to verify that the requirements for discharge to the river are met.
3.6 Offsite Disposal Table 4 summarizes the volumes and weights assumed for offsite disposal.
TABLE 4 Offsite Disposal Volumes Lincoln Park/Milwaukee River Channel Basis of Design Report
Zone
Non-TSCA In Situ Volume
(yd3)
TSCA In Situ Volume
(yd3) Density
(tons per yd3)
Non-TSCA Disposal Weight (tons)
TSCA Disposal Weight (tons)
1 9,200 0 1.4 12,880 0 2a 23,700 9,100 1.4 33,180 12,740 2b 38,100 4,600 1.4 53,340 6,440 3a 11,300 600 1.4 15,820 840
Total 82,300 14,300 115,220 20,020
MKE/110050005 3-7

LINCOLN PARK/MILWAUKEE RIVER SITE—BASIS OF DESIGN REPORT
For design purposes, it is estimated the trucking schedule for non-TSCA contaminated sediment will operate with approximately 32 trucks per day and 4 runs per truck per day, directly loaded. Trucks hauling TSCA-contaminated sediments are estimated to load and transport approximately five trucks per day.
3.7 Creek and Western Oxbow Restoration The restoration of Lincoln Creek and the western oxbow will restore the areas impacted by sediment excavation. The restoration will include stabilized shoreline between the undisturbed and the excavated areas. The slope stabilization will occur from the bottom of slope to the ordinary high watermark or to an existing stable portion of the bank, whichever is higher. Many restoration efforts have been completed by the Milwaukee Metropolitan Sewerage District (MMSD) along upstream portions of Lincoln Creek. The restoration for the Lincoln Park/Milwaukee River Site will use techniques similar to the previous restoration efforts, but will differ to accommodate the assumed Estabrook Park Dam backwater condition throughout the site. The stabilization will also be supportive of future habitat and recreational enhancements that could be completed, but are beyond the scope of the RA. A summary of the restoration is provided below. Details of the design components are included in Lincoln Creek and Western Oxbow Bank Stabilization Design: Interim Prefinal Design Report Update (CH2M HILL, 2010e) (Appendix K).
3.7.1 Estabrook Park Dam The water levels at the site would be very different for a dam-open or dam-closed scenario. Based on discussions with the project stakeholders, the restoration design assumes a dam-closed scenario. Seasonal variation of water levels due to the Estabrook Park Dam opening and closing is not anticipated. Instead, the dam is anticipated to remain closed, creating a pool throughout the site with a water surface elevation of about 617 to 617.4 feet. Milwaukee County is completing a study of the dam to determine the costs to either fix the dam or decommission it.
3.7.2 Hydrology and Hydraulics Hydraulic models of Lincoln Creek and the Milwaukee River (including the western oxbow) used in the Milwaukee County FIS (FEMA, 2008) were also used to analyze different construction scenarios and post-construction scenarios for the project. The models were provided by WDNR and were modified using updated cross section, bridge, and other survey information. The modifications are summarized in a November 18, 2010, memorandum entitled Lincoln Park Sediment Remediation Pre-Project Lincoln Creek and Milwaukee River HEC-RAS Models (CH2M HILL, 2010d) included in Appendix J.
3.7.3 Flood Improvements MMSD has completed several flood improvement projects along Lincoln Creek. In Lincoln Creek, MMSD flood improvement projects ended at a point about 960 feet upstream of the Lincoln Park/Milwaukee River Site, and were completed in 2002. A study completed by the Southeastern Wisconsin Regional Planning Commission and MMSD concluded that removing 1 to 2 feet of sediment in Lincoln Creek downstream of Green Bay Avenue and the western oxbow channel could lower flood stages for properties near the site. The RA
3-8 MKE/110050005

SECTION 3—DESIGN APPROACH, ASSUMPTIONS, AND PARAMETERS
will not adversely affect flooding for properties near the site, and based on the anticipated sediment removal at the site, the RA may provide some flood relief based on the Southeastern Wisconsin Regional Planning Commission and MMSD study. However, if excess sedimentation continues along Lincoln Creek, the flood relief would be temporary. Additional information regarding sedimentation and pre- and post-project flood elevations at the site is discussed in Lincoln Creek and Western Oxbow Bank Stabilization Design: Interim Prefinal Design Report Update (CH2M HILL, 2010e) (Appendix K).
3.7.4 Stormwater Outfalls and Utility Conflicts Existing stormwater outfalls along the Lincoln Park/Milwaukee River Site will be preserved. There are five known stormwater outfalls within the site. Flows from these outfalls will be managed during the excavation and restoration construction, and are discussed in Lincoln Creek and Western Oxbow Bank Stabilization Design: Interim Prefinal Design Report Update (CH2M HILL, 2010e) (Appendix K). A detailed evaluation of the flooding and hydraulic impacts of the restored channel on the stormwater pipes and tributary pipes will not be conducted because the project will maintain the existing outfall. However, the project goal to not raise the flood stage should not adversely impact the outfalls, pipes, or in-pipe water levels.
Five existing stormwater outfalls have been identified and incorporated into the restoration design. Their locations are shown on the drawings.
• The first outfall (from upstream to downstream) is immediately downstream of the Green Bay Avenue Bridge. The storm sewer outfall is at a hole cut through the sheet pile wall along the northern bank of the creek to allow the outfall to protrude through. The outfall invert elevation is 612.55 feet and is about 4.5 feet below the anticipated backwater water surface elevation of 617 to 617.4 feet. No modifications are planned for this outfall.
• A second outfall also protrudes through the sheet pile wall near the bend in Lincoln Creek as the channel bends south. It has an invert elevation of 613.5 feet. No modifications are planned for this outfall.
• A third outfall exists directly under the western abutment of the antenna bridge. The outfall invert elevation is 611.83 and is very near the bottom elevation of the existing creek bed and more than 5 feet below the design assumption of the future backwater water surface elevation. No modifications are planned for this outfall.
• A corrugated metal pipe outfall is located along the western bank of Lincoln Creek about 160 feet upstream of the confluence with the western oxbow. The outfall invert elevation is about 614.4 feet, or about 3 feet below the anticipated backwater water surface elevation. The creek bank has eroded and the pipe has been bent, broken, and twisted along the bank. The headwall of the outfall is also missing. During the bank stabilization, the pipe will be cut off 5 feet from the bank face (a location where the pipe is still structurally sound) and replaced with a new 12-inch corrugated metal pipe. A flared end section will form the new pipe outfall and will be installed flush with the restored bank surface. The new outfall invert will be similar to the existing, to maintain the existing hydraulic capacity of the upstream pipe network.
MKE/110050005 3-9

LINCOLN PARK/MILWAUKEE RIVER SITE—BASIS OF DESIGN REPORT
• A large box culvert is located at the southwest corner of the western oxbow. It has an existing invert elevation of about 613.35 feet that will be maintained after restoration. The outfall apron and headwall have deteriorated. Rock will be used to stabilize the bank in this area to reduce erosion and to protect the structure. An existing pool has been created by the water flowing out of the culvert. This pool will be kept as part of the restoration design to provide an area for energy dissipation from the outfall flow. No additional enhancements are anticipated to the outfall because the box culvert outfall will be submerged with the anticipated backwater water surface elevation.
An AT&T communications conduit (4-conduit bundle) is partially exposed on the east bank of Lincoln Creek about 50 feet north of the antenna bridge. The conduit crosses the river and is exposed in some areas of the creek bottom. A manhole about 30 feet west of the western creek bank also exists. Milwaukee County has been in communication with AT&T to coordinate relocation or removal of the conduit and associated infrastructure. For purposes of the RA, the conduit is anticipated to be relocated and will not require design coordination with the sediment removal or bank stabilization design.
3.7.5 Bank Restoration The bank restoration will use native vegetation for areas of the site above the backwater water surface elevation. The bank restoration details are shown on the drawings. The restoration design accounts for the large variations in water levels between low-flow and flood-flow events, by selecting vegetation for the bioengineered bank stabilization that will function across the water levels. On the lower portion of the bank (within 3.5 vertical feet of backwater water surface elevation) vegetation was selected that can survive temporarily inundated or wet soil conditions. Above 3.5 feet to the top of the bank, vegetation was chosen that could withstand less frequent inundation while providing slope stability to the bioengineered banks. At the top of the bank, a low maintenance (no mow) grass seed mixture will be used that has been applied in other Milwaukee County parks. No tree plantings are anticipated. The vegetation schedules are shown on the drawings.
Depending on the side slopes and height of the banks impacted by sediment removal, from the toe of slope to the top of the bank, different bioengineering techniques will be used. Along Lincoln Creek, when the banks are less than 10 feet high, a combination of a single soil lift with an erosion control fabric will be used. The straw and coir blend erosion fabric will provide temporary stabilization until the vegetation is established.
In areas where the banks are greater than 10 feet (up to a project maximum of 20 feet), soil lifts are used in 1-foot increments, reinforced by a biaxial geogrid. The geogrid is needed to provide geotechnical stability for the tall and steep banks to prevent slumping and slope failure. Each soil lift will be wrapped with a biodegradable woven netting to provide temporary stabilization until the vegetation is established. A straw and coir blend erosion matting will be provided between the woven netting and the soil to retain fine-grained sediment in the soil lift until the vegetation is established.
The restoration techniques are also used in the western oxbow; however, the low-flow velocity and shear stresses in some areas of the oxbow do not require highly engineered stabilization techniques like the steeper banks along Lincoln Creek. In areas with shallow side slopes and bank heights less than 10 feet, the banks will be sloped and covered with a
3-10 MKE/110050005

SECTION 3—DESIGN APPROACH, ASSUMPTIONS, AND PARAMETERS
biodegradable straw and coir blend erosion fabric to provide temporary stabilization until the vegetation is established. Details of the bank restoration techniques, and plan view drawings showing locations where the details will be applied in the creek and western oxbow are included in Appendix B.
Soil for the bank stabilization will be native soil from the site or, as needed, imported from the Calumet stockpile at the Moss-American Site. The Calumet stockpile consists of sandy silt floodplain soils, with some gravel. The gravels will require screening, but the silty soils are anticipated to support the vegetated bank stabilization.
Rock will be used along the perimeter at the backwater water surface elevation and below, in areas that have side slopes 2:1 (horizontal:vertical) or steeper. This includes the entire length of Lincoln Creek, except along the sheet pile and select areas within the oxbow. The rock will provide a stable foundation to construct the bank restoration, and will provide erosion protection from flowing water. Vegetation will be planted above the rock. When the vegetation is established, it is expected to cover the rock so it will not be visible. Because of the steep side slopes observed at the site and the design assumption of backwater from the Estabrook Park Dam creating water depths near 6 feet deep along the banks, using earthen banks (with vegetation) was not possible.
Rock will also be used at the upstream and downstream side of the bridge crossings, such as downstream of Green Bay Avenue, upstream and downstream of the antenna bridge, and between the end of the sheet pile in Lincoln Creek and the antenna bridge. Rock will extend from the toe of slope to the top of the bank where the stabilization ties into existing stable areas. In areas above the backwater water surface elevation, the rock will be covered with soil, seed, mulch, and erosion fabric, and will be “joint planted” with live cuttings and container plants. Joint planting the rock above the backwater elevation will cover the rock but allow the rock to provide armament when erosive forces occur. Details regarding rock sizing methods are included in Lincoln Creek and Western Oxbow Bank Stabilization Design: Interim Prefinal Design Report Update (CH2M HILL, 2010e) (Appendix K).
3.7.6 Lincoln Creek Bottom Design The bottom contours of Lincoln Creek are shown on the drawings. The contours were determined by modeling requirements to not increase the flood stage, and to minimize regrading the areas after sediment removal. Along the sheet pile near Green Bay Avenue, a pool was maintained along the outside bend. Downstream of the bend, the creek bottom grading includes a minor swale in the center of the channel to convey low flows until after the sediment removal project is complete and Estabrook Park Dam is closed to create the backwater. Much of Lincoln Creek will be backwater even before the Estabrook Park Dam is closed because the sediment removal will lower Lincoln Creek 1 to 2 feet, which is more than the pre-project water surface elevation difference from the upstream end of Lincoln Creek (Green Bay Avenue) to the downstream extents at the main stem of the Milwaukee River.
3.7.7 Western Oxbow Bottom Design The bottom contours of the western oxbow are shown in the drawings. The contours were determined by modeling requirements to not increase the flood stage and to minimize regrading the areas after sediment removal. Because large sediment removal depths are
MKE/110050005 3-11

LINCOLN PARK/MILWAUKEE RIVER SITE—BASIS OF DESIGN REPORT
3-12 MKE/110050005
anticipated to create deep pools in parts of the western oxbow, the bottom contouring will maintain these areas and provide diversity of water depths.
The northern portion of the oxbow includes an area that does not require sediment removal. The area will require regrading to blend upstream bottom elevations with the downstream bottom elevations.
The rest of the western oxbow will have a permanent pool of water created by the main stem of the Milwaukee River. The bottom contours will provide varying water depths to support target fisheries and to minimize major earthwork. The western oxbow area is a natural depositional area, especially under the historical and anticipated Estabrook Park Dam operations that will provide deep water and slow velocities. The deeper water created after sediment removal will naturally fill in over time because of the apparent abundant supply of sediment from upstream sources and because it is a much wider and deeper area than Lincoln Creek or the Milwaukee River. Deposition will likely result in the disappearance of some of the deep water habitat over time compared to that immediately available after construction.
3.7.8 Target Fisheries Northern pike and smallmouth bass have been identified as fish species that could benefit from habitat enhancements and improved recreational and subsistence fishing opportunities. Northern pike spawning habitat has been identified as limiting the reproductive success and adult abundance of this species in the Milwaukee River and Lincoln Creek systems. Northern pike spawn from approximately early March through the end of April or early May, depending on seasonal water temperatures. Critical habitat characteristics for successful spawning are adequate water depths during the spawning periods, ample aquatic vegetation for larval attachment, and low water velocity during the post-spawning, larval period. Preferred water depth is greater than 6 inches to water depths that can support rooted aquatic vegetation (approximately 3 to 4 feet). Because Estabrook Park Dam is anticipated to create a backwater condition with low velocities and depths greater than 6 inches throughout the site, the RA will support northern pike spawning and larval period habitat. However, aquatic vegetation planting will be needed in the future to provide northern pike spawning and larval habitat supportive of northern pike.
Smallmouth bass summer habitat improvements have been directly targeted. Reports from stakeholders indicate the presence of young smallmouth bass at the site, but that adults do not generally reside at the site during the warmer summer months. The focus of smallmouth bass habitat restoration is to increase adult summer habitat. Adult smallmouth bass need deeper pools of water in the summer to sustain summer temperatures and to provide bass with ample forage. Adult smallmouth bass habitat is provided by incorporating deeper and larger pools into the western oxbow restoration plan, which are anticipated throughout the year. Adult northern pike also need these types of habitat, so habitat improvements made for the smallmouth bass will also benefit northern pike. The habitat improvements support achievement of the RA objectives.
SECTION 4
Performance Monitoring and Operations and Maintenance Requirements
This section provides a brief summary of the performance monitoring and operation and maintenance requirements for the RA. Additional details regarding sample collection, sampling methods, and data management will be developed in the Field Sampling Plan and Quality Assurance Project Plan that includes the data management plan.
4.1 Restoration Operation and Maintenance Operation and maintenance of the creek and western oxbow will primarily consist of monitoring for erosion, settlement of habitat and stabilization features, monitoring for animal burrowing and vegetation destruction, and providing routine vegetation watering. A vegetation maintenance plan will be developed that will monitor the establishment and survival of the vegetation plantings over a minimum of two full growing cycles after the restoration is complete. A minimum success will be required for the revegetation to be successful based on planting type.
4.2 Water Quality Monitoring and Control Water quality monitoring programs will be implemented during excavation and other intrusive remediation activities in order to assess if the transport of contaminants away from areas of operation and into other portions of the Milwaukee River has occurred.
Monitoring water quality is required to minimize impacts to the river as a result of construction activities. Construction shall be carried out in such a manner that there is no significant transport and deposition of sediments and their associated contaminants outside the construction zone to uncontaminated areas or areas that have already been remediated.
Discharges will occur with the following activities:
• Initial dewatering of the site • Lincoln Creek bypass system operations • Precipitation dewatering • Disturbed excavation dewatering • Stormwater outfall dewatering • TSCA staging pad dewatering • Decontamination
All discharges to the Milwaukee River must meet applicable permit requirements, which will be detailed in the Chapter 30 permit or the individual WPDES wastewater permit.
MKE/110050005 4-1

LINCOLN PARK/MILWAUKEE RIVER—BASIS OF DESIGN REPORT
4-2 MKE/102300001
4.3 Post-excavation Activities Post-excavation activities will be conducted to assess whether the RA level for the sediment was achieved and to document the final conditions of the site. Post-excavation activities are described in the Field Sampling Plan and Quality Assurance Project Plan. The activities include the following:
• Post-excavation sediment sampling for PCBs to confirm the RA level of 1 mg/kg has been achieved, using a mobile laboratory and, where applicable, fixed laboratory analysis, provided by USEPA
• Post-excavation elevation verification in the field using a geographic positioning system device with an accuracy of ± 0.1 foot
• Post-excavation surveying of the final excavation limits with an accuracy of ± 0.1 foot by a licensed land surveyor including surveying of earthen cutoff areas post-removal of earthen cutoffs to verify removal of earthen cutoff construction materials

SECTION 5
Project Delivery Strategy
This section presents the project delivery strategy for both the design and remediation of the Lincoln Park/Milwaukee River Site. The primary components of the design and remediation, as discussed in the preceding sections, are summarized below. Key project delivery strategies relative to a specific component are noted below within each respective subsection.
5.1 Remedial Design To streamline its development, preparation, and delivery, the remedial design was accomplished in two phases: (I) preparation and submittal of the preliminary design, and (II) preparation and submittal of the prefinal/final design.
5.1.1 Preliminary Design The primary objective of the preliminary design was to define in detail the technical parameters upon which the design is based. It was also the intent of the preliminary design to develop the conceptual strategies and ideas that compose the framework of the remediation project, to review the strategies and ideas with the stakeholders, and to finalize the strategies and ideas so that the prefinal/final design proceeded with minimal changes (for example, minimal cost and schedule impacts).
5.1.2 Prefinal / Final Design Once the conceptual strategies and ideas and supporting technical details were developed, reviewed, and finalized, the prefinal/final design activities began. The conceptual strategies and ideas developed and presented in the preliminary design document have been expanded into a set of final design documents consisting of the following:
• Final BODR • Specifications • Drawings • Cost estimate • Site-specific plans • Subcontract award documents • Biddability, operability, and constructability reviews • Revised project delivery strategy • Construction quality assurance plan
Detailed design drawings and specifications have been prepared for most of the selected components. Some of the design specifications for the project are performance-based (such as, a specific design is not provided to the subcontractor), such as the design of the Lincoln Creek bypass system. A performance-based design allows the subcontractor flexibility in choosing the means and methods to achieve a desired result. The selected subcontractor will
MKE/110050005 5-1

LINCOLN PARK/MILWAUKEE RIVER—BASIS OF DESIGN REPORT
5-2 MKE/110050005
be required to present a detailed RA Work Plan to CH2M HILL describing how the work will be executed.
5.2 Remedial Action The procurement strategy for implementing the sediment remediation includes planning, subcontractor prequalification, prebid site walk, submittal of a Request for Proposals, evaluation of the proposals, submittal of the Request for Consent, contract award, and subcontract management.
5.3 Subcontract Delivery Strategy The proposed subcontracting approach is to competitively solicit proposals that will:
• Maximize the use of small business enterprises, small disadvantaged business enterprises, women-owned businesses, hub-zone enterprises, and veteran-owned businesses to the greatest extent possible.
• Provide the best value based on cost, innovation, sustainability of construction methods, and schedule.
• Provide a clear interface between subcontracts for effective implementation.
• Provide better ability to evaluate subcontractors according to the specified criteria to support selection.
The subcontract documents will be prepared based on the understanding that USEPA is the owner of the project and that CH2M HILL is the construction contractor. CH2M HILL prepared the project specifications and drawings and will provide the solicitation process instructions and subcontract terms.
All sitework activities, including but not limited to, excavation, dewatering, water treatment, stream bypass, offsite disposal, and restoration will be conducted under a single subcontract to a large or small business. Work requiring laboratory services (including mobile and/or fixed laboratory) is assumed to be conducted under the USEPA Contract Laboratory Program. An outside laboratory will be required for waste characterization analyses.

SECTION 6
Construction Schedule
A construction schedule for the remedy is provided in Appendix L. The schedule is shown based on calendar days and assumes no interruption in activities.
The remedial activities are assumed to take place during the summer and fall seasons and will last approximately 4.5 months from the start of mobilization to demobilization. Hours of active construction are expected to be 24 hours a day, 7 days a week. Using a schedule of 7 days a week, 24 hours a day reduces the calendar days working in Lincoln Creek and the western oxbow of the Milwaukee River by approximately 30 days when compared to 12 hours a day, 5 days a week. Working 24 hours a day, 7 days a week reduces the risk of stopping work as a result of inundation of stormwater. In addition, the overall duration of the project is reduced, allowing greater overall flexibility of schedule to complete the work within one construction season if storm events force a pause in the work. A memorandum outlining the comparison between construction schedules and durations is in Appendix M.
MKE/110050005 6-1

MKE/110050005 7-1
SECTION 7
Cost Estimate
The estimated costs have been calculated to be $22.7 million. The estimated cost is provided in Appendix N.
The information in the cost estimate is based on the project information described in this BODR. The cost estimate is an order-of-magnitude cost estimate that is expected to be within +15 to –5 percent of the actual project costs. The cost estimate is offered as an opinion of cost to perform the work and is not an offer to contract for construction services, procure and/or provide such services. The contingency in the cost estimate is included for potential changes in bid pricing. The cost estimate and associated contingency does not include costs for force majeure items (e.g., major storm event).

MKE/110050005 8-1
SECTION 8
References
Baird and Associates. 1997. Milwaukee River PCB Mass Balance Project WI DNR. September.
CH2M HILL. 2009. Feasibility Study Report, Lincoln Park/Milwaukee River Channel Sediments Site, Milwaukee Estuary Area of Concern. December 7.
CH2M HILL. 2010a. Moss-American Stockpile Soil Sampling Plan. April.
CH2M HILL. 2010b. Sediment Solidification Treatability Study Field Sampling Plan.
CH2M HILL. 2010c. Lincoln Park Sediment Removal: Temporary Earthen and Sheetpile Cutoff Modeling, Lincoln Park/Milwaukee River Channel Sediments Site, Milwaukee Estuary Area of Concern. December 8.
CH2M HILL. 2010d. Lincoln Park Sediment Remediation Pre-Project Lincoln Creek and Milwaukee River HEC-RAS Models, Lincoln Park/Milwaukee River Channel Sediments Site, Milwaukee Estuary Area of Concern. November 18.
CH2M HILL. 2010e. Lincoln Creek and Western Oxbow Bank Stabilization Design: Interim Prefinal Design Report Update, Lincoln Park/Milwaukee River Channel Sediments Site, Milwaukee Estuary Area of Concern. December 10.
Federal Emergency Management Agency. 2008. Flood Insurance Study, Milwaukee County, Wisconsin. September 26.
Natural Resource Technology, Inc. (NRT). 2007. Remedial Investigation/Feasibility Study, Lincoln Park/Blatz Pavilion Site. March.
Natural Resource Technology, Inc. (NRT). 2009. Remedial Construction Documentation Report, PCB-Impacted Sediment Removal, Lincoln Park/Blatz Pavilion Site. January 29.
Sullivan International/T N & Associates, Inc., Joint Venture Team (STN). 2009. Final Focused Remedial Investigation, Lincoln Park/Milwaukee River Channel Sediments. August 10.
Wisconsin Department of Natural Resources (WDNR). 1994. Milwaukee Estuary Remedial Action Plan. Citizen Advisory Committee. July.
Wisconsin Department of Natural Resources (WDNR). 2005. Estabrook Impoundment Sediment Remediation Pre-Design Study. Project Completion Report to USEPA (Great Lakes National Program Office Grant ID GL2000-082). PUBL-WT 826. August.

Figures

%���I-43
Lincoln Creek
Milwaukee RiverZone 1Zone 1
Zone 3Zone 3
Zone 2Zone 2
Zone 4Zone 4 Zone 5Zone 5
Estabrook Park Dam
Mi lwaukee River Parkway
N. G
reen Bay Avenue
W. Hampton Avenue
W. Villard Avenue
N. Port Washington Rd.
W. Hampton Avenue
MILWAUKEE GLENDALE
MILWAUKEE
$ 0 400 800
Feet
Figure 1
Site Location MapBasis of Design ReportLincoln Park/Milwaukee River Site
Glendale, WI
MilwaukeeMadison
Lincoln Park SiteGlendale, WI.
W i s c o n s i n
I o w a
M i c h i g a n
I l l i n o i s
\\LAKEFRONT\PROJ\EPA\382079_RAC2_LINCOLNPARK_WP\MAPFILES\BASISOFDESIGNREPORT\FIGURE 01 - LINCOLNPARKSITELOCATION.MXD MPETERSH 12/17/2010 09:22:18

X002005000LOC FILENAME
Figure 2 Lincoln Park/Milwaukee River Wastewater Management Flow ChartBasis of Design ReportLincoln Park/Milwaukee River SiteGlendale, WI
1. SW Undisturbed Areas
Examples:-Initial Dewatering-Lincoln Creek Upstream Diversion Around Disturbed Areas-Precipitation on Undisturbed Areas-Storm Sewer Outfall on Undisturbed Areas-Major Precipitation Event Overtops Diversion Devices and is Not Collected in Work Area
2. SW Disturbed Areas
Examples:-Major Precipitation Event Overtops Diversion Devices and is Collected in Work Area-Precipitation Collected on Disturbed Areas-Storm Sewer Outfall on Disturbed Areas
3. GW Disturbed Areas
Examples: -In Excavation Below Normal Water Table-During Removal of Contaminated Sediment-Restoration After Removal of Contaminated Sediment
4. Decon Water
Examples: -Collected from Cleaning Trucks and Equipment on Decon Pads-Dewatering on TSCA Staging Pad
Does the Disturbed Area in Question Have Sediment >1ppm
PCBs (Based on RI Data or Conf. Samples)?
Yes
No
No Treatment Required; Discharge Directly to River With
Energy Dissipation
Yes
No
Pump Water That Is >12 Inches Above
the Disturbed Surface
Outfalls 001 (North Bridge) & 002 (South Bridge)Treat to Remove TSS; Discharge to River With Energy
Dissipation(Ch. 30 Requirement Incorporated Into WPDES
Wastewater Permit)
Is There More Than 12 Inches of Water Above the
Disturbed Surface?
Pump Water That Is <12 Inches Above
the Disturbed Surface
Outfall 003Treat to Remove TSS and PCBs; Discharge to River With Energy Dissipation (WPDES Wastewater Permit TSS/PCB Treatment
Requirement)
Is it Pumped Before Entering Limits of Work?
Yes
No
Is it Pumped?
No
Yes

Appendix C Sediment Modeling


Appendix D Design Calculations


Total
Sediment
Volume
Exceeding
Lateral
Area
Exceeding
Volume
Exceeding
Total
Weight of
PCBs
Non TSCA Dry
Weight (TON)
TSCA Dry
Weight (TON) Dry Weight (lbs)
Average
Conc.
(mg/kg)
Average
Conc.
(mg/lb)
Total Mass (mg/lb *
lbs=mg)
Total Mass (mg/1000 *
0.00220lb/gm)
Volume
(yd3)
1 mg/kg
and <50
mg/kg
(yd3)
1 mg/kg
(square
feet [ft2])
50 mg/kg
(yd3)
Exceeding
1 mg/kg
(lbs)
1 9,300 9,200 271,700 0 39.1 12,880 0 25,760,000 1.52 0.689467 17,760,682.21 39.1
2a 42,000 23,700 287,300 9,100 2,685 33,180 12,740 91,840,000 29.30 13.29039 1,220,589,676.13 2685.3
2b 56,500 38,100 463,700 4,600 807 53,340 6,440 119,560,000 6.76 3.066316 366,608,727.21 806.5
3a 11,900 11,300 135,500 600 228.4 15,820 840 33,320,000 6.87 3.116212 103,832,169.10 228.4
Total 119,700 82,300 1,158,200 14,300 3,759 115,220 20,020 270,480,000 3759.3
Zone
Summary of Estimated Sediment

Appendix E Moss American Borrow Material Sampling

T E C H N I C A L M E M O R A N D U M
Moss American Stockpile Soil Sampling Summary Lincoln Park / Milwaukee River Channel Sediments Site, Milwaukee, WI WA No. 065-RDRD-2508, Contract No. EP-S5-06-01 PREPARED FOR: U.S. Environmental Protection Agency PREPARED BY: CH2M HILL DATE: December 17, 2010
Introduction This memorandum describes the objectives, procedures, and results of the field investigation associated the Lincoln Park/Milwaukee River Channel Phase 1 Remedial Design, within the Milwaukee River Estuary Area of Concern. The field investigation was conducted on April 29, 2010, in accordance with the following site-specific plans prepared by CH2M HILL and approved by the U.S. Environmental Protection Agency (USEPA):
• Moss-American Stockpile Soil Sampling Plan (CH2M HILL, April 2010)
• Lincoln Park Phase 2 Remedial Investigation Quality Assurance Project Plan (CH2M HILL, February 2010)
• Lincoln Park Phase 2 Remedial Investigation Health and Safety Plan (CH2M HILL, February 2010)
Background The 88-acre Moss-American site at the intersection of Brown Deer and Granville Roads on the northwest side of Milwaukee, WI, includes a former creosote facility. It operated from 1921 to 1976 as a wood-preserving facility treating railroad ties with a creosote and fuel-oil mixture. Contaminants of concern at the site include polychlorinated aromatic hydrocarbons and organic compounds such as benzene, toluene, ethylbenzene, and xylene. Remediation of the site consisted of excavating and treating contaminated soils, removal and offsite disposal of contaminated sediments from the Little Menomonee River, and collecting and treating contaminated site groundwater.
Objectives The purpose of the current investigation is to collect data to characterize the chemical and physical characteristics of stockpiled soil sources for potential reuse during the remedial action at the Lincoln Park/Milwaukee River Channel site. Three separate stockpiles were considered and sampled for potential material reuse: the Leon stockpile (9,500 yd3), Calumet access road (1,900 yd3), and Calumet soil stockpile (16,800 yd3). Reuse options during the remedial action include the following two primary uses:
• Fill material such as shoreline restoration.
MKE/110050005 1

MOSS AMERICAN STOCKPILE SOIL SAMPLING SUMMARY: LINCOLN PARK / MILWAUKEE RIVER CHANNEL SEDIMENTS SITE, MILWAUKEE
2 MKE/110050005
• Construction of haul roads, equipment staging pads, and material handling pads in designated upland areas.
This memorandum summarizes the following:
• Field activities, including sample locations and methods as specified within the site-specific project plans.
• Field observations of each stockpile, including overall material composition and presence of debris, photographic documentation of each stockpile (Attachment 1), tabulated analytical results (PCB Aroclors, SVOCs pesticides, herbicides, and TAL metals), and geotechnical results (grain size, total organic carbon).
Field Activities Procedures and methodologies for collecting soil samples were consistent with the field sampling plan. Each sample was collected for analysis of PCB Aroclors, SVOCs pesticides, herbicides, TAL metals, TOC, and particle size. Sampling consisted of collecting 10 soil samples from the 3 stockpiles at the Moss-American site (Figure E1). Samples MA-SO01-1.0/2.0, MA-SO02-2.0/3.0, and MA-SO03-3.0/4.0 were collected within the Leon stockpile consisting of used road base material. Samples MA-SO04-1.0/2.0, MA-SO05-1.0/2.0, and MA-SO06-1.0/2.0 were collected within the Calumet access road to represent an estimated 1,500 feet of road base material. Samples MA-SO07-1.0/2.0, MA-SO08-1.0/2.0, MA-SO09-1.0/2.0, and MA-SO10-1.0/2.0 were collected within the Calumet soil stockpile to represent an estimated 16,800 yd3 of excavated flood plain soil. One field replicate, one equipment blank, and one matrix spike/matrix spike duplicate sample were collected in accordance with the field sampling plan.
During soil sampling, each stockpile was visually inspected for debris and noted within field documentation. Sample locations within each stockpile were distributed uniformly, and samples were collected using a decontaminated hand auger or shovel. Samples were then homogenized using decontaminated stainless steel spoons and aluminum pans, and transferred into the sample containers specified by the field sampling plan. Samples were then shipped overnight on ice at 4°C to the respective CLP and CRL laboratories for pending analysis. Each sample location was recorded using a handheld global positioning system unit capable of a horizontal accuracy of ± 3 feet (Figure E1).
Analytical and Geotechnical Results Table E1 summarizes the geotechnical data and Table E2 the analytical data. Analytical data results were each compared to the Threshold Effect Concentration (TEC) values of the WDNR sediment quality guidelines. TEC is the upper limit concentration in sediments at which toxicity to benthic dwelling organisms is predicted to be unlikely. Analytical results from the 10 samples collected within the stockpiles are below their respective TEC values (Table E2). The results indicate that the soils stockpiled at the Moss-American site are an acceptable source of borrow material for the Lincoln Park/Milwaukee River site.
Attachment 2 is a detailed data quality evaluation memorandum. The key findings of that evaluation indicated that the completeness objective of 90 percent was met for all method/ analyte combinations. The evaluation also found that the precision and accuracy of the data, as measured by field and laboratory QC indicators, indicated that the data quality objectives were met.

Tables

TABLE E-1Summary of Moss American Grain Size and Organic Carbon Data
Lincoln Park/Milwaukee River Basis of Design Report
% Retained
Sieve 10 Sieve 16 Sieve 35 Sieve 50 Sieve 100 Sieve 200 Sieve Bottom
MA-SO01-1.0/2.0 10CL11-01 1–2 32.7 7.8 8.7 3.7 4.5 4 38.5 32.7 28.7 38.5 5.5
MA-SO01-1.0/2.0-FR 10CL11-02 1–2 31.8 9.7 10 4.5 5.6 4.7 33.5 31.8 34.5 33.5 4.6
MA-SO02-2.0/3.0 10CL11-03 2–3 49.4 6.1 6 2.7 3.5 3.1 29.1 49.4 21.4 29.1 5.8
MA-SO03-3.0/4.0 10CL11-04 3–4 41.5 5.6 6.3 3.1 4.2 3.3 35.9 41.5 22.5 35.9 7.8
MA-SO04-1.0/2.0 10CL11-05 1–2 46.1 10.3 9.4 3 2.6 1.7 26.8 46.1 27 26.8 6.4
MA-SO05-1.0/2.0 10CL11-06 1–2 52.4 8.2 7.6 2.5 2.2 1.6 25.3 52.4 22.1 25.3 9.6
MA-SO06-1.0/2.0 10CL11-07 1–2 51.4 6.9 6.8 2.5 2.6 1.9 27.8 51.4 20.7 27.8 3.8
MA-SO07-1.0/2.0 10CL11-08 1–2 8.9 2.3 4.6 4.3 8.5 6.1 65 8.9 25.8 65 0.6
MA-SO08-1.0/2.0 10CL11-09 1–2 1.8 2.7 7.4 7.4 12.3 7.6 60.8 1.8 37.4 60.8 1.6
MA-SO09-1.0/2.0 10CL11-10 1–2 10 3.4 5.5 5.4 8.9 5.7 60.9 10 28.9 60.9 0.6
MA-SO10-1.0/2.0 10CL11-11 1–2 12.2 3.2 5.6 5 10.2 6.3 58.1 12.2 30.3 58.1 4.4
Leon Stockpile
Calumet Access Road
Calumet Stockpile
Organic Carbon
[%]Field Sample IDStock Pile
% Coarse Sand and
Gravel
and
Medium Sand
% Fines
Sample Interval
(ft)CRL
Sample ID

1 of 4
TABLE E-2Summary of Moss American Analytical Data
Lincoln Park/Milwaukee River Basis of Design Report
MetalsAntimony mg/kg 6.7 UJ 7 UJ 7.1 UJ 6.5 UJ 6.5 UJ 6.5 UJ 7.1 UJ 7.5 UJ 7.1 UJ 8.1 UJArsenic 9.8 mg/kg 2.8 J 3.1 J 3.3 J 2 J 1.1 J 2.1 J 7.8 J 4.2 J 6.9 J 4.9 JCadmium 0.99 mg/kg 0.11 J 0.18 J 0.21 J 0.54 UJ 0.54 UJ 0.024 J 0.12 J 0.19 J 0.25 J 0.4 JChromium, total 43 mg/kg 7.9 9.3 9.4 5.7 5.4 6.6 19.6 20.5 15 19.7Copper 150 mg/kg 7.7 13.3 11.8 3.5 2.8 5.3 21.8 15.1 22.5 18.2Iron 40000 mg/kg 6840 7020 7870 3790 3510 4740 19800 16800 15800 18000Lead 130 mg/kg 8.4 J+ 17.2 J+ 11 J+ 3.9 J+ 1.6 J+ 3.6 J+ 9.8 J+ 13.8 J+ 12.8 J+ 20 J+Manganese 1100 mg/kg 244 205 248 108 115 132 277 323 323 212Mercury 1.1 mg/kg 0.079 J 0.075 J 0.097 J 0.066 J 0.083 J 0.11 U 0.074 J 0.1 J 0.058 J 0.096 JNickel 49 mg/kg 9 10.5 10.2 7.3 6.3 8 22.9 17.5 21.7 17.3Silver mg/kg 1.1 U 1.2 U 1.2 U 1.1 U 1.1 U 1.1 U 1.2 U 1.3 U 1.2 U 1.4 UZinc 120 mg/kg 37.5 58.1 60.1 7.9 5.5 J 18.7 66.1 84.1 88.6 97.3PAH2-Methylnaphthalene µg/kg 120 U 110 U 120 U 110 U 110 U 100 U 110 U 120 U 120 U 140 UAcenaphthene µg/kg 120 U 110 U 120 U 110 U 110 U 100 U 110 U 120 U 120 U 140 UAcenaphthylene µg/kg 120 U 110 U 120 U 110 U 110 U 100 U 110 U 120 U 120 U 140 UAnthracene µg/kg 120 U 110 U 120 U 110 U 110 U 100 U 110 U 120 U 120 U 140 UBenzo(a)anthracene µg/kg 120 U 110 U 120 U 110 U 110 U 100 U 110 U 120 U 120 U 140 UBenzo(a)pyrene µg/kg 120 U 110 U 120 U 110 U 110 U 100 U 110 U 120 U 120 U 140 UBenzo(b)fluoranthene µg/kg 120 U 110 U 120 U 110 U 110 U 100 U 110 U 120 U 120 U 140 UBenzo(g,h,i)perylene µg/kg 120 U 110 U 120 U 110 U 110 U 100 U 110 U 120 U 120 U 140 UBenzo(k)fluoranthene µg/kg 120 U 110 U 120 U 110 U 110 U 100 U 110 U 120 U 120 U 140 UChrysene µg/kg 120 U 110 U 120 U 110 U 110 U 100 U 110 U 120 U 120 U 140 UDibenz(a,h)anthracene µg/kg 120 U 110 U 120 U 110 U 110 U 100 U 110 U 120 U 120 U 140 UFluoranthene 423 µg/kg 120 U 58 J 120 U 110 U 110 U 100 U 110 U 120 U 120 U 140 UFluorene µg/kg 120 U 110 U 120 U 110 U 110 U 100 U 110 U 120 U 120 U 140 UIndeno(1,2,3-c,d)pyrene µg/kg 120 U 110 U 120 U 110 U 110 U 100 U 110 U 120 U 120 U 140 UNaphthalene µg/kg 120 U 110 U 120 U 110 U 110 U 100 U 110 U 120 U 120 U 140 UPhenanthrene µg/kg 120 U 110 U 120 U 110 U 110 U 100 U 110 U 120 U 120 U 140 UPyrene µg/kg 120 U 110 U 120 U 110 U 110 U 100 U 110 U 120 U 120 U 140 U
Calumet Soil StockpileMA-SO-07 MA-SO-08 MA-SO-09 MA-SO-10
Analyte TEC Screening Value
UnitsMA-SO-01 MA-SO-02 MA-SO-03 MA-SO-04 MA-SO-05 MA-SO-06
Leon Stockpile Calument Access Road

2 of 4
TABLE E-2Summary of Moss American Analytical Data
Lincoln Park/Milwaukee River Basis of Design Report
Calumet Soil StockpileMA-SO-07 MA-SO-08 MA-SO-09 MA-SO-10
Analyte TEC Screening Value
UnitsMA-SO-01 MA-SO-02 MA-SO-03 MA-SO-04 MA-SO-05 MA-SO-06
Leon Stockpile Calument Access Road
PesticidesAldrin µg/kg 0.12 R 0.11 R 0.12 R 0.1 R 0.11 R 0.11 R 0.11 R 0.12 R 0.12 R 0.14 RAlpha BHC (alpha hexachlorocyclohexane) µg/kg 0.12 U 0.11 U 0.12 U 0.1 U 0.11 U 0.11 U 0.11 U 0.12 U 0.12 U 0.14 UAlpha endosulfan µg/kg 0.12 U 0.11 U 0.12 U 0.1 U 0.11 U 0.11 U 0.11 U 0.12 U 0.12 U 0.14 UAlpha-chlordane µg/kg 0.12 U 0.11 U 0.12 U 0.1 U 0.11 U 0.11 U 0.11 U 0.12 U 0.12 U 0.14 UBeta BHC (beta hexachlorocyclohexane) µg/kg 0.12 U 0.11 U 0.12 U 0.1 U 0.11 U 0.11 U 0.11 U 0.12 U 0.12 U 0.14 UBeta endosulfan µg/kg 0.24 U 0.22 U 0.24 U 0.21 U 0.21 U 0.21 U 0.23 U 0.25 U 0.24 U 0.28 UBeta-chlordane µg/kg 0.12 U 0.11 U 0.12 U 0.1 U 0.11 U 0.11 U 0.11 U 0.12 U 0.12 U 0.14 UDelta BHC (delta hexachlorocyclohexane) µg/kg 0.12 U 0.11 U 0.12 U 0.1 U 0.11 U 0.11 U 0.11 U 0.12 U 0.12 U 0.14 UDieldrin µg/kg 0.24 U 0.22 U 0.24 U 0.21 U 0.21 U 0.21 U 0.23 U 0.25 U 0.24 U 0.28 UEndosulfan sulfate µg/kg 0.24 U 0.22 U 0.24 U 0.21 U 0.21 U 0.21 U 0.23 U 0.25 U 0.24 U 0.28 UEndrin µg/kg 0.24 U 0.22 U 0.24 U 0.21 U 0.21 U 0.21 U 0.23 U 0.25 U 0.24 U 0.28 UEndrin aldehyde µg/kg 0.24 U 0.22 U 0.24 U 0.21 U 0.21 U 0.21 U 0.23 U 0.25 U 0.24 U 0.28 UEndrin ketone µg/kg 0.24 U 0.22 U 0.24 U 0.21 U 0.21 U 0.21 U 0.23 U 0.25 U 0.24 U 0.28 UGamma BHC (lindane) µg/kg 0.12 U 0.11 U 0.12 U 0.1 U 0.11 U 0.11 U 0.11 U 0.12 U 0.12 U 0.14 UHeptachlor µg/kg 0.12 U 0.11 U 0.12 U 0.1 U 0.11 U 0.11 U 0.11 U 0.12 U 0.12 U 0.14 UHeptachlor epoxide µg/kg 0.12 U 0.11 U 0.12 U 0.1 U 0.11 U 0.11 U 0.11 U 0.12 U 0.12 U 0.14 UMethoxychlor µg/kg 1.2 U 1.1 U 1.2 U 1 U 1.1 U 1.1 U 1.1 U 1.2 U 1.2 U 1.4 UP,p'-DDD µg/kg 0.24 U 0.22 U 0.24 U 0.21 U 0.21 U 0.21 U 0.23 U 0.25 U 0.24 U 0.28 UP,p'-DDE µg/kg 0.13 U 0.23 U 0.27 U 0.21 U 0.21 U 0.21 U 0.18 U 0.19 UJ 0.24 U 0.19 UP,p'-DDT 4.2 µg/kg 0.11 J 0.22 UJ 0.24 U 0.21 U 0.21 U 0.21 U 0.064 U 0.24 J 0.24 U 0.11 UToxaphene µg/kg 12 U 11 U 12 U 10 U 11 U 11 U 11 U 12 U 12 U 14 UPolychlorinated Biphenyls (PCBs)PCB-1016 (Arochlor 1016) µg/kg 2.4 U 2.2 U 2.4 U 2.1 U 2.1 U 2.1 U 2.3 U 2.5 U 2.4 U 2.8 UPCB-1221 (Arochlor 1221) µg/kg 2.4 U 2.2 U 2.4 U 2.1 U 2.1 U 2.1 U 2.3 U 2.5 U 2.4 U 2.8 UPCB-1232 (Arochlor 1232) µg/kg 2.4 U 2.2 U 2.4 U 2.1 U 2.1 U 2.1 U 2.3 U 2.5 U 2.4 U 2.8 UPCB-1242 (Arochlor 1242) µg/kg 2.4 U 2.2 U 2.4 U 2.1 U 2.1 U 2.1 U 2.3 U 2.5 U 2.4 U 2.8 UPCB-1248 (Arochlor 1248) µg/kg 2.4 U 2.2 U 2.4 U 2.1 U 2.1 U 2.1 U 2.3 U 2.5 U 2.4 U 2.8 UPCB-1254 (Arochlor 1254) µg/kg 2.4 U 2.2 U 2.4 U 2.1 U 2.1 U 2.1 U 2.3 U 2.5 U 2.4 U 2.8 UPCB-1260 (Arochlor 1260) 60 (total PCB) µg/kg 2.4 U 4.2 J 2.4 U 2.1 U 2.1 U 2.1 U 2.3 U 2.5 U 2.4 U 2.8 UPCB-1262 (Arochlor 1262) µg/kg 2.4 U 2.2 U 2.4 U 2.1 U 2.1 U 2.1 U 2.3 U 2.5 U 2.4 U 2.8 UPCB-1268 (Arochlor 1268) µg/kg 2.4 U 2.2 U 2.4 U 2.1 U 2.1 U 2.1 U 2.3 U 2.5 U 2.4 U 2.8 U

3 of 4
TABLE E-2Summary of Moss American Analytical Data
Lincoln Park/Milwaukee River Basis of Design Report
Calumet Soil StockpileMA-SO-07 MA-SO-08 MA-SO-09 MA-SO-10
Analyte TEC Screening Value
UnitsMA-SO-01 MA-SO-02 MA-SO-03 MA-SO-04 MA-SO-05 MA-SO-06
Leon Stockpile Calument Access Road
SVOCs1,2,4,5-Tetrachlorobenzene µg/kg 120 U 110 U 120 U 110 U 110 U 100 U 110 U 120 U 120 U 140 U2,3,4,6-Tetrachlorophenol µg/kg 120 U 110 U 120 U 110 U 110 U 100 U 110 U 120 U 120 U 140 U2,4,5-Trichlorophenol µg/kg 120 U 110 U 120 U 110 U 110 U 100 U 110 U 120 U 120 U 140 U2,4,6-Trichlorophenol µg/kg 120 U 110 U 120 U 110 U 110 U 100 U 110 U 120 U 120 U 140 U2,4-Dichlorophenol µg/kg 120 U 110 U 120 U 110 U 110 U 100 U 110 U 120 U 120 U 140 U2,4-Dimethylphenol µg/kg 120 U 110 U 120 U 110 U 110 U 100 U 110 U 120 U 120 U 140 U2,4-Dinitrophenol µg/kg 240 U 220 U 240 U 210 U 210 U 210 U 230 U 250 U 240 U 280 U2,4-Dinitrotoluene µg/kg 120 U 110 U 120 U 110 U 110 U 100 U 110 U 120 U 120 U 140 U2,6-Dinitrotoluene µg/kg 120 U 110 U 120 U 110 U 110 U 100 U 110 U 120 U 120 U 140 U2-Chloronaphthalene µg/kg 120 U 110 U 120 U 110 U 110 U 100 U 110 U 120 U 120 U 140 U2-Chlorophenol µg/kg 120 U 110 U 120 U 110 U 110 U 100 U 110 U 120 U 120 U 140 U2-Methylphenol (o-cresol) µg/kg 120 U 110 U 120 U 110 U 110 U 100 U 110 U 120 U 120 U 140 U2-Nitroaniline µg/kg 240 U 220 U 240 U 210 U 210 U 210 U 230 U 250 U 240 U 280 U2-Nitrophenol µg/kg 120 U 110 U 120 U 110 U 110 U 100 U 110 U 120 U 120 U 140 U3,3'-Dichlorobenzidine µg/kg 120 U 110 U 120 U 110 U 110 U 100 U 110 U 120 U 120 U 140 U3-Nitroaniline µg/kg 240 U 220 U 240 U 210 U 210 U 210 U 230 U 250 U 240 U 280 U4,6-Dinitro-2-methylphenol µg/kg 240 U 220 U 240 U 210 U 210 U 210 U 230 U 250 U 240 U 280 U4-Bromophenyl phenyl ether µg/kg 120 U 110 U 120 U 110 U 110 U 100 U 110 U 120 U 120 U 140 U4-Chloro-3-methylphenol µg/kg 120 U 110 U 120 U 110 U 110 U 100 U 110 U 120 U 120 U 140 U4-Chloroaniline µg/kg 120 U 110 U 120 U 110 U 110 U 100 U 110 U 120 U 120 U 140 U4-Chlorophenyl phenyl ether µg/kg 120 U 110 U 120 U 110 U 110 U 100 U 110 U 120 U 120 U 140 U4-Methylphenol (p-cresol) µg/kg 120 U 110 U 120 U 110 U 110 U 100 U 110 U 120 U 120 U 140 U4-Nitroaniline µg/kg 240 U 220 U 240 U 210 U 210 U 210 U 230 U 250 U 240 U 280 U4-Nitrophenol µg/kg 240 U 220 U 240 U 210 U 210 U 210 U 230 U 250 U 240 U 280 UAcetophenone µg/kg 120 U 110 U 120 U 110 U 110 U 100 U 110 U 120 U 120 U 140 UAtrazine µg/kg 120 U 110 U 120 U 110 U 110 U 100 U 110 U 120 U 120 U 140 UBenzaldehyde µg/kg 120 U 110 U 120 U 110 U 110 U 100 U 110 U 120 U 120 U 140 UBenzyl butyl phthalate µg/kg 120 U 110 U 120 U 110 U 110 U 100 U 110 U 120 U 120 U 140 UBiphenyl (diphenyl) µg/kg 120 U 110 U 120 U 110 U 110 U 100 U 110 U 120 U 120 U 140 UBis(2-chloroethoxy)methane µg/kg 120 U 110 U 120 U 110 U 110 U 100 U 110 U 120 U 120 U 140 U( y ) ( y ether) µg/kg 120 U 110 U 120 U 110 U 110 U 100 U 110 U 120 U 120 U 140 UBis(2-chloroisopropyl)ether µg/kg 120 U 110 U 120 U 110 U 110 U 100 U 110 U 120 U 120 U 140 UBis(2-ethylhexyl)phthalate µg/kg 120 U 110 U 120 U 110 U 110 U 100 U 110 U 120 U 120 U 140 UCaprolactam µg/kg 120 U 110 U 120 U 110 U 110 U 100 U 110 U 120 U 120 U 140 UCarbazole µg/kg 120 U 110 U 120 U 110 U 110 U 100 U 110 U 120 U 120 U 140 UDibenzofuran µg/kg 120 U 110 U 120 U 110 U 110 U 100 U 110 U 120 U 120 U 140 UDiethyl phthalate µg/kg 120 U 110 U 120 U 110 U 110 U 100 U 110 U 120 U 120 U 140 UDimethyl phthalate µg/kg 120 U 110 U 120 U 110 U 110 U 100 U 110 U 120 U 120 U 140 UDi-n-butyl phthalate 2200 µg/kg 84 J 99 J 83 J 68 J 58 J 73 J 79 J 94 J 63 J 85 JDi-n-octylphthalate µg/kg 120 U 110 U 120 U 110 U 110 U 100 U 110 U 120 U 120 U 140 UHexachlorobenzene µg/kg 120 U 110 U 120 U 110 U 110 U 100 U 110 U 120 U 120 U 140 U

4 of 4
TABLE E-2Summary of Moss American Analytical Data
Lincoln Park/Milwaukee River Basis of Design Report
Calumet Soil StockpileMA-SO-07 MA-SO-08 MA-SO-09 MA-SO-10
Analyte TEC Screening Value
UnitsMA-SO-01 MA-SO-02 MA-SO-03 MA-SO-04 MA-SO-05 MA-SO-06
Leon Stockpile Calument Access Road
Hexachlorobutadiene µg/kg 120 U 110 U 120 U 110 U 110 U 100 U 110 U 120 U 120 U 140 UHexachlorocyclopentadiene µg/kg 120 U 110 U 120 U 110 U 110 U 100 U 110 U 120 U 120 U 140 UHexachloroethane µg/kg 120 U 110 U 120 U 110 U 110 U 100 U 110 U 120 U 120 U 140 UIsophorone µg/kg 120 U 110 U 120 U 110 U 110 U 100 U 110 U 120 U 120 U 140 UNitrobenzene µg/kg 120 U 110 U 120 U 110 U 110 U 100 U 110 U 120 U 120 U 140 UN-nitrosodi-n-propylamine µg/kg 120 U 110 U 120 U 110 U 110 U 100 U 110 U 120 U 120 U 140 UN-nitrosodiphenylamine µg/kg 120 U 110 U 120 U 110 U 110 U 100 U 110 U 120 U 120 U 140 UPentachlorophenol µg/kg 240 U 220 U 240 U 210 U 210 U 210 U 230 U 250 U 240 U 280 UPhenol µg/kg 120 U 110 U 120 U 110 U 110 U 100 U 110 U 120 U 120 U 140 U
Note: Detected concentrations shown in bold.
Wisconsin DNR TEC screening values shown for detected analytes only

Figure
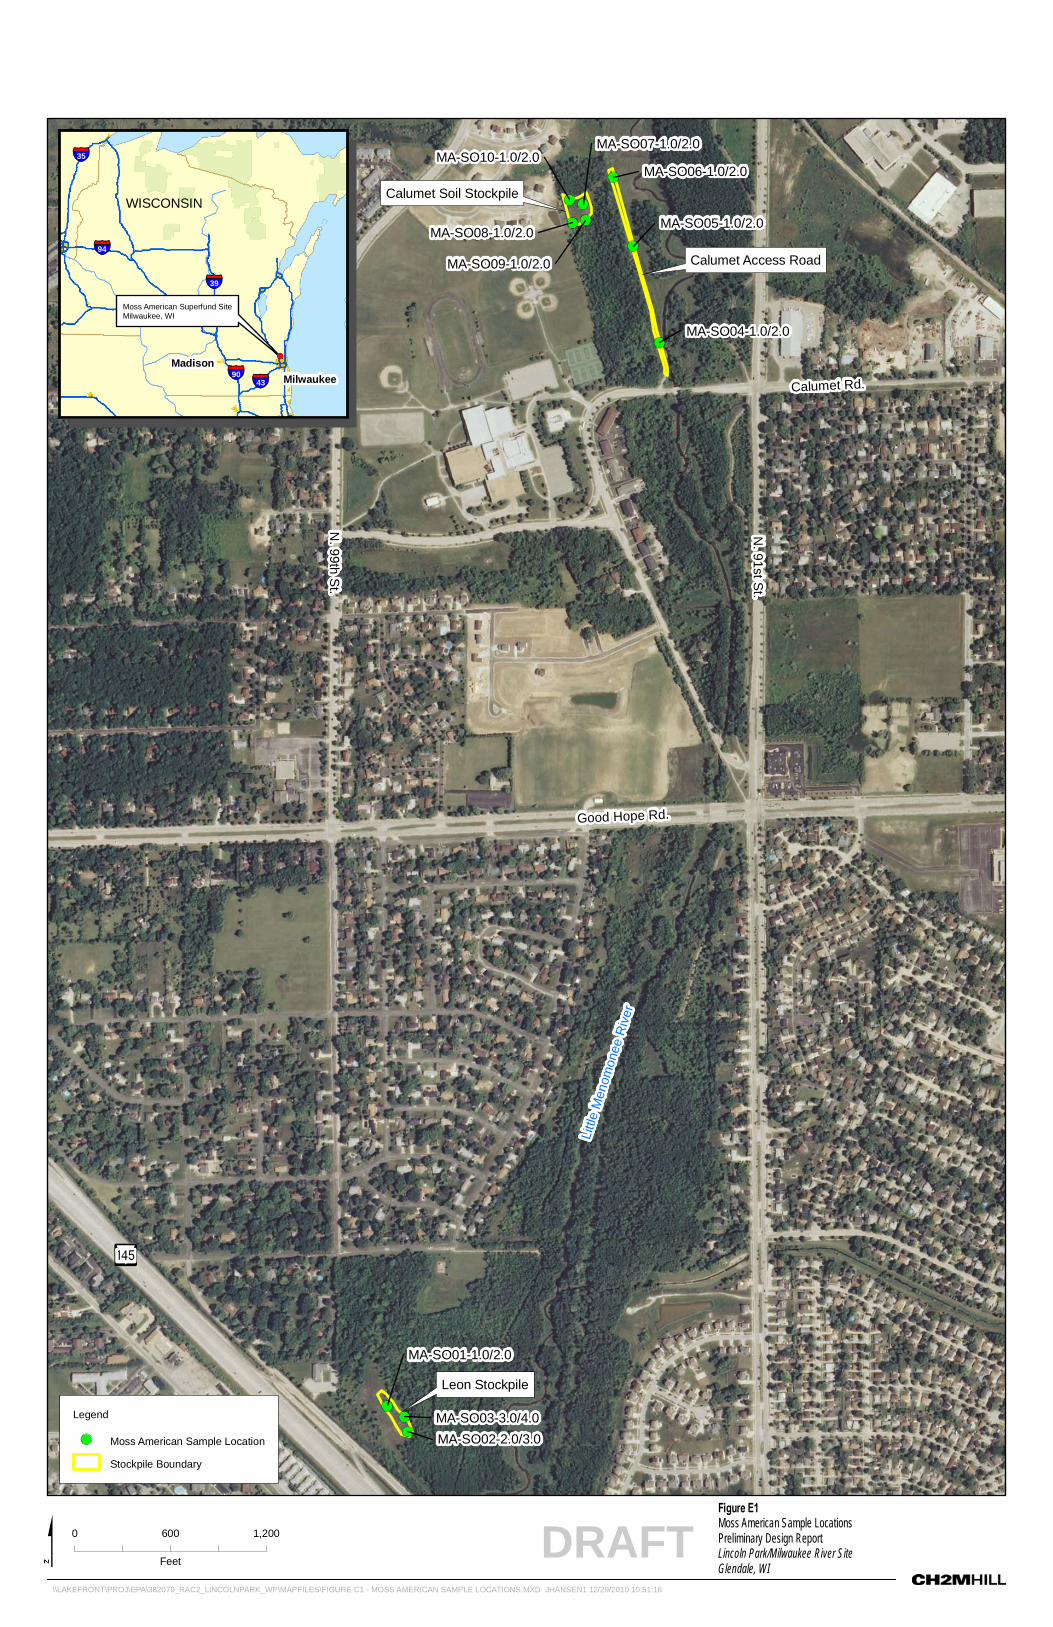
Calumet Rd.
N. 9
1st S
t.
Good Hope Rd.
N. 9
9th
St.
Littl
e M
enom
onee
Riv
er
Calumet Access Road
Calumet Soil Stockpile
Leon Stockpile
MA-SO10-1.0/2.0
MA-SO09-1.0/2.0
MA-SO08-1.0/2.0
MA-SO06-1.0/2.0
MA-SO05-1.0/2.0
MA-SO04-1.0/2.0
MA-SO03-3.0/4.0
MA-SO02-2.0/3.0
MA-SO07-1.0/2.0
MA-SO01-1.0/2.0
0 600 1,200
FeetDRAFT
Figure E1Moss American Sample LocationsPreliminary Design ReportLincoln Park/Milwaukee River SiteGlendale, WI
Legend
Moss American Sample Location
Stockpile Boundary
\\LAKEFRONT\PROJ\EPA\382079_RAC2_LINCOLNPARK_WP\MAPFILES\FIGURE C1 - MOSS AMERICAN SAMPLE LOCATIONS.MXD JHANSEN1 12/29/2010 10:51:16
Milwaukee
Madison
Moss American Superfund SiteMilwaukee, WI
WISCONSIN
9043
39
94
35

Attachment 1 Photographic Documentation
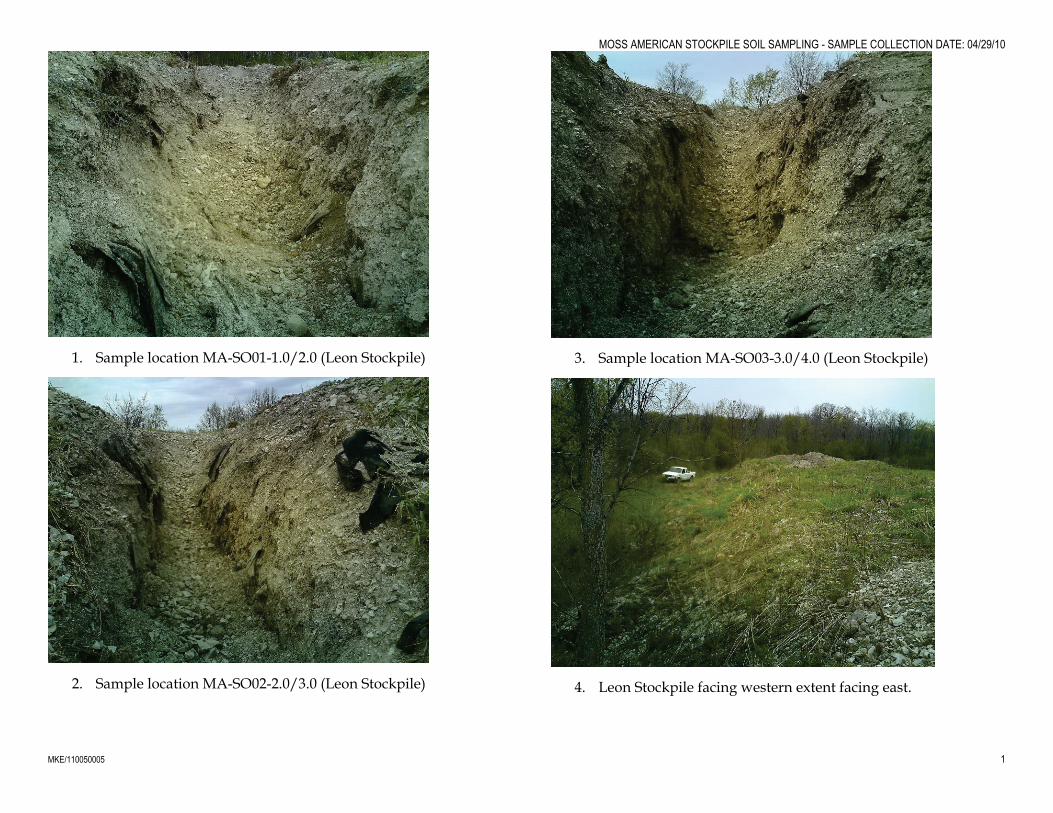
MOSS AMERICAN STOCKPILE SOIL SAMPLING - SAMPLE COLLECTION DATE: 04/29/10
MKE/110050005 1
1. Sample location MA-SO01-1.0/2.0 (Leon Stockpile)
2. Sample location MA-SO02-2.0/3.0 (Leon Stockpile)
3. Sample location MA-SO03-3.0/4.0 (Leon Stockpile)
4. Leon Stockpile facing western extent facing east.
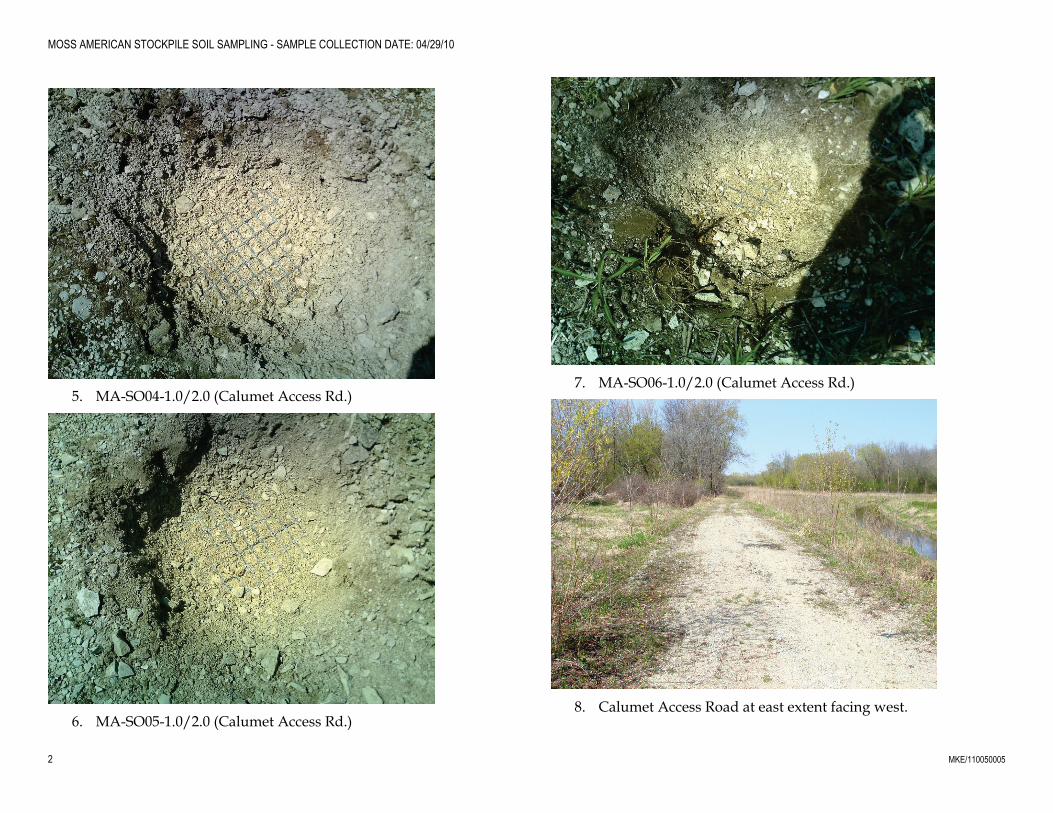
MOSS AMERICAN STOCKPILE SOIL SAMPLING - SAMPLE COLLECTION DATE: 04/29/10
2 MKE/110050005
5. MA-SO04-1.0/2.0 (Calumet Access Rd.)
6. MA-SO05-1.0/2.0 (Calumet Access Rd.)
7. MA-SO06-1.0/2.0 (Calumet Access Rd.)
8. Calumet Access Road at east extent facing west.

MOSS AMERICAN STOCKPILE SOIL SAMPLING - SAMPLE COLLECTION DATE: 04/29/10
MKE/110050005 3
9. Calumet Access Road at west extent facing east
10. Calumet Stockpile southern extent facing north
11. Calumet Stockpile at eastern extent facing west

Attachment 2 Data Usability Report

MKE/110050005 1
T E C H N I C A L M E M O R A N D U M
Data Quality Evaluation—Moss-American Stockpile Soil Sampling: Lincoln Park/Milwaukee River Channel Sediments Site, Milwaukee, WI WA No. 065-RDRD-2508, Contract No. EP-S5-06-01 PREPARED FOR: USEPA, GLNPO PREPARED BY: CH2M HILL DATE: September 9, 2010
Introduction The object of the data quality evaluation was to assess the quality of analytical results for samples collected at the Moss-American Superfund Site. Samples were collected and analyzed to characterize the chemical and physical characteristics of the stockpiled soil sources for potential reuse during the remedial action activities at the Lincoln Park/ Milwaukee River Channel Site. Individual method requirements and guidelines from the Lincoln Park/Milwaukee River Channel Sediment Site Quality Assurance Project Plan (CH2M HILL, 2010), Contract Laboratory Program National Functional Guidelines for Superfund Organic Methods Data Review (USEPA, 2008), and Contract Laboratory Program National Functional Guidelines for Inorganic Data Review (USEPA, 2004) were used. This memorandum is intended as a general data quality assessment designed to summarize data issues.
Analytical Data The following are the analytical laboratory analyses for samples collected:
Ten sediment samples (excluding field quality control [QC] samples) were analyzed for one or more of the following: polychlorinated biphenyl (PCB) Aroclors, pesticides, semivolatile organic compounds (SVOCs), metals, herbicides, particle size distribution, and total organic carbon (TOC).
One field duplicate sample was collected for the same analyses as the sediment sample at the given location.
One equipment blank was collected during the sampling events to evaluate field sampling and decontamination procedures.
The PCB Aroclor, metals, pesticide, herbicide, and SVOC data were analyzed by the USEPA Contract Laboratory Program and subsequently reviewed by CSC, USEPA’s contractor. Appendix A contains the case narratives prepared by CSC during data reviews. The findings of the reviews are summarized below. The TOC and grain size data were analyzed by the USEPA Central Regional Laboratory (CRL) and reviewed by CH2M HILL. The TOC and grain size data also are summarized below.
Samples were collected and shipped by overnight carrier to the laboratories for analysis. Table 1 lists the sampling parameters and methods.
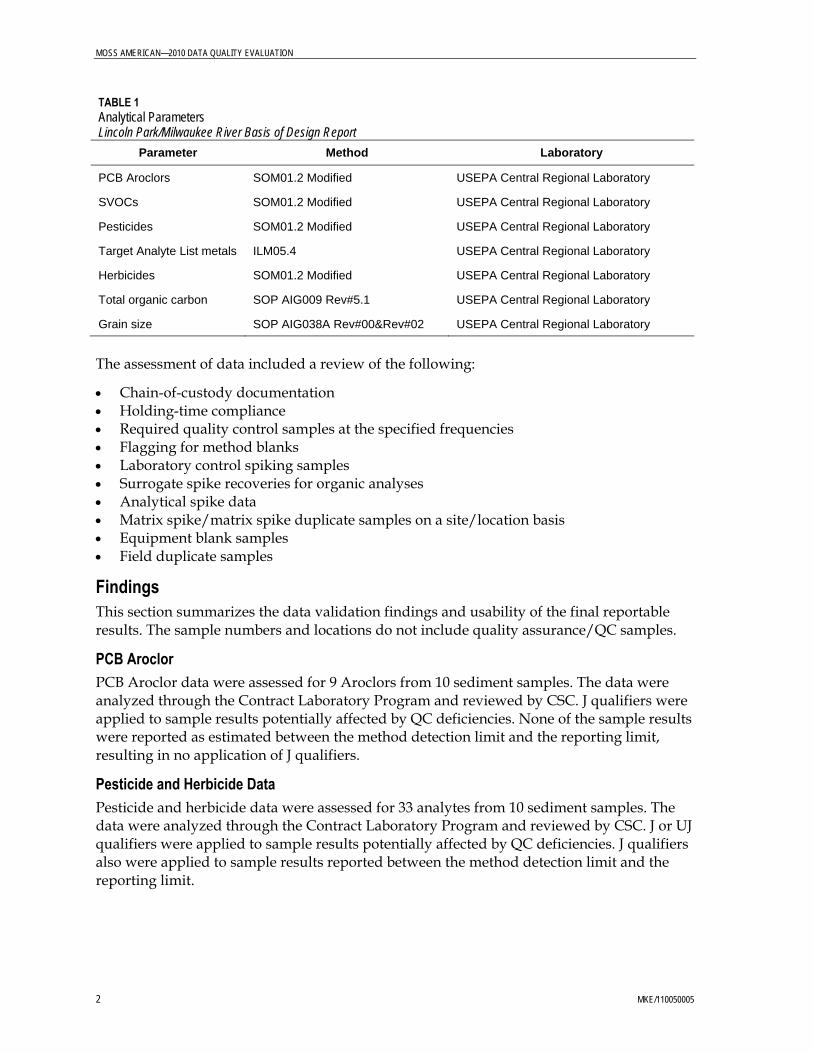
MOSS AMERICAN—2010 DATA QUALITY EVALUATION
2 MKE/110050005
TABLE 1 Analytical Parameters Lincoln Park/Milwaukee River Basis of Design Report
Parameter Method Laboratory
PCB Aroclors SOM01.2 Modified USEPA Central Regional Laboratory
SVOCs SOM01.2 Modified USEPA Central Regional Laboratory
Pesticides SOM01.2 Modified USEPA Central Regional Laboratory
Target Analyte List metals ILM05.4 USEPA Central Regional Laboratory
Herbicides SOM01.2 Modified USEPA Central Regional Laboratory
Total organic carbon SOP AIG009 Rev#5.1 USEPA Central Regional Laboratory
Grain size SOP AIG038A Rev#00&Rev#02 USEPA Central Regional Laboratory
The assessment of data included a review of the following:
Chain-of-custody documentation Holding-time compliance Required quality control samples at the specified frequencies Flagging for method blanks Laboratory control spiking samples Surrogate spike recoveries for organic analyses Analytical spike data Matrix spike/matrix spike duplicate samples on a site/location basis Equipment blank samples Field duplicate samples
Findings This section summarizes the data validation findings and usability of the final reportable results. The sample numbers and locations do not include quality assurance/QC samples.
PCB Aroclor PCB Aroclor data were assessed for 9 Aroclors from 10 sediment samples. The data were analyzed through the Contract Laboratory Program and reviewed by CSC. J qualifiers were applied to sample results potentially affected by QC deficiencies. None of the sample results were reported as estimated between the method detection limit and the reporting limit, resulting in no application of J qualifiers.
Pesticide and Herbicide Data Pesticide and herbicide data were assessed for 33 analytes from 10 sediment samples. The data were analyzed through the Contract Laboratory Program and reviewed by CSC. J or UJ qualifiers were applied to sample results potentially affected by QC deficiencies. J qualifiers also were applied to sample results reported between the method detection limit and the reporting limit.

MOSS AMERICAN—2010 DATA QUALITY EVALUATION
MKE/110050005 3
Semivolatile Data Semivolatile data were assessed for 67 analytes, including the 17 PAHs, from 10 sediment samples. The data were analyzed through the Contract Laboratory Program and reviewed by CSC. J qualifiers were also applied to sample results that were reported between the method detection limit and the reporting limit. No additional qualification was necessary based on review by the validators.
Metals Data Metals data were assessed for 23 analytes from 10 sediment samples. The data were analyzed through the Contract Laboratory Program and reviewed by CSC. J, J+, UJ, or UJ- qualifiers were applied to sample results that were potentially affected by QC deficiencies. J qualifiers also were applied to sample results that were reported between the method detection limit and the reporting limit.
TOC and Particle Size Data The TOC and particle size data sets underwent a forms review by CH2M HILL staff to assess the lab notes and precision of the field duplicate samples. Completeness of the data set was then derived. CH2M HILL validators added data qualifiers when the QC statistics indicated a possible bias to specific compounds or analytes associated with a particular method and sample batch.
Standard data qualifiers were used as a means of classifying the data as to conformance to QC requirements. The applied data qualifiers are defined as follows:
U The sample target was analyzed for but was not detected at a concentration above the level of the associated limit of detection or quantitation.
J The associated value is an estimated quantity. This qualifier was applied when the data indicated the presence of a specific target analyte but was below the stated reporting (or quantitation) limit, or when quality control statistics alluded to an analytical bias.
UJ The component was analyzed for, but was not detected at a level equal to or greater than the level of detection or quantification (often the reporting limit). This flag is used when QC measurements indicate a possible low bias in the analytical data.
Field Duplicates One field duplicate pair was collected and analyzed for TOC and particle size. If the relative percent difference between the detected sample and field duplicate sample results exceeded 50 percent for sediment, the sample results not previously qualified for any other QC parameter were then qualified for field duplicate precision. The precision criterion of ≤ 50 percent difference between the detected sample and field duplicate sample was met.
Overall Assessment The final activity in the data quality evaluation is an assessment of whether the data meet the data quality objectives. The goal of the assessment was to demonstrate that a sufficient number of representative samples were collected, and the resulting analytical data can be used to support the decision-making process. The following summary highlights the data evaluation findings for the above-defined events:

MOSS AMERICAN—2010 DATA QUALITY EVALUATION
4 MKE/110050005
The completeness objective of 90 percent was met for all method/analyte combinations. The precision and accuracy of the data, as measured by field and laboratory QC
indicators, indicate that the data quality objectives were met.
None of the reported results was rejected. One hundred percent of the data, as qualified, can be used to make project decisions.
References CH2M HILL. 2010. Quality Assurance Project Plan, Lincoln Park/Milwaukee River Channel, Milwaukee, Wisconsin. February.
USEPA. 2008. Contract Laboratory Program National Functional Guidelines for Superfund Organic Methods Data Review. June.
USEPA. 2004. Contract Laboratory Program National Functional Guidelines for Inorganic Data Review. October.

Appendix A Validation Narratives

COMPUTER SCIENCES CORPORATION GREAT LAKES NATIONAL PROGRAM OFFICE
Date: July 14, 2010 Subject: Review of Data Received for Review on: June 16, 2010 From: Melody Jensen Senior Scientist, CSC To: Data User: GLNPO We have reviewed the data for the following case: Site Name: Lincoln Park Case Number: 40069 MRN: 16752 SDG Number: E4SR1 Number and Type of Samples: 11 Sediment Samples and 1 water sample Sample Numbers: E4SR1, E4SR2, E4SR3, E4SR4, E4SR5, E4SR6, E4SR7, E4SR8, E4SR9, E4SS0,
E4SS1, E4SS2 Laboratory: KAP Technologies cc: Sara Goehl, EPA Brenda Jones, EPA Louis Blume, EPA Dan Plomb, CH2M Hill Heather Hodach, CH2M Hill Dave Shekoski, CH2M Hill Huck Raddemann, CH2M Hill Adrienne Unger, CH2M Hill Judy Schofield, CSC

Page 2 of 5 Case Number: 40069 SDG Number: E4SR1 Site Name: Lincoln Park Laboratory: KAP Technologies
Reviewed by: Melody Jensen CSC July 14, 2010
SDG Summary Sample Receipt: Eleven (11) sediment samples labeled E4SR1, E4SR2, E4SR3, E4SR4, E4SR5, E4SR6, E4SR7, E4SR8, E4SR9, E4SS0, and E4SS1, and one (1) water sample labeled E4SS2, were shipped to KAP Technologies in Woodlands, Texas. All samples were collected and shipped on 4/29/2010 and were received on 4/30/2010. Samples E4SR1, E4SR2, E4SR3, E4SR4, E4SR5, E4SR6, and E4SR7 were received at 3.4 °C; samples E4SR8, E4SR9, E4SS0, and E4SS1, and E4SS2 were received at 4.3 °C. Sample Analysis and Data Review: The laboratory narrative incorrectly reported that all samples (including water) were extracted using the sonication method per MA-1675.2 and SW-846-8158A. Only sediment samples were extracted using the sonication method. The Form 1 correctly reports that water sample E4SS2 was prepared using separatory funnel extraction. Samples were analyzed for Herbicide analytes according to CLP SOW SOM01.2, Modification Reference Numbers 1675.2. The sample data were reviewed according to the NFG for SOM01.2, the USEPA Region 2 SOPs for data validation of data, USEPA Contract Laboratory Program, and Modification Reference Numbers 1675.2. The sample matrix is reported as “soil” on Form 1s and in the EDD for the samples in this SDG. The samples are actually “sediment” samples. No QC sample was designated on the traffic reports for this SDG. Sample E4SR3 was used for laboratory QC, i.e. MS/MSDs for sediment samples. No MS/MSD was run for the water sample. Using the field duplicate identification scheme provided by CH2M Hill in the field sampling plan, no samples were identified as field duplicate pairs. In the following sections, QC failures, resulting qualifiers, and associated results are described for each failure. In instances where multiple qualifiers are associated with a given sample result a single final qualifier is applied to that result. If all associated qualifiers described by EXES NFG reports for a particular result conform exactly to the Region 2 SOP requirements for the associated failure scenarios, then the final qualifier applied by the EXES NFG is left intact. However, if at least one of the associated qualifiers described by EXES NFG reports is different from that required by the Region 2 SOP for the relevant failure, OR if a reviewer has chosen a different qualifier for a failure because of best professional judgment, then the most severe qualifier will be applied. Qualifiers from most severe to least severe are: “R,” “NJ,” “UJ,” “U,” “J.”
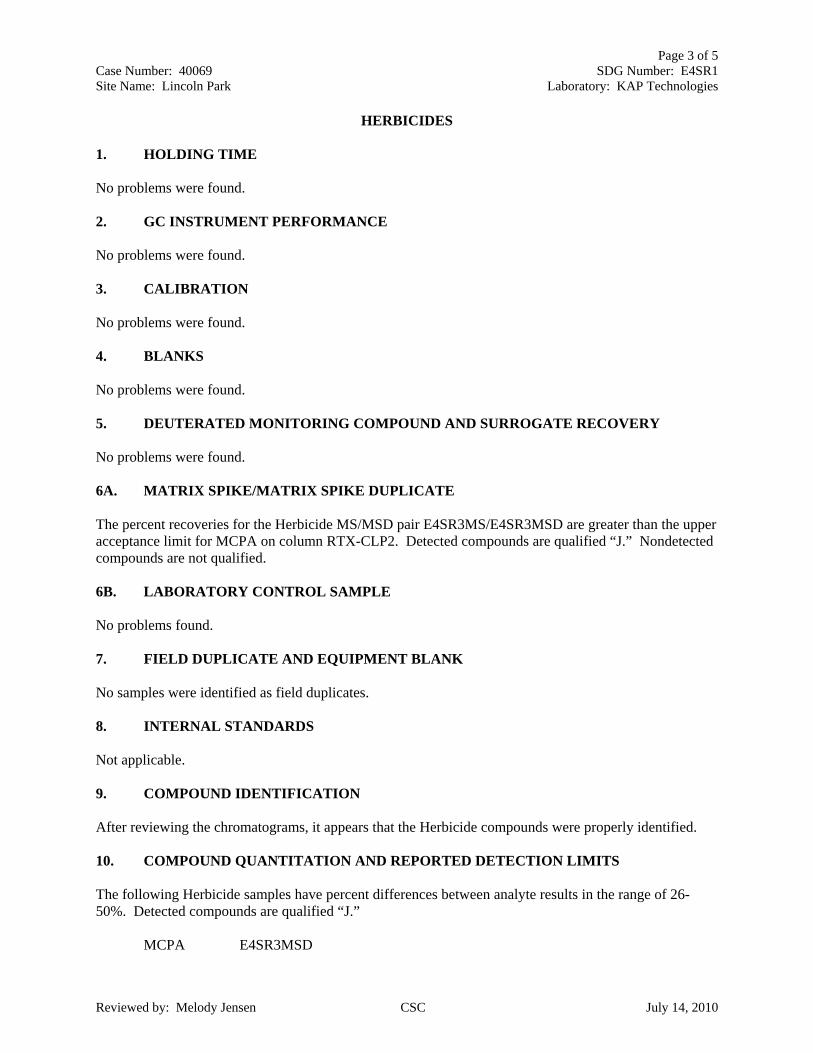
Page 3 of 5 Case Number: 40069 SDG Number: E4SR1 Site Name: Lincoln Park Laboratory: KAP Technologies
Reviewed by: Melody Jensen CSC July 14, 2010
HERBICIDES
1. HOLDING TIME No problems were found. 2. GC INSTRUMENT PERFORMANCE
No problems were found. 3. CALIBRATION
No problems were found. 4. BLANKS
No problems were found. 5. DEUTERATED MONITORING COMPOUND AND SURROGATE RECOVERY
No problems were found. 6A. MATRIX SPIKE/MATRIX SPIKE DUPLICATE The percent recoveries for the Herbicide MS/MSD pair E4SR3MS/E4SR3MSD are greater than the upper acceptance limit for MCPA on column RTX-CLP2. Detected compounds are qualified “J.” Nondetected compounds are not qualified. 6B. LABORATORY CONTROL SAMPLE No problems found.
7. FIELD DUPLICATE AND EQUIPMENT BLANK No samples were identified as field duplicates. 8. INTERNAL STANDARDS Not applicable. 9. COMPOUND IDENTIFICATION After reviewing the chromatograms, it appears that the Herbicide compounds were properly identified. 10. COMPOUND QUANTITATION AND REPORTED DETECTION LIMITS
The following Herbicide samples have percent differences between analyte results in the range of 26-50%. Detected compounds are qualified “J.” MCPA E4SR3MSD

Page 4 of 5 Case Number: 40069 SDG Number: E4SR1 Site Name: Lincoln Park Laboratory: KAP Technologies
Reviewed by: Melody Jensen CSC July 14, 2010
The following Herbicide samples have percent differences between analyte results in the range of 51-100%. Detected compounds are qualified “NJ.” MCPA E4SR3MS 11. SYSTEM PERFORMANCE
The GC baseline for Herbicide analyses was acceptable. 12. ADDITIONAL INFORMATION
No additional information

Page 5 of 5 Case Number: 40069 SDG Number: E4SR1 Site Name: Lincoln Park Laboratory: KAP Technologies
Reviewed by: Melody Jensen CSC July 14, 2010
GLNPO Data Qualifier Sheet
Qualifier Definition
U The analyte was analyzed for, but was not detected above the reported sample quantitation limit.
J The analyte was positively identified; the associated numerical value is an approximate concentration of the analyte in the sample.
J+ The analyte was positively identified; the associated numerical value is an approximate concentration of the analyte, but may be biased high.
J- The analyte was positively identified; the associated numerical value is an approximate concentration of the analyte, but may be biased low.
UJ The analyte was not detected above the reported sample quantitation limit. However, the reported quantitation limit is approximate and may or may not represent the action limit of quantitation necessary to accurately and precisely measure the analyte in the sample.
N The analysis indicates the presence of an analyte for which there is presumptive evidence to make a tentative identification.
NJ The analysis indicates the presence of an analyte for which there is presumptive evidence to make a tentative identification and the associated numerical value represents its approximate concentration.
R The data are unusable. (The compound may or may not be present.)

COMPUTER SCIENCES CORPORATION GREAT LAKES NATIONAL PROGRAM OFFICE
Date: July 16, 2010 Subject: Review of Data Received for Review on: May 25, 2010 From: Julie Rest Environmental Chemist, CSC To: Data User: GLNPO We have reviewed the data for the following case: Site Name: Lincoln Park (WI) Case Number: 40069 MRN: 1885.1, 1886.1, and 1887.1 SDG Number: E4SR2 Number and Type of Samples: 11 Soil Samples Sample Numbers: E4SR1 – E4SR9, E4SS0, E4SS1 Laboratory: KAP Technologies cc: Sara Goehl, EPA Brenda Jones, EPA Louis Blume, EPA Dan Plomb, CH2M Hill Heather Hodach, CH2M Hill Dave Shekoski, CH2M Hill Huck Raddemann, CH2M Hill Adrienne Unger, CH2M Hill Judy Schofield, CSC

Page 2 of 12 Case Number: 40069 SDG Number: E4SR2 Site Name: Lincoln Park Laboratory: KAP Technologies
Reviewed by: Julie Rest CSC July 16, 2010
SDG Summary Sample Receipt: Eleven (11) soil samples labeled E4SR1 – E4SR9, E4SS0, and E4SS1 were shipped to KAP Technologies, Inc. in The Woodlands, Texas. All were collected on 4/29/2010 and were received on 4/30/2010, intact and at 3.4 ºC. Note that the typical naming convention for an SDG is to assign the first sample number as the SDG number. For SDG E4SR2, the first sample collected was sample E4SR1, but E4SR2 was used to identify the SDG. Sample Analysis and Data Review: All samples were analyzed according to CLP SOW SOM01.2 and Modification Reference Numbers 1885.1, 1886.1, and 1887.1, with the following exception. Both ultrasonic and PFE extraction were pre-approved by EPA as modifications to the MA(s). The laboratory chose to use ultrasonic extraction. Samples were reviewed according to the NFG for SOM01.2 and the USEPA Region 2 SOPs for data validation of Data, USEPA Contract Laboratory Program. Contrary to the CLP reporting requirements that censor results at the sample-specific quantitation limits, the results for some samples in this SDG were reported at values below the sample-specific detection limits in the EDD. The Form 1s were reported correctly. Some inconsistencies have been noted between the hardcopy data, the B-file spreadsheet, and the Z-file superset EDD in some samples with compounds reported as nondetects (U values). In most instances, the “result value” in the B-file and the Z-file appear to be correct, while the Form 1 and Z-file “quantitation limit” are incorrect. Although the differences appear to be small (e.g., 110 vs. 120), the cause of this anomaly has not been determined. The values in the Superset EDD have not been changed. When the laboratory detects an analyte at a concentration that is less than the CRQL (but at or above the MDL), the CLP SOW requires that they report the concentration with the “J” flag. In addition, the automated data checking process used at SMO examines the final results on Form 1 and applies a validator flag of “J” if the result is at or below the CRQL, rather than strictly below the CRQL. Examination of the raw data shows that some of the validator “J” flags are applied to results that round up to the CRQL, but that are below the CRQL before rounding. CSC has not removed the validator J flags for such samples. MS/MSD evaluation: In instances where the matrix spike recoveries or the RPDs are negative, those negative values do not reflect the performance of the analytical method in the matrix of interest, but are a function of disparities between default spiking levels and the background concentrations in the original unspiked sample. Therefore, no sample results will be qualified when negative recoveries or RPDs are encountered. As designated by the samplers, Sample E4SR3 was used for laboratory QC, i.e. MS/MSDs. Using the field duplicate identification scheme provided by CH2M Hill in the field sampling plan, we have identified samples E4SR1and E4SR2 as field duplicates. This report is ordered by fraction in the following order: Semivolatiles, Pesticides, and Aroclors. In the following sections, QC failures, resulting qualifiers, and associated results are described for each failure. In instances where multiple qualifiers are associated with a given sample result a single final qualifier is applied to that result. If all associated qualifiers described by EXES NFG reports for a particular result conform exactly to the Region 2 SOP requirements for the associated failure scenarios, then the final qualifier applied by the EXES NFG is left intact. However, if at least one of the associated qualifiers described by EXES NFG reports is different from that required by the Region 2 SOP for the

Page 3 of 12 Case Number: 40069 SDG Number: E4SR2 Site Name: Lincoln Park Laboratory: KAP Technologies
Reviewed by: Julie Rest CSC July 16, 2010
relevant failure, OR if a reviewer has chosen a different qualifier for a failure because of best professional judgment, then the most severe qualifier will be applied. Qualifiers from most severe to least severe are: “R,” “NJ,” “UJ,” “U,” “J.”

Page 4 of 12 Case Number: 40069 SDG Number: E4SR2 Site Name: Lincoln Park Laboratory: KAP Technologies
Reviewed by: Julie Rest CSC July 16, 2010
SEMIVOLATILES 1. HOLDING TIME No problems were found. 2. GC/MS TUNING AND GC INSTRUMENT PERFORMANCE No problems were found. 3. CALIBRATION No problems were found. 4. BLANKS No problems were found. 5. DEUTERATED MONITORING COMPOUND AND SURROGATE RECOVERY No problems were found. 6A. MATRIX SPIKE/MATRIX SPIKE DUPLICATE No problems were found. 6B. LABORATORY CONTROL SAMPLE Not applicable 7. FIELD BLANK AND FIELD DUPLICATE
Samples E4SR1 and E4SR2 were identified as field duplicates. Results are summarized in the following tables. Note that results are not qualified based upon the results of the field duplicates. No field blank sample was collected for this SDG. E4SR1 and E4SR2
Semivolatile compounds E4SR1 µg/kg
E4SR2µg/kg %RPD
Benzaldehyde ND ND Phenol ND ND Bis(2-chloroethyl)ether ND ND 2-Chlorophenol ND ND 2-Methylphenol ND ND 2,2'-Oxybis(1-chloropropane) ND ND Acetophenone ND ND 4-Methylphenol ND ND N-Nitroso-di-n-propylamine ND ND Hexachloroethane ND ND

Page 5 of 12 Case Number: 40069 SDG Number: E4SR2 Site Name: Lincoln Park Laboratory: KAP Technologies
Reviewed by: Julie Rest CSC July 16, 2010
Semivolatile compounds E4SR1 µg/kg
E4SR2µg/kg %RPD
Nitrobenzene ND ND Isophorone ND ND 2-Nitrophenol ND ND Bis(2-chloroethoxy)methane ND ND 2,4-Dichlorophenol ND ND Naphthalene ND ND 4-Chloroaniline ND ND 2,4-Dimethylphenol ND ND Hexachlorobutadiene ND ND Caprolactam ND ND 4-Chloro-3-methylphenol ND ND 2-Methylnaphthalene ND ND Hexachlorocyclopentadiene ND ND 2,4,6-Trichlorophenol ND ND 2,4,5-Trichlorophenol ND ND 1,1'-Biphenyl ND ND 2-Chloronaphthalene ND ND 2-Nitroaniline ND ND Dimethylphthalate ND ND 2,6-Dinitrotoluene ND ND Acenaphthylene ND ND 3-Nitroaniline ND ND Acenaphthene ND ND 2,4-Dinitrophenol ND ND 4-Nitrophenol ND ND Dibenzofuran ND ND 2,4-Dinitrotoluene ND ND Diethylphthalate ND ND Fluorene ND ND 4-Chlorophenyl-phenylether ND ND 4-Nitroaniline ND ND 4,6-Dinitro-2-methylphenol ND ND N-Nitrosodiphenylamine ND ND 1,2,4,5-Tetrachlorobenzene ND ND 4-Bromophenyl-phenylether ND ND Hexachlorobenzene ND ND Atrazine ND ND Pentachlorophenol ND ND Phenanthrene ND ND Anthracene ND ND Carbazole ND ND

Page 6 of 12 Case Number: 40069 SDG Number: E4SR2 Site Name: Lincoln Park Laboratory: KAP Technologies
Reviewed by: Julie Rest CSC July 16, 2010
Semivolatile compounds E4SR1 µg/kg
E4SR2µg/kg %RPD
Di-n-butylphthalate 84 55 42Fluoranthene ND ND Pyrene ND ND Butylbenzylphthalate ND ND 3,3'-Dichlorobenzidine ND ND Benzo(a)anthracene ND ND Chrysene ND ND Bis(2-ethylhexyl)phthalate ND ND Di-n-octylphthalate ND ND Benzo(b)fluoranthene ND ND Benzo(k)fluoranthene ND ND Benzo(a)pyrene ND ND Indeno(1,2,3-cd)pyrene ND ND Dibenzo(a,h)anthracene ND ND Benzo(g,h,i)perylene ND ND 2,3,4,6-Tetrachlorophenol ND ND
For field duplicates E4SR1 and E4SR2, RPDs were not calculated where one or both results were nondetected. For Di-n-butyl phthalate, detected in both samples, the RPD value was below 50% . 8. INTERNAL STANDARDS No problems were found. 9. COMPOUND IDENTIFICATION After reviewing the mass spectra and chromatograms, it appears that the semivolatile compounds were properly identified. 10. COMPOUND QUANTITATION AND REPORTED DETECTION LIMITS The following semivolatile samples have compound concentrations above the MDL and below the CRQL. Detected compounds are qualified J. Nondetected compounds are not qualified.
Di-n-butyl phthalate E4SR1 – E4SR9, E4SS0, E4SS1, E4SR3MS, E4SR3MSD Fluoranthene E4SR3, E4SR3MS, E4SR3MSD
11. SYSTEM PERFORMANCE The GC/MS baseline indicated acceptable performance for the samples in this SDG. 12. ADDITIONAL INFORMATION
No additional information.

Page 7 of 12 Case Number: 40069 SDG Number: E4SR2 Site Name: Lincoln Park Laboratory: KAP Technologies
Reviewed by: Julie Rest CSC July 16, 2010
PESTICIDES 1. HOLDING TIME No problems were found 2. GC INSTRUMENT PERFORMANCE No problems were found. 3. CALIBRATION
No problems were found.
4. BLANKS No problems were found. 5. DEUTERATED MONITORING COMPOUND AND SURROGATE RECOVERY
All samples in this SDG had acceptable surrogate recoveries on one or both columns. No sample results were qualified based on surrogate recovery. 6A. MATRIX SPIKE/MATRIX SPIKE DUPLICATE No problems were found. 6B. LABORATORY CONTROL SAMPLE No problems were found. 7. FIELD BLANK AND FIELD DUPLICATE Samples E4SR1 and E4SR2 were identified as field duplicates. Results are summarized in the following table. Sample results are not qualified based on the results of field duplicates. No field blank was associated with this SDG. E4SR1 and E4SR2
Pesticide compound E4SR1 µg/kg
E4SR2 µg/kg %RPD
alpha-BHC ND ND beta-BHC ND ND delta-BHC ND ND gamma-BHC(Lindane) ND ND Heptachlor ND ND Aldrin ND ND Heptachlor epoxide ND ND Endosulfan I ND ND Dieldrin ND ND

Page 8 of 12 Case Number: 40069 SDG Number: E4SR2 Site Name: Lincoln Park Laboratory: KAP Technologies
Reviewed by: Julie Rest CSC July 16, 2010
Pesticide compound E4SR1 µg/kg
E4SR2 µg/kg %RPD
4,4'-DDE 0.13 ND Endrin ND ND Endosulfan II ND ND 4,4'-DDD ND ND Endosulfan sulfate ND ND 4,4'-DDT ND ND Methoxychlor ND ND Endrin ketone ND ND Endrin aldehyde ND ND alpha-Chlordane ND ND gamma-Chlordane ND ND Toxaphene ND ND
For field duplicate samples E4SR1and E4SR2, no RPD values were calculated because one or both sample results were nondetects. 8. INTERNAL STANDARDS Not applicable. 9. COMPOUND IDENTIFICATION For the pesticide analysis, a large background peak that eluted between approximately 13.5 minutes and 16 minutes on the RTX-CLP2 column, and between 12.5 minutes and 14 minutes on the RTX-CLP column was detected in the chromatograms for sample E4SR4. Detected target compound 4,4’-DDE, which elutes within this time frame on the RTX-CLP2 column, appeared a small shoulder on the unknown peak, had a percent difference between columns above 50%, and was qualified “NJ”. No issues with target compound identification or quantitation of this sample were noted by the laboratory. 10. COMPOUND QUANTITATION AND REPORTED DETECTION LIMITS
The nondetect 4,4’-DDE result for sample E4SR2 was reported in the “B” and “Z” files at a level below the MDL. The result has been elevated to the CRQL and qualified with a “U.” The result reported on the Form 1 for this compound is correct.
The 4,4’-DDE results for samples E4SR1, E4SR3, E4SR4, E4SR8, E4SR9 and E4SS1 were flagged “U” during the automated flagging process. However the results were not adjusted to the CRQL and an explanation for the “U” qualification was not provided. Based on our review findings the “U” validator flags are removed from 4,4’-DDE results for these samples, and the results flagged if affected by other defects. The following pesticide samples have percent differences between analyte results on the two GC columns in the range of 26-50%. Detected compounds are qualified J.
4,4'-DDT E4SR3MS, E4SR3MSD 4,4'-DDE E4SR9
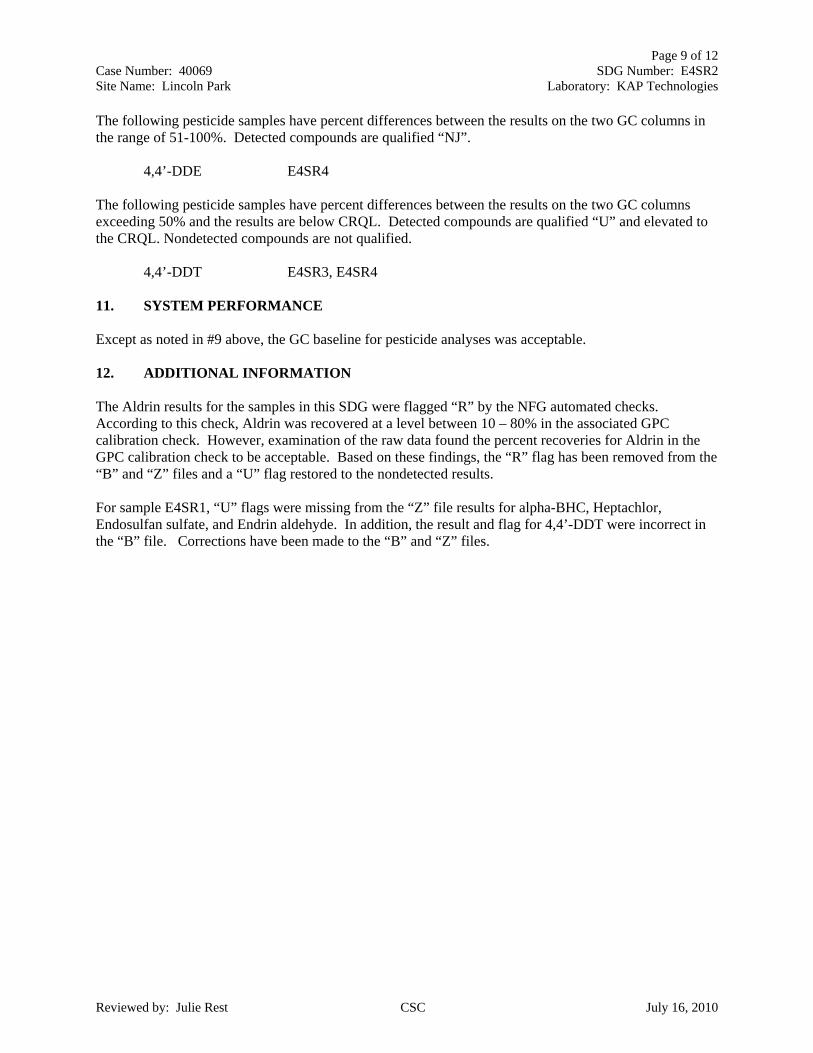
Page 9 of 12 Case Number: 40069 SDG Number: E4SR2 Site Name: Lincoln Park Laboratory: KAP Technologies
Reviewed by: Julie Rest CSC July 16, 2010
The following pesticide samples have percent differences between the results on the two GC columns in the range of 51-100%. Detected compounds are qualified “NJ”.
4,4’-DDE E4SR4
The following pesticide samples have percent differences between the results on the two GC columns exceeding 50% and the results are below CRQL. Detected compounds are qualified “U” and elevated to the CRQL. Nondetected compounds are not qualified.
4,4’-DDT E4SR3, E4SR4
11. SYSTEM PERFORMANCE Except as noted in #9 above, the GC baseline for pesticide analyses was acceptable. 12. ADDITIONAL INFORMATION
The Aldrin results for the samples in this SDG were flagged “R” by the NFG automated checks. According to this check, Aldrin was recovered at a level between 10 – 80% in the associated GPC calibration check. However, examination of the raw data found the percent recoveries for Aldrin in the GPC calibration check to be acceptable. Based on these findings, the “R” flag has been removed from the “B” and “Z” files and a “U” flag restored to the nondetected results. For sample E4SR1, “U” flags were missing from the “Z” file results for alpha-BHC, Heptachlor, Endosulfan sulfate, and Endrin aldehyde. In addition, the result and flag for 4,4’-DDT were incorrect in the “B” file. Corrections have been made to the “B” and “Z” files.

Page 10 of 12 Case Number: 40069 SDG Number: E4SR2 Site Name: Lincoln Park Laboratory: KAP Technologies
Reviewed by: Julie Rest CSC July 16, 2010
AROCLORS 1. HOLDING TIME No problems were found 2. GC INSTRUMENT PERFORMANCE No problems were found. 3. CALIBRATION No problems were found.
4. BLANKS No problems were found 5. SURROGATE RECOVERY All samples in this SDG had acceptable surrogate recoveries on one or both columns. No sample results were qualified based on surrogate recovery. 6A. MATRIX SPIKE/MATRIX SPIKE DUPLICATE The Aroclor matrix/matrix spike duplicate samples prepared for sample E4SR3 had percent recoveries for Aroclor-1260 that were less than the lower criteria limit. Negative percent recoveries and RPD values were obtained. Since the spiking concentration was at an appropriate level for this sample, matrix effect is suspected and the associated sample data are qualified. All samples are affected. Detected compounds are qualified J. Nondetects are not qualified. 6B. LABORATORY CONTROL SAMPLE No problems were found. 7. FIELD BLANK AND FIELD DUPLICATE Samples E4SR1 and E4SR2 were identified as field duplicates. Results are summarized in the following table: Sample results are not qualified based on the results of field duplicates. Note that no field blank was collected for this SDG. E4SR1 and E4SR2
Aroclor compounds E4SR1 µg/kg
E4SR2 µg/kg %RPD
Aroclor-1016 ND ND Aroclor-1221 ND ND Aroclor-1232 ND ND Aroclor-1242 ND ND Aroclor-1248 ND ND Aroclor-1254 ND ND

Page 11 of 12 Case Number: 40069 SDG Number: E4SR2 Site Name: Lincoln Park Laboratory: KAP Technologies
Reviewed by: Julie Rest CSC July 16, 2010
Aroclor compounds E4SR1 µg/kg
E4SR2 µg/kg %RPD
Aroclor-1260 ND ND Aroclor-1262 ND ND Aroclor-1268 ND ND
RPD values were not calculated for E4SR1 and E4SR2 because all values were nondetects. 8. INTERNAL STANDARDS Not applicable 9. COMPOUND IDENTIFICATION After reviewing the chromatograms, it appears that the Aroclor compounds were properly identified. 10. COMPOUND QUANTITATION AND REPORTED DETECTION LIMITS The following Aroclor samples have percent differences between analyte results in the range of 26 – 50%. Detected compounds are qualified “J”.
Aroclor-1260 E4SR3
11. SYSTEM PERFORMANCE The GC baseline for Aroclor analyses was acceptable. 12. ADDITIONAL INFORMATION For the Aroclor analysis, a large background peak eluted between approximately 12.5 minutes and 14 minutes on the RTX-CLP2 column, and between 11 minutes and 13 minutes on the RTX-CLP column was detected in the chromatograms for sample E4SR4. No target Aroclors were reported in this sample, and no issues with target compound identification or quantitation of this sample were noted by the laboratory

Page 12 of 12 Case Number: 40069 SDG Number: E4SR2 Site Name: Lincoln Park Laboratory: KAP Technologies
Reviewed by: Julie Rest CSC July 16, 2010
GLNPO Data Qualifier Sheet
Qualifier Definition
U The analyte was analyzed for, but was not detected above the reported sample quantitation limit.
J The analyte was positively identified; the associated numerical value is an approximate concentration of the analyte in the sample.
J+ The analyte was positively identified; the associated numerical value is an approximate concentration of the analyte, but may be biased high.
J- The analyte was positively identified; the associated numerical value is an approximate concentration of the analyte, but may be biased low.
UJ The analyte was not detected above the reported sample quantitation limit. However, the reported quantitation limit is approximate and may or may not represent the action limit of quantitation necessary to accurately and precisely measure the analyte in the sample.
N The analysis indicates the presence of an analyte for which there is presumptive evidence to make a tentative identification.
NJ The analysis indicates the presence of an analyte for which there is presumptive evidence to make a tentative identification and the associated numerical value represents its approximate concentration.
R The data are unusable. (The compound may or may not be present.)

COMPUTER SCIENCES CORPORATION GREAT LAKES NATIONAL PROGRAM OFFICE
Date: July 14, 2010 Subject: Review of Data Received for Review on: June 16, 2010 From: Julie Rest, Environmental Chemist CSC To: Data User: GLNPO We have reviewed the data for the following case: Site Name: Lincoln Park Case Number: 40069 MRN: N/A SDG Number: E4SS2 Number and Type of Samples: 1 Water Sample Sample Numbers: E4SS2 Laboratory: KAP Technologies, Inc. cc: Sara Goehl, EPA Brenda Jones, EPA Louis Blume, EPA Dan Plomb, CH2M Hill Heather Hodach, CH2M Hill Dave Shekoski, CH2M Hill Huck Raddemann, CH2M Hill Adrienne Unger, CH2M Hill Judy Schofield, CSC

Page 2 of 6 Case Number: 40069 SDG Number: E4SS2 Site Name: Lincoln Park Laboratory: KAP, Technologies, Inc.
Reviewed by: Julie Rest CSC July 14, 2010
SDG Summary
Sample Receipt: One water sample, labeled E4SS2, was shipped to KAP Technologies, Inc., in The Woodlands, Texas. The sample was collected on 4/29/2010 and received at the facility on 04/30/10, intact, and at 4.3 ºC. Sample Analysis and Data Review: One equipment blank sample was prepared and analyzed for Semivolatile, Pesticide, and Aroclor analysis according to CLP SOW SOM01.2. The sample data were reviewed according to the NFG for SOM01.2, and the USEPA Region 2 SOPs for data validation of data, USEPA Contract Laboratory Program. When the laboratory detects an analyte at a concentration that is less than the CRQL (but at or above the MDL), the CLP SOW requires that they report the concentration with the “J” flag. In addition, the automated data checking process used at SMO examines the final results on Form 1 and applies a validator flag of “J” if the result is at or below the CRQL, rather than strictly below the CRQL. Examination of the raw data shows that some of the validator “J” flags are applied to results that round up to the CRQL, but that are below the CRQL before rounding. CSC has not removed the validator J flags for such samples. Tentatively Identified Compounds (TICs): As per the CLP SOW SOM01.2, for the semivolatile analysis, TICs were identified by the laboratory and reported on the Form 1 for each sample. These compounds are not included in the “B” or “Z” files and were not evaluated by the reviewer. This report is ordered by fraction in the following order: Semivolatiles, Pesticides, and Aroclors. In the following sections, QC failures, resulting qualifiers, and associated results are described for each failure. In instances where multiple qualifiers are associated with a given sample result a single final qualifier is applied to that result. If all associated qualifiers described by EXES NFG reports for a particular result conform exactly to the Region 2 SOP requirements for the associated failure scenarios, then the final qualifier applied by the EXES NFG is left intact. However, if at least one of the associated qualifiers described by EXES NFG reports is different from that required by the Region 2 SOP for the relevant failure, OR if a reviewer has chosen a different qualifier for a failure because of best professional judgment, then the most severe qualifier will be applied. Qualifiers from most severe to least severe are: “R”, “NJ”, “UJ”, “U”, “J”.

Page 3 of 6 Case Number: 40069 SDG Number: E4SS2 Site Name: Lincoln Park Laboratory: KAP, Technologies, Inc.
Reviewed by: Julie Rest CSC July 14, 2010
SEMIVOLATILES 1. HOLDING TIME No problems were found. 2. GC INSTRUMENT PERFORMANCE No problems were found. 3. CALIBRATION The preparation blank was associated with an initial calibration percent relative standard deviation (%RSD) for Dibenzo(a,h)anthracene that was outside criteria. This compound was not detected in the blank and the data are not qualified.
4. BLANKS No problems were found. 5. DMC RECOVERY No problems were found. 6A. MATRIX SPIKE/MATRIX SPIKE DUPLICATE No semivolatile MS/MSD was designated by the samplers or performed for this SDG. 6B. LABORATORY CONTROL SAMPLE Not applicable. 7. FIELD BLANK AND FIELD DUPLICATE The single sample in this SDG is an equipment blank. No target compounds were detected in this sample. 8. INTERNAL STANDARDS No problems were found. 9. COMPOUND IDENTIFICATION No target semivolatile compounds were detected in the sample in this SDG. 10. COMPOUND QUANTITATION AND REPORTED DETECTION LIMITS No problems were found. 11. SYSTEM PERFORMANCE The GC/MS baseline indicated acceptable performance for the sample in this SDG.

Page 4 of 6 Case Number: 40069 SDG Number: E4SS2 Site Name: Lincoln Park Laboratory: KAP, Technologies, Inc.
Reviewed by: Julie Rest CSC July 14, 2010
PESTICIDES 1. HOLDING TIME No problems were found. 2. GC INSTRUMENT PERFORMANCE No problems were found. 3. CALIBRATION Sample E4SS2 was associated with a CCV with % Difference for surrogate, Decachlorobiphenyl, and target compounds Endrin and Endosulfan I that exceeded criteria. Detected compounds are qualified J. Nondetected compounds are qualified UJ. 4. BLANKS No problems were found. 5. SURROGATE RECOVERY No problems were found. 6A. MATRIX SPIKE/MATRIX SPIKE DUPLICATE No pesticide MS/MSD was designated by the samplers or performed for this SDG. 6B. LABORATORY CONTROL SAMPLE No problems were found.
7. FIELD BLANK AND FIELD DUPLICATE The single sample in this SDG is an equipment blank. No target compounds were detected in this sample. 8. INTERNAL STANDARDS Not applicable. 9. COMPOUND IDENTIFICATION No target pesticide compounds were detected in the sample in this SDG. 10. COMPOUND QUANTITATION AND REPORTED DETECTION LIMITS No problems were found. 11. SYSTEM PERFORMANCE The GC baseline indicated that pesticide performance was acceptable.

Page 5 of 6 Case Number: 40069 SDG Number: E4SS2 Site Name: Lincoln Park Laboratory: KAP, Technologies, Inc.
Reviewed by: Julie Rest CSC July 14, 2010
AROCLORS 1. HOLDING TIME No problems were found.
2. GC INSTRUMENT PERFORMANCE No problems were found. 3. CALIBRATION No problems were found.
4. BLANKS No problems were found. 5. SURROGATE RECOVERY No problems were found. 6A. MATRIX SPIKE/MATRIX SPIKE DUPLICATE No Aroclor MS/MSD was designated by the samplers or performed for this SDG. 6B. LABORATORY CONTROL SAMPLE No problems were found. 7. FIELD BLANK AND FIELD DUPLICATE
The single sample in this SDG is an equipment blank. No target compounds were detected in this sample. 8. INTERNAL STANDARDS Not applicable. 9. COMPOUND IDENTIFICATION No target Aroclor compounds were detected in the sample in this SDG. 10. COMPOUND QUANTITATION AND REPORTED DETECTION LIMITS No problems were found. 11. SYSTEM PERFORMANCE The GC baseline indicated that Aroclor performance was acceptable.
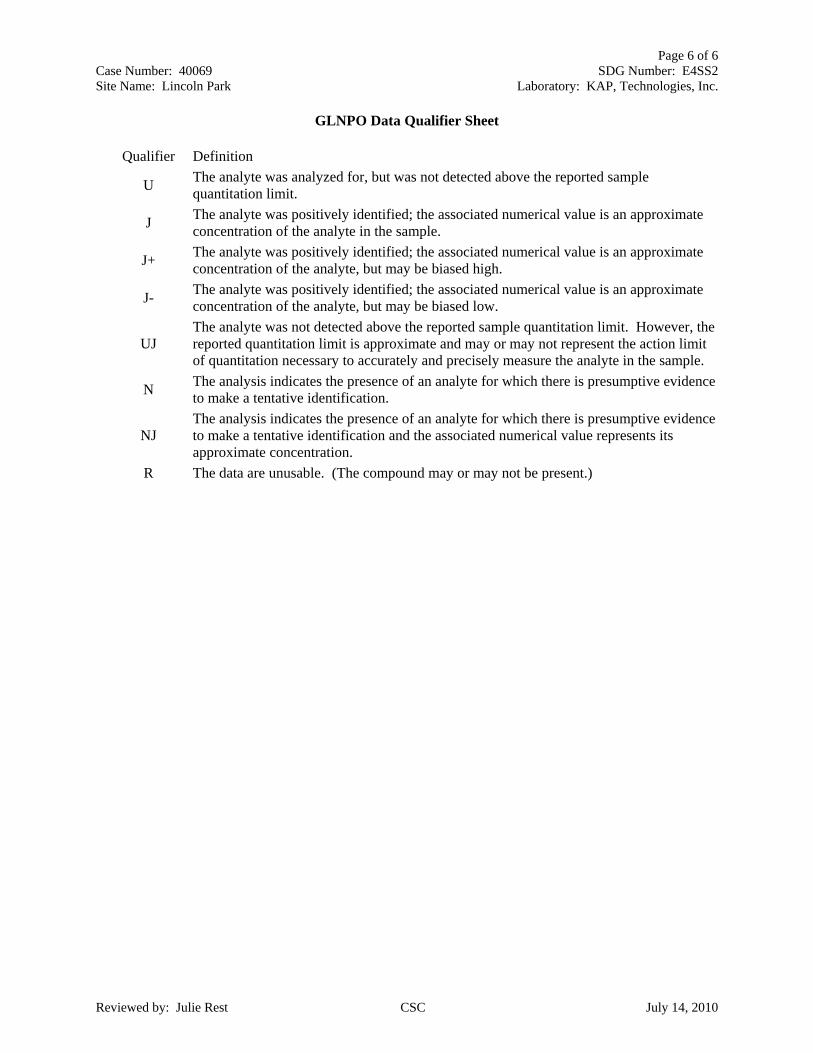
Page 6 of 6 Case Number: 40069 SDG Number: E4SS2 Site Name: Lincoln Park Laboratory: KAP, Technologies, Inc.
Reviewed by: Julie Rest CSC July 14, 2010
GLNPO Data Qualifier Sheet Qualifier Definition
U The analyte was analyzed for, but was not detected above the reported sample quantitation limit.
J The analyte was positively identified; the associated numerical value is an approximate concentration of the analyte in the sample.
J+ The analyte was positively identified; the associated numerical value is an approximate concentration of the analyte, but may be biased high.
J- The analyte was positively identified; the associated numerical value is an approximate concentration of the analyte, but may be biased low.
UJ The analyte was not detected above the reported sample quantitation limit. However, the reported quantitation limit is approximate and may or may not represent the action limit of quantitation necessary to accurately and precisely measure the analyte in the sample.
N The analysis indicates the presence of an analyte for which there is presumptive evidence to make a tentative identification.
NJ The analysis indicates the presence of an analyte for which there is presumptive evidence to make a tentative identification and the associated numerical value represents its approximate concentration.
R The data are unusable. (The compound may or may not be present.)

COMPUTER SCIENCES CORPORATION GREAT LAKES NATIONAL PROGRAM OFFICE
DATE: 6/18/2010 SUBJECT: Review of Data Received for Review on: 6/16/2010 FROM: Ted Derheimer Environmental Scientist, CSC TO: Data User: GLNPO We have reviewed the data for the following case: SITE Name: Lincoln Park Case Number: 40069 MRN: NA SDG Number: ME4SR1 Number and Type of Samples: 11 Sediment Samples (Metals) Sample Numbers: ME4SR1, ME4SR2, ME4SR3, ME4SR4, ME4SR5, ME4SR6, ME4SR7, ME4SR8, ME4SR9. ME4SS0, ME4SS1 Laboratory: Bonner Analytical Testing Company. cc: Sara Goehl, EPA Brenda Jones, EPA Louis Blume, EPA Dan Plomb, CH2M Hill Heather Hodach, CH2M Hill Dave Shekoski, CH2M Hill Huck Raddemann, CH2M Hill Adrienne Unger, CH2M Hill Judy Schofield, CSC
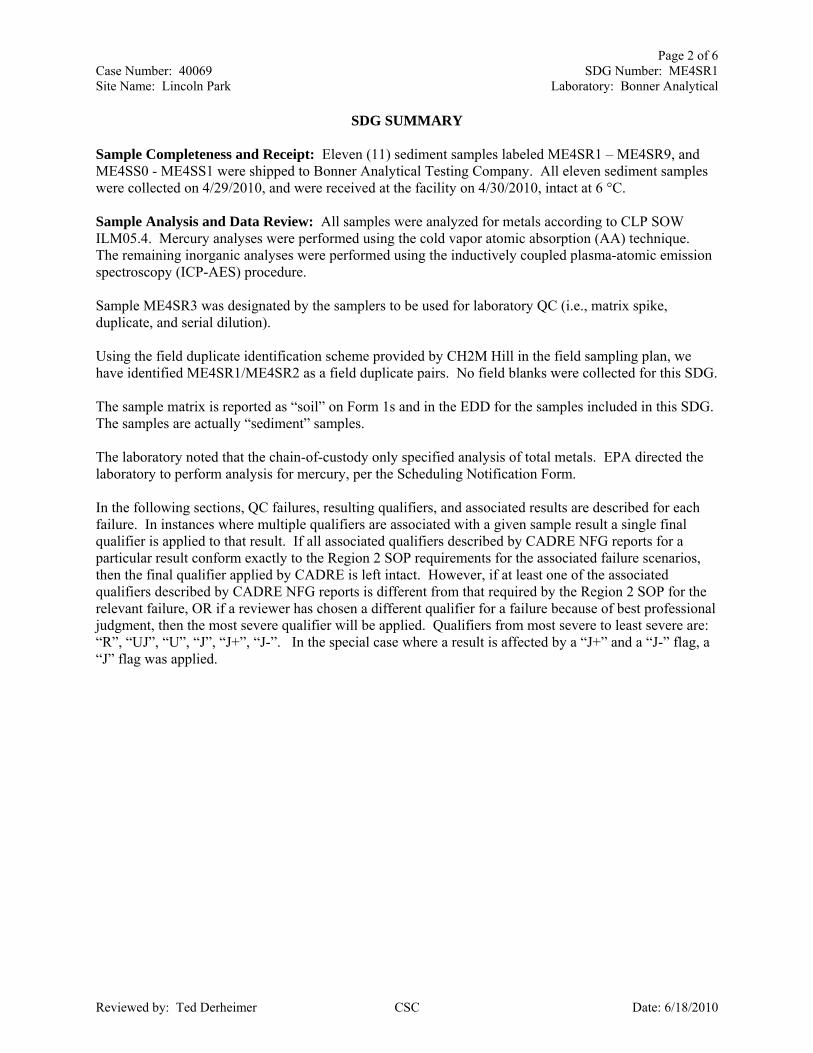
Page 2 of 6 Case Number: 40069 SDG Number: ME4SR1 Site Name: Lincoln Park Laboratory: Bonner Analytical
Reviewed by: Ted Derheimer CSC Date: 6/18/2010
SDG SUMMARY Sample Completeness and Receipt: Eleven (11) sediment samples labeled ME4SR1 – ME4SR9, and ME4SS0 - ME4SS1 were shipped to Bonner Analytical Testing Company. All eleven sediment samples were collected on 4/29/2010, and were received at the facility on 4/30/2010, intact at 6 °C. Sample Analysis and Data Review: All samples were analyzed for metals according to CLP SOW ILM05.4. Mercury analyses were performed using the cold vapor atomic absorption (AA) technique. The remaining inorganic analyses were performed using the inductively coupled plasma-atomic emission spectroscopy (ICP-AES) procedure. Sample ME4SR3 was designated by the samplers to be used for laboratory QC (i.e., matrix spike, duplicate, and serial dilution). Using the field duplicate identification scheme provided by CH2M Hill in the field sampling plan, we have identified ME4SR1/ME4SR2 as a field duplicate pairs. No field blanks were collected for this SDG. The sample matrix is reported as “soil” on Form 1s and in the EDD for the samples included in this SDG. The samples are actually “sediment” samples. The laboratory noted that the chain-of-custody only specified analysis of total metals. EPA directed the laboratory to perform analysis for mercury, per the Scheduling Notification Form. In the following sections, QC failures, resulting qualifiers, and associated results are described for each failure. In instances where multiple qualifiers are associated with a given sample result a single final qualifier is applied to that result. If all associated qualifiers described by CADRE NFG reports for a particular result conform exactly to the Region 2 SOP requirements for the associated failure scenarios, then the final qualifier applied by CADRE is left intact. However, if at least one of the associated qualifiers described by CADRE NFG reports is different from that required by the Region 2 SOP for the relevant failure, OR if a reviewer has chosen a different qualifier for a failure because of best professional judgment, then the most severe qualifier will be applied. Qualifiers from most severe to least severe are: “R”, “UJ”, “U”, “J”, “J+”, “J-”. In the special case where a result is affected by a “J+” and a “J-” flag, a “J” flag was applied.

Page 3 of 6 Case Number: 40069 SDG Number: ME4SR1 Site Name: Lincoln Park Laboratory: Bonner Analytical
Reviewed by: Ted Derheimer CSC Date: 6/18/2010
1. HOLDING TIME
No defects were found. 2. CALIBRATION
No defects were found for the calibration or the CRQL standard. 3. BLANKS
No defects were found.
4. MATRIX SPIKE/MATRIX SPIKE DUPLICATE AND LAB CONTROL SAMPLE
The following inorganic soil samples are associated with a matrix spike recovery which is outside of the primary high criteria. Post-digest spike recovery was also more than the high limit. Sample results > MDL are flagged “J+”. ME4SR1 Lead ME4SR2 Lead ME4SR3 Lead ME4SR4 Lead ME4SR5 Lead ME4SR6 Lead ME4SR7 Lead ME4SR8 Lead ME4SR9 Lead ME4SS0 Lead ME4SS1 Lead
The following inorganic soil samples are associated with a matrix spike recovery which is outside of the expanded low criteria. Sample results > MDL are flagged “J”, and sample results ≤ MDL are flagged “UJ”. ME4SR1 Antimony ME4SR2 Antimony ME4SR3 Antimony ME4SR4 Antimony ME4SR5 Antimony ME4SR6 Antimony ME4SR7 Antimony ME4SR8 Antimony ME4SR9 Antimony ME4SS0 Antimony ME4SS1 Antimony
No defects were found for the laboratory control sample.
5. LABORATORY AND FIELD DUPLICATE
No defects were found for the laboratory duplicate.

Page 4 of 6 Case Number: 40069 SDG Number: ME4SR1 Site Name: Lincoln Park Laboratory: Bonner Analytical
Reviewed by: Ted Derheimer CSC Date: 6/18/2010
Samples ME4SR1/ME4SR2 were identified as field duplicates. Results are summarized in the following table.
ME4SR1/ME4SR2
ND = Not detected NA = Not applicable (both results are below the sample-specific CRQL) All of the calculated RPD values were less than 35%.
6. ICP ANALYSIS
The following inorganic samples have elements other than Al, Ca, Fe, and Mg at concentrations higher than 10 mg/L that may cause potential interference. No sample results are qualified based on this issue. ME4SR5 Potassium ME4SR6 Potassium ME4SR7 Potassium ME4SR8 Potassium The following inorganic samples have one or more known interferents (Al, Ca, Fe, or Mg) present at concentrations more than true amounts added in the ICS solution, which may cause a high bias in associated sample results. Associated detects ≥ MDL for all analytes (except mercury) are qualified “J+”. Results < MDL are not qualified.
Metal Analytes
ME4SR1 (mg/kg)
ME4SR2 (mg/kg)
Both Results>5xCRQL %RPD Abs Diff
Abs Diff Range
Aluminum 4070 3860 Y 5.3 - - Antimony ND ND N - 0 ≤2xCRQL Arsenic 2.8 2.6 N - 0.2 ≤2xCRQL Barium 27.8 25.6 N - 2.2 ≤2xCRQL Beryllium 0.16 0.16 NA NA NA NA Cadmium 0.11 0.11 NA NA NA NA Calcium 156000 156000 Y 0 - - Chromium 7.9 7.7 Y 2.6 - - Cobalt 3.5 3.3 NA NA NA NA Copper 7.7 7.3 N - 0.4 ≤2xCRQL Iron 6840 6400 Y 6.6 - - Lead 8.4 7.3 Y 14 - - Magnesium 91900 92100 Y 0.2 - - Manganese 244 219 Y 10.8 - - Mercury 0.079 0.082 NA NA NA NA Nickel 9 8.6 N - 0.4 ≤2xCRQL Potassium 974 940 N - 34 ≤2xCRQL Selenium ND ND NA NA NA NA Silver ND ND NA NA NA NA Sodium 202 195 NA NA NA NA Thallium ND ND NA NA NA NA Vanadium 12.7 12.2 N - 0.5 ≤2xCRQL Zinc 37.5 35.9 Y 4.4 - -
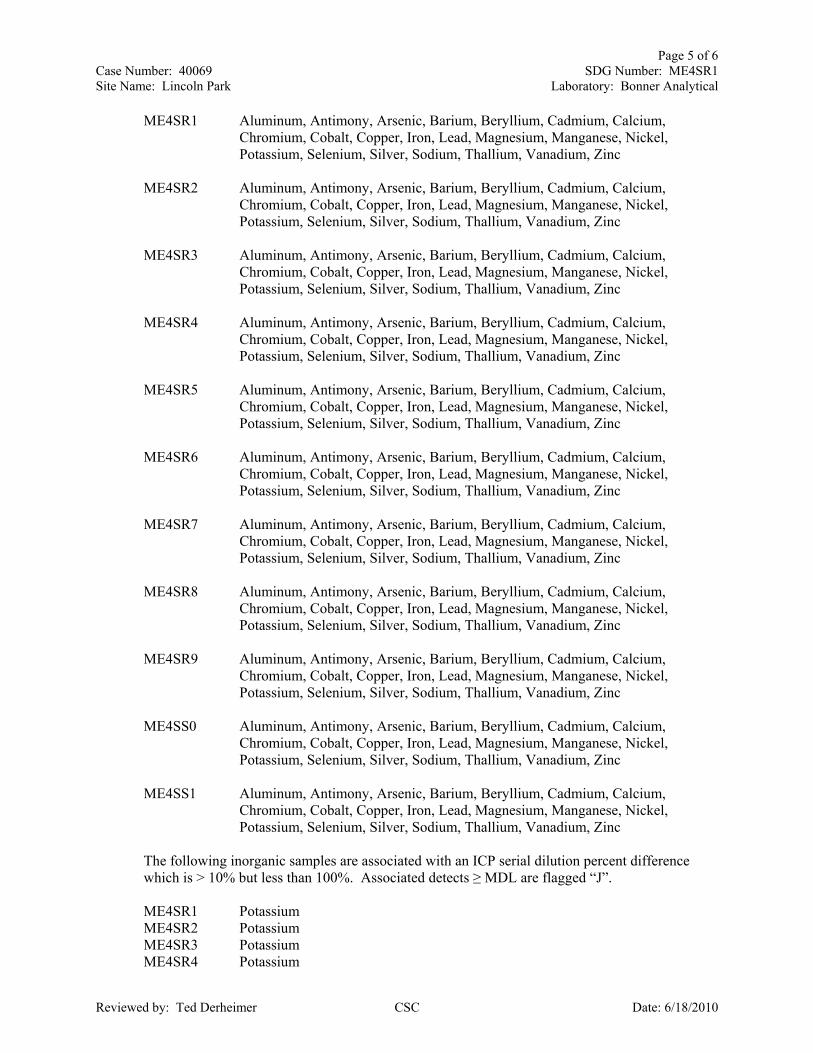
Page 5 of 6 Case Number: 40069 SDG Number: ME4SR1 Site Name: Lincoln Park Laboratory: Bonner Analytical
Reviewed by: Ted Derheimer CSC Date: 6/18/2010
ME4SR1 Aluminum, Antimony, Arsenic, Barium, Beryllium, Cadmium, Calcium, Chromium, Cobalt, Copper, Iron, Lead, Magnesium, Manganese, Nickel, Potassium, Selenium, Silver, Sodium, Thallium, Vanadium, Zinc
ME4SR2 Aluminum, Antimony, Arsenic, Barium, Beryllium, Cadmium, Calcium,
Chromium, Cobalt, Copper, Iron, Lead, Magnesium, Manganese, Nickel, Potassium, Selenium, Silver, Sodium, Thallium, Vanadium, Zinc
ME4SR3 Aluminum, Antimony, Arsenic, Barium, Beryllium, Cadmium, Calcium,
Chromium, Cobalt, Copper, Iron, Lead, Magnesium, Manganese, Nickel, Potassium, Selenium, Silver, Sodium, Thallium, Vanadium, Zinc
ME4SR4 Aluminum, Antimony, Arsenic, Barium, Beryllium, Cadmium, Calcium,
Chromium, Cobalt, Copper, Iron, Lead, Magnesium, Manganese, Nickel, Potassium, Selenium, Silver, Sodium, Thallium, Vanadium, Zinc
ME4SR5 Aluminum, Antimony, Arsenic, Barium, Beryllium, Cadmium, Calcium,
Chromium, Cobalt, Copper, Iron, Lead, Magnesium, Manganese, Nickel, Potassium, Selenium, Silver, Sodium, Thallium, Vanadium, Zinc
ME4SR6 Aluminum, Antimony, Arsenic, Barium, Beryllium, Cadmium, Calcium,
Chromium, Cobalt, Copper, Iron, Lead, Magnesium, Manganese, Nickel, Potassium, Selenium, Silver, Sodium, Thallium, Vanadium, Zinc
ME4SR7 Aluminum, Antimony, Arsenic, Barium, Beryllium, Cadmium, Calcium,
Chromium, Cobalt, Copper, Iron, Lead, Magnesium, Manganese, Nickel, Potassium, Selenium, Silver, Sodium, Thallium, Vanadium, Zinc
ME4SR8 Aluminum, Antimony, Arsenic, Barium, Beryllium, Cadmium, Calcium,
Chromium, Cobalt, Copper, Iron, Lead, Magnesium, Manganese, Nickel, Potassium, Selenium, Silver, Sodium, Thallium, Vanadium, Zinc
ME4SR9 Aluminum, Antimony, Arsenic, Barium, Beryllium, Cadmium, Calcium,
Chromium, Cobalt, Copper, Iron, Lead, Magnesium, Manganese, Nickel, Potassium, Selenium, Silver, Sodium, Thallium, Vanadium, Zinc
ME4SS0 Aluminum, Antimony, Arsenic, Barium, Beryllium, Cadmium, Calcium,
Chromium, Cobalt, Copper, Iron, Lead, Magnesium, Manganese, Nickel, Potassium, Selenium, Silver, Sodium, Thallium, Vanadium, Zinc
ME4SS1 Aluminum, Antimony, Arsenic, Barium, Beryllium, Cadmium, Calcium,
Chromium, Cobalt, Copper, Iron, Lead, Magnesium, Manganese, Nickel, Potassium, Selenium, Silver, Sodium, Thallium, Vanadium, Zinc
The following inorganic samples are associated with an ICP serial dilution percent difference which is > 10% but less than 100%. Associated detects ≥ MDL are flagged “J”.
ME4SR1 Potassium ME4SR2 Potassium ME4SR3 Potassium ME4SR4 Potassium

Page 6 of 6 Case Number: 40069 SDG Number: ME4SR1 Site Name: Lincoln Park Laboratory: Bonner Analytical
Reviewed by: Ted Derheimer CSC Date: 6/18/2010
ME4SR5 Potassium ME4SR6 Potassium ME4SR7 Potassium ME4SR8 Potassium ME4SR9 Potassium ME4SS0 Potassium ME4SS1 Potassium
7. SAMPLE RESULTS
The following inorganic samples have analyte concentrations reported below the quantitation limit (CRQL). All results below the CRQL are qualified “J”.
ME4SR1 Beryllium, Cadmium, Cobalt, Mercury, Sodium ME4SR2 Beryllium, Cadmium, Cobalt, Mercury, Sodium ME4SR3 Beryllium, Cadmium, Cobalt, Mercury, Sodium ME4SR4 Beryllium, Cadmium, Cobalt, Mercury, Sodium ME4SR5 Barium, Beryllium, Cobalt, Mercury, Sodium ME4SR6 Barium, Beryllium, Cobalt, Mercury, Sodium, Zinc ME4SR7 Barium, Beryllium, Cadmium, Cobalt, Sodium ME4SR8 Beryllium, Cadmium, Mercury, Sodium ME4SR9 Beryllium, Cadmium, Mercury, Sodium ME4SS0 Beryllium, Cadmium, Mercury, Sodium ME4SS1 Beryllium, Cadmium, Mercury, Sodium
GLNPO Data Qualifier Sheet
Qualifier Definition
U The analyte was analyzed for, but was not detected above the reported sample quantitation limit.
J The analyte was positively identified; the associated numerical value is an approximate concentration of the analyte in the sample.
J+ The analyte was positively identified; the associated numerical value is an approximate concentration of the analyte, but may be biased high.
J- The analyte was positively identified; the associated numerical value is an approximate concentration of the analyte, but may be biased low.
UJ The analyte was not detected above the reported sample quantitation limit. However, the reported quantitation limit is approximate and may or may not represent the action limit of quantitation necessary to accurately and precisely measure the analyte in the sample.
N The analysis indicates the presence of an analyte for which there is presumptive evidence to make a tentative identification.
NJ The analysis indicates the presence of an analyte for which there is presumptive evidence to make a tentative identification and the associated numerical value represents its approximate concentration.
R The data are unusable. (The compound may or may not be present.)

COMPUTER SCIENCES CORPORATION GREAT LAKES NATIONAL PROGRAM OFFICE
DATE: 6/23/2010 SUBJECT: Review of Data Received for Review on: 6/16/2010 FROM: Joshua Vinson Environmental Chemist, CSC TO: Data User: GLNPO We have reviewed the data for the following case: SITE Name: Lincoln Park Case Number: 40069 MRN: NA SDG Number: ME4SS2 Number and Type of Samples: 1 Water Sample (Metals) Sample Numbers: ME4SS2 Laboratory: Bonner Analytical cc: Sara Goehl, EPA Brenda Jones, EPA Louis Blume, EPA Dan Plomb, CH2M Hill Heather Hodach, CH2M Hill Dave Shekoski, CH2M Hill Huck Raddemann, CH2M Hill Adrienne Unger, CH2M Hill Judy Schofield, CSC

Page 2 of 4 Case Number: 40069 SDG Number: ME4SS2 Site Name: Lincoln Park Laboratory: Bonner Analytical
Reviewed by: Joshua Vinson CSC June 23, 2010
SDG SUMMARY
Sample Completeness and Receipt: One (1) water sample labeled ME4SS2 was shipped to Bonner Analytical Co. The sample was collected on 4/29/2010, and was received at the facility on 4/30/2010, intact, and at 6 °C. Sample Analysis and Data Review: The sample was analyzed for metals according to CLP SOW ILM05.4. Mercury analysis was performed using the cold vapor atomic absorption (AA) technique. The remaining inorganic analyses were performed using the inductively coupled plasma-atomic emission spectroscopy (ICP-AES) procedure. As per the scheduling notification, lab QC (i.e., matrix spike, duplicate, and serial dilution) was not required for this water sample. Using the field duplicate identification scheme provided by CH2M Hill in the field sampling plan, no field duplicate sets were identified. In the following sections, QC failures, resulting qualifiers, and associated results are described for each failure. In instances where multiple qualifiers are associated with a given sample result a single final qualifier is applied to that result. If all associated qualifiers described by CADRE NFG reports for a particular result conform exactly to the Region 2 SOP requirements for the associated failure scenarios, then the final qualifier applied by CADRE is left intact. However, if at least one of the associated qualifiers described by CADRE NFG reports is different from that required by the Region 2 SOP for the relevant failure, OR if a reviewer has chosen a different qualifier for a failure because of best professional judgment, then the most severe qualifier will be applied. Qualifiers from most severe to least severe are: “R”, “UJ”, “U”, “J”, “J+”, “J-“. In the special case where a result is affected by a “J+” and a “J-“ flag, a “J” flag was applied.

Page 3 of 4 Case Number: 40069 SDG Number: ME4SS2 Site Name: Lincoln Park Laboratory: Bonner Analytical
Reviewed by: Joshua Vinson CSC June 23, 2010
1. HOLDING TIME No defects were found. 2. CALIBRATION No defects were found for the calibration or the CRQL standard 3. BLANKS The sample is associated with an ICB analyte with negative concentration whose absolute value is greater than or equal to the method detection limit (MDL) but less than or equal to the CRQL. Results greater than the CRQL are qualified “J-”. Results less than the MDL are qualified “UJ-”.
ME4SS2 Mercury The sample is associated with a CCB analyte with negative concentration whose absolute value is greater than or equal to the method detection limit (MDL) but less than or equal to the CRQL. Results greater than CRQL are qualified “J-”. Results less than the MDL are qualified “UJ-”.
ME4SS2 Mercury 4. MATRIX SPIKE AND LAB CONTROL SAMPLE No defects were found for the matrix spike sample. No defects were found for the laboratory control sample. 5. LABORATORY AND FIELD DUPLICATE No defects were found for the lab duplicate sample. 6. ICP ANALYSIS No defects were found for the ICP analysis. 7. SAMPLE RESULTS No defects were found.

Page 4 of 4 Case Number: 40069 SDG Number: ME4SS2 Site Name: Lincoln Park Laboratory: Bonner Analytical
Reviewed by: Joshua Vinson CSC June 23, 2010
GLNPO Data Qualifier Sheet Qualifier Definition
U The analyte was analyzed for, but was not detected above the reported sample quantitation limit.
J The analyte was positively identified; the associated numerical value is an approximate concentration of the analyte in the sample.
J+ The analyte was positively identified; the associated numerical value is an approximate concentration of the analyte, but may be biased high.
J- The analyte was positively identified; the associated numerical value is an approximate concentration of the analyte, but may be biased low.
UJ The analyte was not detected above the reported sample quantitation limit. However, the reported quantitation limit is approximate and may or may not represent the action limit of quantitation necessary to accurately and precisely measure the analyte in the sample.
N The analysis indicates the presence of an analyte for which there is presumptive evidence to make a tentative identification.
NJ The analysis indicates the presence of an analyte for which there is presumptive evidence to make a tentative identification and the associated numerical value represents its approximate concentration.
R The data are unusable. (The compound may or may not be present.)

Appendix F Sediment Solidification Treatability Study

T E C H N I C A L M E M O R A N D U M
Sediment Solidification Treatability Study Summary Lincoln Park / Milwaukee River Channel Sediments Site, Milwaukee, WI PREPARED FOR: U.S. Environmental Protection Agency
PREPARED BY: CH2M HILL
DATE: March 3, 2011
Introduction This memorandum describes the procedures and the results of the sediment solidification treatability testing activities that were performed as part of Lincoln Park/Milwaukee River Channel Phase 1 Remedial Design, within the Milwaukee River Estuary Area of Concern. It also describes the scope of the sediment solidification treatability testing analysis and provides information to aid in the remedial design activities. The laboratory and field results support evaluation of the percentage and type of solidification reagent to be used during the remedial action.
The object of the study was to evaluate whether the sediments will dewater (by gravity drainage) in a timely manner so that they may be directly loaded and acceptable for landfill disposal and if not, then to determine the percentage of solidification reagent and type of solidification reagent to render the excavated sediment acceptable for landfill disposal. Amendments used in the study were selected based on evaluating a range of types of materials for consideration during construction.
Specific objectives were twofold:
• Determine the minimum amount of dewatering time needed to pass a paint filter test and physical properties of the mixed material (slump, unconfined compressive strength, moisture content) to characterize it for mechanical handling, transportation, and disposal at the disposal facility.
• Determine the minimum percentage by weight or by volume depending on the drying agent required to be mixed with the sediment that will result in passing a paint filter test both when the mixed material is loaded into the truck and when the mixed material arrives at the disposal facility.
This memorandum summarizes the following:
• Field activities, sampling locations, field observations, and field and lab testing methods as specified in the field sampling plan.
• Field and lab testing results for different amendments of admixtures (unconfined compressive strength, paint filter tests, moisture content) and results of grain size analysis.
MKE/110050005 1

SEDIMENT SOLIDIFICATION TREATABILITY STUDY SUMMARY LINCOLN PARK / MILWAUKEE RIVER CHANNEL SEDIMENTS SITE, MILWAUKEE, WI
Field Operations and Procedures Sediment samples were collected from each of the zones representative of the depth of sediment to be excavated and transported for offsite disposal. Procedures and methodologies for collecting sediment samples were consistent with the field sampling plan (Attachment 1). Sediment samples collected at each location were sent to a laboratory for testing in accordance with Standard Operating Procedure (SOP) 1 (Attachment 2) and were used for onsite field testing in accordance with SOP 2 (Attachment 3). Figure 1 shows the sample locations, sample depths, and the thickness of the sediment deposits in each area.
Sediment Sample Collection The sediment from the uniformly distributed sample locations were collected up to the specified depth below the surface using a 3-foot power auger fitted with flightless extensions that would support collecting sediment from the targeted depths. Roughly 17 gallons of sediment were collected from each location and stored in four 5-gallon plastic buckets. Sediments from two locations were homogenized and composited into one sample for field testing and lab analysis as presented in Table 1. No sample locations for the treatability study were located within the estimated extent of TSCA sediment. Table 1 lists the sample locations, coordinates, zone, sample depths and the resulting sample IDs.
TABLE 1 Sample Locations and Coordinates Lincoln Park/Milwaukee River Basis of Design Report
Location ID Latitude Longitude Zone Sample Depth (ft) Sample IDs
LP-SB01 43.112928 -87.931238 1 2 LP-SB01-02
LP-SB02 43.110151 -87.93049 1 2
LP-SB03 43.108459 -87.930004 2b 6 LP-SB03-04
LP-SB04 43.107955 -87.930441 2b 8
LP-SB05 43.106984 -87.929799 2b 4 LP-SB05-06
LP-SB06 43.10734 -87.929169 2b 4
LP-SB07 43.1077109 -87.928701 2b 4 LP-SB07-08
LP-SB08 43.108163 -87.929068 2b 4
LP-SB09 43.109099 -87.928871 2a 6 LP-SB09-10
LP-SB10 43.109612 -87.928048 2a 6
LP-SB11 43.10997 -87.927326 2a 8 LP-SB11-12
LP-SB12 43.110372 -87.926894 2a 2
LP-SB13 43.106325 -87.926331 3a 4 LP-SB13-14
LP-SB14 43.106633 -87.927282 3a 6
Each location was recorded using a handheld global positioning system unit capable of a horizontal accuracy of ± 3 feet. Locations were referenced horizontally to the Wisconsin State Plane Coordinate System, South Zone, North American Datum of 1983 (NAD83). Site
2 MKE/110050005

SEDIMENT SOLIDIFICATION TREATABILITY STUDY SUMMARY LINCOLN PARK / MILWAUKEE RIVER CHANNEL SEDIMENTS SITE, MILWAUKEE, WI
reconnaissance activities were completed before sapling to identify underground utilities and structural limitations.
Sediment collected from 14 locations were composited to make 7 total samples for field testing and lab analysis. Roughly 5 gallons of raw untreated sediment from each composited sample was containerized and shipped as specified in the field sampling plan to be analyzed by the CH2M HILL’s Applied Sciences Laboratory for grain size, percent moisture, and paint filter (pass/not pass). In addition, the raw untreated sediment was mixed in the laboratory with three proportions (5, 10, and 15 percent) of Portland cement and three proportions (1, 2, and 3 percent) of superabsorbent polymer to determine the minimum percentage to pass paint filter and to support evaluation of the curing time and compressive strength for placement in the landfill. SOP 1 (Attachment 2) contains a detailed description of the procedure.
Paint filter and slump testing were conducted onsite on the raw untreated sediment. Slump testing supported evaluation of initial strength of the sediment in comparison to landfill requirements for slump. Initial paint filter tests were conducted after the sample was collected. If the sediment failed initial paint filter testing, it was mixed onsite with three different proportions (10, 20, and 30 percent) of sawdust (drying agent) and used to determine the moisture content and slump. A slump cone and paint-filter cone were used for the field testing. Subsequent paint filter tests (if initial test failed) were completed within 24 hours. Sawdust was tested in the field because the mixture is based on volume rather than weight, resulting in a more qualitative approach to testing and implementation during construction. In addition, the volume of sediment and sawdust estimated to be required to conduct the testing is more cost effectively managed in the field than shipping it to a laboratory. Subsequent paint filter tests (if initial test failed) were completed within 24 hours. The field team performed the tests onsite. SOP 2 (Attachment 3) describes the procedure. Once the field tests were completed, the sediment mixture was disposed offsite as investigation-derived waste.
Field and Laboratory Results Field testing results and laboratory data are summarized in Tables 2 and 3. The field test results provide a qualitative, bench-scale evaluation of potential sediment dewatering characteristics, with and without the addition of sawdust. The lab test results support additional evaluation of the solidification agent type and percentage required as well as the strength of the mixed materials.
Field Testing Results Six of seven samples passed paint filter in the field without the addition of a drying agent. The seventh sample passed paint filter after one day. Sawdust as a drying agent showed the shortest time to pass paint filter using a mixture of 30 percent by volume when compared to the other proportions. Slump tests were generally 2 inches or less except for LP-SB01-02 when mixed with sawdust. Table 2 summarizes the field testing results.
Laboratory Testing Results All samples passed the paint filter test without the addition of the Portland cement (PC) or super absorbent polymer (SAP) as the drying agent. The addition of PC reduced the moisture content and increased the percent solids of the samples that contain a higher percentage of silt/clay. In contrast, the addition of PC did not significantly reduce the
MKE/110050005 3

SEDIMENT SOLIDIFICATION TREATABILITY STUDY SUMMARY LINCOLN PARK / MILWAUKEE RIVER CHANNEL SEDIMENTS SITE, MILWAUKEE, WI
moisture content of samples that contain a higher percentage of sand and gravel, though the percent solids generally increased. The addition of SAP generally did not change the moisture content or percent solids of the samples. In comparison to the PC, the SAP increased the moisture content of the samples that contain a higher percentage of sand and gravel. Table 3 summarizes the testing results. Attachment 6 includes the laboratory testing results for reagent mixing.
Compaction testing and strength testing of samples was conducted using 5 percent PC or 1 percent SAP. The percentage of reagent was selected based on the minimum percentage anticipated if reagent mixing is required to pass the paint filter test. The maximum unit weight of samples containing more than 50 percent silt/clay and mixed with PC or SAP varied from 76 pounds per cubic foot (pcf) to 87 pcf. The optimum moisture content of the PC samples varied from 16 to 30 percent, while the optimum moisture content of the SAP samples varied from 25 to 34 percent. The maximum unit weight of samples containing more than 50 percent gravel/sand and mixed with PC varied from 107 to 117 pcf, while the maximum unit weight of the SAP samples varied from 87 to 102 pcf. The optimum moisture content of these samples varied from 11 to 17 percent.
The maximum unit weight of samples containing more than 50 percent silt/clay and mixed with SAP varied from 76 pcf to 87 pcf. The optimum moisture content of these samples varied from 16 to 30 percent. The maximum unit weight of samples containing more than 50 percent gravel/sand and mixed with PC varied from 107 to 117 pcf. The optimum moisture content of these samples varied from 5 to 17 percent. Attachment 6 includes the laboratory testing results for reagent mixing.
The samples containing a high percentage of sand and gravel did not achieve strength of compaction with PC or SAP. The samples containing a high percentage of silt/clay did not achieve strength with SAP. However, when mixed with PC, the samples achieved strength of 1.6 to 7.8 pounds per square inch.
4 MKE/110050005

SEDIMENT SOLIDIFICATION TREATABILITY STUDY SUMMARY LINCOLN PARK / MILWAUKEE RIVER CHANNEL SEDIMENTS SITE, MILWAUKEE, WI
TABLE 2 Summary of Sediment Solidification Treatability Testing Results Lincoln Park/Milwaukee River Basis of Design Report
Sample ID Field Paint
Filter 1 Sawdust Slump Test 1
Slump Test 2
% Moistureb Soil Typec
LP-SB01-02 Fail 0% 0" 0" 15.6 12% Gravel; 85% Sand; 3% Silt/Clay; Wet
21.25 hr–Pass 10% 0" 0" 10.7
5.25 hr–Pass 20% 4.5" 0" 13.3
1.5 hr–Pass 30% 1.5" 0" 11.6
LP-SB03-04 Pass 0% 0.5" 1" 34.1 19% Sand; 81% Silt/Clay; Moist
LP-SB05-06 Pass 0% 2" 2.5" 38.6 8% Sand; 92% Silt/Clay; Moist
LP-SB07-08 Pass 0% 0" 0" 11.9 3% Gravel; 86% Sand; 11% Silt/Clay; Dry to Moist
LP-SB09-10 Pass 0% 0" a 27.2 67% Sand; 33% Silt/Clay; Moist
LP-SB11-12 Pass 0% 0" a 40.7 1% Gravel; 21% Sand; 78% Silt/Clay; Moist
LP-SB13-14 Pass 0% 0" a 35.1 20% Sand; 80% Silt/Clay; Dry to Moist
a Unworkable for slump test b Moisture content analyzed in the Applied Sciences Laboratory (Reference Attachment 4) c Soil percentage based on sieve analysis by Applied Sciences Laboratory (Reference Attachment 5).
Conclusions With the exception of one field sample, the sediment samples passed paint filter without the addition of a drying agent in the field and the laboratory. Moisture content of the sediment samples generally correlates with the proportion of silt/clay in the sediment. The greater the percentage of silt/clay in the sediment, the greater the moisture content because the silt/clay holds the moisture.
Sawdust as a drying agent showed the shortest time to pass paint filter using a mixture of 30 percent by volume when compared to the other proportions. The addition of PC reduced the moisture content, whereas the addition of SAP generally did not change the moisture content of the sediment. The addition of PC increased the strength of sediment that contains greater than 50 percent silt/clay, but did not increase the strength of sediment with greater than 50 percent sand and gravel. The addition of SAP did not increase the strength of the sediment.
MKE/110050005 5

SEDIMENT SOLIDIFICATION TREATABILITY STUDY SUMMARY LINCOLN PARK / MILWAUKEE RIVER CHANNEL SEDIMENTS SITE, MILWAUKEE, WI
TABLE 3 Summary of Sediment Solidification Treatability Lab Testing Results Lincoln Park/Milwaukee River Basis of Design Report
Sample ID Paint Filter
Test Results
% Portland Cement
% Solids
% Moisture
% SAP (Premium
Grade) % Solids %
Moisture
LP-SB01-02
Pass 0 94.13 5.87 0 87.33 12.67
Not analyzed 5 96.03 3.97 1 89.19 10.81
Not analyzed 10 96.29 3.71 2 89.04 10.96
Not analyzed 15 96.89 3.11 3 88.77 11.23
LP-SB03-04
Pass 0 60.14 39.86 0 62.60 37.40
Not analyzed 5 65.94 34.06 1 64.12 35.88
Not analyzed 10 67.31 32.69 2 63.99 36.01
Not analyzed 15 69.78 30.22 3 64.28 35.72
LP-SB05-06
Pass 0 61.73 38.27 0 61.26 38.74
Not analyzed 5 62.93 37.07 1 61.50 38.50
Not analyzed 10 66.31 33.69 2 60.96 39.04
Not analyzed 15 69.68 30.32 3 62.16 37.84
LP-SB07-08
Pass 0 89.71 10.29 0 88.47 11.53
Not analyzed 5 90.37 9.63 1 87.69 12.31
Not analyzed 10 91.48 8.52 2 86.71 13.29
Not analyzed 15 90.14 9.86 3 87.68 12.32
LP-SB09-10
Pass 0 74.11 25.89 0 73.98 26.02
Not analyzed 5 74.84 25.16 1 74.86 25.14
Not analyzed 10 77.26 22.74 2 74.66 25.34
Not analyzed 15 77.72 22.28 3 76.20 23.80
LP-SB11-12
Pass 0 59.20 40.80 0 58.28 41.72
Not analyzed 5 58.39 41.61 1 56.28 43.72
Not analyzed 5 DUP 58.30 41.70
Not analyzed 10 63.68 36.32 2 60.43 39.57
Not analyzed 15 65.53 34.47 3 58.49 41.51
LP-SB13-14
Pass 0 60.43 39.57 0 63.96 36.04
Not analyzed 5 64.68 35.32 1 65.51 34.49
Not analyzed 10 66.94 33.06 2 64.65 35.35
Not analyzed 15 67.61 32.39 3 64.70 35.30
6 MKE/110050005

!H
!H
!H
!H
!H
!H
!H
!H
!H
!H
!H
!H
!H
!H
Gre
en
Bay
Aven
ue
?Î
LP-SB130-4'
LP-SB140-6'
LP-SB010-2'
LP-SB020-2'
LP-SB030-6'
LP-SB040-8'
LP-SB050-4'
LP-SB060-4'
LP-SB070-4'
LP-SB080-4'
LP-SB090-6'
LP-SB100-6'
LP-SB110-8'
LP-SB120-2'
$0 225 450
Feet
Figure 1Treatability Testing Sample LocationsPhase 1 – Remedial Design
Glendale, WI
Legend
!H Treatability Testing Sampling Location
PCB Concentration >/= 50 ppm
Sediment Thickness
0 - 2 feet
2 - 4 feet
4 - 6 feet
6 - 8.75 feet
Note: Sampling locations are not within the estimated TSCA sediment areas.
\\LAKEFRONT\PROJ\EPA\382079_RAC2_LINCOLNPARK_WP\MAPFILES\PHASE I\2010\REMEDIALDESIGN\FIGURE 01 - TREATABILITY TESTING SAMPLE LOCATIONS.MXD JHANSEN1 1/3/2011 14:07:40
Mil
wau
ke
e R
iver
Park
way
Sample Location ID Composited Sample IDs
LP-SB01
LP-SB02
LP-SB03
LP-SB04
LP-SB05
LP-SB06
LP-SB07
LP-SB08
LP-SB09
LP-SB10
LP-SB11
LP-SB12
LP-SB13
LP-SB14 LP-SB13-14
LP-SB01-02
LP-SB03-04
LP-SB05-06
LP-SB07-08
LP-SB09-10
LP-SB11-12

Attachment 1 Field Sampling Plan
MKE/110050005 1
T E C H N I C A L M E M O R A N D U M
Sediment Solidification Treatability Study Field Sampling Plan PREPARED FOR: U.S. Environmental Protection Agency
Wisconsin Department of Natural Resources Milwaukee County
PREPARED BY: CH2M HILL
DATE: January 6, 2011
PROJECT NUMBER: 405068
Introduction The field sampling plan presents the procedures for the sediment sampling and treatability testing activities that will be performed as part of Lincoln Park/Milwaukee River Channel Phase 1 Remedial Design, within the Milwaukee River Estuary Area of Concern. It describes the scope of the sediment sampling and treatability testing analysis program to provide information required to aid in the remedial design activities and determine percentage and type of solidification reagent to be used during the remedial action.
Background The Phase 1 area of the Lincoln Park/ Milwaukee River site is located within the area of concern between Lincoln Creek downstream of Green Bay Road and the western oxbow located west of the northern and southern confluences of the Milwaukee River. The remedial design (Phase I) focuses on the following zones:
Zone 1—Lincoln Creek from Green Bay Road to the confluence with the Milwaukee River
Zone 2—Entire western oxbow in the Milwaukee River, to the southern Milwaukee River Parkway bridge, which contains the main sediment deposit
Zone 3a—Northwestern part of Zone 3 from the Milwaukee River Parkway bridge to the confluence of the Milwaukee River
Physical Site Characteristics The regional geology of the site is dominated by the effects of multiple glacial advances and retreats. Coarse-grained (sand and gravel) glacial outwash deposits predominate along the Milwaukee River, which occupies the course of a former glacial outwash channel. Surface and near-surface deposits outside the area immediately along the Milwaukee River are predominantly fine-grained (silt and clay) glacial till deposits.

SEDIMENT SOLIDIFICATION TREATABILITY STUDY FIELD SAMPLING PLAN
2 MKE/110050005
Zone 1—Lincoln Creek Sediment thickness in Lincoln Creek tends to be dominated by coarser-grained sediments like sand and gravel overlain by clay and silt. The thickness and characteristics of the sediments in Zone 1 vary depending on their relative location with respect to main channel flow and the morphology of the underlying substrate. Sediment thickness in Zone 1 varies from less than 1 foot to 4 feet (near the mouth of Lincoln Creek), but most measured sediment thicknesses within Zone 1 ranged from less than 1 foot to about 2 feet.
Zones 2 and 3a—Western Oxbow The sediment in Zone 2 varies in thickness from less than 1 foot to 9.5 feet. Sediments tend to be fine-grained (silts and clays) in the upper interval, and sandy in the lower interval with thin, interbedded sandy intervals of 1 foot or less. Sediment in the main channels generally is sandy with some silt. Variability in soil profiles between adjacent borings indicates that the interbedded units are likely limited in horizontal extent.
Bulk characteristic profiling of sediments indicates that the fine-grained sample intervals are predominately silts (60 to 70 percent), whereas the coarse-grained intervals are predominantly fine- to medium-grained sand (greater than 90 percent).
Purpose The object of the sediment treatability study is to evaluate whether the sediments will dewater by gravity in a timely manner so that they may be directly loaded and acceptable for landfill disposal and if not, to determine the percentage of solidification reagent and type of solidification reagent to render the excavated sediment acceptable for landfill disposal. There are two specific objectives:
Determine dewatering time to pass a paint filter test and the physical properties of the mixed material to characterize it for mechanical handling, transportation, and disposal at the disposal facility.
Determine the average percentage by weight or by volume depending on the drying agent required to be mixed with the sediment that will result in passing a paint filter test when the mixed material arrives at the disposal facility.
Sampling activities include collecting sediment samples from each of the zones representative of the depth of sediment to be excavated and transported for offsite disposal. Sediment samples collected at each location will be sent to a laboratory for testing in accordance with SOP 1 and will be used for onsite field testing in accordance with SOP 2.
Field Operations and Procedures Sediment Sample Collection Site reconnaissance activities will be completed before the start of actual sediment sampling. This will include selecting a staging area for sediment sampling activities; inspecting proposed sampling areas to determine if modifications are necessary based on the structural limitations (vegetation, water, unstable surface, etc.); and determining the underground utilities.

SEDIMENT SOLIDIFICATION TREATABILITY STUDY FIELD SAMPLING PLAN
MKE/110050005 3
The proposed sample locations within each area are uniformly distributed and will be collected to a minimum of 1-foot below the surface using a hand auger and/or shovel. No proposed sample locations for the treatability study are located within the estimated extent of TSCA sediment. Figure 1 shows the sample locations and the thickness of the sediment deposits in each area. Table 1 presents the proposed sample locations and coordinates. Each sample location will be recorded using a handheld global positioning system unit capable of a horizontal accuracy of ± 3 feet. Sampling locations will be referenced horizontally to the Wisconsin State Plane Coordinate System, South Zone, NAD83. No vertical elevation of the sample locations will be surveyed; however the sample depth will be recorded as part of the field documentation.
The dredged sediment is expected to have a high moisture content depending on the proportion of fines (< 76 microns) and fines composition (silt and clay). These factors determine the physical characteristics of the sediment from a material handling standpoint and the amount of cementitious material needed to create a cured stabilized mass that can be landfilled. The following tests will be conducted on the sediments as described in the attached SOPs:
The laboratory will analyze raw untreated sediment for grain size, percent moisture, and paint filter (pass/not pass).
The laboratory will mix the raw untreated sediment with three proportions (5, 10, and 15 percent) of Portland cement to determine the optimum cement addition required to meet the curing time and compressive strength for placement in the landfill. SOP 1 (Attachment A) gives a detailed description of the procedure.
The raw untreated sediment will be mixed onsite with 3 different proportions (10, 20, and 30 percent) of sawdust to determine moisture content and slump in outdoor conditions. The field team will perform the test onsite. The evaluations are considered complete when the results are repeated within 20 percent. The test will determine the optimum proportion of the sawdust (if any) required to reduce moisture content and slump. SOP 2 (Attachment B) gives a detailed description of the procedure.
Roughly 30 gallons of sediment will be required for each field test and 3 gallons of sediment for each lab test. To reduce the amount of sediment sample collected from each location and the total amount of the sediment waste generated, samples collected from two adjacent locations will be composited into one sample for field testing and lab testing.
TABLE 1 Proposed Sample Locations and Coordinates Lincoln Park/Milwaukee River Basis of Design Report
Sample ID Latitude Longitude
LP-SB01 2,521,096.09 410,672.52
LP-SB02 2,521,208.19 410,859.36
LP-SB03 2,521,276.32 410,323.04
LP-SB04 2,521,441.18 410,457.12
LP-SB05 2,522,172.01 410,084.56
LP-SB06 2,521,535.69 410,602.19
LP-SB07 2,521,399.41 410,773.63
LP-SB08 2,521,482.94 411,111.03
LP-SB09 2,521,701.64 411,303.35
LP-SB10 2,521,880.78 411,435.23
LP-SB11 2,521,986.28 411,607.78
LP-SB12 2,520,838.31 412,479.21
LP-SB13 2,521,016.45 411,592.82
LP-SB14 2,521,967.40 410,196.53
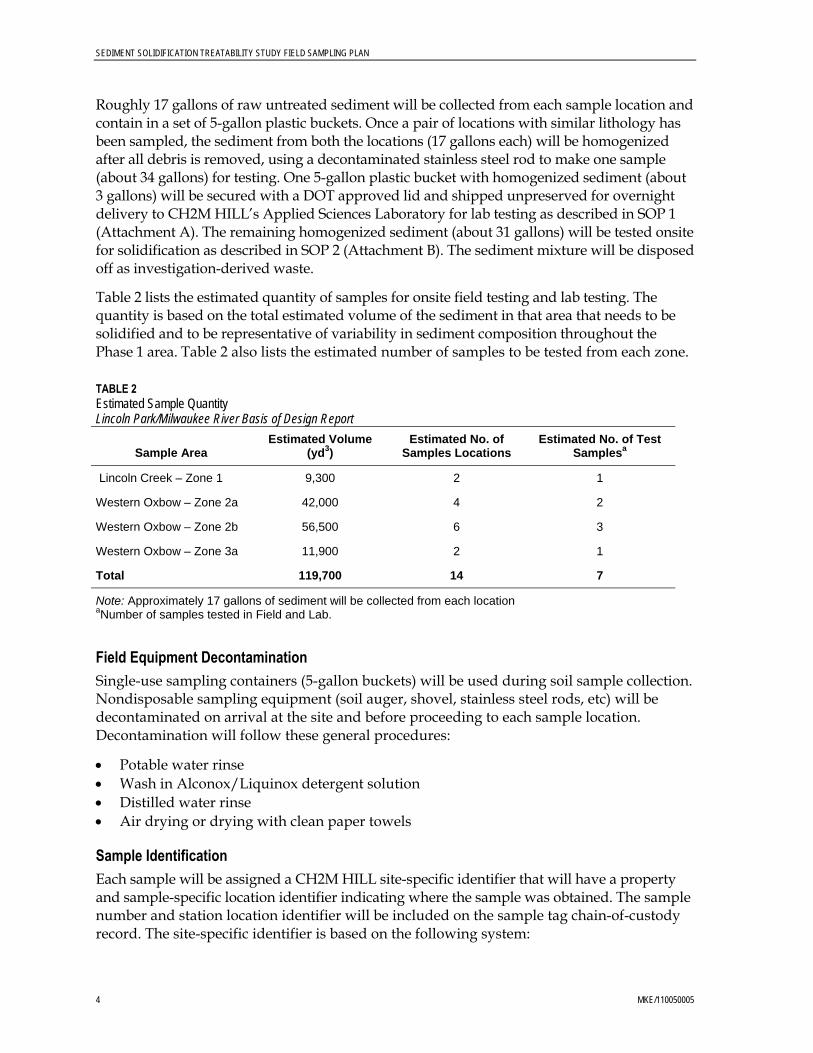
SEDIMENT SOLIDIFICATION TREATABILITY STUDY FIELD SAMPLING PLAN
4 MKE/110050005
Roughly 17 gallons of raw untreated sediment will be collected from each sample location and contain in a set of 5-gallon plastic buckets. Once a pair of locations with similar lithology has been sampled, the sediment from both the locations (17 gallons each) will be homogenized after all debris is removed, using a decontaminated stainless steel rod to make one sample (about 34 gallons) for testing. One 5-gallon plastic bucket with homogenized sediment (about 3 gallons) will be secured with a DOT approved lid and shipped unpreserved for overnight delivery to CH2M HILL’s Applied Sciences Laboratory for lab testing as described in SOP 1 (Attachment A). The remaining homogenized sediment (about 31 gallons) will be tested onsite for solidification as described in SOP 2 (Attachment B). The sediment mixture will be disposed off as investigation-derived waste.
Table 2 lists the estimated quantity of samples for onsite field testing and lab testing. The quantity is based on the total estimated volume of the sediment in that area that needs to be solidified and to be representative of variability in sediment composition throughout the Phase 1 area. Table 2 also lists the estimated number of samples to be tested from each zone.
TABLE 2 Estimated Sample Quantity Lincoln Park/Milwaukee River Basis of Design Report
Sample Area Estimated Volume
(yd3) Estimated No. of
Samples Locations Estimated No. of Test
Samplesa
Lincoln Creek – Zone 1 9,300 2 1
Western Oxbow – Zone 2a 42,000 4 2
Western Oxbow – Zone 2b 56,500 6 3
Western Oxbow – Zone 3a 11,900 2 1
Total 119,700 14 7
Note: Approximately 17 gallons of sediment will be collected from each location aNumber of samples tested in Field and Lab.
Field Equipment Decontamination Single-use sampling containers (5-gallon buckets) will be used during soil sample collection. Nondisposable sampling equipment (soil auger, shovel, stainless steel rods, etc) will be decontaminated on arrival at the site and before proceeding to each sample location. Decontamination will follow these general procedures:
Potable water rinse Wash in Alconox/Liquinox detergent solution Distilled water rinse Air drying or drying with clean paper towels
Sample Identification Each sample will be assigned a CH2M HILL site-specific identifier that will have a property and sample-specific location identifier indicating where the sample was obtained. The sample number and station location identifier will be included on the sample tag chain-of-custody record. The site-specific identifier is based on the following system:
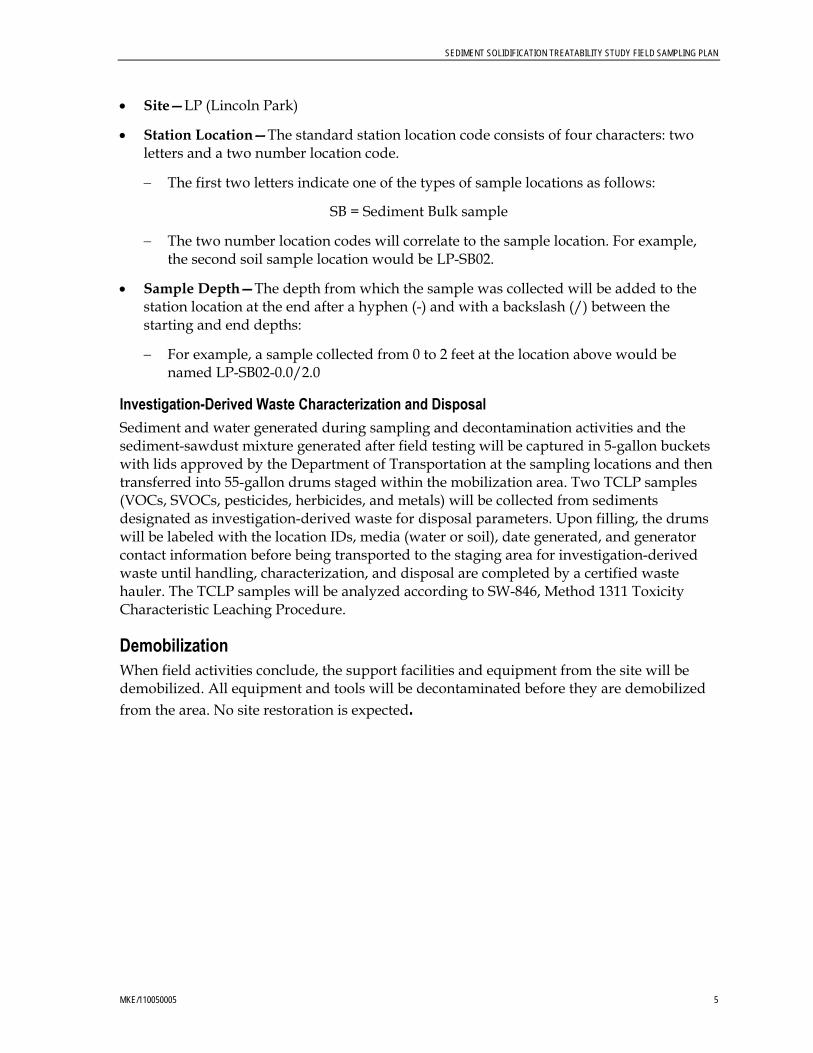
SEDIMENT SOLIDIFICATION TREATABILITY STUDY FIELD SAMPLING PLAN
MKE/110050005 5
Site—LP (Lincoln Park)
Station Location—The standard station location code consists of four characters: two letters and a two number location code.
The first two letters indicate one of the types of sample locations as follows:
SB = Sediment Bulk sample
The two number location codes will correlate to the sample location. For example, the second soil sample location would be LP-SB02.
Sample Depth—The depth from which the sample was collected will be added to the station location at the end after a hyphen (-) and with a backslash (/) between the starting and end depths:
For example, a sample collected from 0 to 2 feet at the location above would be named LP-SB02-0.0/2.0
Investigation-Derived Waste Characterization and Disposal Sediment and water generated during sampling and decontamination activities and the sediment-sawdust mixture generated after field testing will be captured in 5-gallon buckets with lids approved by the Department of Transportation at the sampling locations and then transferred into 55-gallon drums staged within the mobilization area. Two TCLP samples (VOCs, SVOCs, pesticides, herbicides, and metals) will be collected from sediments designated as investigation-derived waste for disposal parameters. Upon filling, the drums will be labeled with the location IDs, media (water or soil), date generated, and generator contact information before being transported to the staging area for investigation-derived waste until handling, characterization, and disposal are completed by a certified waste hauler. The TCLP samples will be analyzed according to SW-846, Method 1311 Toxicity Characteristic Leaching Procedure.
Demobilization When field activities conclude, the support facilities and equipment from the site will be demobilized. All equipment and tools will be decontaminated before they are demobilized from the area. No site restoration is expected.

Attachment 2 SOP-1 Solidification/Stabilization Testing

MKE/110050005 1
STANDARD OPERATING PROCEDURE NO. 1
Solidification/Stabilization Testing
Purpose To provide standard guidance for conducting sediment solidification/stabilization testing and determining the physical properties of solidified mixtures. Testing will be performed in the laboratory.
Scope The method described herein is applicable for conducting solidification/stabilization testing on sediment samples collected from Lincoln Creek and the Western Oxbow. The test is applicable for determining the behavior of sediment during dewatering, mechanical handling, transport, and disposal.
Equipment and Materials As required per geotechnical and analytical test methods specified below.
Procedures and Guidelines 1. Complete grain size analysis for each sediment sample to be tested by Test Method for
Particle-Size Analysis of Soils (ASTM D422 - 63(2007)).
2. Prepare four admixtures for each sediment sample to be tested:
100% sample 95% sample: 5% cement 90% sample: 10% cement 85% sample: 15% cement
The volume of admixture prepared will be sufficient for optimum moisture content test requirements (following). The mass of the sample and treatment materials used for each admixture will meet the ratios listed above, and it will be documented by the laboratory for each admixture.
The laboratory will use the appropriate mixing equipment and procedures to achieve a homogenous admixture.
The laboratory will conduct paint filter tests according EPA method 9095b.
3. Determine optimum moisture content for each admixture by Test Method for Laboratory Compaction Characteristics of Soil Using Modified Effort [56,000 ft-lbf/ft3(2,700 kN-m/m3)] (ASTM D1557-91).

STANDARD OPERATING PROCEDURE NO. 1
2 MKE/110050005
Five moisture contents will be used in determining the optimum moisture content. The laboratory will discuss the untreated sample moisture content results with the site manager. The site manager will determine the moisture contents to be used to determine optimum moisture content for each admixture.
4. The sample representing optimum moisture content for each admixture will be analyzed for Unconfined compressive strength per ASTM D2166-98. Fresh admixture will be prepared as needed to meet the testing/analytical volume requirements.
5. The laboratory will provide documentation of all preparation, testing, analytical equipment, procedures, and results to CH2M HILL.
Attachments None.
Key Checks and Items As required by the individual test methods.

Attachment 3 SOP-2 Qualitative Field Evaluation of
Sediment Dewatering
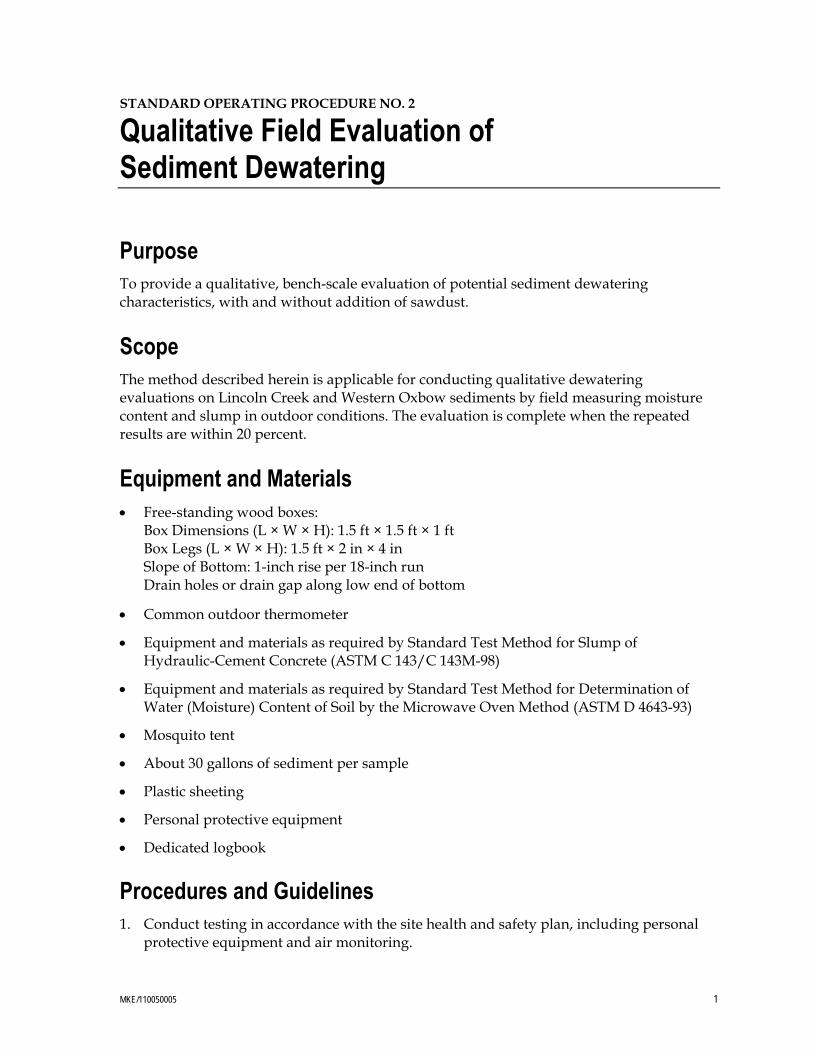
MKE/110050005 1
STANDARD OPERATING PROCEDURE NO. 2
Qualitative Field Evaluation of Sediment Dewatering
Purpose To provide a qualitative, bench-scale evaluation of potential sediment dewatering characteristics, with and without addition of sawdust.
Scope The method described herein is applicable for conducting qualitative dewatering evaluations on Lincoln Creek and Western Oxbow sediments by field measuring moisture content and slump in outdoor conditions. The evaluation is complete when the repeated results are within 20 percent.
Equipment and Materials Free-standing wood boxes:
Box Dimensions (L × W × H): 1.5 ft × 1.5 ft × 1 ft Box Legs (L × W × H): 1.5 ft × 2 in × 4 in Slope of Bottom: 1-inch rise per 18-inch run Drain holes or drain gap along low end of bottom
Common outdoor thermometer
Equipment and materials as required by Standard Test Method for Slump of Hydraulic-Cement Concrete (ASTM C 143/C 143M-98)
Equipment and materials as required by Standard Test Method for Determination of Water (Moisture) Content of Soil by the Microwave Oven Method (ASTM D 4643-93)
Mosquito tent
About 30 gallons of sediment per sample
Plastic sheeting
Personal protective equipment
Dedicated logbook
Procedures and Guidelines 1. Conduct testing in accordance with the site health and safety plan, including personal
protective equipment and air monitoring.

STANDARD OPERATING PROCEDURE NO. 2
2 MKE/110050005
2. Use a mosquito tent to enclose the test boxes during testing. Install plastic sheeting as a bottom liner inside the tent. The object of the plastic liner is to contain liquids or solids during dewatering tests. Attach the thermometer to an appropriate location on or in the tent (perhaps to a tent pole).
3. Collect measurements of outdoor temperature and percent humidity. Note weather conditions in log book.
4. Evaluate sediment samples:
Sediment Only (~ 8.5 gallons of sediment) 90% Sample: 10% sawdust by volume (~ 8 gallons of sediment) 80% Sample: 20% sawdust by volume (~ 7 gallons of sediment) 70% Sample: 30% sawdust by volume (~ 6 gallons of sediment)
5. Prepare the mixtures and place them in separate boxes. The mixture should cover the bottom of the boxes to a depth of 6 inches.
6. Take slump and moisture measurements in accordance with ASTM C 143/C 143M-98, and ASTM D 4643-93, respectively.
Measurements will be taken at set-up to establish an initial point of comparison.
Measurements will be repeated following the initial measurement at a frequency of once per day. Following each measurement, the material used for the measurement will be re-mixed in the appropriate box.
Record the temperature and weather conditions at the time of each measurement.
The test duration will be considered complete when the results for a mixture are within 20 percent of the previous day’s test or as otherwise determined by CH2M HILL’s site manager after at least 3 consecutive days of 1 measurement per day. When testing is complete, handle the test material in accordance with the field sampling plan.
7. Keep time, date, sample identification, test notes, measurements, and observations in a field logbook dedicated to the dewatering evaluation.
Attachments ASTM C 143/C 143M-98 ASTM D 4643-93
Key Checks and Items None.

Attachment 4 Laboratory Reports

Page 1 of 6

Page 2 of 6

Page 3 of 6

Page 4 of 6

Page 5 of 6
Page 6 of 6

Attachment 5 Grain Size

Page 1 of 12

Page 2 of 12
Page 3 of 12

Page 4 of 12

Page 5 of 12

Page 6 of 12

Page 7 of 12

Page 8 of 12

Page 9 of 12

Page 10 of 12

Page 11 of 12
Page 12 of 12

Attachment 6 Laboratory Testing Results for Reagent Mixing

Lincoln Park Stabilization TestingPortland Cement Amendment
Lab ID Sample ID% Portland Cement
Paint Filter Test Pass/Fail % Solids % Moisture
0% PASS 94.13 5.875% NA 96.03 3.9710% NA 96.29 3.7115% NA 96.89 3.110% PASS 60.14 39.865% NA 65.94 34.0610% NA 67.31 32.6915% NA 69.78 30.220% PASS 61.73 38.275% NA 62.93 37.0710% NA 66.31 33.6915% NA 69.68 30.320% PASS 89.71 10.295% NA 90.37 9.6310% NA 91.48 8.5215% NA 90.14 9.860% PASS 74.11 25.895% NA 74.84 25.1610% NA 77.26 22.7415% NA 77.72 22.280% PASS 59.20 40.805% NA 58.39 41.61
5% DUP NA 58.30 41.7010% NA 63.68 36.3215% NA 65.53 34.470% PASS 60.43 39.575% NA 64.68 35.32
J3324‐07 LP‐SB13‐14
J3324‐04 LP‐SB07‐08
J3324‐05 LP‐SB09‐10
J3324‐06 LP‐SB11‐12
J3324‐01 LP‐SB01‐02
J3324‐02 LP‐SB03‐04
J3324‐03 LP‐SB05‐06
0
5
10
15
20
25
30
35
40
45
0% 5% 10% 15%
Percen
t Moisture (%
)
Portland Cement Dose (Percent by weight)
Percent Moisture with Portland Cement Dose
LP‐SB01‐02
LP‐SB03‐04
LP‐SB05‐06
LP‐SB07‐08
LP‐SB09‐10
LP‐SB11‐12
LP‐SB13‐14
5% NA 64.68 35.3210% NA 66.94 33.0615% NA 67.61 32.39

Lincoln Park Stabilization TestingSuper Absorbent Polymer ‐ Mid Grade
Lab ID Sample ID % SAPPaint Filter Test
Pass/Fail % Solids % Moisture
0% PASS 87.33 12.671% NA 88.49 11.512% NA 90.11 9.893% NA 89.42 10.580% PASS 62.60 37.401% NA 62.69 37.312% NA 63.40 36.603% NA 63.78 36.220% PASS 61.26 38.741% NA 59.88 40.122% NA 60.83 39.173% NA 62.43 37.570% PASS 88.47 11.531% NA 89.03 10.972% NA 87.48 12.523% NA 87.68 12.320% PASS 73.98 26.021% NA 73.81 26.192% NA 73.21 26.793% NA 74.52 25.480% PASS 58.28 41.721% NA 55.79 44.212% NA 59.02 40.983% NA 59.33 40.670% PASS 63.96 36.041% NA 64.37 35.632% NA 64.40 35.60
J3324‐01 LP‐SB01‐02
J3324‐02 LP‐SB03‐04
J3324‐03 LP‐SB05‐06
J3324‐07 LP‐SB13‐14
J3324‐04 LP‐SB07‐08
J3324‐05 LP‐SB09‐10
J3324‐06 LP‐SB11‐12
0
5
10
15
20
25
30
35
40
45
50
0.0% 0.5% 1.0% 1.5% 2.0% 2.5% 3.0%
Percen
t Moisture (%
)
SAP Dose (Percent by weight)
Percent Moisture with SAP Dose (Mid Grade)
LP‐SB01‐02
LP‐SB03‐04
LP‐SB05‐06
LP‐SB07‐08
LP‐SB09‐10
LP‐SB11‐12
LP‐SB13‐14
2% NA 64.40 35.603% NA 66.37 33.63

Lincoln Park Stabilization TestingSuper Absorbent Polymer ‐ Premium Grade
Lab ID Sample ID % SAPPaint Filter Test
Pass/Fail % Solids % Moisture
0% PASS 87.33 12.671% NA 89.19 10.812% NA 89.04 10.963% NA 88.77 11.230% PASS 62.60 37.401% NA 64.12 35.882% NA 63.99 36.013% NA 64.28 35.720% PASS 61.26 38.741% NA 61.50 38.502% NA 60.96 39.043% NA 62.16 37.840% PASS 88.47 11.531% NA 87.69 12.312% NA 86.71 13.293% NA 87.68 12.320% PASS 73.98 26.021% NA 74.86 25.142% NA 74.66 25.343% NA 76.20 23.800% PASS 58.28 41.721% NA 56.28 43.722% NA 60.43 39.573% NA 58.49 41.510% PASS 63.96 36.041% NA 65.51 34.492% NA 64.65 35.35
J3324‐01 LP‐SB01‐02
J3324‐02 LP‐SB03‐04
J3324‐03 LP‐SB05‐06
J3324‐07 LP‐SB13‐14
J3324‐04 LP‐SB07‐08
J3324‐05 LP‐SB09‐10
J3324‐06 LP‐SB11‐12
0
5
10
15
20
25
30
35
40
45
50
0.0% 0.5% 1.0% 1.5% 2.0% 2.5% 3.0%
Percen
t Moisture (%
)
SAP Dose (Percent by weight)
Percent Moisture with SAP Dose (Premium Grade)
LP‐SB01‐02
LP‐SB03‐04
LP‐SB05‐06
LP‐SB07‐08
LP‐SB09‐10
LP‐SB11‐12
LP‐SB13‐14
2% NA 64.65 35.353% NA 64.70 35.30

Lincoln Park Stabilization TestingSample LP‐SB‐01‐02Compaction Testing and Strength Testing
STRENGTHAmendment Dose UCS
Type % psiPortland Cement 5 0
Premium Grade SAP 1 0
COMPACTION
Amendment DoseMolded Water
Content Dry Unit WeightType % % lb/ft3
Portland Cement 5 4.30 111.72Portland Cement 5 7.55 114.49Portland Cement 5 10.88 117.03Portland Cement 5 15.91 115.95
Premium Grade SAP 1 4.67 101.83Premium Grade SAP 1 13.91 93.00Premium Grade SAP 1 19.00 94.58Premium Grade SAP 1 27.76 91.20
Notes: Large‐grained soil, does not compact well. For portland cement,16% moisture caused free water to flow out of the bottom of the mold andit was not feasible to continue at a higher molding water content.
90
95
100
105
110
115
120
0 5 10 15 20 25 30Dry unit w
eigh
t [lb/ft3]
Molded Water Content [%]
Lincoln Park LP‐SB‐01‐02Compaction Curve
PC
SAP

Lincoln Park Stabilization TestingSample LP‐SB‐03‐04Compaction Testing and Strength Testing
STRENGTHAmendment Dose UCS
Type % psiPortland Cement 5 1.6
Premium Grade SAP 1 0.0
COMPACTION
Amendment DoseMolded Water
Content Dry Unit WeightType % % lb/ft3
Portland Cement 5 16.01 87.31Portland Cement 5 20.19 80.42Portland Cement 5 26.4 79.61Portland Cement 5 41.34 76.82Portland Cement 5 50.1 69.25Portland Cement 5 55.54 65.55Portland Cement 5 63.08 60.90
Premium Grade SAP 1 16.23 79.18Premium Grade SAP 1 20.01 79.99Premium Grade SAP 1 24.50 80.83Premium Grade SAP 1 31.61 73.95Premium Grade SAP 1 55.32 60.95Premium Grade SAP 1 62.47 57.87
0
10
20
30
40
50
60
70
80
90
100
0 10 20 30 40 50 60 70
Dry unit w
eigh
t [lb/ft3]
Molded Water Content [%]
Lincoln Park LP‐SB‐03‐04Compaction Curve
PC
SAP

Lincoln Park Stabilization TestingSample LP‐SB‐05‐06Compaction Testing and Strength Testing
STRENGTHAmendment Dose UCS
Type % psiPortland Cement 5 3.8
Premium Grade SAP 1 0.0
COMPACTION
Amendment DoseMolded Water
Content Dry Unit WeightType % % lb/ft3
Portland Cement 5 18.81 82.47Portland Cement 5 29.76 86.23Portland Cement 5 36.69 79.43Portland Cement 5 39.99 76.14Portland Cement 5 42.08 74.09Portland Cement 5 44.63 72.33
Premium Grade SAP 1 12.12 82.67Premium Grade SAP 1 22.65 80.97Premium Grade SAP 1 25.64 85.89Premium Grade SAP 1 35.56 79.12Premium Grade SAP 1 44.47 70.57Premium Grade SAP 1 48.18 66.57
0
10
20
30
40
50
60
70
80
90
100
0 10 20 30 40 50 60
Dry unit w
eigh
t [lb/ft3]
Molded Water Content [%]
Lincoln Park LP‐SB‐05‐06Compaction Curve
PC
SAP

Lincoln Park Stabilization TestingSample LP‐SB‐07‐08Compaction Testing and Strength Testing
STRENGTHAmendment Dose UCS
Type % psiPortland Cement 5 0.0
Premium Grade SAP 1 0.0
COMPACTION
Amendment DoseMolded Water
Content Dry Unit WeightType % % lb/ft3
Portland Cement 5 4.38 92.6Portland Cement 5 7.9 98.17Portland Cement 5 10.19 112.96Portland Cement 5 13.16 116.43Portland Cement 5 17.62 108.64Portland Cement 5 18.96 106.86
Premium Grade SAP 1 11.60 86.61Premium Grade SAP 1 14.61 85.49Premium Grade SAP 1 20.28 82.56Premium Grade SAP 1 25.13 83.07Premium Grade SAP 1 35.3 78.78Premium Grade SAP 1 42.42 66.47
0
20
40
60
80
100
120
140
0 5 10 15 20 25 30 35 40 45
Dry unit w
eigh
t [lb/ft3]
Molded Water Content [%]
Lincoln Park LP‐SB‐07‐08Compaction Curve
PC
SAP

Lincoln Park Stabilization TestingSample LP‐SB‐09‐10Compaction Testing and Strength Testing
STRENGTHAmendment Dose UCS
Type % psiPortland Cement 5 0.0
Premium Grade SAP 1 0.0
COMPACTION
Amendment DoseMolded Water
Content Dry Unit WeightType % % lb/ft3
Portland Cement 5 6.5 97.6Portland Cement 5 13.82 100.05Portland Cement 5 14.09 105.62Portland Cement 5 16.68 106.67Portland Cement 5 18.75 102.59Portland Cement 5 23.05 97.92
Premium Grade SAP 1 15.88 81.13Premium Grade SAP 1 16.26 91.68Premium Grade SAP 1 23.23 89.18Premium Grade SAP 1 31.3 79.67Premium Grade SAP 1 39.75 74.38Premium Grade SAP 1 50.26 66.97
0
20
40
60
80
100
120
0 10 20 30 40 50 60
Dry unit w
eigh
t [lb/ft3]
Molded Water Content [%]
Lincoln Park LP‐SB‐09‐10Compaction Curve
PC
SAP

Lincoln Park Stabilization TestingSample LP‐SB‐11‐12Compaction Testing and Strength Testing
STRENGTHAmendment Dose UCS
Type % psiPortland Cement 5 1.0
Premium Grade SAP 1 0.0
COMPACTION
Amendment DoseMolded Water
Content Dry Unit WeightType % % lb/ft3
Portland Cement 5 18.09 76.25Portland Cement 5 20.68 75.16Portland Cement 5 27.93 75.56Portland Cement 5 36.14 71.49Portland Cement 5 41.19 70.81Portland Cement 5 60.57 61.02Portland Cement 5 65.69 57.94Portland Cement 5 78.86 52.56
Premium Grade SAP 1 13.84 73.86Premium Grade SAP 1 21.65 72.39Premium Grade SAP 1 33.56 77.33Premium Grade SAP 1 45.66 64.54Premium Grade SAP 1 65.24 54.49Premium Grade SAP 1 78.95 49.58
0
10
20
30
40
50
60
70
80
90
0 10 20 30 40 50 60 70 80 90
Dry unit w
eigh
t [lb/ft3]
Molded Water Content [%]
Lincoln Park LP‐SB‐11‐12Compaction Curve
PCSAP

Lincoln Park Stabilization TestingSample LP‐SB‐13‐14Compaction Testing and Strength Testing
STRENGTHAmendment Dose UCS
Type % psiPortland Cement 5 7.3
Premium Grade SAP 1 0.0
COMPACTION
Amendment DoseMolded Water
Content Dry Unit WeightType % % lb/ft3
Portland Cement 5 15.99 83.91Portland Cement 5 17.23 83.02Portland Cement 5 22.34 86.59Portland Cement 5 28.25 84.66Portland Cement 5 31.96 72.75Portland Cement 5 41 74.66
Premium Grade SAP 1 14.63 80.86Premium Grade SAP 1 17.27 77.91Premium Grade SAP 1 20.69 75.70Premium Grade SAP 1 26.21 82.88Premium Grade SAP 1 38.71 75.41Premium Grade SAP 1 45.22 69.30Premium Grade SAP 1 50.73 61.49
0
10
20
30
40
50
60
70
80
90
100
0 10 20 30 40 50 60
Dry unit w
eigh
t [lb/ft3]
Molded Water Content [%]
Lincoln Park LP‐SB‐13‐14Compaction Curve
PCSAP

Appendix G Value Engineering Screening

MKE/110050005 1
DRAFT TABLE Value Engineering Screening Lincoln Park/Milwaukee River Basis of Design Report
Item No.
Category Description Benefits Drawbacks
Relative Potential Cost Savings
(Low/Med/High) Screening Comment
1 Sustainability
Construction
Segregate soil and groundwater collected from different areas to reduce volume required for treatment, transport, or regulated disposal.
Reduces cost of handling, transporting and/or disposing of contaminated media.
Requires additional laboratory analysis, management of media, and quality assurance for results.
High Incorporate Into Design. Pre-Remedial Action field investigation is being designed to refine delineation of TSCA and non-TSCA material at the site. Water media is being designed for separation of waste streams.
2 Sustainability
Construction
Consideration of environmental and economic tradeoffs involved in onsite versus offsite treatment of excavated soil or sediment
Reduced management of contaminated materials and chemicals at the site.
Offsite treatment may be more costly than onsite treatment.
Low Removed. Excavated soil is not being treated, but rather solidified to meet landfill requirements.
3 Sustainability
Restoration
Revegetate excavated areas as quickly as possible, or cover excavated areas with biodegradable fabric that also can control erosion and serve as a substrate for favorable ecosystems, or with synthetic material that can be reused for other onsite or offsite purposes.
Stabilizes disturbed areas quickly, thus reducing erosion and duration of management.
None. Low Incorporate Into Design. Typical specifications include maximum days before stabilization measures implemented.
4 Sustainability
Restoration
BMPs for restoration of surface water and adjacent banks after sediment excavation rely on low impact development techniques that reduce impacts of built areas and promote natural movement of water.
Minimizes impacts of construction on existing site features, thereby maintaining the natural environment and reducing effort for restoration.
None. Low Incorporate Into Design. Include in restoration design.
5 Sustainability
Restoration
Undercut surface water banks in ways that mirror natural conditions.
Restored conditions are more reflective of natural conditions and thereby more stable long-term.
Amount of earthwork and restoration is increased beyond base footprint.
Low Removed. Not applicable to the scope of this project.
6 Sustainability
Restoration
Retrieve dead trees during excavation and later reposition them as habitat snags.
Saves cost for importing dead trees to be used for habitat.
Storage of trees after retrieval and before restoration.
Low Incorporate Into Design. Include in restoration design.
7 Sustainability
Construction
Products with recycled and bio-based (instead of petroleum-based) contents.
Reduces harmful emissions from combustion engines.
Accessibility of fuel may be difficult. Cost of specialized fuel.
Med Evaluate for Incorporation Into Design. Evaluate benefits of emissions reduction versus accessibility of fuel and cost or fuel. May be an optional item for additional benefit, but not a requirement.
8 Sustainability
Restoration
Reclaiming and stockpiling uncontaminated soil for use as fill or other purposes such as habitat creation.
Reuses material, saving cost of imported material.
Reused material must meet chemical and physical requirements of the project to be applicable.
High Incorporate Into Design. A suitable borrow source has been identified and screened for use as fill, where appropriate. This is being incorporated into the design.
9 Sustainability
Construction
Salvaging uncontaminated objects with potential recycle, resale, donation, or onsite infrastructure value such as steel, concrete, granite, and storage containers.
Reduces volume to be disposed of in a landfill; Reduces manufacturing of materials by recycling.
Additional testing and management of objects; Limited resale value.
Low Incorporate Into Design. Typical specifications include preference toward recycling and/or resale of materials with subcontractor determining cost effectiveness.
10 Sustainability
Construction
Establish minimally intrusive and well-designed traffic patterns for onsite activities and plans to reduce off-site traffic congestion.
Reduced area of disturbance. May increase travel distance to avoid disturbances.
Low Evaluate for Incorporation Into Design. Temporary facilities and access areas are under development. Evaluate access and traffic patterns versus disturbance and restoration.
11 Sustainability
Restoration
Avoid tree removal in staging areas or intermittent uncontaminated zones, and retrieve and transplant native, noninvasive plants.
Maintains existing habitat and species. Altered traffic patterns or increased difficulty for construction access. Temporary storage and care for native plants.
Low Evaluate for Incorporation Into Design. Temporary facilities and access areas are under development. Evaluate access and traffic patterns versus disturbance and restoration.
12 Sustainability
Construction
Plan for elimination of treatment train components that will become unnecessary if site conditions change or bench-scale test alternative chemicals to warrant change.
Reduced cost for equipment, materials, and maintenance.
Risk of upset in the system and not meeting discharge permit requirements.
Med Evaluate for Incorporation Into Design. Given the relatively short duration of water treatment, evaluate risk in removing treatment train components or changing chemicals versus cost savings.

2 MKE/110050005
DRAFT TABLE Value Engineering Screening Lincoln Park/Milwaukee River Basis of Design Report
Item No.
Category Description Benefits Drawbacks
Relative Potential Cost Savings
(Low/Med/High) Screening Comment
13 Sustainability
Construction
Being aware that site conditions, regulations, and technology options may change during the period following restoration and may differ significantly from those considered during the time of design, monitor these changes and periodically revisit these practices (e.g., annually).
Where possible, early adaptation to changing future conditions helps reduce future cost of adjustments or corrections.
None. Med Evaluate for Incorporation Into Design. Specifically related to changing site conditions as a result of the Estabrook Park Dam operation as well as sediment transport from upstream.
14 Construction
Sustainability
Use super absorbent polymer instead of other solidification material; Reduced volume, weight (Used on Ottawa for TSCA sediment).
Reduced total cost for amendment and/or transportation and disposal of solidified material.
Availability and cost of specialized amendment.
High Evaluate for Incorporation Into Design. Evaluate potential incorporation of amendment into site treatability testing.
15 Construction Manage contracting mechanisms to avoid overuse of solidification agent and excessive increase in T&D (incentivize for using less, band width of % amendment, use of less amendment equals money to contractor).
Reduced risk for uncontrolled extra costs incurred during construction. Maintenance of transportation and disposal amounts.
None. High Incorporate Into Design. Determine contracting approach to managing the mechanisms and avoiding over use of amendment.
16 Construction Develop methods to keep trucks out of creek bed or avoid using crane mats.
Reduces amount of equipment and materials in the creek and potentially subject to storm events.
Potential access concerns and destruction of habitat.
Med Removed. Not feasible because of permit requirements and accessibility.
17 Restoration As water flows into area from the Milwaukee River, add weir to manage sediment transport conditions (rock/boulder baffle).
Reduces sediment transport into the remediated/restored area.
Not effective when the dam is repaired and impoundment is full.
Low Removed. This had been discussed in previous design concepts with stakeholders and subsequently removed from design. This would function until the dam creates backwater.
18 Restoration Restore upstream to limit Milwaukee River sediment deposition.
Reduces sediment transport into the remediated/restored area.
Outside of project area. Med Removed. Not in the scope of this project.
19 Restoration Avoid overcompaction of banks as a result of construction work. Remediate over compacted areas or use as future access points (handicapped access, boat ramp, fishing pier).
Converting access points to long-term use reduces restoration cost and increases recreational use options.
Access points may not be at locations conducive to reuse.
Med Evaluate for Incorporation Into Design. Specifications can be used to prevent over compaction hindering future establishment of vegetation. Further evaluate converting access points to recreational features, though this has been previously evaluated and removed. The staging and access points could be located for potential future recreational enhancements.
20 Restoration Overexcavate in some areas to provide additional depth and place material in other portions of the site. Increases habitat diversity for a longer period of time before sedimentation.
Increases habitat diversity and options for recreation.
Additional management of soil. Low Incorporate Into Design. The design includes variability in sediment depth throughout oxbow for functionality, but not specifically for habitat.
21 Restoration Stabilize banks and incorporate rocks of different sizes to increase diversity of habitat.
Increases stability of banks and diversity of habitat.
None. Low Incorporate Into Design. The design includes stabilization of banks and rocks of different sizes.
22 Restoration Seam between new restoration and established habitat; Consider working above high water mark.
Improves long-term viability of stabilization.
Increases area for restoration. Med Incorporate Into Design. The design will incorporate this approach site wide; but will only be employed where beneficial to stability, habitat restoration or both.
23 Restoration Create overflow swale for Lincoln Creek to dissipate energy during flood conditions.
Improves stability of Lincoln Creek and ability to dissipate major storm events while the project remains under riverine conditions (see “Screening Comment”). Long-term stability would be enhanced as a result of additional floodplain capacity; however, this may become less important when the impoundment is reestablished.
Dissipation area is not within designed remediation area. Additional earthwork and clearing within a wetland would be required. Would require additional hydraulic analyses and permitting.
Low Removed. Not in the scope of this project. May consider for future phase of work if and only if the overflow channel would provide substantial habitat benefits beyond existing conditions. For this option to be considered a cost savings measure, the habitat diversity and hydraulic benefits would need to outweigh the cost of hydraulic analyses, permitting, design, and construction. Depending upon local topography, a constructed overflow channel might only add value during riverine conditions. Once the impoundment is established, energy dissipation in Lincoln Creek at that location becomes

MKE/110050005 3
DRAFT TABLE Value Engineering Screening Lincoln Park/Milwaukee River Basis of Design Report
Item No.
Category Description Benefits Drawbacks
Relative Potential Cost Savings
(Low/Med/High) Screening Comment
less critical; assuming floodwater will continue to access that area regardless.
24 Restoration Floating islands: Giant planted mats improve water quality (waterfowl destroy these islands).
Improves habitat diversity and water quality.
Waterfowl destroy these floating islands.
Low Removed. Though an interesting concept, this is specifically a habitat improvement and does not tie into restoration.
25 Restoration Specify quality control of plantings during installation in subcontractor criteria and associated specifications.
Installation and maintenance performed well the first time reduces potential for additional plantings in the future.
None. High Incorporate Into Design. The design will incorporate this approach.
28 Restoration When planting, include predation control. Helps maintain plantings long term. Additional cost of controls. Med Incorporate Into Design. The design will incorporate this approach.
29 Restoration Plan for managing the transition period between restoration and dam repair/operation.
Reduced potential for restoration components to need repair during long-term maintenance.
Dam repair and operation schedule is unknown.
Med Evaluate for Incorporation Into Design. Evaluate benefits of longer term maintenance versus the additional cost for the maintenance. Design will balance the need to provide "instant" stabilization in high scour areas (Lincoln Creek banks during floods) and low scour areas (oxbow banks) to allow for as much vegetation and bioengineering in the near term, while accounting for this area being submerged once the dam is closed to create the impoundment.
30 Restoration Use granular underlayment versus filter fabric (filter fabric underlying riprap); preclude use of fabric in most areas because it stops vegetation; use granular underlayment
Reduces installation labor and improves habitat and restoration.
None. Low Incorporate Into Design. The design will incorporated this approach.
Highlighted gray rows indicate item screened out from further consideration for value engineering screening.
Highlighted green rows indicate item already planned for incorporation into the design and therefore screened out from further evaluation.

Appendix H Risk-Based Cleanup

MKE/110050005 1
T E C H N I C A L M E M O R A N D U M
Application for a PCB Risk-Based Disposal Approval (40 CFR 761.61(c)) PREPARED FOR: Ajit Vaidya/USEPA
Brenda Jones/USEPA PREPARED BY: Dan Plomb/CH2M HILL COPIES: Marsha Burzynski/WDNR
William Fitzpatrick/WDNR Kevin Haley/Milwaukee County Parks Matt Boekenhauer/CH2M HILL Gina Bayer/CH2M HILL
DATE: January 7, 2011
General The USEPA Great Lakes National Program Office (GLNPO) and the Wisconsin Department of Natural Resources (WDNR), in consultation with Milwaukee County (see Table 1), selected a remedial alternative for sediment remediation of the Phase 1 Lincoln Park/Milwaukee River site that includes excavation to remove sediments contaminated with polychlorinated biphenyls (PCB) and offsite disposal of the material. 40 Code of Federal Regulations (CFR) 761.61(c) outlines specific mechanisms for the handling and disposal of bulk PCB waste, such as PCB contaminated sediments. This memorandum outlines the specifics of the proposed remedial action and risk-based disposal of those sediments in order to obtain approval for disposal.
TABLE 1 Project Stakeholders Lincoln Park/Milwaukee River Basis of Design Report
Entity Role/Responsibility
Federal U.S. Environmental Protection Agency–GLNPO Lead federal agency
State Wisconsin Department of Natural Resources Lead nonfederal sponsor
Local Milwaukee County Property owner
Background Figure 1 shows the boundaries of the Lincoln Park/ Milwaukee River site, which is located within the Milwaukee Estuary area of concern between Lincoln Creek downstream of Green Bay Road, the western oxbow of the Milwaukee River, and the Milwaukee River downstream of the confluence with Lincoln Creek to the Estabrook Park Dam. The site was divided into five zones (Figure 1) during the Estabrook Impoundment sediment remediation predesign study (WDNR, 2005):
Zone 1: Lincoln Creek from Green Bay Road to the confluence with the Milwaukee River

APPLICATION FOR A PCB RISK-BASED DISPOSAL APPROVAL (40 CFR 761.61(C))
2 MKE/110050005
Zone 2: Entire western oxbow in the Milwaukee River, which contains the main sediment deposit
Zones 3, 4, and 5: Milwaukee River from the confluence of the western oxbow downstream to Estabrook Park Dam
Phase I of the sediment remediation focuses on Zones 1, 2, and the northwestern part of Zone 3 (Zone 3a). Zones 4 and 5 and the remaining part of Zone 3 will be addressed in the future. The Estabrook Park Dam forms the downstream boundary of the Lincoln Park/ Milwaukee River site, and backs up water about 2.5 miles to a point 0.3 mile upstream of Silver Spring Road on the Milwaukee River, creating a 103-acre impoundment. The dam also affects Lincoln Creek to a point about 0.5 mile upstream of the confluence with the Milwaukee River.
The WDNR’s predesign study of the Lincoln Park/Milwaukee River site began in 2000 under a grant from GLNPO. Water and sediment samples were collected on 12 dates between October 2001 and September 2003. Sediment samples were collected using a core sampler and a Ponar dredge sampler. Two hundred forty-six sediment samples were used to map the occurrence and distribution of PCBs, polynuclear aromatic hydrocarbons, and metals in the impoundment sediments. Other data obtained included water depth, sediment thickness, sediment total organic content, and geotechnical characteristics.
GLNPO and the Superfund Technical Assessment and Response Team contractor, Sullivan International/T N & Associates, Inc., Joint Venture Team (STN), conducted additional sediment sampling activities in February 2008 and March 2009 to support the remedial investigation. Additional sediment sampling activities supported assessment of sediment thickness, horizontal and vertical extent of PCB contamination, and the nature of the contaminants. In February 2008, 33 sediment samples were collected from Zone 2 for chemical and physical analysis. In March 2009, 18 sediment samples were collected from Zones 1, 2, and 3 for chemical analysis. Sediment thickness was surveyed at more than 250 locations in Zones 1 and 2 using direct-push technology and manual poling techniques. The results of the investigation are summarized in the Final Focused Remedial Investigation (STN, 2009).
A feasibility study was conducted in December 2009. The Feasibility Study Report (CH2M HILL, 2009) presented the remedial action objectives, technology screening, and alternatives development and evaluation. Following submittal of the report, GLNPO and WDNR (in consultation with Milwaukee County) selected a remedial alternative.
The data were used to determine volumes of sediments with total PCBs at concentrations exceeding the cleanup criterion of 1 milligram per kilogram (mg/kg), as well as estimating the volume of total PCBs in excess of 50 mg/kg (see Table 2 and Figure 1). The volume of total PCBs at concentrations exceeding 50 mg/kg was estimated by using the volume of sediment present in the creek bed, extending from the point where the Toxic Substances Control Act (TCSA)-level PCBs were measured to a measured point where the total PCBs were below 50 mg/kg.
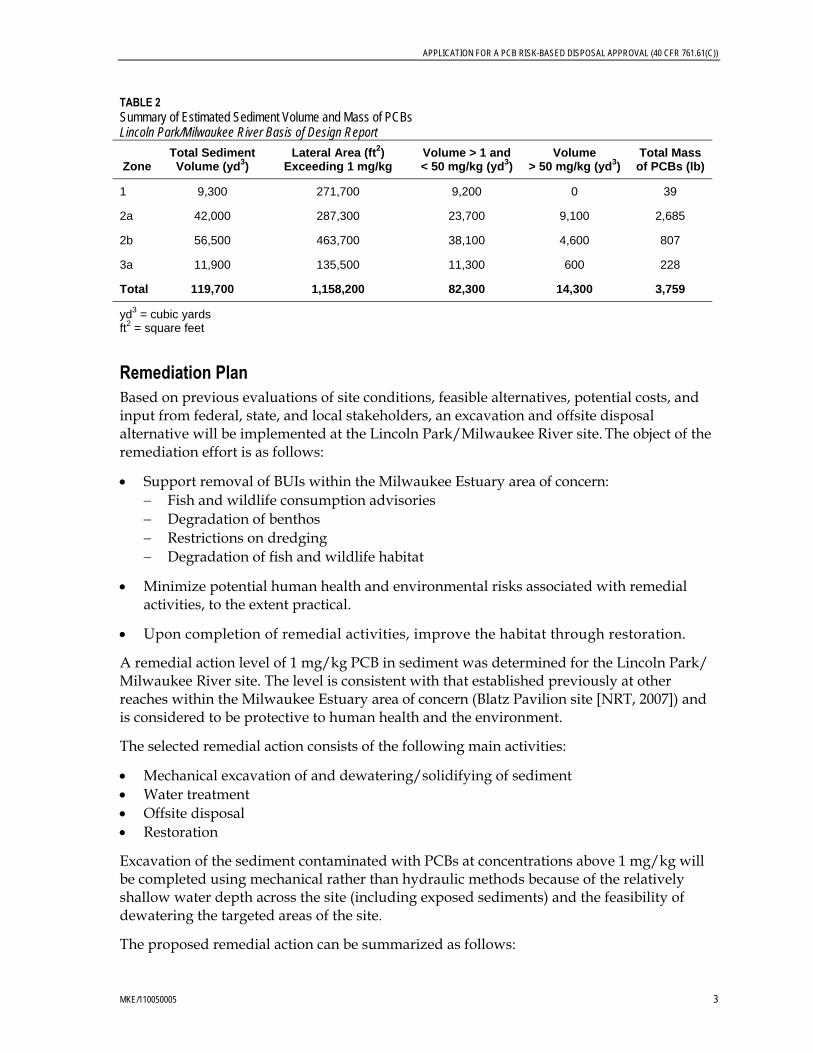
APPLICATION FOR A PCB RISK-BASED DISPOSAL APPROVAL (40 CFR 761.61(C))
MKE/110050005 3
Remediation Plan Based on previous evaluations of site conditions, feasible alternatives, potential costs, and input from federal, state, and local stakeholders, an excavation and offsite disposal alternative will be implemented at the Lincoln Park/Milwaukee River site. The object of the remediation effort is as follows:
Support removal of BUIs within the Milwaukee Estuary area of concern: Fish and wildlife consumption advisories Degradation of benthos Restrictions on dredging Degradation of fish and wildlife habitat
Minimize potential human health and environmental risks associated with remedial activities, to the extent practical.
Upon completion of remedial activities, improve the habitat through restoration.
A remedial action level of 1 mg/kg PCB in sediment was determined for the Lincoln Park/ Milwaukee River site. The level is consistent with that established previously at other reaches within the Milwaukee Estuary area of concern (Blatz Pavilion site [NRT, 2007]) and is considered to be protective to human health and the environment.
The selected remedial action consists of the following main activities:
Mechanical excavation of and dewatering/solidifying of sediment Water treatment Offsite disposal Restoration
Excavation of the sediment contaminated with PCBs at concentrations above 1 mg/kg will be completed using mechanical rather than hydraulic methods because of the relatively shallow water depth across the site (including exposed sediments) and the feasibility of dewatering the targeted areas of the site.
The proposed remedial action can be summarized as follows:
TABLE 2 Summary of Estimated Sediment Volume and Mass of PCBs Lincoln Park/Milwaukee River Basis of Design Report
Zone Total Sediment Volume (yd3)
Lateral Area (ft2) Exceeding 1 mg/kg
Volume > 1 and < 50 mg/kg (yd3)
Volume > 50 mg/kg (yd3)
Total Mass of PCBs (lb)
1 9,300 271,700 9,200 0 39
2a 42,000 287,300 23,700 9,100 2,685
2b 56,500 463,700 38,100 4,600 807
3a 11,900 135,500 11,300 600 228
Total 119,700 1,158,200 82,300 14,300 3,759
yd3 = cubic yards ft2 = square feet

APPLICATION FOR A PCB RISK-BASED DISPOSAL APPROVAL (40 CFR 761.61(C))
4 MKE/110050005
1. The Estabrook impoundment pool will continue to be drawn down by opening the gates on the controlling dam.
2. The target excavation areas will be isolated to prevent the migration of contaminated sediment downstream during excavation by installing sheet pile at the north and south Milwaukee River confluences and at the confluence of Lincoln Creek and the western oxbow.
3. A temporary bypass system for Lincoln Creek will be necessary.
4. Shore facilities necessary to support remedial activities will be constructed.
5. Sediment containing concentrations of PCBs exceeding 1 parts per million (ppm) will excavated.
6. Sediments with PCB concentrations equal to or greater than 50 ppm will be isolated from other sediment and disposed of in a licensed TSCA waste landfill.
7. Sediment with PCB concentration less than 50 ppm will be disposed of as special waste in a Wisconsin landfill approved by USEPA and WDNR.
8. The sediment will be excavated in accordance with the remedial design documents and as approved by USEPA and WDNR.
9. The proposed excavation plan will include provisions for isolating the excavated sediment to prevent spillage and contamination of clean material.
10. Excavation will take place in cells about 2 acres in area.
11. Post-removal PCB concentration will be verified by confirmatory sampling based on an approved sampling plan.
12. If the PCB concentration in the cell is verified to be at or below the cleanup level, the cell will be restored according to the designed restoration plan.
13. Excavation and haul equipment will operate from upstream to downstream, to eliminate spread of contamination from downstream areas back into areas already remediated.
14. After all targeted sediment is removed, the site will be restored according to the design restoration plan.
Additional sampling will be performed during preconstruction to delineate the TSCA level volume of sediments. The proposed sampling scheme will be to grid out the known areas (Figure 2) of TSCA level sediments and to obtain samples at 1-foot vertical intervals. Once the results of the initial grid is known, the cells exhibiting the TSCA level material, as well as parts of cells surrounding it, will be further subdivided and resampled.
Schedule CH2M HILL developed a remedial action schedule in which the construction operation is conducted 7 days per week, 24 hours per day. Table 3 depicts two options. Option 1 depicts a schedule based on an estimated excavation production rate of 1,570 cubic yards per day, and 5 days a week, 12 hours a day for restoration. Option 2 depicts the increase in excavation production rate plus a 50 percent increase in the productivity of restoration

APPLICATION FOR A PCB RISK-BASED DISPOSAL APPROVAL (40 CFR 761.61(C))
MKE/110050005 5
work. This schedule begins with the water bypass installation and sediment excavation in Lincoln Creek. The schedule returns to 5 days a week, 12 hours a day after completion of the excavation and restoration of all areas.
Using a schedule of 7 days a week, 24 hours a day reduces the calendar days working in Lincoln Creek and the western oxbow of the Milwaukee River. This reduces the risk of stopping work because of inundation of stormwater and also the overall duration of the project, allowing work to be completed within one construction season if storms force a pause in the work.
References Baird and Associates. 1997. Milwaukee River PCB Mass Balance Project WI DNR. September.
CH2M HILL. 2009. Feasibility Study Report, Lincoln Park/Milwaukee River Channel Sediments Site, Milwaukee Estuary Area of Concern. December.
CH2M HILL. 2010. Basis of Design Report, Lincoln Park/Milwaukee River Channel Sediments Site, Milwaukee Estuary Area of Concern. July.
Federal Emergency Management Agency. 2008. Flood Insurance Study, Milwaukee County, Wisconsin. September 26.
Natural Resource Technology, Inc. (NRT). 2007. Remedial Investigation/Feasibility Study, Lincoln Park/Blatz Pavilion Site. March.
STN. 2009. Final Focused Remedial Investigation, Lincoln Park/Milwaukee River Channel Sediments. August 10.
Wisconsin Department of Natural Resources (WDNR). 1994. Milwaukee Estuary Remedial Action Plan. Citizen Advisory Committee. July.
Wisconsin Department of Natural Resources. 2005. Estabrook Impoundment Sediment Remediation Pre-Design Study. Project Completion Report to USEPA (Great Lakes National Program Office Grant ID GL2000-082). PUBL-WT 826. August.
TABLE 3 Remedial Action Schedule Lincoln Park/Milwaukee River Basis of Design Report
7 days/24 hours Option 1 (Excavation)
7 days/24 hours Option 2 (Excavation and Restoration)
Start Date
Finish Date
Duration (Working Days)
Start Date
Finish Date
Duration (Working Days)
Lincoln Creek—Zone 1 6/22/11 8/2/11 29 6/22/11 7/28/11 26
West Oxbow—Zone 2a 6/29/11 8/17/11 35 6/29/11 8/10/11 30
West Oxbow—Zone 2b 8/17/11 10/16/11 41 8/10/11 10/2/11 36
West Oxbow—Zone 3a 8/25/11 9/11/11 10 8/18/11 9/2/11 11
Total 6/22/11 10/16/11 81 6/22/11 10/2/11 71
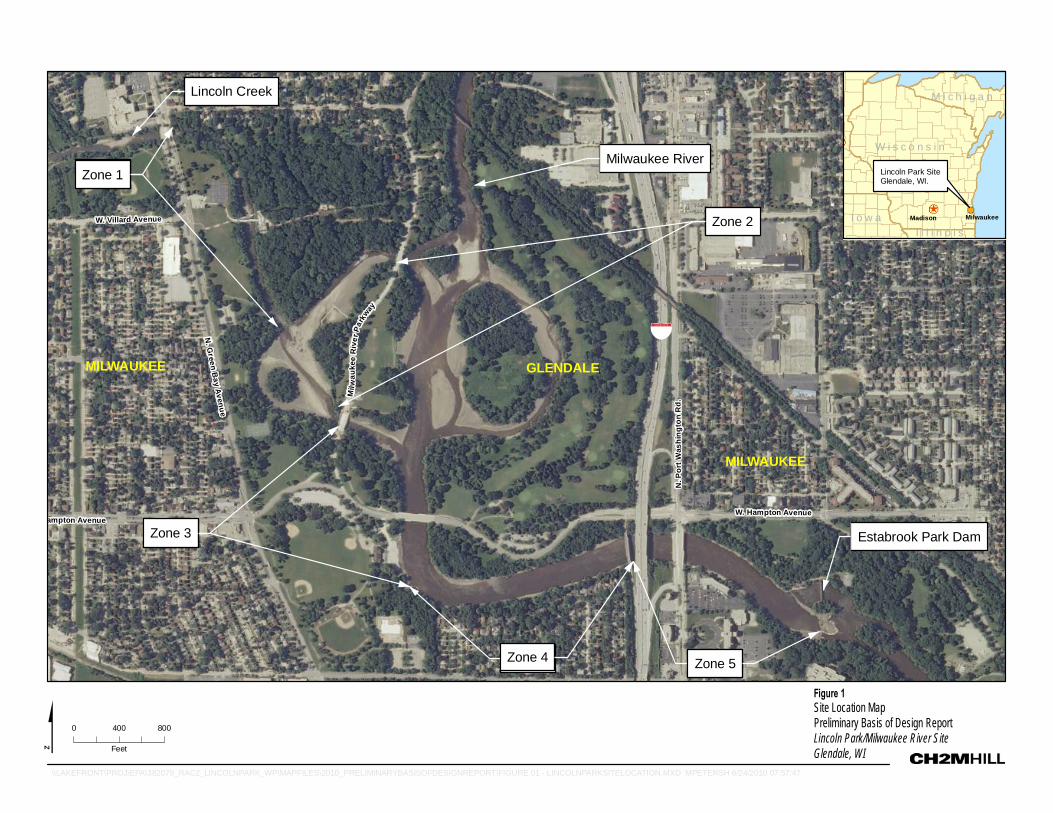
%&�(I-43
Lincoln Creek
Milwaukee RiverZone 1Zone 1
Zone 3Zone 3
Zone 2Zone 2
Zone 4Zone 4 Zone 5Zone 5
Estabrook Park Dam
Mil
wa
uk
ee
Riv
er
Par
kway
N. G
reen
Ba
y A
ven
ue
ampton Avenue
W. Villard Avenue
N. P
ort
Was
hin
gto
n R
d.
W. Hampton Avenue
MILWAUKEE GLENDALE
MILWAUKEE
$ 0 400 800
Feet
Figure 1Site Location MapPreliminary Basis of Design ReportLincoln Park/Milwaukee River SiteGlendale, WI
MilwaukeeMadison
Lincoln Park SiteGlendale, WI.
W i s c o n s i n
I o w a
M i c h i g a n
I l l i n o i s
\\LAKEFRONT\PROJ\EPA\382079_RAC2_LINCOLNPARK_WP\MAPFILES\2010_PRELIMINARYBASISOFDESIGNREPORT\FIGURE 01 - LINCOLNPARKSITELOCATION.MXD MPETERSH 6/24/2010 07:57:47
MKE/110180002 1
T E C H N I C A L M E M O R A N D U M
Toxic Substance Control Act Risk-Based Notification for the Lincoln Park/Milwaukee River Channel Sediments Site, Milwaukee Estuary Area of Concern PREPARED FOR: United States Environmental Protection Agency
Great Lakes National Program Office
PREPARED BY: CH2M HILL
DATE: January 18, 2011
1.0 Purpose and Scope The Lincoln Park/Milwaukee River Channel Sediments Site (Lincoln Park/Milwaukee River Site) is located within the Milwaukee Estuary Area of Concern, in Milwaukee, Wisconsin. The site consists of Lincoln Creek downstream of Green Bay Road, the western oxbow of the Milwaukee River, and the Milwaukee River downstream of the confluence with Lincoln Creek to the Estabrook Park Dam. The Lincoln Park/Milwaukee River Site was divided into five zones during the Estabrook Impoundment sediment remediation predesign study (Wisconsin Department of Natural Resources, 2005). The zones consist of the following:
• Zone 1: Lincoln Creek from Green Bay Road to the confluence with the Milwaukee River
• Zone 2: Entire western oxbow in the Milwaukee River, which contains the main sediment deposit
• Zones 3, 4, and 5: Milwaukee River from the confluence of the western oxbow downstream to Estabrook Park Dam
The remedial design (Phase I) focuses on Zones 1, 2, and the northwestern part of Zone 3 (Zone 3a). Zones 4 and 5 and the remaining portion of Zone 3 will be addressed separately in the future. The Estabrook Park Dam forms the downstream boundary of the Lincoln Park/Milwaukee River Site, and backs up water approximately 2.5 miles to a point 0.3 mile upstream of Silver Spring Road on the Milwaukee River, creating a 103-acre impoundment. The dam also has an impact on Lincoln Creek to a point about 0.5 mile upstream of the confluence with the Milwaukee River. The dam was built on a limestone outcrop in the river channel in 1936 and has a hydraulic height of 8 feet and maximum storage of 700 acre-feet.
Sediment characterization conducted in the Lincoln Park/Milwaukee River Site in 2008 and 2009 identified sediments contaminated with polychlorinated biphenyls (PCBs) above the Toxic Substance Control Act (TSCA) level of concern of 50 parts per million or milligrams per kilogram (mg/kg) (CH2M HILL, 2009). Summary statistics for Aroclor concentrations measured in Zones 1 and 2 are presented in Table 1. Table A-4 in Attachment A presents the PCB data from the Great Lakes National Program Office (GLNPO) 2008 and 2009 sampling.

TOXIC SUBSTANCE CONTROL ACT RISK-BASED NOTIFICATION FOR THE LINCOLN PARK/MILWAUKEE RIVER SITE
2 MKE/110180002
This memorandum presents the risk evaluation developed in cooperation with staff from United States Environmental Protection Agency’s (USEPA’s) GLNPO and the USEPA Region 5 TSCA Program to define PCB risk-based concentrations (RBCs) for sediment for the Lincoln Park/Milwaukee River Site that are protective of human health and the environment and are consistent with a risk-based cleanup approach, as required by the TSCA mega rule (Code of Federal Regulations 761.61[c]). The ultimate goal for the RBC calculation for sediment is to provide a range of target sediment cleanup levels for the Lincoln Park/Milwaukee River Site that will protect human and ecological health and will satisfy the TSCA risk-based cleanup requirements. The memorandum also summarizes the approaches and analysis used to identify RBCs for sediment to support TSCA notification required for cleanup of Lincoln Park/Milwaukee River Site sediments. A detailed presentation of the data is included as attachments to this technical memorandum.
2.0 Approach for Estimation of PCB Risk-Based Concentrations for Sediment
The estimation of RBCs for sediment (RBCsed) follows the three-step process that is presented below.
1. Estimation of biota-sediment accumulation factor (BSAF)—A BSAF describes the empirical relationship between PCB concentrations in fish tissue and sediment, ideally co-located, where the sediment concentrations represent the source of contamination to the fish.
2. Calculation of health-protective concentrations in fish (RBCfish)—Concentrations of PCBs in fish tissues were calculated based on specified target risk levels protective of people or wildlife that consume these fish.
3. Estimation of RBCsed from RBCfish and BSAF—Using Steps 1 and 2, PCB RBCs in sediment were derived from acceptable concentrations of PCBs in fish (RBCfish) and the relationship between PCBs in fish tissue and in sediment (BSAF).
3.0 Estimation of Biota-Sediment Accumulation Factor For persistent bioaccumulative compounds like PCBs, significant exposure in humans and wildlife occurs through the uptake and accumulation of PCBs in food. At a site where the PCB contamination is in sediment, the primary route of human and wildlife exposure is through consumption of fish. In order to translate from concentrations in fish tissue to RBCs in sediment, an empirical relationship between the concentration of PCBs in fish and the concentration of PCBs in sediment, termed BSAF, is required. The BSAF is expressed as the following equation:
where:
TOXIC SUBSTANCE CONTROL ACT RISK-BASED NOTIFICATION FOR THE RIVER RAISIN AREA OF CONCERN
MKE/110180002 3
BSAF = Ratio of contaminant in biota to contaminant in sediment (unit-less)
Concfish = Concentration of PCBs in fish tissue, either whole-body or fillet, on a lipid normalized basis (mg/kg lipid)
Concsed = Concentration of PCBs in an organic carbon basis (mg/kg organic carbon)
Site-specific BSAFs are derived using site-specific fish tissue and sediment data. Where adequate site-specific data are unavailable, BSAFs may be derived from available literature. For the purposes of this evaluation, literature-based BSAFs were used because site-specific fish tissue PCB concentrations were not available.
For the RBCs, both a pelagic sport fish and bottom feeding species were considered relevant for the calculations. The BSAF database (USEPA, 2007) as well as a recent article by Burkhard et al. (2010) was consulted in selecting the appropriate BSAFs for the site.
Multiple BSAFs were pulled from the literature to reflect different types of fish eaten by humans and ecological receptors. Based on a review of site data, BSAFs were chosen for the following types of fish species:
• Sport fish/terminal predator—smallmouth bass (Micropterus dolomieu) or largemouth bass (Micropterus salmoides)
• Bottom feeder—brown bullhead (Ameiurus nebulosus) or white sucker (Catostomus commersonii)
• Forage fish
All BSAFs for sportfish and bottom feeders (fillet and whole body) in the USEPA BSAF database are presented in Table A-1 of Attachment A and are summarized in Table A-2, providing the distribution of the available BSAFs. Table A-3 presents a summary of the BSAFs for forage fish species relevant for ecological receptors.
Burkhard et al. (2010) evaluated scenarios in which BSAFs were applied from one location, species, and/or site to another location, species, and/or site using PCB BSAF information available in the USEPA BSAF data sets. The authors reported results for each BSAF comparison scenario for fish, mussels, and decapods. Relevant to questions about BSAFs at the Lincoln Park/Milwaukee River Site were PCB BSAF comparisons for fish of the same species and for fish of different species across locations (Superfund Sites).
Burkhard et al. did not present a specific quantitative formula for predicting BSAFs at one location from another; however, their results (Table 2) indicated (but were not limited to) the following:
• A ±2.9-fold range around a PCB BSAF determined for a given fish species at one Superfund Site captures approximately 50 percent of the true BSAFs for the same species at a different Superfund Site.
• A ±10-fold range around any BSAF (PCB, polychlorinated dibenzodioxin and dibenzofuran, polycyclic aromatic hydrocarbon, or chlorinated pesticide) determined for a given fish species at one Superfund Site will have approximately a 90 percent
TOXIC SUBSTANCE CONTROL ACT RISK-BASED NOTIFICATION FOR THE LINCOLN PARK/MILWAUKEE RIVER SITE
4 MKE/110180002
probability of capturing the true BSAF for the same chemical and the same species at a different Superfund Site.
The findings were considered when selecting BSAFs for the Lincoln Park/Milwaukee River evaluation.
3.1 Human Health BSAFs The USEPA BSAF database (USEPA 2007) was the primary literature source for applicable BSAFs. Additionally, BSAFs from other PCB-contaminated sites that reasonably matched the Lincoln Park/Milwaukee River Site in key factors such as habitat (such as, freshwater river), fish species samples, and sediment characteristics (such as, organic carbon content) were weighted more heavily in making final decisions on BSAFs selected.
Because few BSAFs based on PCBs in fish tissue fillets were available, BSAFs derived from both fillet and whole body fish tissues were considered for developing human health RBCs. Because the BSAF model uses lipid-normalized tissue concentrations, the primary source of variation (lipid content) between whole body and fillet PCB concentration is essentially accounted for in the BSAF model. Site-specific BSAFs determined using fillet tissue are generally within the same range as those determined using whole body tissue (Attachment A, Table A-1).
To find the most appropriate literature values, available site characteristics, specifically PCB concentrations and total organic carbon (TOC), were analyzed and are shown in Table 1, both by zone and for the entire site. The geometric mean sediment PCB concentration (normalized to TOC) for the entire Lincoln Park/Milwaukee River Site (Zones 1 and 2) was 42 mg/kg organic carbon (OC), and for Zone 2, where a large proportion of the fish may be found, was 57 mg/kg OC (Table 1). The mean TOC at Lincoln Park was 6.7 percent. Overall, the system and site contaminant characteristics at the Lincoln Park/Milwaukee River Site are similar to those at the Sheboygan River Site, nearby Great Lakes contaminated site also located along the western shore of Lake Michigan. The closest matching record (Attachment A, Table A-1) from the Sheboygan River Site had a PCB concentration of 70.4 mg/kg OC, 6 percent TOC, and a BSAF for smallmouth bass of 4.1. Overall, the Sheboygan River Site had a geometric mean sediment PCB concentration of 180 mg/kg OC, mean TOC of 3.5 percent, and BSAFs of 4.2 and 1.7 for smallmouth bass and white sucker, respectively.
Median BSAFs reported in the USEPA database were 2.0 and 1.1 for bass species and sucker/catfish species, respectively (Table A-2). Using the general results of Burkhard et al. (2010), bounds on median BSAFs reported in the USEPA database (USEPA 2007) were estimated for comparisons of BSAF for similar species across sites (Attachment A, Table A-2). Using this information combined with the assumption that the similarity of Sheboygan River can be used to limit uncertainty in the BSAF estimate for the Lincoln Park/Milwaukee River Site, BSAFs selected for human health RBCfish were 4 and 1.7 for sportfish and bottom feeders, respectively (Table 3).
3.2 Ecological Health BSAFs To derive BSAFs for modeling RBCs for ecological receptors, an approach similar to that used for human health BSAFs was used. The sportfish species (bass) for which BSAFs were

TOXIC SUBSTANCE CONTROL ACT RISK-BASED NOTIFICATION FOR THE RIVER RAISIN AREA OF CONCERN
MKE/110180002 5
used to develop human health RBCs also represent terminal fish predators to be evaluated for ecological health. For consistency, the same BSAF of 4.0 that was used to develop human health RBCs was used to develop RBCs for ecological health.
To derive RBCs for fish-eating wildlife such as the belted kingfisher (Megaceryle alcyon) and mink (Neovison vison), an average BSAF representing small fish typical of those serving as forage for wildlife was selected (see supporting data in Attachment A, Table A-3). The USEPA BSAF database (USEPA, 2007) was searched for BSAFs for small fish species and/or young-of-year fish, and the median BSAF of 5.4 was selected (Table 3).
4.0 Derivation of Human Health RBC in Fish Human–health-based RBCs in fish (RBCfish) were derived using approaches and assumptions consistent with USEPA risk assessment guidance (USEPA, 1989; USEPA, 1991a) and procedures for developing Great Lakes Sport Fish Consumption Advisory (Anderson et al., 1993) and were developed in coordination with GLNPO and TSCA.
4.1 Exposure Assessment Two exposure scenarios were considered for the RBCfish calculations. An upper-bound exposure scenario was used to estimate a reasonable maximum exposure (RME) of recreational fish consumption (again using the guidance and direction cited above). The intent of doing an RME scenario was to develop a higher yet still possible exposure estimate. To assess a more average scenario of recreational sport fishing, this assessment also uses a central tendency exposure (CTE) estimate of fish consumption. The CTE case reflects exposure conditions that are more likely to be associated with the average person and was developed using the above guidance and direction that is appropriate for Great Lakes fishers.
The exposure parameters used for generating RME and CTE risk estimates for fish consumption are as listed in Table 4. Some of the exposure factors, such as body weight and exposure duration, are standard default values from USEPA guidance documents.
Recreational anglers are the populations potentially exposed by ingestion of fish from the Lincoln Park/Milwaukee River Site. For evaluation of the recreational angler scenario, the fish diet was assumed to comprise fillets from either sportfish such as smallmouth and largemouth bass or bottom feeders such as suckers and catfish. The bass species are top-level predators representing species with high-end bioaccumulation due to their position in the food web and are commonly harvested by anglers. The bottom feeders are good indicators for PCBs because of their greater lipid content and feeding habits (bottom feeder). This approach is intended to address the potential for higher exposures by certain ethnic communities or other individuals who might consume bottom-feeder fish.
Fish consumption is expressed in terms of an annualized ingestion rate, in units of grams per day. For the RME case, the ingestion rate of 38.7 grams per day is based on the 95th percentile consumption rate of recreationally caught fish, from the West et al. study (1989, as cited in USEPA, 1997a) from the sport anglers fish consumption surveys conducted in Michigan. For the CTE case, the ingestion rate of 10.9 grams per day is based on the 50th percentile consumption rate from the West et al. study (1989). For the purpose of providing

TOXIC SUBSTANCE CONTROL ACT RISK-BASED NOTIFICATION FOR THE LINCOLN PARK/MILWAUKEE RIVER SITE
6 MKE/110180002
a protective estimate for this evaluation, it is assumed that all (100 percent) of an exposed individual’s fish diet comes from recreationally caught fish from this stretch of river. The ingestion rates used are specifically for recreationally caught fish, and do not include other sources, such as market- or restaurant-purchased fish (USEPA, 1997a).
Losses of PCBs during cleaning and cooking of fish were assumed to be 50 percent based on studies reported in the literature for this chemical class (Zabik, 1995). The losses occur during removal of skin and fat, draining of fluids during cooking, and/or dripping of oils during grilling. The amount of cooking/cleaning loss is consistent with the Protocol for a Uniform Great Lakes Sports Fish Consumption Advisory (Anderson et al., 1993).
4.2 Toxicity Assessment PCBs are capable of eliciting both noncarcinogenic toxic effects and cancer (carcinogenic) effects. The health risks for noncarcinogenic and carcinogenic effects were calculated separately based on different toxicity values.
The toxicity value describing the dose-response relationship for noncancer effects is the reference dose value expressed in units of milligrams per kilogram bodyweight per day (mg/kg-day). The chronic oral reference dose value of 0.00002 mg/kg-day PCBs, based on immunotoxic effects, was selected from USEPA’s Integrated Risk Information System (IRIS), an electronic database available through the USEPA National Center for Environmental Assessment in Cincinnati, Ohio.
The toxicity value for cancer effects is expressed as a cancer slope factor that converts estimated intake directly to excess lifetime cancer risk. Slope factors are expressed in units of risk per level of exposure (mg/kg-d). The toxicity values (cancer slope factors and RfDs) used in this evaluation were obtained from the IRIS database (USEPA, 2010) The IRIS database, prepared and maintained by USEPA, contains health risk and USEPA regulatory information on specific chemicals. USEPA has classified PCBs as a probable human carcinogen (Group B2) (USEPA, 1999). The cancer slope factor is 2.0 mg/kg-d from the USEPA IRIS database.
Fish tissue PCB RBCs were calculated to account for both noncarcinogenic health effects and carcinogenicity. For the noncarcinogenic endpoint associated with PCBs, a target hazard quotient (HQ) of 1.0 is used to calculate RBCs in fish tissue. For the carcinogenic endpoint, fish tissue concentrations corresponding to excess lifetime cancer risk levels of 1 x 10⁻⁶, 1 x 10-
5, and 1 x 10⁻⁴ are calculated to span the risk range USEPA generally uses to make risk-management decisions (USEPA, 1991b). Table 4 presents the calculated fish tissue RBCs as well as the corresponding exposure assumptions used for the two exposure scenarios.
4.3 Human Health Risk-Based Cleanup Goals (RBCsed) Human health RBCs for sediment were derived using the BSAF estimates for sportfish (bass species) (BSAF = 4.0) and the bottom feeders (sucker and catfish species) (BSAF = 1.7) (see Table 4 for RBCfish calculations), and were combined using the equation provided in Table 5.
The calculated sediment RBCs correspond to each of the fish tissue RBCs for the recreational angler (CTE and RME) scenarios, for both sportfish and bottom feeder consumption (Table 5).
Sportfish: To be protective of the cancer following sportfish consumption, the estimated sediment PCB cleanup levels corresponding to cancer risks of 1 x 10⁻⁶, 1 x 10⁻⁵, and 1 x 10⁻⁴

TOXIC SUBSTANCE CONTROL ACT RISK-BASED NOTIFICATION FOR THE RIVER RAISIN AREA OF CONCERN
MKE/110180002 7
range from 0.011 to 1.1 mg/kg dry weight (dw) for the RME case, and from 0.037 to 3.7 mg/kg dw for the CTE case. For the noncarcinogenic endpoint, the estimated sediment PCB cleanup levels corresponding to an HQ of 1 range from 0.18 mg/kg dw for the RME case to 0.64 mg/kg dw for the CTE case.
Bottom Feeders: To be protective of cancer following consumption of bottom feeders, the estimated sediment PCB cleanup levels corresponding to the risk levels of 1 x 10⁻⁶, 1 x 10⁻⁵, and 1 x 10⁻⁴, range from 0.010 to 1.0 mg/kg dw for the RME case, and from 0.036 to 3.6 mg/kg for the CTE case. For the noncarcinogenic endpoint, the estimated sediment PCB cleanup levels corresponding to an HQ of 1 range from 0.17 mg/kg dw for the RME case to 0.61 mg/kg dw for the CTE case.
5.0 Ecological Health Risk-Based Cleanup Goals Ecological health-based RBCs were derived using approaches and assumptions consistent with USEPA risk assessment guidance (USEPA, 1992; USEPA, 1997b; USEPA, 1998).
5.1 Exposure Assessment Derivation of risk-based PCB cleanup goals protective of ecological health focused on the following ecological pathways:
• Fish—exposure by direct uptake from sediment and food.
• Wildlife (for example, birds and mammals)—exposure by direct uptake from sediment and food.
To streamline the process, GLNPO and TSCA staff agreed to focus on the following receptors as representative of these pathways:
• Smallmouth bass, a terminal predator • Belted kingfisher, a fish-eating bird • Mink, a fish-eating mammal
The exposure parameters used to calculate RBCs in fish are presented in Table 6.
5.2 Toxicity Assessment Toxicity reference values (TRVs) for fish, birds, and mammals were taken from the literature. Attachment B presents a review of the literature used to select TRVs. A range of toxicity studies was selected that measured the effects of PCBs on survival, growth, and reproduction. The TRVs were no observed effect concentrations (NOECs) and lowest observed effect concentrations (LOECs) for fish, and no observed adverse effect levels (NOAELs) and lowest observed adverse effect levels (LOAELs) for birds and mammals. Potential TRVs for smallmouth bass, belted kingfisher, and mink were used to calculate the 25th and 50th percentiles of the distribution. The use of the 25th and 50th percentiles and the NOEC/NOAEL and LOEC/LOAEL provide a range of conditions that bound the reasonable uncertainty in the effects data. Tables B-1, B-2, and B-3 in Attachment B summarize the data and highlight the selected 25th and 50th percentile values. The TRVs used to calculate RBCs are presented in Table 6.

TOXIC SUBSTANCE CONTROL ACT RISK-BASED NOTIFICATION FOR THE LINCOLN PARK/MILWAUKEE RIVER SITE
8 MKE/110180002
5.3 Calculation of RBCs Ecological health RBCs along with the equations and parameters used to calculate them are presented in Table 6. For the protection of fish, the RBCs based on NOECs ranged from 7.5 to 16 mg/kg dw total PCBs for the 25th percentile and median TRVs, respectively. RBCs based on LOECs ranged from 13 to 53 mg/kg dw total PCBs. For the protection of fish-eating birds, the RBCs based on NOAELs ranged from 0.047 to 0.22 mg/kg dw total PCBs for the 25th percentile and median TRVs, respectively. RBCs based on LOEALs ranged from 0.47 to 1.2 mg/kg dw total PCBs. For the protection of fish-eating mammals RBCs based on NOAELs ranged from 0.40 to 0.81 mg/kg dw total PCBs for the 25th percentile and median TRVs, respectively. RBCs based on LOAELs ranged from 0.40 to 0.99 mg/kg dw total PCBs.
6.0 Summary A range of risk-based total PCB sediment concentrations were developed that are protective of human health and ecological health (Table 7). The range of concentrations captures various exposure scenarios in the Lincoln Park/Milwaukee River site (for example, recreational angler vs. special populations) and the uncertainty in the underlying knowledge of the effects of PCBs on ecological resources. The RBCs identified in this technical memorandum will provide a range of target sediment cleanup levels that will achieve the remedial action objective of protection of human and ecological health and satisfy the TSCA risk-based cleanup requirements.
7.0 Works Cited Anderson, H. A., J. F. Amhreim, P. Shubat, and J. Hesse. 1993. Protocol for a Uniform Great Lakes Sport Fish Consumption Advisory. Great Lakes Fish Advisory Task Force Protocol Drafting Committee. September.
Burkhard, L. P., P. M. Cook, and M. T. Lukasewycz. 2010. Environmental Toxicology and Chemistry 29(1): 230-236.
CH2M HILL. 2009. Feasibility Study Report, Lincoln Park/Milwaukee River Channel Sediments Site, Milwaukee Estuary Area of Concern. December.
Nagy, K. A. 2001. “Food Requirements of Wild Animals: Predictive Equations for Free-Living Mammals, Reptiles, and Birds.” Nutrition Abstracts and Reviews Series B: Livestock Feeds and Feeding. Vol. 71, No. 10.
Skinner, L. C., B. Trometer, A. J. Gudlewski. 2009. Data Report for Residues of Organic Chemicals and Four Metals in Edible tissues and Whole Fish for Fish Taken from the Buffalo River, New York.
U.S. Environmental Protection Agency (USEPA). 1989. Risk Assessment Guidance for Superfund, Volume I, Human Health Evaluation Manual (Part A), Interim Final (RAGS). EPA/540-1-89/002. OSWER Directive 9285.701A. Environmental Protection Agency, Office of Solid Waste and Emergency Response. Washington, DC.

TOXIC SUBSTANCE CONTROL ACT RISK-BASED NOTIFICATION FOR THE RIVER RAISIN AREA OF CONCERN
MKE/110180002 9
USEPA. 1991a. Human Health Evaluation Manual, Part B: Development of Risk-based Preliminary Remedial Goals. Office of Solid Waste and Emergency Response. OSWER Directive 9285.7-01B. December 13.
USEPA. 1991b. Role of the Baseline Risk Assessment in Superfund Remedy Selection Decisions. OSWER Directive 9355.0-30, April 22.
USEPA. 1992. Framework for Ecological Risk Assessment. EPA/630/R-92/001.
USEPA. 1993. Wildlife Exposure Factors Handbook. Volume I of II. EPA/600/R-93/187a.
USEPA. 1997a. Exposure Factors Handbook. Office of Research and Development. EPA/600/P-95/002Fa,b,c. August.
USEPA. 1997b. Ecological Risk Assessment Guidance for Superfund: Process for Designing and Conducting Ecological Risk Assessments. Interim Final. EPA/540/R-97/006.
USEPA. 1998. Guidelines for Ecological Risk Assessment. EPA/630/R-95/002F.U.S.
USEPA. 1999. Polychlorinated Biphenyls (PCBs) Update: Impact on Fish Advisories. EPA/823/F-99/019.
USEPA. 2007. BSAF (Biota-Sediment Accumulation Factor) Data Set—Version 1.0. Office of Research and Development, National Health and Environmental Research Laboratory. Mid-Continent Ecology Division, Duluth, MN. Available: http://www.epa.gov/med/prods_pubs.htm.
USEPA. 2010. Integrated Risk Information System (IRIS) [Online] http://www.epa.gov/iris/.
West, P. C., M. J. Fly, R. Marans, and F. Larkin. 1989. Michigan Sport Anglers Fish Consumption Survey. Technical Report #1. Prepared for Michigan Toxic Substance Control Commission. Natural Resources Sociology Research Lab.
Zabik, M. E., M. J. Zabik, A. M. Booren, M. Nettles, J. H. Song, R. Welch and H. Humphrey. 1995. Pesticides and Total Polychlorinated Biphenyls In Chinook Salmon and Carp Harvested from The Great Lakes: Effects Of Skin-On and Skinoff Processing and Selected Cooking Methods. J. Agric. Food Chem. 43:993-1001.

Attachment A
Data Used in Assessment

Lincoln Park TSCA Notification Risk Evaluation
Site ID Superfund Site
Species
Common Name BSAF
Average
sediment PCB
(mg/kg oc)
Average
biota PCB
(mg/kg
lipid) Sed avg OCf
Mean
Lipid
Fraction
CENT01 Centredale Manor largemouth bass 1.0 9.8 10.2 0.106 0.0069MUDD01 Muddy Cove white perch 1.4 5.3 7.5 0.063 0.0070MUDD01 Muddy Cove white perch 0.2 82.0 17.3 0.098 0.0069MUDD01 Muddy Cove white perch 3.2 4.1 13.2 0.035 0.0056MUDD01 Muddy Cove white perch 1.6 5.2 8.1 0.054 0.0054
Whole-body Largemouth and Smallmouth Bass
CENT01 Centredale Manor largemouth bass 2.3 9.8 22.8 0.106 0.024HOUS01 Housatonic River largemouth bass 5.2 169.9 884.4 0.051 0.042HOUS01 Housatonic River largemouth bass 1.9 169.9 330.7 0.051 0.030HOUS01 Housatonic River largemouth bass 9.3 74.2 689.6 0.042 0.016HOUS01 Housatonic River largemouth bass 0.6 669.3 422.5 0.017 0.045HOUS01 Housatonic River largemouth bass 5.6 74.2 414.7 0.042 0.026HOUS01 Housatonic River largemouth bass 1.4 169.9 242.4 0.051 0.031HOUS01 Housatonic River largemouth bass 9.3 74.2 690.2 0.042 0.028HOUS01 Housatonic River largemouth bass 0.1 669.3 65.3 0.017 0.018HOUS01 Housatonic River largemouth bass 3.7 169.9 620.5 0.051 0.031HOUS01 Housatonic River largemouth bass 9.8 74.2 725.4 0.042 0.029HOUS01 Housatonic River largemouth bass 4.3 169.9 737.2 0.051 0.061HOUS01 Housatonic River largemouth bass 17.2 74.2 1276.5 0.042 0.051HOUS01 Housatonic River largemouth bass 8.4 167.7 1403.7 0.051 0.039HOUS01 Housatonic River largemouth bass 33.4 74.2 2476.7 0.042 0.014HOUS01 Housatonic River largemouth bass 3.0 169.9 511.8 0.051 0.021HOUS01 Housatonic River largemouth bass 2.0 472.8 965.9 0.017 0.033HOUS01 Housatonic River largemouth bass 2.5 169.9 431.6 0.051 0.024HOUS01 Housatonic River largemouth bass 3.3 169.9 554.8 0.051 0.045HOUS01 Housatonic River largemouth bass 8.8 169.9 1495.9 0.051 0.052HOUS01 Housatonic River largemouth bass 5.1 74.2 376.9 0.042 0.049HOUS01 Housatonic River largemouth bass 2.1 669.3 1383.2 0.017 0.021HOUS01 Housatonic River largemouth bass 4.4 169.9 739.8 0.051 0.040HOUS01 Housatonic River largemouth bass 10.9 74.2 810.5 0.042 0.028HOUS01 Housatonic River largemouth bass 16.1 74.2 1194.2 0.042 0.025HOUS01 Housatonic River largemouth bass 20.3 74.2 1508.2 0.042 0.025HOUS01 Housatonic River largemouth bass 13.7 74.2 1014.0 0.042 0.029HOUS01 Housatonic River largemouth bass 9.2 74.2 680.1 0.042 0.022HOUS01 Housatonic River smallmouth bass 1.9 669.3 1249.5 0.017 0.058HOUS01 Housatonic River smallmouth bass 1.3 669.3 851.0 0.017 0.053HUDR01 Hudson River largemouth bass 0.2 903.6 210.6 not reported not reportedHUDR01 Hudson River largemouth bass 4.1 276.3 1133.8 not reported not reportedHUDR01 Hudson River largemouth bass 1.7 409.5 682.8 not reported not reportedKALZ01 Kalamazoo River smallmouth bass 5.9 67.1 392.8 0.049 0.019KALZ01 Kalamazoo River smallmouth bass 13.6 1.9 25.3 0.022 0.027PORT01 Portland Harbor smallmouth bass 0.3 63.8 17.0 0.012 0.055PORT01 Portland Harbor smallmouth bass 0.1 70.5 7.7 0.011 0.066PORT01 Portland Harbor smallmouth bass 0.1 46.2 4.9 0.011 0.070PORT01 Portland Harbor smallmouth bass 3.2 4.6 14.6 0.014 0.043PORT01 Portland Harbor smallmouth bass 5.3 9.2 48.9 0.018 0.057PORT01 Portland Harbor smallmouth bass 0.5 17.4 8.4 0.014 0.066PORT01 Portland Harbor smallmouth bass 1.1 10.6 12.0 0.011 0.051PORT01 Portland Harbor smallmouth bass 6.0 2.0 12.3 0.011 0.023SHEB01 Sheboygan River smallmouth bass 20.4 0.1 1.9 0.054 0.034SHEB01 Sheboygan River smallmouth bass 4.1 70.4 291.4 0.060 0.030SHEB01 Sheboygan River smallmouth bass 3.6 236.0 838.8 0.054 0.023SHEB01 Sheboygan River smallmouth bass 12.3 27.7 341.3 0.045 0.027
��������BSAFs for Total PCBs in Fish Reported in the USEPA BSAF Database
Fillets (includes all available fish fillet data in the U.S. EPA database)

Lincoln Park TSCA Notification Risk Evaluation
Site ID Superfund Site
Species
Common Name BSAF
Average
sediment PCB
(mg/kg oc)
Average
biota PCB
(mg/kg
lipid) Sed avg OCf
Mean
Lipid
Fraction
��������BSAFs for Total PCBs in Fish Reported in the USEPA BSAF Database
SHEB01 Sheboygan River smallmouth bass 10.6 0.7 7.7 0.045 0.027SHEB01 Sheboygan River smallmouth bass 3.0 120.8 358.5 0.016 0.041SHEB01 Sheboygan River smallmouth bass 1.4 526.6 732.6 0.026 0.035SHEB01 Sheboygan River smallmouth bass 4.3 152.4 661.5 0.020 0.033
Whole-body White Sucker and Brown Bullhead Bass
HOUS01 Housatonic River white sucker 17.5 284.3 4983.9 0.075 0.0085HOUS01 Housatonic River white sucker 0.5 2618.9 1372.7 0.014 0.022HOUS01 Housatonic River white sucker 0.9 348.4 321.6 0.022 0.037HOUS01 Housatonic River white sucker 0.9 615.0 552.3 0.057 0.072CENT01 Centredale Manor white sucker 1.6 10.4 17.1 0.106 0.10CENT01 Centredale Manor white sucker 1.8 10.4 18.8 0.106 0.078CENT01 Centredale Manor white sucker 1.4 10.4 14.6 0.106 0.068HOUS01 Housatonic River brown bullhead 4.0 167.2 675.0 0.051 0.027HOUS01 Housatonic River brown bullhead 10.4 74.2 773.7 0.042 0.043HOUS01 Housatonic River brown bullhead 1.0 472.8 481.4 0.017 0.020HOUS01 Housatonic River brown bullhead 4.7 167.2 780.8 0.051 0.034HOUS01 Housatonic River brown bullhead 14.3 73.4 1047.3 0.042 0.026HOUS01 Housatonic River brown bullhead 3.4 167.2 571.1 0.051 0.015HOUS01 Housatonic River white sucker 0.6 2618.9 1441.9 0.014 0.013HOUS01 Housatonic River white sucker 3.4 348.4 1173.6 0.022 0.020HOUS01 Housatonic River white sucker 0.8 615.0 470.0 0.057 0.035HOUS01 Housatonic River white sucker 5.2 284.3 1488.0 0.075 0.038HOUS01 Housatonic River white sucker 1.0 518.3 539.1 0.046 0.038HOUS01 Housatonic River white sucker 0.3 2638.7 892.2 0.014 0.064HOUS01 Housatonic River white sucker 1.8 348.4 641.0 0.022 0.058KALZ01 Kalamazoo River white Sucker 0.8 66.2 54.4 0.049 0.008PORT01 Portland Harbor brown bullhead 0.1 70.1 5.9 0.009 0.022PORT01 Portland Harbor brown bullhead 2.1 17.3 36.4 0.013 0.026SHEB01 Sheboygan River white sucker 0.9 69.0 61.7 0.037 0.057SHEB01 Sheboygan River white sucker 2.0 118.7 238.6 0.016 0.026SHEB01 Sheboygan River white sucker 1.4 519.5 701.4 0.026 0.020SHEB01 Sheboygan River white sucker 3.4 149.5 512.6 0.020 0.022

��������Summary of BSAFs for Total PCBs in Largemouth and Smallmouth Bass, White Suckers, and Brown Bullhead Reported in the USEPA BSAF DatabaseLincoln Park TSCA Notification Risk Evaluation
Site ID
Superfund
Site
Fish
Common Name
Mean Lipid
Fraction
Minimum
BSAF
Median
BSAF
Maximum
BSAF
CENT01 Centredale Manor largemouth bass fillet 0.0069 1.0 1.0 1.0 0.35 - 3.1 0.10 - 10CENT01 Centredale Manor largemouth bass 0.024 2.3 2.3 2.3 0.77 - 7.0 0.23 - 23HOUS01 Housatonic River largemouth bass 0.034 0.1 5.2 33.4 1.7 - 16 0.52 - 52HUDR01 Hudson River largemouth bass not reported 0.2 1.7 4.1 0.56 - 5.0 0.17 - 17HOUS01 Housatonic River smallmouth bass 0.056 1.3 1.6 1.9 0.52 - 4.7 0.16 - 16KALZ01 Kalamazoo River smallmouth bass 0.023 5.9 9.7 13.6 3.2 - 29 1.0 - 97PORT01 Portland Harbor smallmouth bass 0.054 0.1 0.8 6.0 0.27 - 2.4 0.08 - 8.1SHEB01 Sheboygan River smallmouth bass 0.031 1.4 4.2 20.4 1.4 - 13 0.42 - 42
0.033 2.0 0.66 6.0 0.20 20
HOUS01 Housatonic River white sucker 0.035 0.5 0.9 17.5 0.30 - 2.7 0.09 - 9.1CENT01 Centredale Manor white sucker 0.082 1.4 1.6 1.8 0.55 - 4.9 0.16 - 16HOUS01 Housatonic River white sucker 0.038 0.3 1.0 5.2 0.35 - 3.1 0.10 - 10KALZ01 Kalamazoo River white sucker 0.0075 0.8 0.8 0.8 0.27 - 2.5 0.08 - 8.2SHEB01 Sheboygan River white sucker 0.031 0.9 1.7 3.4 0.56 - 5.0 0.17 - 17HOUS01 Housatonic River brown bullhead 0.028 1.0 4.4 14.3 1.5 - 13 0.44 - 44PORT01 Portland Harbor brown bullhead 0.024 0.1 1.1 2.1 0.36 - 3.3 0.11 - 11
0.031 1.1 0.36 3.3 0.11 11
aRepresents +/- 3 times median; based on Burkhard et al 2010, captures approximately the center 50% of across-site BSAF comparisonsbRepresents +/- 10 times median; based on Burkhard et al 2010, captures approximately the center 90% of across-site BSAF comparisonscAverage represented by mean (lipid) or median (BSAFs); Overall average for lipids excludes the single fillet result
10-fold range around
medianb,
estimated 90% of
comparisons
Overall Averagec
Overall Averagec
3-fold range around
mediana,
estimated 50% of
comparisons

���������Literature BSAFs for Use in Deriving Risk-Based Sediment Concentrations for Ecological ReceptorsLincoln ParkTSCA Notification Risk Evaluation
Superfund Site
Species
Common Name Age Class Lipid fraction BSAFa
Total PCBs in
Sediment
(avg mg/kg oc)
Kalamazoo River Forage Fish Composite NR 0.040 1.4 66.8Green Bay Gizzard Shad YOY NR 0.5 72.6Housatonic River Largemouth Bass YOY 0.016 9.3 74.2Housatonic River Pumpkinseed <25 g 0.031 5 74.2Housatonic River Yellow Perch <40 g 0.025 5.7 74.2Housatonic River Yellow Perch <40 g 0.025 7.5 55.3Median 0.025 5.4 69.6NR=Not reportedBolded BSAF selected for use in calculating sediment RBCs.a BSAFs were taken from USEPA (2007).
Forage Fish

Lincoln Park TSCA Notification Risk Evaluation Ortho Depth Total Aroclors Fraction Total Arolcors
Sampling Date Northing Easting ht (ft) (ft) (mg/kg) TOC (mg/kg OC)
LPMR-S-1-0-0.5 2/27-29/2008 968504.36 2259441.54 613.66007 0 - 0.5 0.292 0.019 15.4 Zone 2LPMR-S-2-0-0.5 2/27-29/2008 968389.81 2259242.54 614.23296 0 - 0.5 143.9 0.083 1733.7 Zone 2LPMR-S-3-0-0.5 2/27-29/2008 968342.84 2259335.38 614.18893 0 - 0.5 2.9 0.098 29.6 Zone 2LPMR-S-4-0-0.5 2/27-29/2008 968021.89 2259213.73 615.90897 0 - 0.5 1.74 0.073 23.8 Zone 2LPMR-S-5-0-0.5 2/27-29/2008 967988.62 2258957 614.69959 0 - 0.5 4.15 0.042 98.8 Zone 2LPMR-S-6-0-0.5 2/27-29/2008 967887.12 2258955.67 615.96934 0 - 0.5 8.8 0.109 80.7 Zone 2LPMR-S-7-0-0.5 2/27-29/2008 967475.45 2258577.91 615.13081 0 - 0.5 4.4 0.097 45.4 Zone 2LPMR-S-8-0-0.5 2/27-29/2008 967195.67 2258551.31 614.89216 0 - 0.5 22.2 0.056 396.4 Zone 2LPMR-S-9-0-0.5 2/27-29/2008 967140.67 2258681.92 615.27393 0 - 0.5 6.1 0.045 135.6 Zone 2LPMR-S-10-0-0.5 2/27-29/2008 966995.43 2259336.63 615.80769 0 - 0.5 1.12 0.076 14.7 Zone 2LPMR-S-11-0-0.5 2/27-29/2008 966952 2259484.52 615.91959 0 - 0.5 29.6 0.08 370.0 Zone 2LPMR-S-12-0-0.5 2/27-29/2008 966730.53 2259549.6 614.19703 0 - 0.5 2.42 0.041 59.0 Zone 2LPMR-S-13-0-0.5 2/27-29/2008 966653.22 2259606.28 613.95042 0 - 0.5 4.13 0.049 84.3 Zone 2
WO-AA-2 3/2-6/2009 968445.95 2259638.41 613.464 0- 1.0 7 0.067 104.8 Zone 2WO-C-2-top 3/2-6/2009 968302.96 2259239.02 613.366 0- 0.5 2.2 0.067 32.9 Zone 2
WO-F-1-top half 3/2-6/2009 968003.57 2258900.31 613.114 0- 0.5 0.91 0.067 13.6 Zone 2WO-I-2-top half 3/2-6/2009 967665.16 2258542.52 613.503 0 -1.5 120 0.067 1797.2 Zone 2
WO-O-2- top half 3/2-6/2009 966982.6 2259106.4 612.351 0- 0.5 1.2 0.067 18.0 Zone 2WO-R-2-top half 3/2-6/2009 966822.92 2259516.24 611.847 0- 0.5 3.1 0.067 46.4 Zone 2
WO-R-2-top half-dup 3/2-6/2009 966822.92 2259516.24 611.847 0- 0.5 3.2 0.067 47.9 Zone 2WO-K-3-top 3/2-6/2009 967221.36 2258475.2 614.026 0 - 2.0 0.75 0.067 11.2 Zone 2WO-H-3-top 3/2-6/2009 967759.22 2258664.93 612.888 0 - 2.0 0.086 0.067 1.3 Zone 2
LC-B-1-N 3/2-6/2009 969453.6 2258101.2 613.7 0- 1.0 5.4 0.066 82.4 Zone 1LC-B-2 3/2-6/2009 969440.5 2258122.5 613.7 0- 0.5 0.97 0.066 14.8 Zone 1
LC-B-2-S 3/2-6/2009 969427.5 2258143.9 613.7 0- 1.0 0.91 0.066 13.9 Zone 1LC-C-2 3/2-6/2009 969159.5 2258281.6 613.612 0- 1.0 1.3 0.066 19.8 Zone 1LC-D-2 3/2-6/2009 968859.8 2258318.5 613.137 0- 0.3 0.82 0.066 12.5 Zone 1LC-E-2 3/2-6/2009 968539.1 2258635 612.96 0- 0.6 0.272 0.066 4.2 Zone 1LC-F-2 3/2-6/2009 968231.8 2258431 613 0- 1.0 1.2 0.0655 18.3 Zone 1
Sample ID
GPS Locationa
Location
���������Summary of PCBs in River Channel Sediments at the Lincoln Park/Milwaukee River Site from GLNPO 2008 and 2009 Sampling

Attachment B Ecological Toxicity Reference Values
Literature Review

MKE/110180002 B-1
ATTACHMENT B
Ecological Toxicity Reference Values Literature Review
Fish Toxicity Reference Values Toxicity studies that relate polychlorinated biphenyls (PCBs) in fish tissue to adverse effects were identified from a search of electronic databases and reference sources, including the following:
• Environmental Residue-Effects Database (2003)
• ECOTOX Database (United States Environmental Protection Agency [USEPA], 2003)
• Jarvinen and Ankley (1999), a compilation of tissue residue no observed effect concentrations (NOECs) and lowest observed effect concentrations (LOECs)
• Scientific literature searches through search engines such as BIOSIS and Science Direct
Databases were searched for fish dose-response studies in which tissue concentrations were measured.
Studies were selected for review if whole-body tissue concentrations and measured survival, growth, or reproductive effects data were available. Studies reporting residue concentrations in tissues other than whole-body (for example, egg or other organ tissues) were reviewed when relevant endpoints were measured. All life stages, including eggs, were considered. Fish-egg tissue residue toxicity reference values (TRVs) were converted into adult whole-body tissue residue TRVs using conversion factors reported in literature.
The acceptability of fish toxicity studies was determined through best professional judgment, taking into account the following:
• Was the observed toxicity a result of a single constituent? Studies using field-collected fish with background constituent concentrations in tissue cannot attribute toxicity to one specific constituent unless there is strong evidence that all other constituents in the tissue are below toxic levels.
• What is the ecological relevance of the exposure duration? Chronic studies measuring exposure for 30 days or longer were preferred.
• Did the measured endpoint in the study directly measure the growth, survival, or reproductive success of the test organism?
PCB Aroclors For PCBs (as Aroclors), the proposed TRVs are derived from NOECs and LOECs for the individual Aroclor mixture with the highest toxicity for comparison with total PCB

ECOLOGICAL TOXICITY REFERENCE VALUES LITERATURE REVIEW
B-2 MKE/110180002
concentrations (sum of Aroclors). Twenty papers on the potential adverse effects of PCB mixtures on fish were reviewed. Details of the studies are summarized in Table B-1. The potential mechanisms of exposure included dietary ingestion, water exposure, gavage, and maternal transfer. Concentrations in whole-body tissue were reported in 16 reviewed studies (Duke et al., 1970; Fisher et al., 1994; Hansen et al., 1971, 1973, 1974, 1975; Hattula and Karlog, 1972; Hendricks et al., 1981; Lieb et al., 1974; Matta et al., 2001; Mauck et al., 1978; Mayer et al., 1977, 1985; Nebeker et al., 1974; Powell et al., 2003), and egg tissue concentrations were reported in four reviewed studies (Fisher et al., 1994; Freeman and Idler, 1975; Mac and Seelye, 1981; McCarthy et al., 2003).
Adverse effects on growth, mortality, reproduction, and behavior were reported in both laboratory-raised and field-collected fish. Five additional studies measuring the toxicity of PCBs to fish were reviewed; however, the studies were excluded from the TRV selection process because they did not meet the criteria used for TRV literature selection. Specifically, studies in which no toxic effects were reported (Kuehl et al., 1987) were excluded from the TRV selection process. In addition, studies that reported endpoints that were not related to growth, mortality, reproduction, and behavior, such as enzymatic activity, were not included in the TRV selection process (Melancon and Lech, 1983). DeFoe et al. (1978) was not included in the TRV selection process because no tissue concentrations were reported at a time when effects were observed. Finally, Rhodes and Casillas (1985) was excluded from the TRV selection process because fish were exposed to a mixture of constituents in the laboratory.
Several studies were evaluated to derive conversion factors between egg tissue residues and maternal adult tissue residues. Three papers that report PCB concentrations in maternal adults relative to eggs were identified (Miller, 1993; Niimi, 1983; Russell et al., 1999). Russell et al. (1999), and Miller (1993) report only egg and maternal adult fillet data, which is not directly usable to derive a whole-body concentration for comparison with site-specific fish data; therefore, PCB egg to adult conversion factors were based on data from Niimi (1983). Niimi (1983) reports whole-body maternal adult (with eggs) and unfertilized egg constituent concentration data for PCBs (quantified using a 4:1 Aroclor-1254:1260 analytical standard) from rainbow trout, white sucker, white bass, smallmouth bass, and yellow perch collected from Lake Ontario and Lake Erie. Niimi (1983) notes that the constituent concentrations in fertilized eggs would be two to three times lower than those reported for unfertilized eggs because of water uptake prior to egg hardening. Therefore, because available egg TRV papers report fertilized egg data, to derive egg-adult conversion factors, egg concentration data reported in Niimi (1983) were conservatively divided by two to approximate fertilized egg concentrations. Because Niimi (1983) showed that the ratio of constituents in eggs to constituents in maternal adults was dependent on species, species-specific (that is, salmonids and trout species) egg-to-adult conversions were used if a species was the same or closely related to one of the species reported in Niimi (1983) (that is, rainbow trout). If no species-specific conversion was available, an average egg-to-adult conversion across the five species (that is, rainbow trout, white sucker, white bass, smallmouth bass, and yellow perch) reported in Niimi (1983) was used (list value).
Table B-1 presents the fish PCB effects concentrations reported in the reviewed studies. Whole-body tissue residues of PCBs in nine species (rainbow trout, brook trout, Atlantic salmon, sheepshead minnow, lake trout, spot, pinfish, goldfish, and coho salmon) were
ECOLOGICAL TOXICITY REFERENCE VALUES LITERATURE REVIEW
MKE/110180002 B-3
associated with adverse effects on growth, survival, behavior, or reproduction in 16 of the reviewed studies. Whole-body tissue residue LOECs ranged from 1.53 mg/kg for fry mortality of field-collected brook trout (Berlin et al., 1981) to 645 milligrams per kilogram on wet-weight basis (mg/kg ww) for growth and mortality of fingerling coho salmon (Mayer et al., 1977). In the study reporting the lowest LOEC (Berlin et al., 1981), field-collected eggs were exposed to three levels of PCB concentrations via diet and water for 176 days, and fry mortality was observed at all exposure levels. The concentration in fry tissue exposed to the lowest level was 1.53 mg/kg ww PCBs after 176 days of exposure (Berlin et al., 1981); however, the field-collected eggs contained 7.6 mg/kg ww PCB and 4.7 mg/kg ww dichlorodiphenylethylene (DDE), and possibly other, uncharacterized organic constituents that could have contributed to the reported toxicity. The next lowest LOEC was based on Fisher et al. (1994), in which live fry body weight was significantly reduced in Atlantic salmon following egg exposure to a PCB Aroclor mixture in water for 48 hours. The reported egg concentration of 1.53 mg/kg ww PCBs was converted into an adult tissue whole-body concentration of 7.2 mg/kg ww using a conversion factor of 4.69 (Niimi, 1983).
Whole-body tissue residue NOECs ranged from 0.98 mg/kg ww for growth of juvenile Chinook salmon (Powell et al., 2003) to 120 mg/kg ww for growth of rainbow trout (Mayer et al. 1985). Only the lowest NOEC of 0.98 mg/kg ww was below the lowest LOEC. In this study, Powell et al. (2003) measured no effect on juvenile Chinook salmon growth where whole-body tissue residues ranged from 0.74 to 0.98 mg/kg following 4 weeks of exposure to Aroclor 1254 in water.
Wildlife TRVs Studies that relate dietary concentrations or bird egg concentrations of PCBs to adverse effects in wildlife were identified from a search of electronic databases and from a review of original studies identified in the following review sources:
• Agency for Toxic Substances and Disease Registry (ATSDR) • ECOTOX database (USEPA electronic database) • BIOSIS electronic database • TOXNET database (National Library of Medicine) • IRIS database (USEPA electronic database) • U.S. Fish and Wildlife Service (USFWS) Contaminant Review Series electronic database • Oak Ridge National Laboratory database (Sample et al., 1996)
For wildlife, only those studies in which relevant survival, growth, and reproduction were measured were reviewed. Selecting NOAELs and LOAELs based on the available reviewed literature were prioritized using the following guidelines:
• The preferred exposure duration was subchronic or chronic, or conducted during a critical life stage such as reproduction, gestation, or development. Acute studies were considered but not preferred.
• Only studies with mortality, growth, and/or reproductive effect endpoints were used for birds and mammals.

ECOLOGICAL TOXICITY REFERENCE VALUES LITERATURE REVIEW
B-4 MKE/110180002
• Doses received by food ingestion were preferred over administration of the dose using drinking water, gavage, oral intubation, or injection because the non-dietary exposure route cannot be directly related to environmental exposure to the bird or mammal. Drinking water studies may overestimate dietary risk because gastrointestinal absorption may be higher for constituents ingested by drinking water (Sample et al., 1996). In some cases, however, TRVs based on studies with doses administered by injection, oral intubation, gavage, or drinking water were selected because no other studies are available.
• Preferred TRVs were based on results that were evaluated statistically to identify significant differences from control values. Studies were not considered if negative control groups were not included.
• In general, laboratory studies were preferred to studies using field-collected prey because controlled test conditions provide greater certainty that the observed response can be related to the constituent dose. The presence of multiple constituents and other environmental factors may result in adverse effects that complicate the interpretation of field study results (USEPA, 2003).
For the site-specific dietary TRVs, a daily dose is expressed as mg/kg body weight per day (mg/kg bw/d). Most studies reported toxicity results as the constituent concentration in food associated with adverse effects, although some presented results as a daily dose. The daily exposure dose was derived from a food concentration using the animal’s body weight (kilograms) and ingestion rate (kilograms per day [kg/d]) as reported in the study or using values published elsewhere.
Avian TRVs PCB Aroclors Oral toxicity of PCB Aroclors to birds by food or capsule ingestion was evaluated in 21 studies (Ahmed et al., 1978; McLane and Hughes, 1980; Lowe and Stendell, 1991; Britton and Huston, 1973; Scott et al., 1975; Cecil et al., 1974; Peakall et al., 1972; Peakall and Peakall, 1973; Dahlgren et al., 1972; Tori and Peterle, 1983; Hill and Shaffner, 1976; Custer and Heinz, 1980; Platonow and Reinhart, 1973; Risebrough and Anderson, 1975; Fernie et al., 2000, 2001; Fisher et al., 2001; Bird et al., 1983; Haseltine and Prouty, 1980; Kreitzer and Heinz, 1974; Stickel et al., 1984).
In the studies reviewed, reproduction (measuring endpoints such as adult fertility, hatchability, eggshell thickness, egg production, eggshell weight, embryo development, courtship behavior, onset of nest initiation, clutch size, and embryo mortality and viability), avoidance behavior, adult growth, and mortality were observed in seven bird species exposed orally to PCB Aroclor mixtures. These endpoints were measured in the following bird species: American kestrels, chickens, turtle doves, mourning doves, pheasants, Japanese quail, mallard ducks, common gackles, red-winged blackbirds, brown-headed cowbirds, and starlings. Table B-2 summarizes the NOAELs and LOAELs derived from the dietary PCB studies reviewed. LOAELs ranged from 0.46 mg/kg bw/d for reproduction of American kestrels (Lowe and Stendell, 1991) to 34.4 mg/kg bw/d for avoidance behavior of Japanese quail (Kreitzer and Heinz, 1974). The lowest calculated LOAEL of all studies

ECOLOGICAL TOXICITY REFERENCE VALUES LITERATURE REVIEW
MKE/110180002 B-5
reviewed was based on eggshell weight and thickness in American kestrels fed 0.46 mg/kg bw/d Aroclor-1248 (Lowe and Stendell, 1991). However, Lowe and Stendell (1991) did not report the overall effect of eggshell thinning on reproductive success (for example, hatchability, offspring viability) or the critical degree at which eggshell thinning would affect reproductive success (eggshell thickness of the experimental group was 5 percent different from the control). The next lowest LOAELs were reported in Britton and Huston (1973), who reported reduced hatchability in chickens fed 0.58 mg/kg bw/d PCBs Aroclor-1242 following 6 weeks of dietary exposure.
NOAELs ranged from 0.061 mg/kg bw/d for reproduction (i.e., egg production, and hatchability) of chickens (Scott et al., 1975) to 3.9 mg/kg kg/d for reproduction (egg production and eggshell thinning) of mallards (Risebrough and Anderson, 1975). NOAELs below the lowest LOAEL of 0.50 mg/kg bw/d were reported in four studies based on reproduction and ranged from 0.061 to 0.41 mg/kg bw/d (Scott et al., 1975; Platonow and Reinhart, 1973; Britton and Huston, 1973; McLane and Hughes, 1980). At the highest NOEC of 0.41 mg/kg bw/d, no effects on eggshell thickness, egg production, hatching success, and fledging success were reported in screech owls exposed to dietary PCBs for two generations (McLane and Hughes, 1980).
Mammal Toxicity Reference Values PCB Aroclors Fourteen papers on the potential adverse effects of PCBs on mammals were reviewed (Aulerich and Ringer, 1977; Aulerich et al., 1985, 1986; Bleavins et al., 1980; Brunström et al., 2001; Harris et al., 1993; Heaton et al., 1995; Hornshaw et al., 1983; Jensen et al., 1977; Kihlstrom et al., 1992; Restum et al., 1998; Ringer, 1983; Tillitt et al., 1996; Wren et al., 1987). The potential mechanism of exposure included dietary ingestion of laboratory or exposed field-collected diets. The most comprehensive studies of PCB toxicity in a wildlife mammalian species have been conducted with mink, and only mink studies were reviewed for PCBs. Mink also appears to be one of the most sensitive mammalian species tested (Fuller and Hobson, 1986) and, therefore, is considered a good surrogate for assessing risk to other mammals. Four additional studies on the toxicity of PCBs to mink or ferret were reviewed; however, these studies were excluded from the TRV selection process because they did not meet the TRV literature selection criteria. Specifically, studies in which no toxic effects were measured (Bleavins et al., 1984; Henny et al., 1981) or in which no dietary dose was reported (O’Shea et al., 1981) were not included in the TRV selection process. Studies that reported endpoints that were not related to growth, mortality, reproduction, and behavior (that is, hematology and liver pathology) were not included in the TRV selection process (Heaton et al., 1995). In addition, Platonow and Karstad (1973) was excluded from the TRV selection process because no data were presented in the paper and no true controls were used.
Table B-3 presents all of the NOAELs and LOAELs calculated for PCBs from the literature reviewed. Adverse effects on maternal growth, kit growth, kit survival, gestation length, whelping success, and reproductive failure were measured in mink following exposure to PCBs. LOAELs ranged from 0.037 mg/kg bw/d for reproduction in mink (Restum et al.,

ECOLOGICAL TOXICITY REFERENCE VALUES LITERATURE REVIEW
B-6 MKE/110180002
1998) to 2,000 mg/kg bw/d for growth of mink (Harris et al., 1993). NOAELs ranged from 0.070 mg/kg bw/d for reproduction in mink (Hornshaw et al., 1983) to 480 mg/kg bw/d for growth of mink (Harris et al., 1993). The lowest LOAELs, ranging from 0.037 to 0.077 mg/kg bw/d PCBs, were reported in studies in which adverse reproductive effects (including reduced kit body weight, delay in the onset of estrus, and reduced whelping success) were observed in mink fed field-collected carp from the Great Lakes region over a chronic period (Restum et al., 1988; Hornshaw et al., 1983). In the studies, mink were fed a prepared diet containing various percentages of field-collected fish; thus, these studies only have quantitative relevance to mink exposed to constituent mixtures similar those found in the Great Lakes fish. In addition, there is uncertainty associated with these LOAELs because the field-collected fish contained other organic constituents (such as dioxins, DDE, dichlorodiphenyldichloroethane, chlordane) that likely could have contributed to the reproductive toxicity reported in mink. The next lowest LOAEL of 0.089 mg/kg bw/d was reported in Brunström et al. (2001) in which offspring growth was reduced in mink fed a Clophen A50 PCB mixture for 18 months.

Page 1 of 2
Lincoln Park TSCA Notification Risk Evaluation
Analyte
NOEC
(WB)
LOEC
(WB) CF
NOEC
(egg)
LOEC
(egg)
Units
(ww) Source Endpoint Test Species Lifestage
Exposure
Mode
Exposure
Duration Endpoint Effect Chemical Form Notes
PCBs (Aroclor 1254) 0.98 mg/kg Powell et al. 2003 growth, survival Chinook salmon
juvenile diet 4 wks Whole body burdens ranged from 0.74 to 0.98 over the 13 period following treatment; only no-effect level reported; no effect on growth, survival, or survival following immunological challenge
PCBs (Aroclor 1254) 1.53 mg/kg Berlin et al. 1981 mortality Brook trout fry water and diet
176 days fry mortality Field collected eggs from Lake Michigan with starting egg residues of 7.6 μg/g PCBs and 4.7 μg/g DDE; mortality is estimated
PCBs: Aroclor mixture (egg)a 7.2 4.69 1.53 mg/kg Fisher et al. 1994 reproduction (egg exposure)
Atlantic salmon
egg (converted to WB)
water 48 hours live fry body weight Growth was significantly reduced at day 176; no effect on reproduction was observed; adult concentration was estimated using egg:adult conversion factor of 4.69 based on rainbow trout data in Niimi (1983); see text for detail on use and derivation of conversion factors
PCBs: Aroclor 1254 (egg)a 7.7 4.69 1.64 mg/kg Hendricks et al. 1981 reproduction (egg exposure)
Rainbow trout egg (converted to WB)
maternal transfer
60 days fry growth Eggs were exposed via maternal transfer from gravid females fed 200 μg/g PCBs for 60 days; adult concentration was estimated using egg:adult conversion factor of 4.69 based on rainbow trout data in Niimi (1983); see text for detail on use and derivation of conversion factors
PCBs (Aroclor 1254) 8 mg/kg Lieb et al. 1974 growth, mortality Rainbow trout 14 weeks food 32 wks Only no-effect level reported
PCBs: Aroclor 1254 (egg) 8.7 2.71 3.2 mg/kg McCarthy et al. 2003 reproduction (egg exposure)
Atlantic croaker
egg maternal transfer to eggs
2 wks during reproduction (adults)
reduction in larval growth rate and impaired response to startle stimulus
Parental fish fed dietary PCBs-eggs exposed via maternal transfer; residues not clearly presented; adult concentration was estimated using egg:adult conversion factor of 2.71 based on average data reported in five species in Niimi (1983); see text for detail on use and derivation of conversion factors
PCBs (Aroclor 1254) 1.9 9.3 mg/kg Hansen et al. 1973 reproduction Sheepshead minnow
adult 28 days decreased fry survival
PCBs (Aroclor 1268) 15 mg/kg Matta et al. 2001 reproduction Mummichog adult food ~6 wks fertilization and hatching success, larval survival
Two generations of progeny observed; only no-effect level reported
PCBs (Aroclor 1254) 17 mg/kg Duke et al. 1970 mortality Pinfish juvenile water 48 hours Only no-effect level reportedPCBs: Aroclor mixture (egg)a 26.2 4.69 5.59 mg/kg Fisher et al. 1994 reproduction (egg
exposure)Atlantic salmon
egg (converted to WB)
water 48 hours retarded phototropism behavior in alevins
Predator avoidance affected significantly at 14.16 mg/kg ww; adult concentration was estimated using egg:adult conversion factor of 4.69 based on rainbow trout data in Niimi (1983); see text for detail on use and derivation of conversion factors
PCBs:Aroclor 1254 (egg)a 21 32 7.04 3 4.5 mg/kg Mac and Seelye 1981 reproduction (egg exposure)
Lake trout sac-fry (converted to WB)
water and diet
48 days fry mortality Field collected eggs from Saugatuck, Michigan with unknown organics; no effect on fry growth was observed; LOEC is residue at 48 days and NOEC is control residue at 48 days; only one group was treated with 50 ng/L (water) and 0.72 mg/kg (diet) Aroclor 1254; adult concentration was estimated using sac fry:adult conversion factor of 7.04 based on rainbow trout data in Niimi (1983); see text for detail on use and derivation of conversion factors; elevated control mortality (12.5%); PCB exposure was via both food and water simultaneously
PCBs (Aroclor 1260) 32 mg/kg Mayer et al. 1977 growth, mortality Channel catfish
fingerling food 193 days Only no-effect level reported
PCBs (Aroclor 1254) 27 46 mg/kg Hansen et al. 1971 mortality Spot water 20 days Mortality did not appear directly related to body burden; bb increased with exposure duration; NOEC (catfish)= 32
PCBs (Aroclor 1254) 60 mg/kg Powell et al. 2003 mortality Chinook salmon
juvenile oral gavage 96 hrs Only no-effect level reported
PCBs (Aroclor 1254) 31 71 mg/kg Mauck et al. 1978 growth Brook trout fry- exposure to eggs
water 10 d prior to hatch and 118 d after hatch
reduced growth Residue measured at 118 days; growth effect reported at 48 days but disappeared at 118 days.
PCBs (Aroclor 1016) 77 mg/kg Hansen et al. 1975 reproduction Sheepshead minnow
fry water 2 wks fertilization and hatching success, larval survival
Intermittent-flow toxicity test; no effect: fertilization success, survival of embryos to hatching, or survival of fry; only no-effect level reported
PCBs (Aroclor 1016) 106 mg/kg Hansen et al. 1974 mortality, behavior Pinfish water 33 days loss of equilibrium; erratic swimming
Significant reduction in survival (50% mortality relative to 6% in control)
PCBs (Aroclor 1254:1260 mixture) 120 mg/kg Mayer et al. 1985 mortality Rainbow trout young water 90 days Mortality observed; not significantly different; dose was 1:2 ratio of Aroclor 1254:1260; only no-effect level reported
PCBs (Aroclor 1254:1260 mixture) 70 120 mg/kg Mayer et al. 1985 growth Rainbow trout young water 90 days 1:2 ratio of Aroclor 1254:1260
PCBs (Aroclor 1254) 71 125 mg/kg Mauck et al. 1978 mortality Brook trout fry- exposure to eggs
water 10 d prior to hatch and 118 d after hatch
fry survival Reduced fry survival; 21 to 100% mortality; tissue residue measured at 118 days; Median hatching time and egg hatchability were not affected. Larval growth was initially reduced, but not by the end of the test
PCBs (Aroclor 1016) 77 200 mg/kg Hansen et al. 1975 mortality Sheepshead minnow
fry water fry survival
PCBs (Clophen A50) 250 mg/kg Hattula and Karlog 1972 mortality Goldfish water 5-21 days PCBs dissolved in acetone (0.5 mL/L)
LOEC is lethal body burden
��������Whole-Body Tissue Residue Fish TRV Studies

Page 2 of 2
Lincoln Park TSCA Notification Risk Evaluation
Analyte
NOEC
(WB)
LOEC
(WB) CF
NOEC
(egg)
LOEC
(egg)
Units
(ww) Source Endpoint Test Species Lifestage
Exposure
Mode
Exposure
Duration Endpoint Effect Chemical Form Notes
��������Whole-Body Tissue Residue Fish TRV Studies
PCBs:Aroclor 1254 (egg)a 365 4.69 77.9 mg/kg Freeman and Idler 1975 reproduction (egg exposure)
Brook trout egg water 21 days reduced hatchability Aroclor 1254 75% hatching at LOEC and 92% hatching in control; concentration in back muscle of dose fish with affected hatchability was 32.8 mg/kg ww; adult concentration was estimated using egg:adult conversion factor of 4.69 based on rainbow trout data in Niimi (1983); see text for detail on use and derivation of conversion factors
PCBs (Aroclor 1254) 458, 361 (female)
mg/kg Nebeker et al. 1974 reproduction Fathead minnow
water reduced spawning Terminal residue; egg hatchability and fry survival was not affected
PCBs (Aroclor 1254) 645 mg/kg Mayer et al. 1977 mortality Coho salmon fingerling ~260 days All fish died within 265 days of dose; no stats, no control
Calculated PCB 25th percentile 16 14Calculated PCB 50th percentile 31 89Highlighted TRVs are closest TRVs to 25th and 50th percentiles.NC -- TRVs not reported in database because study only injection dose was reported (no WB tissue residues were reported).
b Whole body tissue concentrations were converted to wet weight assuming 80% moisture in the organism.
a Concentrations in egg tissues or sac-fry tissues were converted into whole-body adult tissue concentrations using conversion factors reported in the literature; see text for additional detail on conversion factors.

Bird Dietary TRV Studies EvaluatedLincoln Park TSCA Notification Risk Evaluation
��� ���������������
�����������
������������ ������ �� �!� ��"��� ��!�" #$��!����%����& �"����'���
%(��������������� �
)������
*� +%(�
*�,����+
��� ��!�����!��
��� �)�!�$������
�)�*�,����+ -�'�!"����
��#������ ��
��#��� �
� ����#������ ��
��#��� �� �� �& �"����*����!� �,,������ �!� ����"
PCBs (Aroclor 1254) 0.054 Ahmed et al. 1978 mortality, growth, reproduction
White leghorn males Aroclor 1254 food 0.0034 W 2.56 40 20 weeks Fertility, hatchability, growth, mortality No control values given
PCBs (Aroclor 1248) 0.35 Lowe and Stendell 1991 reproduction American kestrel Aroclor 1248 food 0.0136 D 1 6 0.13 E 10% 3 3.3 5.5 months Eggshell weight and thickness Only one dose used
PCBs (Aroclor 1248) 0.49 McLane and Hughes 1980 reproduction Screech owl Aroclor 1248 food 0.0266 D 1 5 0.181 B 10% 3 3.3333 2 generations Eggshell thickness, egg production, hatching success, fledging success
Egg tissue concentrations also reported in study
PCBs (Aroclor 1242) 0.29 0.58 Britton and Huston 1973 reproduction White leghorn chickens Aroclor 1242 food 0.1000 W 3 1.71 C 5 10 6 weeks + 5 weeks untreated
Hatchability Significant effects on hatchability
PCBs (Aroclor 1242) 0.60 Hill et al. 1975a reproduction Japanese quail Aroclor 1242 food 0.0048 D 1 3 0.09 B 10% 10 11.11111 45 days Eggshell thinning Only one dose used
PCBs (Aroclor 1248) 0.061 0.61 Scott et al. 1975 reproduction White leghorn chickens Aroclor 1248 food 0.105 W 1.71 C 1 10 8 weeks Egg production and egg hatchability Egg residues also reported
PCBs (Aroclor 1232) 1.2 Cecil et al. 1974 reproduction White leghorn hens Aroclor 1232 food 0.0997 W 3 1.71 C 20 9 weeks + 7 weeks untreated then mated
Hatchability, embryo abnormality, embryo mortality
Only one dose used; no discussion of statistical significance
PCBs (Aroclor 1254) 1.4 Peakall et al. 1972; Peakall and Peakall 1973
reproduction Ringed turtle-dove Aroclor 1254 food 0.0202 D 1 1 0.155 D 9% 10 10.98901 2 generations Hatching success in second generation Egg tissue concentrations also reported in study
PCBs (Aroclor 1254) 1.6 Dahlgren et al. 1972 reproduction Ring-necked pheasant Aroclor 1254 gelatin capsule 1.135 B 1.785714 Once per week for 16 weeks
Egg hatchability Dose reported in mg/kg/wk- daily dose derived from weekly dose [(7 mg/ week)/7]
PCBs (Aroclor 1254) 1.6 Tori and Peterle 1983 behavior Mourning dove Aroclor 1254 food 0.0168 D 1 1 0.119 B 10% 10 11.1 42 days (+30 days untreated following 2 wks post exposure)
Reduced courtship behavior, fewer successful pair bonds formed (both statistically significant); also delay onset of nest initiation
Unbounded LOAEL
PCBs (Aroclor 1254) 2.5 Custer and Heinz 1980 reproduction Mallard Aroclor 1254 food 0.1082 W 2 1.082 B 25 ~ 1 month Reproductive success
PCBs (Aroclor 1254) 0.29 2.9 Platonow and Reinhart 1973 reproduction White leghorn chickens Aroclor 1254 food 0.0997 W 3 1.71 C 5 50 50.0 39 wks (14 wks for 50 ppm group)
Hatchability Statistically significant effect observed; LOAEL is residues where instantaneous depression of hatchability and embryotoxicity is observed; NOAEL is where hatchability of fertile eggs is unaffected; however, at NOAEL fertility and egg production are significantly reduced (study attributes it to mating inactivity and not PCB exposure)- uncertain NOAEL
PCBs (Aroclor 1254) 3.9 Risebrough and Anderson 1975 reproduction Mallard Aroclor 1254 food 0.1082 W 2 1.082 B 39 4 months Egg production, eggshell thinning
PCBs (Aroclor 1248: 1254:1260 mixture) 7 Fernie et al. 2000, 2001 reproduction American kestrel 1:1:1 ratio of Aroclor 1248:1254:1260
food 100 days until eggs hatched
Egg laying in second generation (exposed in ovo ); also some effect on clutch size and fledgling success
Body weight normalized dose estimated in study; no stats- egg laying endpoint: 91% in controls laid a clutch of eggs; 75% in test group
PCBs (Aroclor 1248: 1254:1260 mixture) 7 Fisher et al. 2001 reproduction American kestrel 1:1:1 ratio of Aroclor 1248:1254:1260
food 1 mo prior to mating through mating period
Courtship behavior Body weight normalized dose estimated in study; no adverse effect on male sexual behavior and no change in female sexual behavior or frequency of copulation; study performed along with Fernie et al. 2000; 2001
PCBs (Aroclor 1254) 9.5 Bird et al. 1983 reproduction American kestrel Aroclor 1254 food 33 62-69 days Decreased sperm count and sperm concentration
Endpoint is not a direct measure of reproductive success; assumed 80% moisture from day old dead chicks in diet
PCBs (Aroclor 1254) 12.0 Kreitzer and Heinz 1974 behavior Japanese quail Aroclor 1254 food 0.0048 D 1 3 0.09 B 10% 200 222.2 8 days treated + 6 days untreated
Avoidance response (depressed response to stimuli)
Statistically significant effect; only one dose used
PCBs (Aroclor 1242) 15 Haseltine and Prouty 1980 reproduction Mallard Aroclor 1242 food 0.1082 W 2 1.082 B 150 12 weeks Hatchability, embryo mortality, egg viability, embryo abnormalities
Egg tissue concentrations also reported in study
PCBs (Aroclor 1254) NC NC Stickel et al. 1984 mortality Common gackles, red-winged blackbirds, brown-headed cowbird, starling
Aroclor 1254 food 1500 birds fed until 50% of birds died
Study not useful- presents LT50 in four bird species at an extremely high dietary PCB concentration
Calculated PCB 25th percentile 0.18 0.75
Calculated PCB 50th percentile 0.29 1.6
For 2,3,7,8-TCDD, the highlighted TRVs are considered the most suitable TRVs of the available values. For PCBs, the highlighted TRVs are the closest TRVs to 25th and 50th percentiles.
NC = TRV not calculated in database because more preferable studies were available for TRV selection (see notes) Default ingestion rates: Nagy bird group allometric equation Default body weight:
FI = food ingestion rate 1 - Nagy 2001 1- all birds: FI (kg/d dw) = [0.638*((bw(g))^0.685)]/1000 A - NRC 1994
NEC = No effect concentration in exposure medium 2 - Heinz et al. 1987 2- Passerines: FI = [0.630*((bw(g))^0.683)]/1000 B - Dunning 1993
LEC = Low effect concentration in exposure medium 3 - NRC 1984 3- Galliformes: FI = [0.088*((bw(g))^0.891)]/1000 C - NRC 1984
W = wet weight basis 4 - NRC 1994 4- Omnivorous birds: FI = [0.670*((bw(g))^0.627)]/1000 D - Sample et al. 1996
D = dry weight basis 5 - EPA 1993 5- Carnivorous birds: FI = [0.849*((bw(g))^0.663)]/1000 E - EPA 1993
6- Eurasian Kestrel: FI =(22.1/211)*bw(kg) F - Pattee 1984
��������.

Page 1 of 2
Lincoln Park TSCA Notification Risk Evaluation
��� ���������������
������������������
����� ������ �� �!���"��
� ��!�"�& �"����'���
%(��������������� �
)������*� + %(�*�,����+
��� �)�!�$������
�)�*�,����+ -�'�!"����
��#������ ��
��#��� �� ��
��#������ ��
��#��� �� �� #$��!����%���
�& �"����*����!� �,,������ �!� ����"
PCBs (total PCBs) 0.037 Restum et al. 1998 Reproduction Mink food 0.20 1.34 B 0.25 multi-generational Kit body weight, onset of estrus (as indicated by vulvular swelling), decrease in females whelping
Uncertainty—other organics in field collected fish- dioxins, DDE, DDD, chlordane (effects may not be just result of PCB exposure); LOAEL calculated assuming 200 g fd/ day; most sensitive reproductive endpoints
PCBs (Aroclor 1254) 0.074 Hornshaw et al. 1983 Reproduction Mink food 1.34 B 290 days Kit survival to 4 wks (0%) Uncertainty—unknown organics in field collected fish; LOAEL effect was observed in mink fed field collected perch and white sucker (~0.66 ppm) from Lake Heron and Lake Erie assuming 150 g fd/ day
PCBs (Aroclor 1254) 0.070 0.077 Hornshaw et al. 1983 Reproduction Mink food 1.34 B 250 days Kit body weight Uncertainty—unknown organics in field collected fish; LOAEL- effect was observed in mink fed field collected perch scrap (~0.66 ppm) from Lake Erie assuming 150 g fd/ day. NOAEL- no sign. effect on kit body weight for mink fed other field collected fish (concentrations in sucker were highest- used to calculate NOAEL)
PCBs (Clophen A50) 0.089 Brunström et al. 2001 reproduction Mink food 1.12 0.1 Clophen A50 18 months Kit growth Clophen A50 mixture
PCBs (Aroclor 1254) 0.13 Wren et al. 1987b Reproduction Mink food 0.18 W 1 1.34 B 1 6 months Reduced kit growth rate
PCBs (total PCBs) 0.13 Heaton et al. 1995a; Tillitt et al. 1996
Reproduction Mink food 182 days (including reproduction)
Kit body weight at 3 and 6 weeks, gestation length, kit survival
Uncertainty—TEQs also detected (3.6 mg/kg bw/d at LOAEL) and unknown other contaminants in field collected fish; most sensitive reproductive endpoints
PCBs (Aroclor 1254) 0.077 0.17 Hornshaw et al. 1983 Reproduction Mink food 1.34 B 250 days Kit survival at birth (0%) Uncertainty—unknown contaminants in field collected fish; LOAEL- effect was observed in mink fed field collected carp (~1.5 ppm) from Saginaw Bay (Lake Heron) assuming 150 g fd/ day; NOAEL- no sign. effect on kit survival was observed in mink fed other field collected fish- whitefish, perch, alewife, sucker (concentrations in perch were highest- used to calculate NOAEL)
PCBs (Aroclor 1254) 0.22 Ringer 1983 reproduction Mink food 0.15 W 1.34 B 1 2 4 and 9 months prior to giving birth
# offspring/ female, decrease in pup body weight
No stats; at LOAEL: # offspring/ female = 0.3; at NOAEL: # offspring/ female = 4.3; at control: # offspring/ female = 4.1 - 6.0
PCBs (Aroclor 1254) 0.13 0.26 Aulerich and Ringer 1977 Reproduction Mink food 0.18 W 1 1.34 B 1 2 4 months Number of kits born alive (0% at 4 wks)
PCBs (Clophen A50) 0.27 Brunström et al. 2001 Growth Mink food 1.12 0.3 Clophen A50 18 months Maternal bw Clophen A50 mixture
PCBs (total PCBs) 0.26 0.32 Heaton et al. 1995a Growth Mink food 182 days (including reproduction)
Maternal body weight Uncertainty—TEQs also detected (6.8 and 10.7 mg/kg bw/d at NOAEL and LOAEL) and unknown other contaminants in field collected fish; most sensitive reproductive endpoints
PCBs (Aroclor 1254) 0.39 Aulerich et al. 1985 Reproduction Mink food 0.13 W 1 0.87 B 2.5 88-102 days Number of kits whelped and born alive (0%)
PCB (mixture composition not reported) 0.51 Jensen et al. 1977 Reproduction Mink food 0.13 W 1 0.87 B 3.3 66 days Number of kits born alive PCB composition not known
PCBs (Aroclor 1242) 0.65 Bleavins et al. 1980 Reproduction Mink food 0.18 W 1 1.34 B 5 8 months Reproductive failure
PCBs (Aroclor 1254) 1.31 Hornshaw et al. 1986 Weight gain in adults Mink food 0.18 W 1 1.34 B 10 4 weeks Weight gain in adults
PCBs (Aroclor 1254) 1.64 Kihlstrom et al. 1992 Reproduction Mink food 3 months All whelps stillborn
PCBs (Aroclor 1254) 1.2 1.8 Aulerich et al. 1986 growth Mink food 28 days Female growth Mink fed rabbit prey exposed to PCBs; LOAEL and NOAEL are average between male and female mg/kg bw/d dose. Mortality was also recorded for a 28 day exposure but insufficient data to calculate an LOAEL.
PCBs (Clophen A50) 2.0 Kihlstrom et al. 1992 Reproduction Mink food 3 months All whelps stillborn
PCBs (Aroclor 1254) 1.5 2.4 Aulerich et al. 1986 growth Mink food 28 days Male and female growth Mink fed mink cereal diet. A mortality test was also run and recorded for a 28 day exposure but insufficient data to calculate an LOAEL.
PCBs (Aroclor 1016) 2.6 Bleavins et al. 1980 Reproduction/Mortality Mink food 0.18 W 1 1.34 B 20 8 months Birth weight and growth rate of kits, and 25 % adult female mortality
��������/Mammal Dietary PCB TRV Studies Evaluated

Page 2 of 2
Lincoln Park TSCA Notification Risk Evaluation
��� ���������������
������������������
����� ������ �� �!���"��
� ��!�"�& �"����'���
%(��������������� �
)������*� + %(�*�,����+
��� �)�!�$������
�)�*�,����+ -�'�!"����
��#������ ��
��#��� �� ��
��#������ ��
��#��� �� �� #$��!����%���
�& �"����*����!� �,,������ �!� ����"
��������/Mammal Dietary PCB TRV Studies Evaluated
PCBs (Aroclor 1232) 480 2000 Harris et al. 1993 growth Mink injection (ip) single injection + 14 days (untreated)
Body weight gain Single injection (5 dose levels)
Calculated PCB 25th percentile 0.12 0.13
Calculated PCB 50th percentile 0.26 0.35
For 2,3,7,8-TCDD, the highlighted LOAELs are considered the most suitable TRVs, based on the NOAEL presented in Table 6. For PCBs, the highlighted TRVs are the closest TRVs to 25th and 50th percentiles.
NC = TRV not calculated in database because more preferable studies were available for TRV selection Default ingestion rates: Default body weight:
NEC = No effect concentration in vehicle 1 - Bleavins and Aulerich 1981 A - EPA 1993
LEC = Low effect concentration in vehicle B - Bleavins and Aulerich 1981W = wet weight basis
D = dry weight basis
FI = food ingestion rate
DWI = drinking water ingestion rate

Appendix I Temporary Earthen and Sheetpile Cut-Off
Modeling
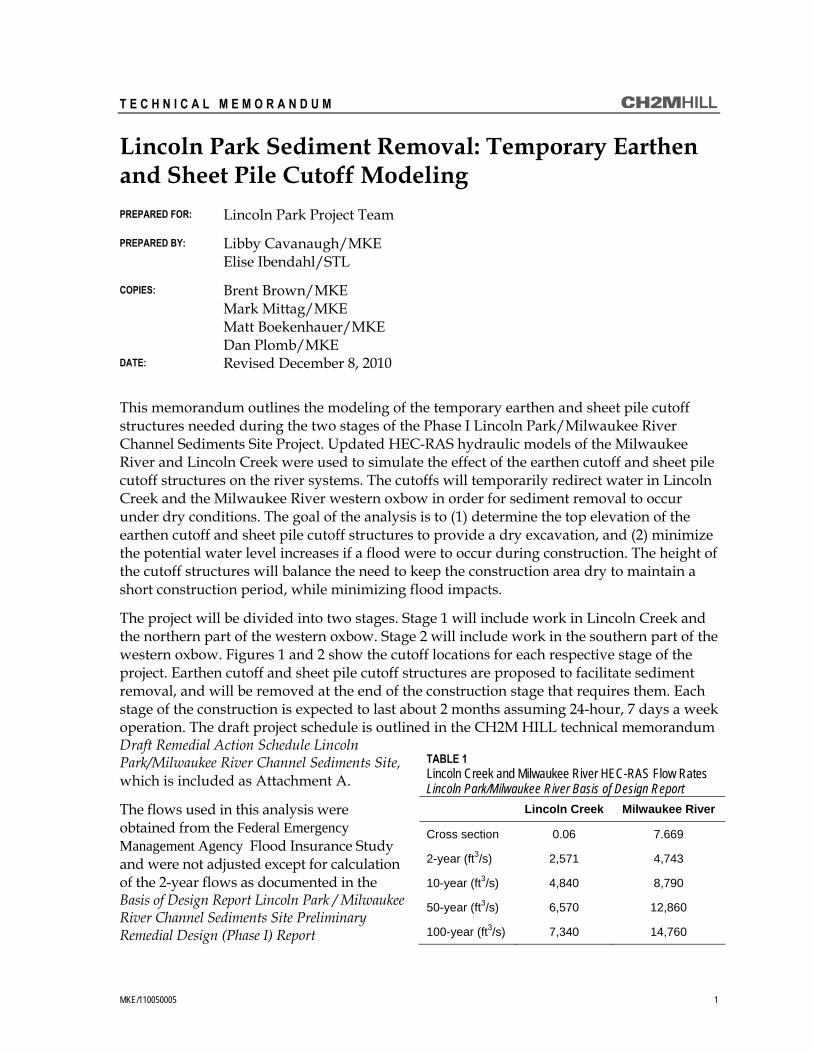
MKE/110050005 1
T E C H N I C A L M E M O R A N D U M
Lincoln Park Sediment Removal: Temporary Earthen and Sheet Pile Cutoff Modeling PREPARED FOR: Lincoln Park Project Team
PREPARED BY: Libby Cavanaugh/MKE Elise Ibendahl/STL
COPIES: Brent Brown/MKE Mark Mittag/MKE Matt Boekenhauer/MKE Dan Plomb/MKE
DATE: Revised December 8, 2010
This memorandum outlines the modeling of the temporary earthen and sheet pile cutoff structures needed during the two stages of the Phase I Lincoln Park/Milwaukee River Channel Sediments Site Project. Updated HEC-RAS hydraulic models of the Milwaukee River and Lincoln Creek were used to simulate the effect of the earthen cutoff and sheet pile cutoff structures on the river systems. The cutoffs will temporarily redirect water in Lincoln Creek and the Milwaukee River western oxbow in order for sediment removal to occur under dry conditions. The goal of the analysis is to (1) determine the top elevation of the earthen cutoff and sheet pile cutoff structures to provide a dry excavation, and (2) minimize the potential water level increases if a flood were to occur during construction. The height of the cutoff structures will balance the need to keep the construction area dry to maintain a short construction period, while minimizing flood impacts.
The project will be divided into two stages. Stage 1 will include work in Lincoln Creek and the northern part of the western oxbow. Stage 2 will include work in the southern part of the western oxbow. Figures 1 and 2 show the cutoff locations for each respective stage of the project. Earthen cutoff and sheet pile cutoff structures are proposed to facilitate sediment removal, and will be removed at the end of the construction stage that requires them. Each stage of the construction is expected to last about 2 months assuming 24-hour, 7 days a week operation. The draft project schedule is outlined in the CH2M HILL technical memorandum Draft Remedial Action Schedule Lincoln Park/Milwaukee River Channel Sediments Site, which is included as Attachment A.
The flows used in this analysis were obtained from the Federal Emergency Management Agency Flood Insurance Study and were not adjusted except for calculation of the 2-year flows as documented in the Basis of Design Report Lincoln Park / Milwaukee River Channel Sediments Site Preliminary Remedial Design (Phase I) Report
TABLE 1 Lincoln Creek and Milwaukee River HEC-RAS Flow Rates Lincoln Park/Milwaukee River Basis of Design Report
Lincoln Creek Milwaukee River
Cross section 0.06 7.669
2-year (ft3/s) 2,571 4,743
10-year (ft3/s) 4,840 8,790
50-year (ft3/s) 6,570 12,860
100-year (ft3/s) 7,340 14,760

LINCOLN PARK SEDIMENT REMOVAL: TEMPORARY EARTHEN AND SHEET PILE CUTOFF MODELING
2 MKE/110050005
(CH2M HILL, 2010). Table 1 includes the flow rates at the mouth of Lincoln Creek and downstream of the western oxbow of the Milwaukee River. These flows were used to compare water levels in Lincoln Creek and the western oxbow with and without the temporary earthen and sheet pile cutoffs in place.
Average flow rates for Lincoln Creek and the Milwaukee River were reviewed to compare how monthly average flow rates vary throughout the year. Flow rates were obtained from historical data at nearby USGS gage sites. The Lincoln Creek USGS gage is located upstream of the project area at Sherman Boulevard. The Milwaukee River gage is located downstream of the project site, within Estabrook Park. The months of July through February historically experience the lowest monthly average flows, while the months of March through June historically experience the highest monthly average flows; however, flood flows could occur during any month. The monthly average flows for the Milwaukee River gage range from 216 to 1,050 ft3/s. The monthly average flows for the Lincoln Creek gage range from 6 to 24 ft3/s. These historical average monthly flows are not analyzed in the models because the flow rates are so much lower than the flood flows in Table 1. They are provided in Attachment B instead as background information on how flows change seasonally.
The HEC-RAS models received from the Wisconsin Department of Natural Resources were updated with 2010 June and October survey data, and are now referred to as the pre-project models. Details of the 2010 model updates can be found in the memo entitled Lincoln Park Sediment Remediation Pre-Project Lincoln Creek and Milwaukee River HEC-RAS Models. The pre-project models are used as the baseline condition for comparing model results with the earthen cutoff and sheet pile cutoff structures in place.
Stage 1 Earthen Cutoff and Sheet Pile Cutoff Structures Stage 1 of the project is expected to last about 2 months assuming 24-hour, 7 days a week operation. During that time, earthen cutoff structures will be constructed at the Green Bay Avenue Bridge on Lincoln Creek (1A) and across Lincoln Creek at the confluence with the western oxbow (1C). Sheet pile cutoff structures will be constructed across the western oxbow of the Milwaukee River upstream of the Northern Milwaukee River Parkway Bridge (1B), and on the western oxbow of the Milwaukee River at the confluence with Lincoln Creek (1D). All four structures will be constructed at the same time and will remain in place for Stage 1. Figure 1 shows the approximate locations of the Stage 1 earthen cutoff and sheet pile cutoff structures. Low flow on Lincoln Creek from upstream of the Green Bay Avenue Bridge will be either pumped or conveyed by gravity pipeline directly to the Milwaukee River. Details of the bypass capacity are outlined in the Basis of Design Report Lincoln Park / Milwaukee River Channel Sediments Site Preliminary Remedial Design (Stage I) Report (CH2M HILL, 2010). The bypass capacity will be at or close to the low flow in Lincoln Creek and therefore the bypass capacity is conservatively not removed from the flows simulated in this modeling analysis.
Earthen Cutoff Structures on Lincoln Creek at Green Bay Avenue and Confluence of Milwaukee River During Stage 1 of the project, one earthen cutoff will be constructed at the Green Bay Avenue Bridge and one at the confluence with the western oxbow of the Milwaukee River. Both of the earthen cutoff structures will be constructed of earthen or other material that is conducive to being washed out if a flood overtops the cutoff.

1A at Green Bay Avenue Bridge
1B across western oxbowof Milwaukee River at Northern Milwaukee
River Parkway Bridge
1C across Lincoln Creekat downstream end of Creek
1D across western oxbowof Milwaukee River upstream of confluence
with Lincoln Creek
MilwaukeeMadison
Lincoln Park SiteGlendale, WI.
I o w a
W i s c o n s i n
M i n n e s o t a
I l l i n o i s
M i c h i g a n
I n d i a n a
0 250 500
Feet
\\LAKEFRONT\PROJ\EPA\382079_RAC2_LINCOLNPARK_WP\MAPFILES\2010\DAMS_PHASE1AND2\FIGURE 01 - PHASE 1 TEMPORARY DAM.MXD JHANSEN1 11/18/2010 11:21:04
Note:
1. 2008 Aerial obtained from the National Agriculture Imagery Program (NAIP)
Figure 1Stage 1 Temporary Cut-offLincoln Park/Milwaukee River SiteGlendale, WI
Legend
Temporary Earthen Cut-off
Temporary Sheet Pile Cut-off

LINCOLN PARK SEDIMENT REMOVAL: TEMPORARY EARTHEN AND SHEET PILE CUTOFF MODELING
MKE/110050005 5
To simulate the effect of these earthen cutoff structures, the Lincoln Creek HEC-RAS model was first updated to include the earthen cutoff upstream of Green Bay Avenue (1A), and then was updated with the earthen cutoff at the confluence with the western oxbow (1C). The earthen cutoff structures were modeled as blocked obstructions on the corresponding cross sections in the HEC-RAS model. The earthen cutoff 1A corresponds to river station 0.50 in the HEC-RAS model. This station is about 390 feet upstream of the Green Bay Avenue Bridge. A duplicate cross section of 0.50 was added to the model as Station 0.499 to simulate the cutoff obstruction. The earthen cutoff 1C corresponds to river station 0.0 in the HEC-RAS model. A duplicate cross section of 0.0 was added to the model as Station 0.01 to simulate the cutoff obstruction.
To determine the elevation of the top of the earthen cutoff to simulate in the model, the water surface elevations from the pre-project HEC-RAS model of Lincoln Creek were reviewed. Table 2 lists the water surface elevations at river cross sections upstream and downstream of the Green Bay Avenue Bridge during existing conditions. A top of cutoff elevation between the 2- and 10-year water surface would be expected to provide sufficient flexibility to the dredging contractor to keep the work area dry under low flow conditions.
TABLE 2 Pre-project Model Water Surface Elevations for 2-and 10-Year Storms: Lincoln Creek Lincoln Park/Milwaukee River Basis of Design Report
River Station
Minimum Channel Elevation (ft)
Water Surface Elevation 2-year (ft)
Water Surface Elevation 10-year (ft)
0.54 612.9 619.05 621.49
0.5 612.5 618.89 621.37
0.47 612 618.74 621.25
0.44 612.1 618.52 620.90
0.43 610.6 618.54 620.92
0.42 Green Bay Avenue Bridge
0.41 611.28 618.43 620.74
0.4 610.12 618.45 620.78
0.32 608.55 618.05 620.20
0.25 609.23 617.72 619.76
0.198 611.49 617.48 619.51
0.189 611.22 617.33 619.31
0.187 Antenna Bridge
0.185 611.60 617.32 619.31
0.175 611.52 617.25 619.22
0.121 611.43 616.92 618.86
0.103 611.35 616.81 618.71
0.06 610.61 616.52 618.40
0 610.87 616.06 617.93

LINCOLN PARK SEDIMENT REMOVAL: TEMPORARY EARTHEN AND SHEET PILE CUTOFF MODELING
6 MKE/110050005
The Lincoln Creek HEC-RAS model simulated the earthen cutoff structures and the results were compared to the Lincoln Creek HEC-RAS pre-project model.
For large events, such as the 100-year storm, the earthen cutoffs will be expected to wash out, so there is no anticipated difference in flooding depths for this storm. A second analysis evaluated the impact of the earthen cutoff staying in place for the 10-year storm. The 10-year storm was selected because there is a small chance it will occur during the construction project. The Lincoln Creek HEC-RAS water surface elevation results for the existing conditions 100-year storm (elevations that form the regulatory floodplain) were compared to the 10-year water surface elevation with the earthen cutoffs in place. This was done to identify any locations where the 10-year storm with the earthen cutoffs in place might cause a water level higher than the regulatory floodplain. Table 3 lists the maximum increase in the water surface elevations for different combinations of earthen cutoff elevations, and Table C-1 in the attached Attachment C lists all of the simulation results.
There is no location on private property where the 10-year water surface elevation with the earthen cutoffs in place is above the regulatory floodplain. On Lincoln Park property directly upstream of the confluence to the Milwaukee River western oxbow, the modeling estimates there is up to a 1.02 foot increase. However, when the earthen cutoff is overtopped and washes away there will be no increase in water level making the model results a conservative estimate. After the dredging project is completed, flood elevations are expected to initially be lower and may eventually return to pre-project conditions as sediment accumulates in the channel.
A maximum elevation of 619.0 feet is recommended for the top of the earthen cutoff elevation upstream of Green Bay Avenue on Lincoln Creek, and a maximum elevation of 617.0 feet is recommended for the top elevation of the earthen cutoff at the confluence of the western oxbow of the Milwaukee River. These top of cutoff maximum elevations were selected because all private property would have water levels below the regulatory floodplain during a 10-year storm under the conservative assumption that the cutoff was not washed out. These elevations also provide the dredging contractor operational flexibility to keep the work area dry during low flow conditions. All earthen cutoff scenarios evaluated would be expected to wash out during a 10-year storm. In addition, the top of cutoff elevation at the confluence of the western oxbow is consistent with the historical permanent pool elevation created by Estabrook Dam in the Milwaukee River downstream of the western oxbow, which historically ranged from 617.0 to 617.4 feet (Lincoln Creek Flood Control—Phase II Design, CDM, March 6, 2002).
Sheet Pile Cutoff on Western Oxbow of Milwaukee River During Stage 1 of the project, two sheet pile cutoffs will be constructed along the western oxbow of the Milwaukee River. The first will be located just upstream of the confluence with Lincoln Creek (1D) and the second will be located upstream (at least 50 feet) of the northern Milwaukee River Parkway Bridge (1B). These sheet pile cutoffs are necessary to keep the Milwaukee River flow out of the Stage 1 Milwaukee River western oxbow construction area.

LINCOLN PARK SEDIMENT REMOVAL: TEMPORARY EARTHEN AND SHEET PILE CUTOFF MODELING
MKE/110050005 7
TABLE 3 Comparison of 10-Year Storm Water Surface Elevation on Lincoln Creek with Earthen Cutoff Compared to 100-Year Storm Water Surface Elevation without Earthen Cutoff (Regulatory Floodplain) Lincoln Park/Milwaukee River Basis of Design Report
Elevation of Earthen Cutoff Upstream of Green Bay Avenue
Bridge (ft) Lincoln Creek Design
Storm Equivalent
Elevation of Earthen Cutoff at Confluence with Western Oxbow
of Milwaukee River (ft) Lincoln Creek Design
Storm Equivalent
Maximum Increase in Water Surface Elevation in Project Area (within
Lincoln Park Property) (ft)
Maximum Increase in Water Surface Elevation in Project Area (outside
Lincoln Park Property) (ft)
Maximum Increase in Water Surface
Elevation Upstream of Project Areaa (ft)
619 Below 10-year water surface elevation
616 Below 2-year water surface elevation
0.7 0.0 0.0
618 Below 2-year water surface elevation
617 Below 10-year water surface elevation
1.02 0.0 0.0
617 Below 2-year water surface elevation
616 Below 2-year water surface elevation
0.7 0.0 0.0
616 Below 2-year water surface elevation
615.5 Below 2-year water surface elevation
0.54 0.0 0.0
616 Below 2-year water surface elevation
615 Below 2-year water surface elevation
0.52 0.0 0.0
619 Below 10-year water surface elevation
617 Below 10-year water surface elevation
1.02 0.0 0.0
a Outside of Project Area includes model upstream of the Green Bay Avenue Bridge
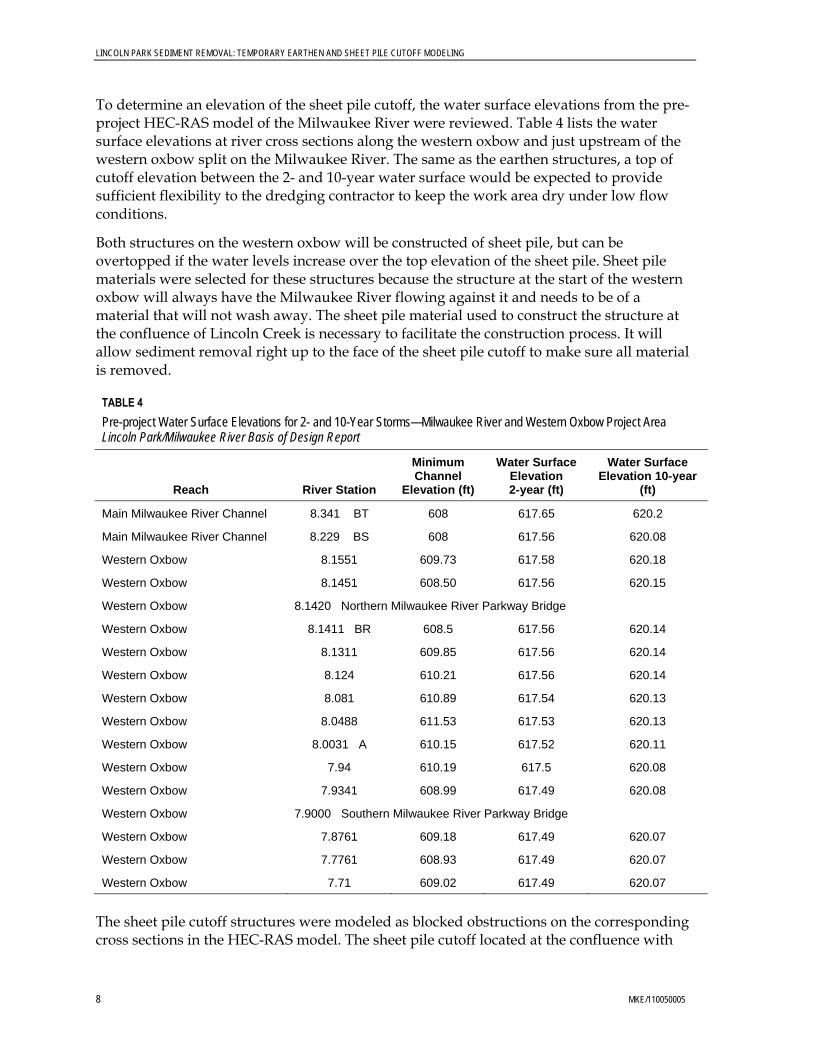
LINCOLN PARK SEDIMENT REMOVAL: TEMPORARY EARTHEN AND SHEET PILE CUTOFF MODELING
8 MKE/110050005
To determine an elevation of the sheet pile cutoff, the water surface elevations from the pre-project HEC-RAS model of the Milwaukee River were reviewed. Table 4 lists the water surface elevations at river cross sections along the western oxbow and just upstream of the western oxbow split on the Milwaukee River. The same as the earthen structures, a top of cutoff elevation between the 2- and 10-year water surface would be expected to provide sufficient flexibility to the dredging contractor to keep the work area dry under low flow conditions.
Both structures on the western oxbow will be constructed of sheet pile, but can be overtopped if the water levels increase over the top elevation of the sheet pile. Sheet pile materials were selected for these structures because the structure at the start of the western oxbow will always have the Milwaukee River flowing against it and needs to be of a material that will not wash away. The sheet pile material used to construct the structure at the confluence of Lincoln Creek is necessary to facilitate the construction process. It will allow sediment removal right up to the face of the sheet pile cutoff to make sure all material is removed.
TABLE 4 Pre-project Water Surface Elevations for 2- and 10-Year Storms—Milwaukee River and Western Oxbow Project Area Lincoln Park/Milwaukee River Basis of Design Report
Reach River Station
Minimum Channel
Elevation (ft)
Water Surface Elevation 2-year (ft)
Water Surface Elevation 10-year
(ft)
Main Milwaukee River Channel 8.341 BT 608 617.65 620.2
Main Milwaukee River Channel 8.229 BS 608 617.56 620.08
Western Oxbow 8.1551 609.73 617.58 620.18
Western Oxbow 8.1451 608.50 617.56 620.15
Western Oxbow 8.1420 Northern Milwaukee River Parkway Bridge
Western Oxbow 8.1411 BR 608.5 617.56 620.14
Western Oxbow 8.1311 609.85 617.56 620.14
Western Oxbow 8.124 610.21 617.56 620.14
Western Oxbow 8.081 610.89 617.54 620.13
Western Oxbow 8.0488 611.53 617.53 620.13
Western Oxbow 8.0031 A 610.15 617.52 620.11
Western Oxbow 7.94 610.19 617.5 620.08
Western Oxbow 7.9341 608.99 617.49 620.08
Western Oxbow 7.9000 Southern Milwaukee River Parkway Bridge
Western Oxbow 7.8761 609.18 617.49 620.07
Western Oxbow 7.7761 608.93 617.49 620.07
Western Oxbow 7.71 609.02 617.49 620.07
The sheet pile cutoff structures were modeled as blocked obstructions on the corresponding cross sections in the HEC-RAS model. The sheet pile cutoff located at the confluence with

LINCOLN PARK SEDIMENT REMOVAL: TEMPORARY EARTHEN AND SHEET PILE CUTOFF MODELING
MKE/110050005 9
Lincoln Creek corresponds to river station 8.0031 in the HEC-RAS model. A duplicate cross section of 8.0031 was added to the model and called 8.0032. The sheet pile cutoff located upstream of the northern Milwaukee River Parkway bridge corresponds to river station 8.1551. A duplicate cross section of 8.1551 was added to the model and called 8.1552. This station was updated with the obstruction, so that the cross sections necessary to model the bridge were not affected by the sheet pile cutoff obstruction.
The sheet pile cutoffs will not wash out during storms, but can be overtopped if the water reaches an elevation higher than the top of the sheet pile. Therefore, the effect the sheet pile cutoffs have on the 100-year floodplain was evaluated. Table 5 lists the different elevations of sheet pile that were simulated in the HEC-RAS model and the maximum increases in the water surface elevation during the 100-year event. A complete set of simulation results can be found in Table C-2 in Attachment C. The project area includes the western oxbow of the Milwaukee River. Both sheet pile cutoffs were simulated together in the model and both set to the same height during model trial simulations.
TABLE 5 100-year Storm Water Surface Elevation Increases with Sheet Pile Cutoffs in Milwaukee River Western Oxbow—Stage 1 Lincoln Park/Milwaukee River Basis of Design Report
Elevation of Sheet Pile (ft)
Milwaukee River Design Storm Equivalent
Maximum Increase in Water Surface Elevation (ft)
In Project Area (western oxbow) Outside Project Area
620 Below 10-year water surface elevation 0.01 0.01
619 0.01 0.01
618 Above 2-year water surface elevation 0.01 0.01
617 Below 2-year water surface elevation 0.01 0.01
A maximum elevation of 620.0 feet is recommended for the top of both of the sheet pile cutoffs because all scenarios cause the same change in water level and elevation 620.0 feet provides the greatest flexibility for the dredging contractor to keep the work area dry. During the short 2-month construction window (with 24/7 operation), the sheet pile cutoffs will have only a minor affect (0.01 foot within the project area and 0.01 foot outside of the project area) under the small chance (less than 1 percent) that a 100-year storm occurs during this time. At the end of the construction, the sheet pile cutoffs will be removed.
Stage 2 Sheet Pile Cutoffs Stage 2 of the project is expected to last about 2 months assuming 24-hour, 7 days a week operation. During that time, the sheet pile cutoff located just upstream the confluence with Lincoln Creek will be realigned and extended to direct Lincoln Creek flows through the northern part of the western oxbow (cutoff 2A) and a second sheet pile cutoff will be constructed at the confluence of the western oxbow and the main channel of the Milwaukee River (cutoff 2B). The other three structures, the earthen cutoff located at Green Bay Avenue along Lincoln Creek, the earthen cutoff located along Lincoln Creek at the confluence with the western oxbow of the Milwaukee River, and the sheet pile cutoff located at the northern Milwaukee River Parkway Bridge will be removed. Figure 2 shows the locations of the Stage 2 sheet pile cutoffs.

LINCOLN PARK SEDIMENT REMOVAL: TEMPORARY EARTHEN AND SHEET PILE CUTOFF MODELING
10 MKE/110050005
Both structures are expected to be constructed of sheet pile material that can be overtopped if the water levels increase over the top elevation of the sheet pile. Sheet pile materials were selected for these structures because the structure at the downstream end of the western oxbow will always have the Milwaukee River flowing against it and needs to be of a material that will not wash away. The sheet pile material used to construct the structure at the confluence of Lincoln Creek is necessary to facilitate the construction process. It will allow sediment removal right up to the face of the sheet pile to make sure all material is removed.
Sheet Pile Cutoff Effect on Western Oxbow of Milwaukee River The Stage 2 sheet pile cutoffs were modeled as blocked obstructions on the corresponding cross sections in the Milwaukee River HEC-RAS model. The sheet pile cutoff located at the confluence with Lincoln Creek corresponds to river station 8.0031 in the HEC-RAS model. A duplicate cross section of 8.0031 was added to the model and called 8.0032. The sheet pile cutoff located along the western oxbow at the confluence with the main channel of the Milwaukee River corresponds to river station 7.71 in the HEC-RAS pre-project model. A duplicate cross section of 7.71 was added to the model and called 7.711. The sheet pile cutoff will be located further downstream, but to avoid model instabilities associated with modeling the structure too close the confluence of the western oxbow with the main channel, the structure was modeled closer to the downstream side of the bridge.
Table 6 lists the different elevations of sheet pile cutoff that were simulated in the HEC-RAS model. During the anticipated 2-month construction window (with 24/7 operation), the sheet pile cutoffs will have only a minor affect (0.04 foot within the project area/Lincoln Park property and 0.01 foot outside of the project area) should a 100-year storm occur during this time. At the end of the construction, the sheet pile cutoffs will be removed. A complete set of model simulation results are included in Table C-3 in Attachment C. The project area includes the western oxbow of the Milwaukee River. Both sheet pile cutoffs were simulated together in the model and both set to the same height during model trial simulations.
TABLE 6 100-Year Storm Water Surface Elevation Increases with Sheet Pile Cutoffs in Milwaukee River: Stage 2 Lincoln Park/Milwaukee River Basis of Design Report
Elevation of Sheet Pile (ft)
Milwaukee River Design Storm Equivalent
Maximum Increase in Water Surface Elevation (ft)
In Lincoln Park (western oxbow) Outside Project Areaa
620 Below 10-year water surface elevation
0.04 0.01a
619 Below 10-year water surface elevation
0.03 0.01
618 Above 2-year water surface elevation
0.02 0.01
617 Below 2-year water surface elevation
0.02 0.01
a Increase in water surface elevation is directly upstream of western oxbow split from main channel
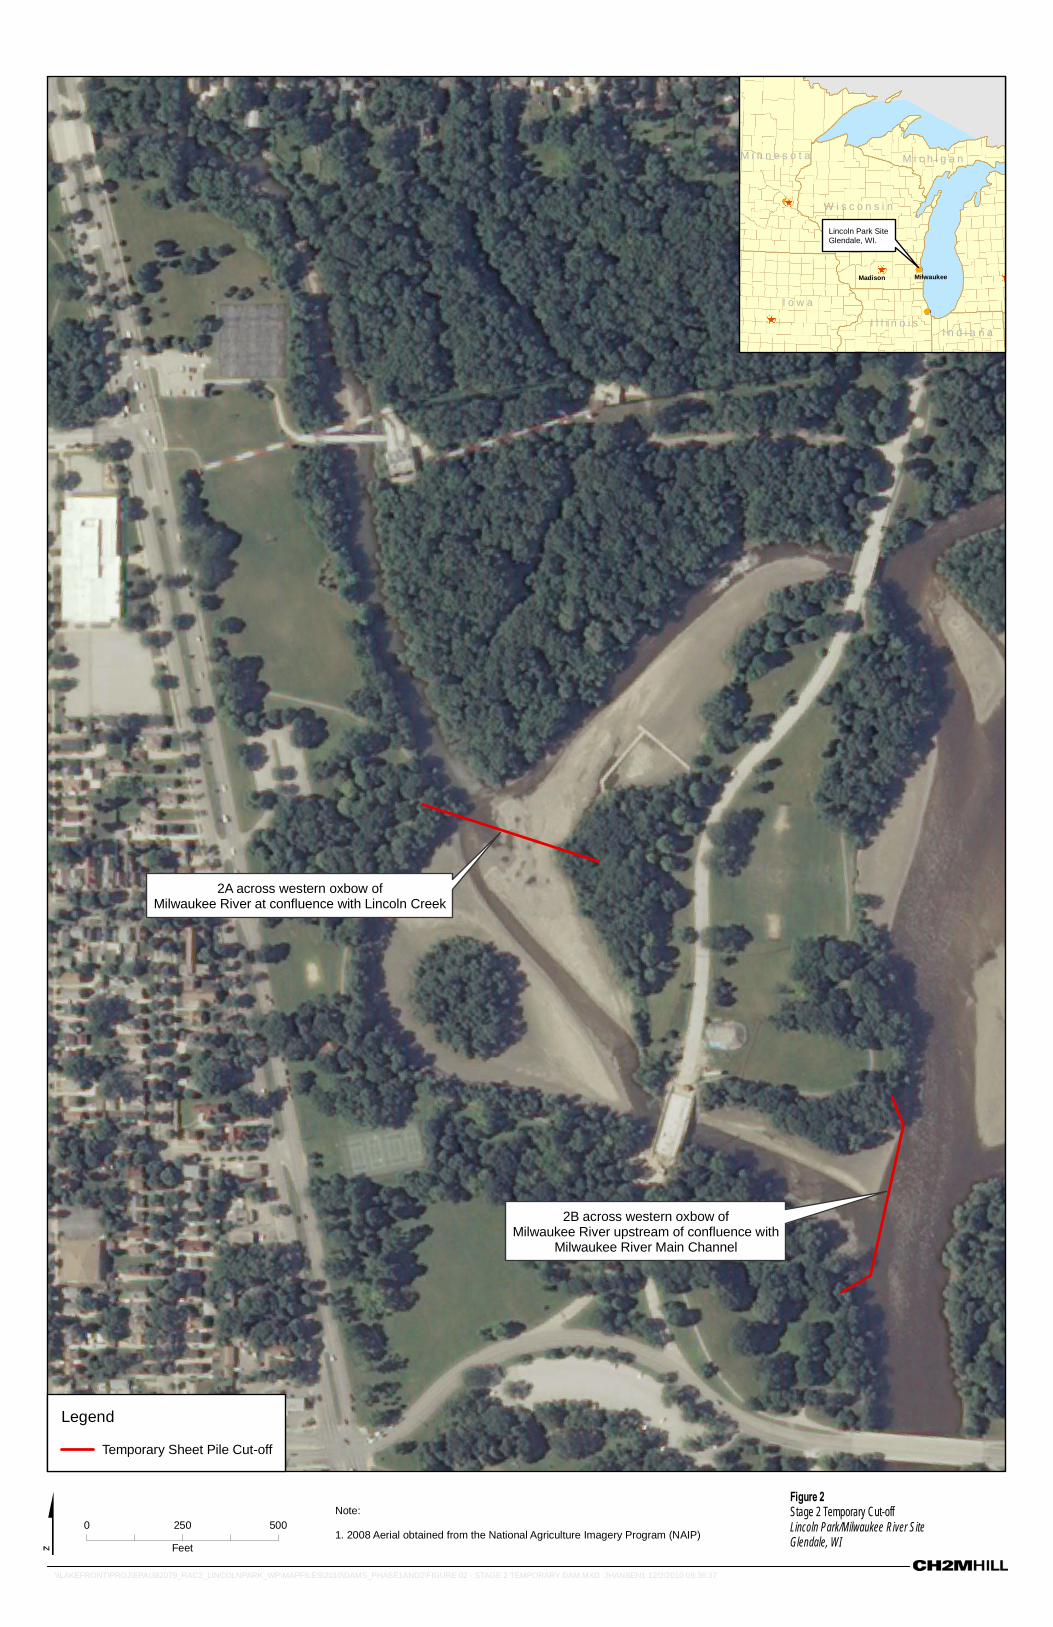
2B across western oxbow ofMilwaukee River upstream of confluence with
Milwaukee River Main Channel
2A across western oxbow ofMilwaukee River at confluence with Lincoln Creek
MilwaukeeMadison
Lincoln Park SiteGlendale, WI.
I o w a
W i s c o n s i n
M i n n e s o t a
I l l i n o i s
M i c h i g a n
I n d i a n a
0 250 500
Feet
\\LAKEFRONT\PROJ\EPA\382079_RAC2_LINCOLNPARK_WP\MAPFILES\2010\DAMS_PHASE1AND2\FIGURE 02 - STAGE 2 TEMPORARY DAM.MXD JHANSEN1 12/2/2010 09:36:37
Note:
1. 2008 Aerial obtained from the National Agriculture Imagery Program (NAIP)
Figure 2Stage 2 Temporary Cut-offLincoln Park/Milwaukee River SiteGlendale, WI
Legend
Temporary Sheet Pile Cut-off

LINCOLN PARK SEDIMENT REMOVAL: TEMPORARY EARTHEN AND SHEET PILE CUTOFF MODELING
MKE/110050005 13
A maximum elevation of 620.0 feet is recommended for the top of both sheet pile cutoffs. That elevation is recommended because all scenarios cause the same change in water level outside the project area and elevation 620.0 feet provides for the greatest flexibility to the dredging contractor to keep the work area dry. This sheet pile cutoff elevation will cause an increase of 0.04 foot to the regulatory floodplain during the 100-year recurrence storm within the project area, but is limited to Lincoln Park. Water level changes outside of Lincoln Park are limited to 0.01 foot for the 100-year storm, which has less than a 1 percent chance of occurring during the project.
Sheet Pile Cutoff Effect on Lincoln Creek During Stage 2 of the construction, Lincoln Creek will be rerouted to flow north through the western oxbow. Figure 3 shows the layout of the typical flow direction and the Stage 2 flow direction. To determine the effect of directing this flow north instead of south, the pre-project Lincoln Creek HEC-RAS model was first updated to include the part of the western oxbow that conveys Lincoln Creek to the south (to the main stem of the Milwaukee River). The results of that model simulation were then compared to a Lincoln Creek model flowing through the northern part of the western oxbow. A diversion was also included to simulate sheet pile 2A overtopping by a high flow event that could convey flow to the southern part of the western oxbow. Flow over sheet pile 2A was simulated using a 275-foot-long sharp crested weir. The northern part of the western oxbow added to the Lincoln Creek model and the Lincoln Creek model downstream of the Green Bay Avenue Bridge (project site) includes the Stage 1 restoration design in the cross section geometry. The alignment of the sheet pile on the western oxbow of the Milwaukee River must be located downstream of the confluence with Lincoln Creek so that the width of the Lincoln Creek channel is maintained.
Directing flow through the northern part of the western oxbow of the Milwaukee River does not increase the water surface elevation on Lincoln Creek during the 100-year storm. The water surface elevation at the confluence with Lincoln Creek (cross section 0.0) during the 100-year storm with the flow directed north along the western oxbow is 621.05 feet. This elevation is greater than the sheet pile cutoff elevation on the western oxbow of the Milwaukee River of 620 feet. Therefore, during the 100-year storm, flow is overtopping the sheet pile cutoff that is being used for the Stage 2 dredging. A complete set of results is included in Table C-4 of Attachment C.
Temporary Cutoff Evaluation Summary The HEC-RAS modeling simulated water level changes associated with temporary cutoff installation to facilitate the dredging project. Table 7 summarizes the modeled temporary cutoffs, the type of cutoff, and the recommended elevation of cutoffs.

LINCOLN PARK SEDIMENT REMOVAL: TEMPORARY EARTHEN AND SHEET PILE CUTOFF MODELING
14 MKE/110050005
TABLE 7 Summary of Temporary Cutoff Recommendations Lincoln Park/Milwaukee River Basis of Design Report
Stage Type of Cutoff
Recommended Maximum
Cutoff Elevation
Temporary Rise in 100-Year Return
Period Water Level
Approximate Durationa (24 hr/day, 7 days/week) [12 hr/day, 5 days/week]
1—Lincoln Creek cutoffs 1A and 1C (Upstream of Green Bay Avenue Bridge and at Confluence with Milwaukee River western oxbow)
Earthen 1A: 619.0 ft 1C: 617.0 ft
0.00 ftb
Stage1:
(2 months) [3 months]
1—Milwaukee River western oxbow cutoffs 1B and 1D
Sheet pile 1B: 620.0 ft 1D: 620.0 ft
0.01 ft
2—Milwaukee River western oxbow cutoffs 2A and 2B
Sheet pile 2A: 620.0 ft 2B: 620.0 ft
0.01 ftc Stage 2:
(2 months) [3 months]
2—Lincoln Creek rerouting None (rerouting of Lincoln Creek)
N/A 0.00 ft
aSee Attachment A for additional schedule information. bEarthen cutoff to wash away with less than 100-year return period storm. cImpact 0.04 ft within Lincoln Park property; 0.01 ft elsewhere.

MilwaukeeMadison
Lincoln Park SiteGlendale, WI.
I o w a
W i s c o n s i n
M i n n e s o t a
I l l i n o i s
M i c h i g a n
I n d i a n a
0 250 500
Feet
\\LAKEFRONT\PROJ\EPA\382079_RAC2_LINCOLNPARK_WP\MAPFILES\2010\DAMS_PHASE1AND2\FIGURE 03 - STAGE 1 AND 2 LINCOLN CREEK FLOW DIRECTION.MXD JHANSEN1 12/2/2010 10:10:28
Note:
1. 2008 Aerial obtained from the National Agriculture Imagery Program (NAIP)
Figure 3Stage 1 and 2 Lincoln Creek Flow DirectionLincoln Park/Milwaukee River SiteGlendale, WI
Legend
Typical Flow Direction
Stage 2 Flow Direction

Attachment A Draft Remedial Action Schedule
Lincoln Park/Milwaukee River Channel Sediments

See Appendix M

Attachment B USGS River Gage Monthly Flow Data

USGS Surface Water data for USA: USGS Surface-Water Monthly Statistics
http://waterdata.usgs.gov/...=html_table&date_format=YYYY-MM-DD&rdb_compression=file&submitted_form=parameter_selection_list[11/24/2010 10:57:32 AM]
USGS Home Contact USGS Search USGS
National Water Information System: Web Interface
USGS Water Resources Data Category:
Surface Water
Geographic Area:
United States
News New Real-Time and Site Web Services! - updated August 26, 2010
USGS Surface-Water Monthly Statistics forthe NationThe statistics generated from this site are based on approved daily-mean data andmay not match those published by the USGS in official publications. The user isresponsible for assessment and use of statistics from this site. For more details onwhy the statistics may not match, click here.
USGS 040869416 LINCOLN CREEK @ SHERMAN BOULEVARD ATMILWAUKEE, WI
Available data for this site Time-series: Monthly statistics
Milwaukee County, WisconsinHydrologic Unit Code 04040003Latitude 43°05'51", Longitude 87°58'01" NAD83Drainage area 9.56 square milesGage datum 635 feet above sea level NAVD88
Output formats
HTML table of all data
Tab-separated data
Reselect output format
00060, Discharge, cubic feet per second,
YEARMonthly mean in cfs (Calculation Period: 2003-06-01 -> 2009-09-30)
Jan Feb Mar Apr May Jun Jul Aug Sep Oct Nov Dec
2003 7.08 5.85 4.04 5.02 4.11 12.0 6.71
2004 2.69 7.11 16.5 10.8 59.3 13.7 19.1 7.13 1.85 3.97 6.22 7.34
2005 14.2 13.4 10.5 7.73 8.93 8.58 7.20 4.67 9.52 1.63 11.6 3.82
2006 12.2 4.20 18.7 30.8 9.29 8.25 9.05 7.19 10.4 12.6 10.5 16.0
2007 3.94 10.0 24.6 28.1 10.5 10.6 5.69 34.6 5.34 8.97 2.49 7.73
2008 12.7 9.30 31.7 35.3 6.94 84.2 12.6 4.19 11.9 6.76 2.76 12.8
2009 2.69 16.8 27.4 33.5 16.1 28.3 3.32 10.8 7.30
Mean ofmonthly 8.1 10 22 24 19 23 9.0 10 7.3 6.3 7.6 9.1

USGS Surface Water data for USA: USGS Surface-Water Monthly Statistics
http://waterdata.usgs.gov/...=html_table&date_format=YYYY-MM-DD&rdb_compression=file&submitted_form=parameter_selection_list[11/24/2010 10:57:32 AM]
Discharge
** No Incomplete data have been used for statistical calculation
Questions about sites/data? TopFeedback on this web site Explanation of termsAutomated retrievals Subscribe for system changesHelp News
Accessibility FOIA Privacy Policies and Notices
U.S. Department of the Interior | U.S. Geological SurveyTitle: Surface Water data for USA: USGS Surface-Water Monthly Statistics URL: http://waterdata.usgs.gov/nwis/monthly?
Page Contact Information: Wisconsin Water Data Support TeamPage Last Modified: 2010-11-24 11:56:00 EST0.27 0.24 vaww01
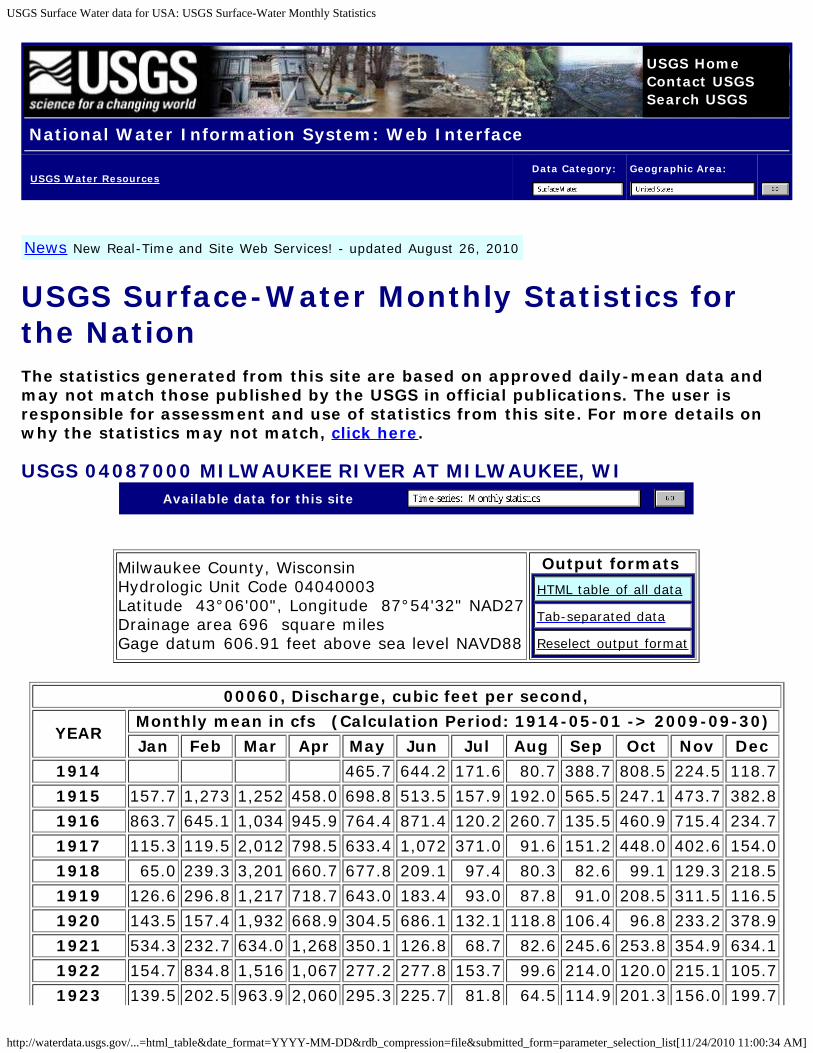
USGS Surface Water data for USA: USGS Surface-Water Monthly Statistics
http://waterdata.usgs.gov/...=html_table&date_format=YYYY-MM-DD&rdb_compression=file&submitted_form=parameter_selection_list[11/24/2010 11:00:34 AM]
USGS Home Contact USGS Search USGS
National Water Information System: Web Interface
USGS Water Resources Data Category:
Surface Water
Geographic Area:
United States
News New Real-Time and Site Web Services! - updated August 26, 2010
USGS Surface-Water Monthly Statistics forthe NationThe statistics generated from this site are based on approved daily-mean data andmay not match those published by the USGS in official publications. The user isresponsible for assessment and use of statistics from this site. For more details onwhy the statistics may not match, click here.
USGS 04087000 MILWAUKEE RIVER AT MILWAUKEE, WI Available data for this site Time-series: Monthly statistics
Milwaukee County, WisconsinHydrologic Unit Code 04040003Latitude 43°06'00", Longitude 87°54'32" NAD27Drainage area 696 square milesGage datum 606.91 feet above sea level NAVD88
Output formats
HTML table of all data
Tab-separated data
Reselect output format
00060, Discharge, cubic feet per second,
YEARMonthly mean in cfs (Calculation Period: 1914-05-01 -> 2009-09-30)
Jan Feb Mar Apr May Jun Jul Aug Sep Oct Nov Dec
1914 465.7 644.2 171.6 80.7 388.7 808.5 224.5 118.7
1915 157.7 1,273 1,252 458.0 698.8 513.5 157.9 192.0 565.5 247.1 473.7 382.8
1916 863.7 645.1 1,034 945.9 764.4 871.4 120.2 260.7 135.5 460.9 715.4 234.7
1917 115.3 119.5 2,012 798.5 633.4 1,072 371.0 91.6 151.2 448.0 402.6 154.0
1918 65.0 239.3 3,201 660.7 677.8 209.1 97.4 80.3 82.6 99.1 129.3 218.5
1919 126.6 296.8 1,217 718.7 643.0 183.4 93.0 87.8 91.0 208.5 311.5 116.5
1920 143.5 157.4 1,932 668.9 304.5 686.1 132.1 118.8 106.4 96.8 233.2 378.9
1921 534.3 232.7 634.0 1,268 350.1 126.8 68.7 82.6 245.6 253.8 354.9 634.1
1922 154.7 834.8 1,516 1,067 277.2 277.8 153.7 99.6 214.0 120.0 215.1 105.7
1923 139.5 202.5 963.9 2,060 295.3 225.7 81.8 64.5 114.9 201.3 156.0 199.7

USGS Surface Water data for USA: USGS Surface-Water Monthly Statistics
http://waterdata.usgs.gov/...=html_table&date_format=YYYY-MM-DD&rdb_compression=file&submitted_form=parameter_selection_list[11/24/2010 11:00:34 AM]
1924 92.7 208.1 1,022 1,279 873.2 298.9 169.7 2,936 339.2 205.8 371.8 274.7
1925 151.0 845.9 556.9 672.4 187.8 136.7 102.3 93.8 100.5 142.5 196.9 257.9
1926 275.5 467.2 1,066 818.9 505.6 386.3 101.8 84.4 171.6 224.9 653.0 547.8
1927 348.9 897.6 1,326 842.6 627.9 306.4 119.6 77.6 139.0 763.7 668.9 641.8
1928 242.7 354.3 1,179 1,342 478.7 575.7 318.8 240.0 125.0 242.0 702.4 980.7
1929 279.0 163.2 3,545 2,031 777.5 282.5 220.0 109.0 104.3 162.3 203.9 239.1
1930 107.1 946.8 503.4 637.3 512.7 138.5 83.3 67.2 49.1 110.6 99.8 82.1
1931 78.5 110.6 204.2 311.1 127.1 123.0 62.6 47.5 118.9 225.8 738.2 533.5
1932 646.9 392.0 333.5 309.7 215.1 79.9 51.5 36.0 27.4 75.9 86.0 149.8
1933 224.9 268.3 360.6 1,319 1,271 476.2 215.8 83.0 61.3 76.9 80.5 92.5
1934 129.7 50.0 205.3 601.1 112.5 56.3 35.4 19.4 49.3 59.9 281.0 273.9
1935 126.6 132.9 2,003 692.3 450.8 231.3 81.7 82.7 54.2 74.6 121.0 124.2
1936 81.5 75.8 1,172 413.3 241.8 77.1 25.0 37.3 140.5 170.0 145.4 138.1
1937 396.5 1,302 625.7 925.1 573.3 416.4 79.6 31.7 54.4 76.6 77.7 64.2
1938 134.6 2,200 1,385 360.9 152.3 112.4 498.6 187.4 2,304 317.3 402.7 249.5
1939 481.1 460.7 944.3 781.1 248.5 236.9 57.6 60.6 47.9 86.2 91.4 75.2
1940 46.2 60.7 180.6 732.3 383.5 1,201 173.9 211.7 151.4 108.3 160.8 337.0
1941 306.9 180.9 604.3 792.4 222.4 83.5 46.2 37.1 131.0 303.6 377.1 244.6
1942 249.7 265.3 780.1 313.4 356.9 647.9 105.1 218.6 247.3 196.4 480.7 450.0
1943 477.3 826.3 1,730 548.5 303.2 395.8 111.2 93.0 64.3 85.2 155.0 88.6
1944 84.4 294.2 713.7 616.0 247.7 203.0 83.1 53.9 90.4 89.3 139.9 98.6
1945 75.0 114.9 715.6 288.9 300.8 401.3 74.8 102.9 164.1 228.2 291.5 241.3
1946 711.2 195.2 2,076 286.0 155.9 131.6 89.6 38.5 47.4 52.8 103.6 70.9
1947 145.3 114.7 678.1 937.7 592.3 453.4 97.0 51.7 83.7 113.8 196.8 176.7
1948 115.1 327.7 1,696 582.8 463.2 102.1 66.2 46.5 34.1 53.1 126.1 104.4
1949 182.1 337.0 854.8 530.1 136.4 173.8 126.6 85.3 43.7 56.6 62.4 68.6
1950 216.6 110.9 1,335 757.1 389.5 134.9 434.2 104.5 106.6 78.7 80.3 100.9
1951 96.8 317.6 1,560 2,183 579.0 208.7 180.6 146.4 133.4 672.2 824.2 358.6
1952 659.3 455.4 2,022 1,468 348.7 208.4 1,200 420.6 154.5 149.2 206.7 309.5
1953 208.8 520.1 954.1 533.7 802.6 536.9 105.8 189.3 78.8 76.7 95.3 110.3
1954 71.6 200.6 187.5 340.3 246.7 837.3 460.1 141.7 151.7 1,040 283.8 258.0
1955 338.4 261.7 731.6 1,159 479.7 776.6 186.6 102.4 65.3 104.0 114.3 91.4
1956 79.0 92.6 378.1 681.9 1,024 174.5 376.2 263.4 298.7 111.2 197.6 168.5
1957 109.7 195.0 325.2 526.5 396.6 366.0 114.2 60.2 67.8 79.3 184.0 87.6
1958 77.5 68.4 220.0 237.1 86.4 96.6 57.9 57.4 88.1 93.8 126.0 53.5
1959 45.8 47.4 675.3 2,615 257.1 90.7 96.6 65.3 93.8 285.4 366.2 457.5
1960 552.1 196.2 702.4 1,708 1,450 360.9 326.4 606.2 747.6 378.1 675.7 219.6
1961 125.0 169.3 1,056 745.9 341.7 196.6 104.1 129.9 283.4 350.5 679.9 238.8

USGS Surface Water data for USA: USGS Surface-Water Monthly Statistics
http://waterdata.usgs.gov/...=html_table&date_format=YYYY-MM-DD&rdb_compression=file&submitted_form=parameter_selection_list[11/24/2010 11:00:34 AM]
1962 209.6 195.4 1,298 1,159 364.5 154.0 124.4 109.2 114.3 169.2 131.0 97.9
1963 87.8 70.9 503.9 350.4 296.1 129.8 64.1 61.4 60.5 64.4 104.3 40.7
1964 62.1 65.6 229.5 517.7 359.5 73.3 489.1 152.5 285.1 143.2 152.6 130.3
1965 131.4 372.8 1,037 1,996 304.9 137.2 98.7 117.8 1,249 926.9 547.8 797.6
1966 419.5 1,042 1,245 739.3 540.4 243.5 132.1 161.6 188.4 112.5 158.2 167.6
1967 246.2 209.5 604.3 962.4 453.6 450.3 199.1 126.8 77.0 277.2 256.6 180.4
1968 62.5 97.3 186.0 653.9 512.1 546.4 302.3 157.9 146.2 114.4 150.0 132.7
1969 210.2 207.5 772.2 934.7 378.7 795.5 639.8 140.0 100.5 176.8 156.9 112.9
1970 103.5 116.1 358.0 314.2 421.8 347.5 109.2 72.3 267.3 173.8 397.1 323.5
1971 195.8 424.3 1,382 1,782 349.2 243.0 141.4 132.3 100.2 129.7 177.2 518.1
1972 164.4 113.5 867.8 799.3 481.3 323.3 257.5 463.0 1,158 916.3 653.9 284.9
1973 744.5 549.9 1,774 1,952 1,720 754.1 214.4 176.5 232.4 448.1 464.3 585.2
1974 559.6 536.3 2,141 1,639 1,109 763.8 355.1 292.4 207.4 307.6 363.6 407.5
1975 638.0 279.0 1,514 1,180 618.1 604.7 236.6 233.2 164.4 121.5 208.5 324.8
1976 138.7 488.8 1,861 1,244 601.9 256.1 118.8 107.3 74.7 103.5 111.2 71.4
1977 54.2 72.4 514.5 584.5 133.1 269.1 126.2 263.4 374.0 472.8 505.6 658.8
1978 248.1 202.5 591.5 1,340 1,176 553.1 748.4 272.7 630.5 336.2 397.2 291.6
1979 245.2 238.6 2,180 1,967 744.4 435.3 268.5 578.5 220.0 206.6 336.8 423.5
1980 339.0 180.7 355.3 935.0 354.1 417.7 218.1 538.4 865.6 443.2 365.7 360.1
1981 175.5 675.7 427.9 724.3 273.4 237.0 469.8 443.7 723.1 1,149 609.4 495.8
1982 214.2 216.1 1,401 1,893 601.0 386.0 287.0 213.9 160.6 207.3 715.4 876.0
1983 284.8 579.9 1,084 1,843 819.2 455.1 207.2 296.8 296.6 377.2 524.3 507.1
1984 246.5 1,104 555.6 876.7 899.1 1,249 633.2 226.7 288.3 703.3 1,012 732.6
1985 436.8 771.1 1,774 1,201 351.9 194.2 224.3 223.8 320.0 688.7 1,956 649.3
1986 431.3 466.9 2,058 894.8 449.0 312.1 335.5 321.3 1,942 1,316 493.5 407.7
1987 273.2 288.9 782.5 1,001 435.8 216.8 256.7 431.3 358.4 275.1 469.4 896.1
1988 429.3 726.9 663.2 921.4 285.3 101.9 98.5 101.0 236.0 236.1 629.9 323.1
1989 267.1 233.2 1,129 714.3 325.6 703.3 239.2 384.2 391.6 205.8 214.0 140.0
1990 321.6 380.8 1,379 583.2 922.2 388.1 185.1 223.6 247.5 270.7 358.0 379.8
1991 246.1 440.2 1,164 1,026 376.7 569.6 260.4 189.6 202.1 414.4 754.7 752.4
1992 397.7 305.9 1,113 962.4 359.4 160.8 180.9 137.6 232.7 171.8 660.7 505.1
1993 425.2 234.9 1,055 3,024 758.9 1,130 824.1 311.7 550.7 352.8 312.5 277.2
1994 163.5 615.4 1,168 522.0 286.1 133.7 391.6 202.5 122.1 145.3 231.7 213.7
1995 178.5 141.8 489.2 776.7 521.9 181.9 115.6 393.5 236.2 335.8 525.2 261.1
1996 329.4 512.8 596.2 722.2 697.6 2,007 477.8 246.3 180.2 278.6 308.9 278.9
1997 339.4 644.9 1,163 787.6 607.5 1,061 431.5 302.5 204.2 112.2 155.2 182.6
1998 234.2 794.5 876.8 1,681 581.3 295.7 190.6 392.6 85.1 177.7 255.4 182.9
1999 405.2 782.3 466.1 1,303 1,064 810.6 752.6 258.9 179.4 197.9 193.9 215.8
2000 171.6 433.4 478.4 584.9 915.7 771.2 309.1 229.7 483.1 223.3 330.3 189.9

USGS Surface Water data for USA: USGS Surface-Water Monthly Statistics
http://waterdata.usgs.gov/...=html_table&date_format=YYYY-MM-DD&rdb_compression=file&submitted_form=parameter_selection_list[11/24/2010 11:00:34 AM]
2001 239.7 430.0 931.0 1,282 624.8 763.2 197.7 273.6 439.0 415.1 352.4 390.5
2002 234.5 461.1 809.6 947.0 680.4 643.5 240.2 230.4 228.8 230.0 191.5 176.7
2003 120.4 128.3 297.5 361.9 841.7 249.2 132.9 131.5 89.0 87.2 454.3 310.9
2004 149.0 150.2 1,273 756.8 2,597 2,629 617.8 341.0 170.4 183.6 286.3 434.9
2005 358.7 688.9 828.6 753.0 368.3 154.3 126.3 83.0 115.6 100.3 209.3 115.9
2006 433.0 275.8 952.5 974.5 750.3 266.6 137.4 130.8 152.7 307.2 298.2 684.4
2007 317.5 152.1 1,495 1,250 551.3 354.7 192.6 886.7 255.4 257.9 184.1 341.6
2008 1,081 849.4 1,596 2,250 583.9 2,976 581.0 228.6 257.1 253.1 229.5 347.7
2009 316.1 763.5 1,962 1,270 1,149 604.7 177.4 192.0 149.7
Mean ofmonthly
Discharge265 399 1,050 984 548 459 233 216 262 274 343 303
** No Incomplete data have been used for statistical calculation
Questions about sites/data? TopFeedback on this web site Explanation of termsAutomated retrievals Subscribe for system changesHelp News
Accessibility FOIA Privacy Policies and Notices
U.S. Department of the Interior | U.S. Geological SurveyTitle: Surface Water data for USA: USGS Surface-Water Monthly Statistics URL: http://waterdata.usgs.gov/nwis/monthly?
Page Contact Information: Wisconsin Water Data Support TeamPage Last Modified: 2010-11-24 11:59:30 EST3.46 3.31 vaww02

Attachment C Lincoln Creek and Milwaukee River HEC-RAS
Model Results

MKE/110050005 C-1
TABLE C-1 Comparison of 10-year with Lincoln Creek Earthen Cut-Off Structures 1A and 1C Model Results to 100-year without Earthen Cut-Off Structures Modeling Results
Lincoln Park/Milwaukee River Basis of Design Report
Reach River Sta
Pre-Project
100-year Design Storm
W.S. Elev (ft)
1A = 619 ft 1C = 616 ft
1A = 618 ft 1C = 617 ft
1A = 617 ft 1C = 616 ft
1A = 616 ft 1C = 615.5 ft
1A = 616 ft 1C = 615 ft
1A = 619 ft 1C = 617 ft
10-year With cut-off
W.S. Elev (ft) Diff (ft)
10-year With cut-off
W.S. Elev (ft) Diff (ft)
10-year With cut-off
W.S. Elev (ft) Diff (ft)
10-year With cut-off
W.S. Elev (ft) Diff (ft)
10-year With cut-off
W.S. Elev (ft) Diff (ft)
10-year With cut-off
W.S. Elev (ft) Diff (ft)
Lower Mainstream 1.95 634.44 631.4 -3.04 631.39 -3.05 631.39 -3.05 631.39 -3.05 631.39 -3.05 631.4 -3.04
Lower Mainstream 1.92 634.15 631.22 -2.93 631.21 -2.94 631.2 -2.95 631.2 -2.95 631.2 -2.95 631.22 -2.93
Lower Mainstream 1.912 634.14 631.22 -2.92 631.21 -2.93 631.2 -2.94 631.2 -2.94 631.2 -2.94 631.22 -2.92
Lower Mainstream 1.904 Bridge Lower Mainstream 1.9 633.77 630.99 -2.78 630.98 -2.79 630.97 -2.8 630.97 -2.8 630.97 -2.8 630.99 -2.78
Lower Mainstream 1.89 633.72 630.87 -2.85 630.86 -2.86 630.86 -2.86 630.85 -2.87 630.85 -2.87 630.87 -2.85
Lower Mainstream 1.75 632.73 629.92 -2.81 629.9 -2.83 629.89 -2.84 629.89 -2.84 629.89 -2.84 629.92 -2.81
Lower Mainstream 1.74 632.82 629.96 -2.86 629.94 -2.88 629.93 -2.89 629.93 -2.89 629.93 -2.89 629.96 -2.86
Lower Mainstream 1.73 Bridge Lower Mainstream 1.721 632.21 629.62 -2.59 629.6 -2.61 629.59 -2.62 629.59 -2.62 629.59 -2.62 629.62 -2.59
Lower Mainstream 1.72 632.16 629.55 -2.61 629.53 -2.63 629.52 -2.64 629.52 -2.64 629.52 -2.64 629.55 -2.61
Lower Mainstream 1.67 631.09 628.64 -2.45 628.61 -2.48 628.59 -2.5 628.59 -2.5 628.59 -2.5 628.64 -2.45
Lower Mainstream 1.65 630.88 628.46 -2.42 628.43 -2.45 628.42 -2.46 628.41 -2.47 628.41 -2.47 628.46 -2.42

C-2 MKE/110050005
TABLE C-1 Comparison of 10-year with Lincoln Creek Earthen Cut-Off Structures 1A and 1C Model Results to 100-year without Earthen Cut-Off Structures Modeling Results
Lincoln Park/Milwaukee River Basis of Design Report
Reach River Sta
Pre-Project
100-year Design Storm
W.S. Elev (ft)
1A = 619 ft 1C = 616 ft
1A = 618 ft 1C = 617 ft
1A = 617 ft 1C = 616 ft
1A = 616 ft 1C = 615.5 ft
1A = 616 ft 1C = 615 ft
1A = 619 ft 1C = 617 ft
10-year With cut-off
W.S. Elev (ft) Diff (ft)
10-year With cut-off
W.S. Elev (ft) Diff (ft)
10-year With cut-off
W.S. Elev (ft) Diff (ft)
10-year With cut-off
W.S. Elev (ft) Diff (ft)
10-year With cut-off
W.S. Elev (ft) Diff (ft)
10-year With cut-off
W.S. Elev (ft) Diff (ft)
Lower Mainstream 1.645 Bridge Lower Mainstream 1.64 630.2 628.19 -2.01 628.15 -2.05 628.14 -2.06 628.13 -2.07 628.13 -2.07 628.19 -2.01
Lower Mainstream 1.63 630.28 628.22 -2.06 628.18 -2.1 628.17 -2.11 628.16 -2.12 628.16 -2.12 628.22 -2.06
Lower Mainstream 1.56 629.99 627.78 -2.21 627.73 -2.26 627.71 -2.28 627.71 -2.28 627.7 -2.29 627.78 -2.21
Lower Mainstream 1.54 629.9 627.72 -2.18 627.67 -2.23 627.65 -2.25 627.64 -2.26 627.64 -2.26 627.72 -2.18
Lower Mainstream 1.53 629.51 627.4 -2.11 627.34 -2.17 627.31 -2.2 627.3 -2.21 627.3 -2.21 627.4 -2.11
Lower Mainstream 1.522 Bridge Lower Mainstream 1.514 629 627.08 -1.92 627 -2 626.97 -2.03 626.96 -2.04 626.96 -2.04 627.08 -1.92
Lower Mainstream 1.51 629.05 627.13 -1.92 627.05 -2 627.02 -2.03 627.01 -2.04 627.01 -2.04 627.13 -1.92
Lower Mainstream 1.47 629.06 627.02 -2.04 626.93 -2.13 626.9 -2.16 626.88 -2.18 626.88 -2.18 627.02 -2.04
Lower Mainstream 1.37 628.76 626.62 -2.14 626.5 -2.26 626.45 -2.31 626.43 -2.33 626.42 -2.34 626.62 -2.14
Lower Mainstream 1.33 627.98 625.84 -2.14 625.62 -2.36 625.51 -2.47 625.47 -2.51 625.47 -2.51 625.84 -2.14
Lower Mainstream 1.31 628.04 625.97 -2.07 625.78 -2.26 625.69 -2.35 625.65 -2.39 625.65 -2.39 625.97 -2.07

MKE/110050005 C-3
TABLE C-1 Comparison of 10-year with Lincoln Creek Earthen Cut-Off Structures 1A and 1C Model Results to 100-year without Earthen Cut-Off Structures Modeling Results
Lincoln Park/Milwaukee River Basis of Design Report
Reach River Sta
Pre-Project
100-year Design Storm
W.S. Elev (ft)
1A = 619 ft 1C = 616 ft
1A = 618 ft 1C = 617 ft
1A = 617 ft 1C = 616 ft
1A = 616 ft 1C = 615.5 ft
1A = 616 ft 1C = 615 ft
1A = 619 ft 1C = 617 ft
10-year With cut-off
W.S. Elev (ft) Diff (ft)
10-year With cut-off
W.S. Elev (ft) Diff (ft)
10-year With cut-off
W.S. Elev (ft) Diff (ft)
10-year With cut-off
W.S. Elev (ft) Diff (ft)
10-year With cut-off
W.S. Elev (ft) Diff (ft)
10-year With cut-off
W.S. Elev (ft) Diff (ft)
Lower Mainstream 1.3 627.85 625.85 -2 625.65 -2.2 625.55 -2.3 625.51 -2.34 625.51 -2.34 625.85 -2
Lower Mainstream 1.289 Bridge Lower Mainstream 1.28 627.12 625.44 -1.68 625.2 -1.92 625.09 -2.03 625.04 -2.08 625.03 -2.09 625.44 -1.68
Lower Mainstream 1.27 626.75 625.23 -1.52 624.96 -1.79 624.84 -1.91 624.78 -1.97 624.78 -1.97 625.23 -1.52
Lower Mainstream 1.25 626.92 625.28 -1.64 625.02 -1.9 624.88 -2.04 624.83 -2.09 624.82 -2.1 625.28 -1.64
Lower Mainstream 1.23 626.91 625.26 -1.65 624.99 -1.92 624.86 -2.05 624.8 -2.11 624.8 -2.11 625.26 -1.65
Lower Mainstream 1.22 626.86 625.23 -1.63 624.95 -1.91 624.82 -2.04 624.75 -2.11 624.75 -2.11 625.23 -1.63
Lower Mainstream 1.17 626.62 625.05 -1.57 624.75 -1.87 624.59 -2.03 624.53 -2.09 624.52 -2.1 625.05 -1.57
Lower Mainstream 1.12 626.16 624.77 -1.39 624.43 -1.73 624.25 -1.91 624.17 -1.99 624.17 -1.99 624.77 -1.39
Lower Mainstream 1.07 625.76 624.53 -1.23 624.16 -1.6 623.97 -1.79 623.88 -1.88 623.87 -1.89 624.53 -1.23
Lower Mainstream 0.93 625.27 624.24 -1.03 623.81 -1.46 623.57 -1.7 623.46 -1.81 623.45 -1.82 624.24 -1.03
Lower Mainstream 0.915 625.2 624.2 -1 623.76 -1.44 623.51 -1.69 623.4 -1.8 623.39 -1.81 624.2 -1
Lower Mainstream 0.912 Bridge

C-4 MKE/110050005
TABLE C-1 Comparison of 10-year with Lincoln Creek Earthen Cut-Off Structures 1A and 1C Model Results to 100-year without Earthen Cut-Off Structures Modeling Results
Lincoln Park/Milwaukee River Basis of Design Report
Reach River Sta
Pre-Project
100-year Design Storm
W.S. Elev (ft)
1A = 619 ft 1C = 616 ft
1A = 618 ft 1C = 617 ft
1A = 617 ft 1C = 616 ft
1A = 616 ft 1C = 615.5 ft
1A = 616 ft 1C = 615 ft
1A = 619 ft 1C = 617 ft
10-year With cut-off
W.S. Elev (ft) Diff (ft)
10-year With cut-off
W.S. Elev (ft) Diff (ft)
10-year With cut-off
W.S. Elev (ft) Diff (ft)
10-year With cut-off
W.S. Elev (ft) Diff (ft)
10-year With cut-off
W.S. Elev (ft) Diff (ft)
10-year With cut-off
W.S. Elev (ft) Diff (ft)
Lower Mainstream 0.909 625.17 624.19 -0.98 623.74 -1.43 623.49 -1.68 623.37 -1.8 623.37 -1.8 624.19 -0.98
Lower Mainstream 0.82 625.11 624.14 -0.97 623.68 -1.43 623.43 -1.68 623.3 -1.81 623.3 -1.81 624.14 -0.97
Lower Mainstream 0.81 624.96 624.07 -0.89 623.61 -1.35 623.35 -1.61 623.23 -1.73 623.22 -1.74 624.07 -0.89
Lower Mainstream 0.803 Bridge Lower Mainstream 0.794 624.79 624 -0.79 623.52 -1.27 623.25 -1.54 623.12 -1.67 623.12 -1.67 624 -0.79
Lower Mainstream 0.79 624.76 623.99 -0.77 623.5 -1.26 623.23 -1.53 623.09 -1.67 623.08 -1.68 623.99 -0.77
Lower Mainstream 0.75 624.63 623.93 -0.7 623.43 -1.2 623.15 -1.48 623.01 -1.62 623.01 -1.62 623.93 -0.7
Lower Mainstream 0.71 624.5 623.86 -0.64 623.35 -1.15 623.06 -1.44 622.91 -1.59 622.91 -1.59 623.86 -0.64
Lower Mainstream 0.62 624.09 623.67 -0.42 623.11 -0.98 622.79 -1.3 622.63 -1.46 622.62 -1.47 623.67 -0.42
Lower Mainstream 0.61 623.63 623.46 -0.17 622.87 -0.76 622.53 -1.1 622.36 -1.27 622.35 -1.28 623.46 -0.17
Lower Mainstream 0.6 623.43 623.39 -0.04 622.78 -0.65 622.43 -1 622.25 -1.18 622.25 -1.18 623.39 -0.04
Lower Mainstream 0.54 623.48 623.41 -0.07 622.78 -0.7 622.41 -1.07 622.22 -1.26 622.21 -1.27 623.41 -0.07
Lower Mainstream 0.5 623.43 622.1 -1.33 621.65 -1.78 621.79 -1.64 621.87 -1.56 621.85 -1.58 622.1 -1.33

MKE/110050005 C-5
TABLE C-1 Comparison of 10-year with Lincoln Creek Earthen Cut-Off Structures 1A and 1C Model Results to 100-year without Earthen Cut-Off Structures Modeling Results
Lincoln Park/Milwaukee River Basis of Design Report
Reach River Sta
Pre-Project
100-year Design Storm
W.S. Elev (ft)
1A = 619 ft 1C = 616 ft
1A = 618 ft 1C = 617 ft
1A = 617 ft 1C = 616 ft
1A = 616 ft 1C = 615.5 ft
1A = 616 ft 1C = 615 ft
1A = 619 ft 1C = 617 ft
10-year With cut-off
W.S. Elev (ft) Diff (ft)
10-year With cut-off
W.S. Elev (ft) Diff (ft)
10-year With cut-off
W.S. Elev (ft) Diff (ft)
10-year With cut-off
W.S. Elev (ft) Diff (ft)
10-year With cut-off
W.S. Elev (ft) Diff (ft)
10-year With cut-off
W.S. Elev (ft) Diff (ft)
Lower Mainstream 0.47 623.34 622 -1.34 622.16 -1.18 622 -1.34 621.92 -1.42 621.91 -1.43 622.16 -1.18
Lower Mainstream 0.44 622.78 621.73 -1.05 621.9 -0.88 621.73 -1.05 621.64 -1.14 621.63 -1.15 621.9 -0.88
Lower Mainstream 0.43 622.8 621.74 -1.06 621.92 -0.88 621.74 -1.06 621.66 -1.14 621.65 -1.15 621.92 -0.88
Lower Mainstream 0.42 Bridge Lower Mainstream 0.41 622.53 621.6 -0.93 621.79 -0.74 621.6 -0.93 621.52 -1.01 621.51 -1.02 621.79 -0.74
Lower Mainstream 0.4 622.59 621.63 -0.96 621.81 -0.78 621.63 -0.96 621.55 -1.04 621.54 -1.05 621.81 -0.78
Lower Mainstream 0.32 621.83 621.23 -0.6 621.44 -0.39 621.23 -0.6 621.14 -0.69 621.12 -0.71 621.44 -0.39
Lower Mainstream 0.25 621.49 621.03 -0.46 621.27 -0.22 621.03 -0.46 620.92 -0.57 620.9 -0.59 621.27 -0.22
Lower Mainstream 0.198 621.07 620.87 -0.2 621.12 0.05 620.87 -0.2 620.75 -0.32 620.73 -0.34 621.12 0.05
Lower Mainstream 0.189 620.81 620.78 -0.03 621.03 0.22 620.78 -0.03 620.65 -0.16 620.63 -0.18 621.03 0.22
Lower Mainstream 0.187 Bridge Lower Mainstream 0.185 620.82 620.78 -0.04 621.03 0.21 620.78 -0.04 620.65 -0.17 620.63 -0.19 621.03 0.21
Lower Mainstream 0.175 620.69 620.73 0.04 620.99 0.3 620.73 0.04 620.61 -0.08 620.59 -0.1 620.99 0.3

C-6 MKE/110050005
TABLE C-1 Comparison of 10-year with Lincoln Creek Earthen Cut-Off Structures 1A and 1C Model Results to 100-year without Earthen Cut-Off Structures Modeling Results
Lincoln Park/Milwaukee River Basis of Design Report
Reach River Sta
Pre-Project
100-year Design Storm
W.S. Elev (ft)
1A = 619 ft 1C = 616 ft
1A = 618 ft 1C = 617 ft
1A = 617 ft 1C = 616 ft
1A = 616 ft 1C = 615.5 ft
1A = 616 ft 1C = 615 ft
1A = 619 ft 1C = 617 ft
10-year With cut-off
W.S. Elev (ft) Diff (ft)
10-year With cut-off
W.S. Elev (ft) Diff (ft)
10-year With cut-off
W.S. Elev (ft) Diff (ft)
10-year With cut-off
W.S. Elev (ft) Diff (ft)
10-year With cut-off
W.S. Elev (ft) Diff (ft)
10-year With cut-off
W.S. Elev (ft) Diff (ft)
Lower Mainstream 0.121 620.26 620.58 0.32 620.86 0.6 620.58 0.32 620.44 0.18 620.42 0.16 620.86 0.6
Lower Mainstream 0.103 620.04 620.55 0.51 620.84 0.8 620.55 0.51 620.4 0.36 620.38 0.34 620.84 0.8
Lower Mainstream 0.06 619.76 620.46 0.7 620.78 1.02 620.46 0.7 620.3 0.54 620.28 0.52 620.78 1.02
Lower Mainstream 0 619.31 617.93 -1.38 617.93 -1.38 617.93 -1.38 617.93 -1.38 617.93 -1.38 617.93 -1.38
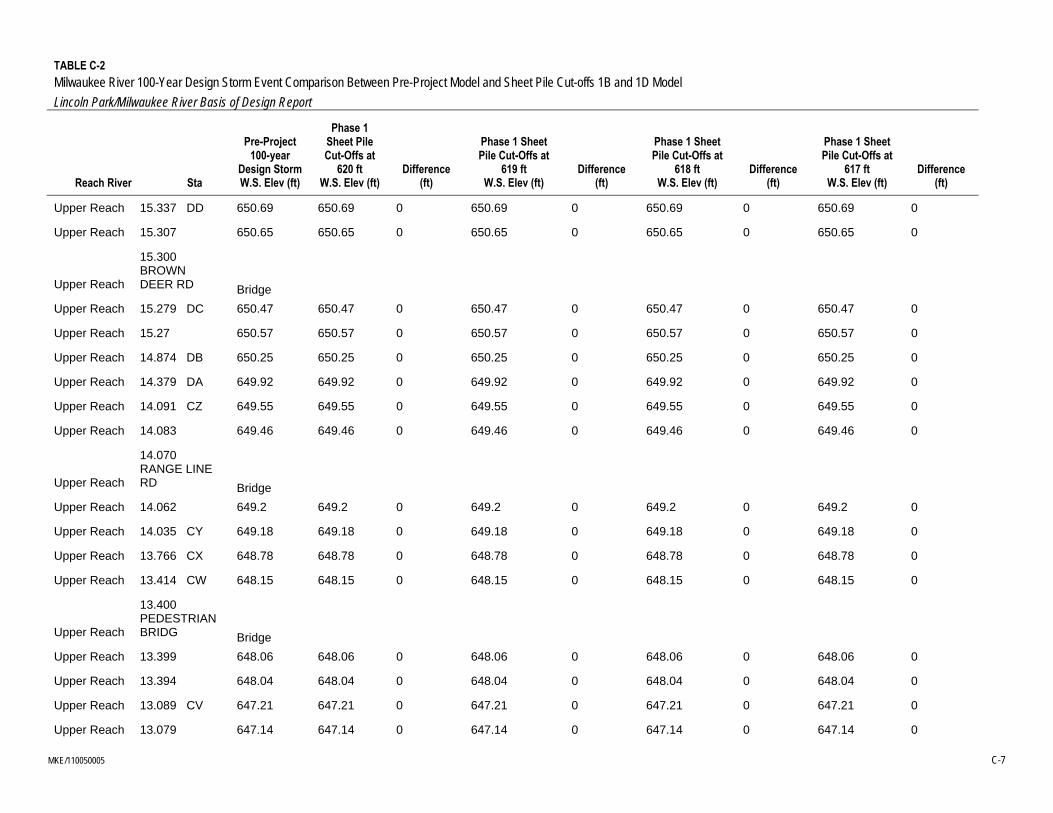
MKE/110050005 C-7
TABLE C-2 Milwaukee River 100-Year Design Storm Event Comparison Between Pre-Project Model and Sheet Pile Cut-offs 1B and 1D Model
Lincoln Park/Milwaukee River Basis of Design Report
Reach River Sta
Pre-Project 100-year
Design Storm W.S. Elev (ft)
Phase 1 Sheet Pile Cut-Offs at
620 ft W.S. Elev (ft)
Difference (ft)
Phase 1 Sheet Pile Cut-Offs at
619 ft W.S. Elev (ft)
Difference (ft)
Phase 1 Sheet Pile Cut-Offs at
618 ft W.S. Elev (ft)
Difference (ft)
Phase 1 Sheet Pile Cut-Offs at
617 ft W.S. Elev (ft)
Difference (ft)
Upper Reach 15.337 DD 650.69 650.69 0 650.69 0 650.69 0 650.69 0
Upper Reach 15.307 650.65 650.65 0 650.65 0 650.65 0 650.65 0
Upper Reach
15.300 BROWN DEER RD Bridge
Upper Reach 15.279 DC 650.47 650.47 0 650.47 0 650.47 0 650.47 0
Upper Reach 15.27 650.57 650.57 0 650.57 0 650.57 0 650.57 0
Upper Reach 14.874 DB 650.25 650.25 0 650.25 0 650.25 0 650.25 0
Upper Reach 14.379 DA 649.92 649.92 0 649.92 0 649.92 0 649.92 0
Upper Reach 14.091 CZ 649.55 649.55 0 649.55 0 649.55 0 649.55 0
Upper Reach 14.083 649.46 649.46 0 649.46 0 649.46 0 649.46 0
Upper Reach
14.070 RANGE LINE RD Bridge
Upper Reach 14.062 649.2 649.2 0 649.2 0 649.2 0 649.2 0
Upper Reach 14.035 CY 649.18 649.18 0 649.18 0 649.18 0 649.18 0
Upper Reach 13.766 CX 648.78 648.78 0 648.78 0 648.78 0 648.78 0
Upper Reach 13.414 CW 648.15 648.15 0 648.15 0 648.15 0 648.15 0
Upper Reach
13.400 PEDESTRIAN BRIDG Bridge
Upper Reach 13.399 648.06 648.06 0 648.06 0 648.06 0 648.06 0
Upper Reach 13.394 648.04 648.04 0 648.04 0 648.04 0 648.04 0
Upper Reach 13.089 CV 647.21 647.21 0 647.21 0 647.21 0 647.21 0
Upper Reach 13.079 647.14 647.14 0 647.14 0 647.14 0 647.14 0

C-8 MKE/110050005
TABLE C-2 Milwaukee River 100-Year Design Storm Event Comparison Between Pre-Project Model and Sheet Pile Cut-offs 1B and 1D Model
Lincoln Park/Milwaukee River Basis of Design Report
Reach River Sta
Pre-Project 100-year
Design Storm W.S. Elev (ft)
Phase 1 Sheet Pile Cut-Offs at
620 ft W.S. Elev (ft)
Difference (ft)
Phase 1 Sheet Pile Cut-Offs at
619 ft W.S. Elev (ft)
Difference (ft)
Phase 1 Sheet Pile Cut-Offs at
618 ft W.S. Elev (ft)
Difference (ft)
Phase 1 Sheet Pile Cut-Offs at
617 ft W.S. Elev (ft)
Difference (ft)
Upper Reach
13.070 PEDESTRIAN BRIDG Bridge
Upper Reach 13.069 646.1 646.1 0 646.1 0 646.1 0 646.1 0
Upper Reach 13.068 CU 646.18 646.18 0 646.18 0 646.18 0 646.18 0
Upper Reach 12.890 CT 644.79 644.79 0 644.79 0 644.79 0 644.79 0
Upper Reach 12.481 CS 641.9 641.9 0 641.9 0 641.9 0 641.9 0
Upper Reach 12.131 CR 640.16 640.16 0 640.16 0 640.16 0 640.16 0
Upper Reach 11.960 CQ 639.56 639.56 0 639.56 0 639.56 0 639.56 0
Upper Reach 11.955 639.61 639.61 0 639.61 0 639.61 0 639.61 0
Upper Reach
11.940 GOOD HOPE RD Bridge
Upper Reach 11.923 639.21 639.21 0 639.21 0 639.21 0 639.21 0
Upper Reach 11.919 CP 639.01 639.01 0 639.01 0 639.01 0 639.01 0
Upper Reach 11.795 CO 638.53 638.53 0 638.53 0 638.53 0 638.53 0
Upper Reach 11.573 636.61 636.61 0 636.61 0 636.61 0 636.61 0
Upper Reach 11.55 636.51 636.51 0 636.51 0 636.51 0 636.51 0
Upper Reach 11.537 CN 636.38 636.38 0 636.38 0 636.38 0 636.38 0
Upper Reach
11.530 GREEN TREE RD Bridge
Upper Reach 11.524 CM 635.49 635.49 0 635.49 0 635.49 0 635.49 0
Upper Reach 11.488 635.29 635.29 0 635.29 0 635.29 0 635.29 0
Upper Reach 11.228 CL 634.5 634.5 0 634.5 0 634.5 0 634.5 0

MKE/110050005 C-9
TABLE C-2 Milwaukee River 100-Year Design Storm Event Comparison Between Pre-Project Model and Sheet Pile Cut-offs 1B and 1D Model
Lincoln Park/Milwaukee River Basis of Design Report
Reach River Sta
Pre-Project 100-year
Design Storm W.S. Elev (ft)
Phase 1 Sheet Pile Cut-Offs at
620 ft W.S. Elev (ft)
Difference (ft)
Phase 1 Sheet Pile Cut-Offs at
619 ft W.S. Elev (ft)
Difference (ft)
Phase 1 Sheet Pile Cut-Offs at
618 ft W.S. Elev (ft)
Difference (ft)
Phase 1 Sheet Pile Cut-Offs at
617 ft W.S. Elev (ft)
Difference (ft)
Upper Reach 10.937 CK 634.28 634.28 0 634.28 0 634.28 0 634.28 0
Upper Reach 10.489 CJ 633.49 633.49 0 633.49 0 633.49 0 633.49 0
Upper Reach 10.351 CI 633.22 633.22 0 633.22 0 633.22 0 633.22 0
Upper Reach
10.340 KLETSCH PARK DAM Bridge
Upper Reach 10.326 633.15 633.15 0 633.15 0 633.15 0 633.15 0
Upper Reach 10.26 632.91 632.91 0 632.91 0 632.91 0 632.91 0
Upper Reach 10.231 CH 632.8 632.8 0 632.8 0 632.8 0 632.8 0
Upper Reach 10.226 632.78 632.78 0 632.78 0 632.78 0 632.78 0
Upper Reach
10.220 RAILROAD BRIDGE Bridge
Upper Reach 10.212 CG 632.49 632.49 0 632.49 0 632.49 0 632.49 0
Upper Reach 10.192 632.4 632.4 0 632.4 0 632.4 0 632.4 0
Upper Reach 10.051 CF 631.32 631.32 0 631.32 0 631.32 0 631.32 0
Upper Reach 10.040 BENDER RD Bridge
Upper Reach 10.023 631.37 631.37 0 631.37 0 631.37 0 631.37 0
Upper Reach 10.009 CE 631.23 631.23 0 631.23 0 631.23 0 631.23 0
Upper Reach 9.846 CD 629.99 629.99 0 629.99 0 629.99 0 629.99 0
Upper Reach 9.669 CC 629.08 629.08 0 629.08 0 629.08 0 629.08 0
Upper Reach 9.427 CB 628.36 628.36 0 628.36 0 628.36 0 628.36 0
Upper Reach 9.125 CA 627.1 627.1 0 627.1 0 627.1 0 627.1 0
Upper Reach 8.963 BZ 626.63 626.63 0 626.63 0 626.63 0 626.63 0

C-10 MKE/110050005
TABLE C-2 Milwaukee River 100-Year Design Storm Event Comparison Between Pre-Project Model and Sheet Pile Cut-offs 1B and 1D Model
Lincoln Park/Milwaukee River Basis of Design Report
Reach River Sta
Pre-Project 100-year
Design Storm W.S. Elev (ft)
Phase 1 Sheet Pile Cut-Offs at
620 ft W.S. Elev (ft)
Difference (ft)
Phase 1 Sheet Pile Cut-Offs at
619 ft W.S. Elev (ft)
Difference (ft)
Phase 1 Sheet Pile Cut-Offs at
618 ft W.S. Elev (ft)
Difference (ft)
Phase 1 Sheet Pile Cut-Offs at
617 ft W.S. Elev (ft)
Difference (ft)
Upper Reach 8.783 626.18 626.18 0 626.18 0 626.18 0 626.18 0
Upper Reach 8.759 BY 626.13 626.13 0 626.13 0 626.13 0 626.13 0
Upper Reach
8.740 SILVER SPRING RD Bridge
Upper Reach 8.730 BX 625.99 625.99 0 625.99 0 625.99 0 625.99 0
Upper Reach 8.716 626 626 0 626 0 626 0 626 0
Upper Reach 8.660 BW 625.87 625.87 0 625.87 0 625.87 0 625.87 0
Upper Reach 8.579 BV 625.55 625.55 0 625.55 0 625.55 0 625.55 0
Upper Reach 8.394 BU 624.81 624.81 0 624.81 0 624.81 0 624.81 0
Upper Reach 8.381 623.95 623.96 0.01 623.96 0.01 623.96 0.01 623.96 0.01
Upper Reach 8.375 623.9 623.91 0.01 623.9 0 623.9 0 623.9 0
Upper Reach
8.360 RAILROAD BRIDGE Bridge
Upper Reach 8.357 622.63 622.64 0.01 622.64 0.01 622.64 0.01 622.64 0.01
Upper Reach 8.341 BT 623.11 623.12 0.01 623.12 0.01 623.12 0.01 623.12 0.01
Upper Reach 8.229 BS 623.01 623.02 0.01 623.01 0 623.01 0 623.01 0
Right Split 8.1551 623.19 623.16 -0.03 623.17 -0.02 623.16 -0.03 623.17 -0.02
Right Split 8.1451 623.13 623.13 0 623.13 0 623.13 0 623.13 0
Right Split
8.1420 MILWAUKEE RIVER Bridge
Right Split 8.1411 BR 623.12 623.12 0 623.12 0 623.12 0 623.12 0
Right Split 8.1311 623.13 623.13 0 623.13 0 623.13 0 623.12 -0.01
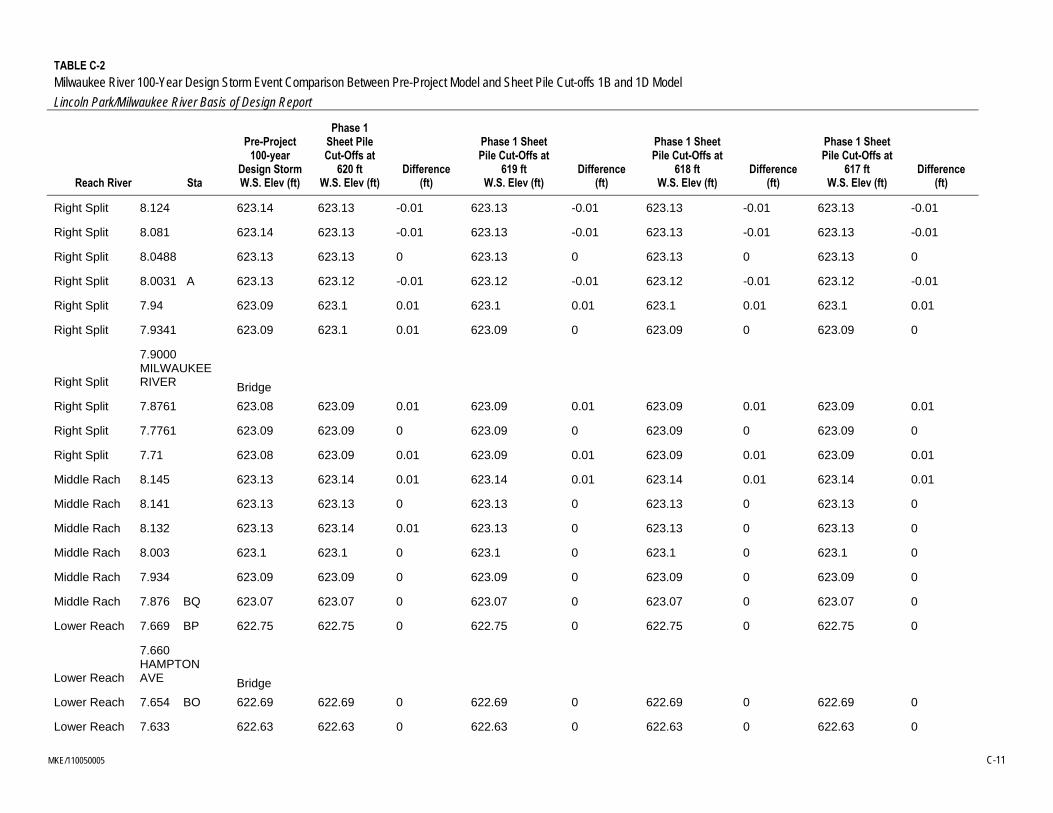
MKE/110050005 C-11
TABLE C-2 Milwaukee River 100-Year Design Storm Event Comparison Between Pre-Project Model and Sheet Pile Cut-offs 1B and 1D Model
Lincoln Park/Milwaukee River Basis of Design Report
Reach River Sta
Pre-Project 100-year
Design Storm W.S. Elev (ft)
Phase 1 Sheet Pile Cut-Offs at
620 ft W.S. Elev (ft)
Difference (ft)
Phase 1 Sheet Pile Cut-Offs at
619 ft W.S. Elev (ft)
Difference (ft)
Phase 1 Sheet Pile Cut-Offs at
618 ft W.S. Elev (ft)
Difference (ft)
Phase 1 Sheet Pile Cut-Offs at
617 ft W.S. Elev (ft)
Difference (ft)
Right Split 8.124 623.14 623.13 -0.01 623.13 -0.01 623.13 -0.01 623.13 -0.01
Right Split 8.081 623.14 623.13 -0.01 623.13 -0.01 623.13 -0.01 623.13 -0.01
Right Split 8.0488 623.13 623.13 0 623.13 0 623.13 0 623.13 0
Right Split 8.0031 A 623.13 623.12 -0.01 623.12 -0.01 623.12 -0.01 623.12 -0.01
Right Split 7.94 623.09 623.1 0.01 623.1 0.01 623.1 0.01 623.1 0.01
Right Split 7.9341 623.09 623.1 0.01 623.09 0 623.09 0 623.09 0
Right Split
7.9000 MILWAUKEE RIVER Bridge
Right Split 7.8761 623.08 623.09 0.01 623.09 0.01 623.09 0.01 623.09 0.01
Right Split 7.7761 623.09 623.09 0 623.09 0 623.09 0 623.09 0
Right Split 7.71 623.08 623.09 0.01 623.09 0.01 623.09 0.01 623.09 0.01
Middle Rach 8.145 623.13 623.14 0.01 623.14 0.01 623.14 0.01 623.14 0.01
Middle Rach 8.141 623.13 623.13 0 623.13 0 623.13 0 623.13 0
Middle Rach 8.132 623.13 623.14 0.01 623.13 0 623.13 0 623.13 0
Middle Rach 8.003 623.1 623.1 0 623.1 0 623.1 0 623.1 0
Middle Rach 7.934 623.09 623.09 0 623.09 0 623.09 0 623.09 0
Middle Rach 7.876 BQ 623.07 623.07 0 623.07 0 623.07 0 623.07 0
Lower Reach 7.669 BP 622.75 622.75 0 622.75 0 622.75 0 622.75 0
Lower Reach
7.660 HAMPTON AVE Bridge
Lower Reach 7.654 BO 622.69 622.69 0 622.69 0 622.69 0 622.69 0
Lower Reach 7.633 622.63 622.63 0 622.63 0 622.63 0 622.63 0
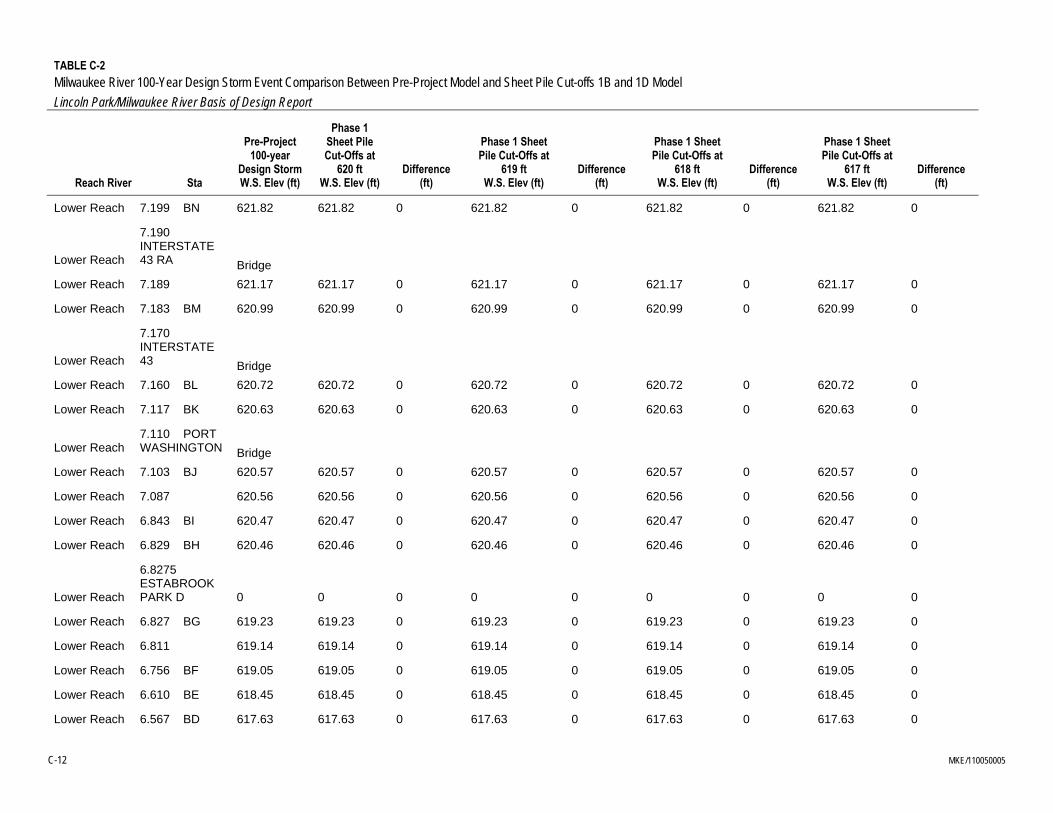
C-12 MKE/110050005
TABLE C-2 Milwaukee River 100-Year Design Storm Event Comparison Between Pre-Project Model and Sheet Pile Cut-offs 1B and 1D Model
Lincoln Park/Milwaukee River Basis of Design Report
Reach River Sta
Pre-Project 100-year
Design Storm W.S. Elev (ft)
Phase 1 Sheet Pile Cut-Offs at
620 ft W.S. Elev (ft)
Difference (ft)
Phase 1 Sheet Pile Cut-Offs at
619 ft W.S. Elev (ft)
Difference (ft)
Phase 1 Sheet Pile Cut-Offs at
618 ft W.S. Elev (ft)
Difference (ft)
Phase 1 Sheet Pile Cut-Offs at
617 ft W.S. Elev (ft)
Difference (ft)
Lower Reach 7.199 BN 621.82 621.82 0 621.82 0 621.82 0 621.82 0
Lower Reach
7.190 INTERSTATE 43 RA Bridge
Lower Reach 7.189 621.17 621.17 0 621.17 0 621.17 0 621.17 0
Lower Reach 7.183 BM 620.99 620.99 0 620.99 0 620.99 0 620.99 0
Lower Reach
7.170 INTERSTATE 43 Bridge
Lower Reach 7.160 BL 620.72 620.72 0 620.72 0 620.72 0 620.72 0
Lower Reach 7.117 BK 620.63 620.63 0 620.63 0 620.63 0 620.63 0
Lower Reach 7.110 PORT WASHINGTON Bridge
Lower Reach 7.103 BJ 620.57 620.57 0 620.57 0 620.57 0 620.57 0
Lower Reach 7.087 620.56 620.56 0 620.56 0 620.56 0 620.56 0
Lower Reach 6.843 BI 620.47 620.47 0 620.47 0 620.47 0 620.47 0
Lower Reach 6.829 BH 620.46 620.46 0 620.46 0 620.46 0 620.46 0
Lower Reach
6.8275 ESTABROOK PARK D 0 0 0 0 0 0 0 0 0
Lower Reach 6.827 BG 619.23 619.23 0 619.23 0 619.23 0 619.23 0
Lower Reach 6.811 619.14 619.14 0 619.14 0 619.14 0 619.14 0
Lower Reach 6.756 BF 619.05 619.05 0 619.05 0 619.05 0 619.05 0
Lower Reach 6.610 BE 618.45 618.45 0 618.45 0 618.45 0 618.45 0
Lower Reach 6.567 BD 617.63 617.63 0 617.63 0 617.63 0 617.63 0

MKE/110050005 C-13
TABLE C-2 Milwaukee River 100-Year Design Storm Event Comparison Between Pre-Project Model and Sheet Pile Cut-offs 1B and 1D Model
Lincoln Park/Milwaukee River Basis of Design Report
Reach River Sta
Pre-Project 100-year
Design Storm W.S. Elev (ft)
Phase 1 Sheet Pile Cut-Offs at
620 ft W.S. Elev (ft)
Difference (ft)
Phase 1 Sheet Pile Cut-Offs at
619 ft W.S. Elev (ft)
Difference (ft)
Phase 1 Sheet Pile Cut-Offs at
618 ft W.S. Elev (ft)
Difference (ft)
Phase 1 Sheet Pile Cut-Offs at
617 ft W.S. Elev (ft)
Difference (ft)
Lower Reach 6.54887* 617.48 617.48 0 617.48 0 617.48 0 617.48 0
Lower Reach 6.53075* 617.35 617.35 0 617.35 0 617.35 0 617.35 0
Lower Reach 6.51262* 617.21 617.21 0 617.21 0 617.21 0 617.21 0
Lower Reach 6.4945* 617.04 617.04 0 617.04 0 617.04 0 617.04 0
Lower Reach 6.47637* 616.82 616.82 0 616.82 0 616.82 0 616.82 0
Lower Reach 6.45825* 616.5 616.5 0 616.5 0 616.5 0 616.5 0
Lower Reach 6.44012* 615.99 615.99 0 615.99 0 615.99 0 615.99 0
Lower Reach 6.422 614.87 614.87 0 614.87 0 614.87 0 614.87 0
Lower Reach 6.408 BC 615.16 615.16 0 615.16 0 615.16 0 615.16 0
Lower Reach 6.405 C&NW RAILROAD Bridge
Lower Reach 6.403 BB 614.52 614.52 0 614.52 0 614.52 0 614.52 0
Lower Reach 6.38530* 614.37 614.37 0 614.37 0 614.37 0 614.37 0
Lower Reach 6.36761* 614.14 614.14 0 614.14 0 614.14 0 614.14 0
Lower Reach 6.34992* 613.92 613.92 0 613.92 0 613.92 0 613.92 0
Lower Reach 6.33223* 613.7 613.7 0 613.7 0 613.7 0 613.7 0
Lower Reach 6.31453* 613.47 613.47 0 613.47 0 613.47 0 613.47 0
Lower Reach 6.29684* 613.25 613.25 0 613.25 0 613.25 0 613.25 0
Lower Reach 6.27915* 613.03 613.03 0 613.03 0 613.03 0 613.03 0
Lower Reach 6.26146* 612.81 612.81 0 612.81 0 612.81 0 612.81 0
Lower Reach 6.24376* 612.59 612.59 0 612.59 0 612.59 0 612.59 0
Lower Reach 6.22607* 612.37 612.37 0 612.37 0 612.37 0 612.37 0
Lower Reach 6.20838* 612.16 612.16 0 612.16 0 612.16 0 612.16 0

C-14 MKE/110050005
TABLE C-2 Milwaukee River 100-Year Design Storm Event Comparison Between Pre-Project Model and Sheet Pile Cut-offs 1B and 1D Model
Lincoln Park/Milwaukee River Basis of Design Report
Reach River Sta
Pre-Project 100-year
Design Storm W.S. Elev (ft)
Phase 1 Sheet Pile Cut-Offs at
620 ft W.S. Elev (ft)
Difference (ft)
Phase 1 Sheet Pile Cut-Offs at
619 ft W.S. Elev (ft)
Difference (ft)
Phase 1 Sheet Pile Cut-Offs at
618 ft W.S. Elev (ft)
Difference (ft)
Phase 1 Sheet Pile Cut-Offs at
617 ft W.S. Elev (ft)
Difference (ft)
Lower Reach 6.19069* 611.94 611.94 0 611.94 0 611.94 0 611.94 0
Lower Reach 6.173 BA 611.72 611.72 0 611.72 0 611.72 0 611.72 0
Lower Reach 5.863 AZ 607.78 607.78 0 607.78 0 607.78 0 607.78 0
Lower Reach 5.642 605.12 605.12 0 605.12 0 605.12 0 605.12 0
Lower Reach 5.593 AY 604.99 604.99 0 604.99 0 604.99 0 604.99 0
Lower Reach 5.590 CAPITOL DR Bridge
Lower Reach 5.558 AX 604.72 604.72 0 604.72 0 604.72 0 604.72 0
Lower Reach 5.326 AW 603.51 603.51 0 603.51 0 603.51 0 603.51 0
Lower Reach 5.022 AV 602.49 602.49 0 602.49 0 602.49 0 602.49 0
Lower Reach 4.791 601.88 601.88 0 601.88 0 601.88 0 601.88 0
Lower Reach 4.542 AU 601.15 601.15 0 601.15 0 601.15 0 601.15 0
Lower Reach 4.45 600.83 600.83 0 600.83 0 600.83 0 600.83 0
Lower Reach 4.296 600.35 600.35 0 600.35 0 600.35 0 600.35 0
Lower Reach 4.194 AT 599.96 599.96 0 599.96 0 599.96 0 599.96 0
Lower Reach 4.180 LOCUST ST Bridge
Lower Reach 4.175 AS 599.52 599.52 0 599.52 0 599.52 0 599.52 0
Lower Reach 4.109 599.39 599.39 0 599.39 0 599.39 0 599.39 0
Lower Reach 3.938 598.95 598.95 0 598.95 0 598.95 0 598.95 0
Lower Reach 3.765 AR 598.48 598.48 0 598.48 0 598.48 0 598.48 0
Lower Reach 3.647 598.05 598.05 0 598.05 0 598.05 0 598.05 0
Lower Reach 3.496 597.63 597.63 0 597.63 0 597.63 0 597.63 0

MKE/110050005 C-15
TABLE C-2 Milwaukee River 100-Year Design Storm Event Comparison Between Pre-Project Model and Sheet Pile Cut-offs 1B and 1D Model
Lincoln Park/Milwaukee River Basis of Design Report
Reach River Sta
Pre-Project 100-year
Design Storm W.S. Elev (ft)
Phase 1 Sheet Pile Cut-Offs at
620 ft W.S. Elev (ft)
Difference (ft)
Phase 1 Sheet Pile Cut-Offs at
619 ft W.S. Elev (ft)
Difference (ft)
Phase 1 Sheet Pile Cut-Offs at
618 ft W.S. Elev (ft)
Difference (ft)
Phase 1 Sheet Pile Cut-Offs at
617 ft W.S. Elev (ft)
Difference (ft)
Lower Reach 3.391 596.8 596.8 0 596.8 0 596.8 0 596.8 0
Lower Reach 3.380 AQ 597.14 597.14 0 597.14 0 597.14 0 597.14 0
Lower Reach 3.370 NORTH AVE Bridge
Lower Reach 3.366 597.02 597.02 0 597.02 0 597.02 0 597.02 0
Lower Reach 3.360 AP 597.09 597.09 0 597.09 0 597.09 0 597.09 0
Lower Reach 3.348 596.16 596.16 0 596.16 0 596.16 0 596.16 0
Lower Reach 3.292 595.92 595.92 0 595.92 0 595.92 0 595.92 0
Lower Reach 3.252 AO 595.38 595.38 0 595.38 0 595.38 0 595.38 0
Lower Reach 3.220 AN 592.22 592.22 0 592.22 0 592.22 0 592.22 0
Lower Reach 3.21 584.28 584.28 0 584.28 0 584.28 0 584.28 0
Lower Reach 3.192 AM 585.9 585.9 0 585.9 0 585.9 0 585.9 0
Lower Reach 3.132 585.53 585.53 0 585.53 0 585.53 0 585.53 0
Lower Reach 3.101 584.46 584.46 0 584.46 0 584.46 0 584.46 0
Lower Reach 3.0821 584.95 584.95 0 584.95 0 584.95 0 584.95 0
Lower Reach 3.082 584.95 584.95 0 584.95 0 584.95 0 584.95 0
Lower Reach 3.05 585.03 585.03 0 585.03 0 585.03 0 585.03 0
Lower Reach 3.042 584.75 584.75 0 584.75 0 584.75 0 584.75 0
Lower Reach 3.032 584.73 584.73 0 584.73 0 584.73 0 584.73 0
Lower Reach 3.021 584.76 584.76 0 584.76 0 584.76 0 584.76 0
Lower Reach 3.019 AL 584.74 584.74 0 584.74 0 584.74 0 584.74 0
Lower Reach
3.010 HUMBOLDT AVE Bridge

C-16 MKE/110050005
TABLE C-2 Milwaukee River 100-Year Design Storm Event Comparison Between Pre-Project Model and Sheet Pile Cut-offs 1B and 1D Model
Lincoln Park/Milwaukee River Basis of Design Report
Reach River Sta
Pre-Project 100-year
Design Storm W.S. Elev (ft)
Phase 1 Sheet Pile Cut-Offs at
620 ft W.S. Elev (ft)
Difference (ft)
Phase 1 Sheet Pile Cut-Offs at
619 ft W.S. Elev (ft)
Difference (ft)
Phase 1 Sheet Pile Cut-Offs at
618 ft W.S. Elev (ft)
Difference (ft)
Phase 1 Sheet Pile Cut-Offs at
617 ft W.S. Elev (ft)
Difference (ft)
Lower Reach 3.006 AK 584.53 584.53 0 584.53 0 584.53 0 584.53 0
Lower Reach 2.875 584.62 584.62 0 584.62 0 584.62 0 584.62 0
Lower Reach 2.798 AJ 584.55 584.55 0 584.55 0 584.55 0 584.55 0
Lower Reach 2.692 584.47 584.47 0 584.47 0 584.47 0 584.47 0
Lower Reach 2.645 AI 584.45 584.45 0 584.45 0 584.45 0 584.45 0
Lower Reach 2.630 HOLTON ST Bridge
Lower Reach 2.626 AH 584.34 584.34 0 584.34 0 584.34 0 584.34 0
Lower Reach 2.472 AG 584.09 584.09 0 584.09 0 584.09 0 584.09 0
Lower Reach 2.378 AF 584.1 584.1 0 584.1 0 584.1 0 584.1 0
Lower Reach 2.360 PLEASANT ST Bridge
Lower Reach 2.356 AE 584.04 584.04 0 584.04 0 584.04 0 584.04 0
Lower Reach 2.235 AD 584.01 584.01 0 584.01 0 584.01 0 584.01 0
Lower Reach 2.178 583.8 583.8 0 583.8 0 583.8 0 583.8 0
Lower Reach 2.092 AC 583.87 583.87 0 583.87 0 583.87 0 583.87 0
Lower Reach 2.080 CHERRY ST Bridge
Lower Reach 2.074 AB 583.61 583.61 0 583.61 0 583.61 0 583.61 0
Lower Reach 2.072 583.61 583.61 0 583.61 0 583.61 0 583.61 0
Lower Reach 2.037 583.63 583.63 0 583.63 0 583.63 0 583.63 0
Lower Reach 2.006 583.6 583.6 0 583.6 0 583.6 0 583.6 0
Lower Reach 1.985 583.59 583.59 0 583.59 0 583.59 0 583.59 0
Lower Reach 1.957 AA 583.55 583.55 0 583.55 0 583.55 0 583.55 0

MKE/110050005 C-17
TABLE C-2 Milwaukee River 100-Year Design Storm Event Comparison Between Pre-Project Model and Sheet Pile Cut-offs 1B and 1D Model
Lincoln Park/Milwaukee River Basis of Design Report
Reach River Sta
Pre-Project 100-year
Design Storm W.S. Elev (ft)
Phase 1 Sheet Pile Cut-Offs at
620 ft W.S. Elev (ft)
Difference (ft)
Phase 1 Sheet Pile Cut-Offs at
619 ft W.S. Elev (ft)
Difference (ft)
Phase 1 Sheet Pile Cut-Offs at
618 ft W.S. Elev (ft)
Difference (ft)
Phase 1 Sheet Pile Cut-Offs at
617 ft W.S. Elev (ft)
Difference (ft)
Lower Reach 1.948 583.46 583.46 0 583.46 0 583.46 0 583.46 0
Lower Reach 1.947 583.46 583.46 0 583.46 0 583.46 0 583.46 0
Lower Reach 1.946 583.46 583.46 0 583.46 0 583.46 0 583.46 0
Lower Reach 1.945 583.45 583.45 0 583.45 0 583.45 0 583.45 0
Lower Reach 1.931 583.45 583.45 0 583.45 0 583.45 0 583.45 0
Lower Reach
1.908 MCKINLEY ST-KNAP Bridge
Lower Reach 1.891 583.21 583.21 0 583.21 0 583.21 0 583.21 0
Lower Reach 1.883 582.93 582.93 0 582.93 0 582.93 0 582.93 0
Lower Reach 1.863 583.03 583.03 0 583.03 0 583.03 0 583.03 0
Lower Reach 1.858 Z 582.73 582.73 0 582.73 0 582.73 0 582.73 0
Lower Reach 1.840 JUNEAU AVE Bridge
Lower Reach 1.838 Y 582.32 582.32 0 582.32 0 582.32 0 582.32 0
Lower Reach 1.764 582.35 582.35 0 582.35 0 582.35 0 582.35 0
Lower Reach 1.763 582.35 582.35 0 582.35 0 582.35 0 582.35 0
Lower Reach 1.762 582.35 582.35 0 582.35 0 582.35 0 582.35 0
Lower Reach 1.761 582.35 582.35 0 582.35 0 582.35 0 582.35 0
Lower Reach 1.76 582.34 582.34 0 582.34 0 582.34 0 582.34 0
Lower Reach
1.75 HIGHLAND AVE Bridge
Lower Reach 1.727 582.32 582.32 0 582.32 0 582.32 0 582.32 0
Lower Reach 1.719 582.33 582.33 0 582.33 0 582.33 0 582.33 0

C-18 MKE/110050005
TABLE C-2 Milwaukee River 100-Year Design Storm Event Comparison Between Pre-Project Model and Sheet Pile Cut-offs 1B and 1D Model
Lincoln Park/Milwaukee River Basis of Design Report
Reach River Sta
Pre-Project 100-year
Design Storm W.S. Elev (ft)
Phase 1 Sheet Pile Cut-Offs at
620 ft W.S. Elev (ft)
Difference (ft)
Phase 1 Sheet Pile Cut-Offs at
619 ft W.S. Elev (ft)
Difference (ft)
Phase 1 Sheet Pile Cut-Offs at
618 ft W.S. Elev (ft)
Difference (ft)
Phase 1 Sheet Pile Cut-Offs at
617 ft W.S. Elev (ft)
Difference (ft)
Lower Reach 1.677 582.33 582.33 0 582.33 0 582.33 0 582.33 0
Lower Reach 1.676 582.33 582.33 0 582.33 0 582.33 0 582.33 0
Lower Reach 1.6755 582.33 582.33 0 582.33 0 582.33 0 582.33 0
Lower Reach 1.675 582.32 582.32 0 582.32 0 582.32 0 582.32 0
Lower Reach 1.674 582.33 582.33 0 582.33 0 582.33 0 582.33 0
Lower Reach 1.673 X 582.31 582.31 0 582.31 0 582.31 0 582.31 0
Lower Reach 1.660 STATE ST Bridge
Lower Reach 1.655 W 582.14 582.14 0 582.14 0 582.14 0 582.14 0
Lower Reach 1.651 582.13 582.13 0 582.13 0 582.13 0 582.13 0
Lower Reach 1.579 V 582.14 582.14 0 582.14 0 582.14 0 582.14 0
Lower Reach
1.570 KILBOURN AVE Bridge
Lower Reach 1.56 581.83 581.83 0 581.83 0 581.83 0 581.83 0
Lower Reach 1.552 581.8 581.8 0 581.8 0 581.8 0 581.8 0
Lower Reach 1.523 581.74 581.74 0 581.74 0 581.74 0 581.74 0
Lower Reach 1.522 U 581.74 581.74 0 581.74 0 581.74 0 581.74 0
Lower Reach 1.521 581.73 581.73 0 581.73 0 581.73 0 581.73 0
Lower Reach 1.52 581.73 581.73 0 581.73 0 581.73 0 581.73 0
Lower Reach 1.519 581.73 581.73 0 581.73 0 581.73 0 581.73 0
Lower Reach 1.515 581.72 581.72 0 581.72 0 581.72 0 581.72 0
Lower Reach 1.483 T 581.69 581.69 0 581.69 0 581.69 0 581.69 0
Lower Reach 1.470 Bridge

MKE/110050005 C-19
TABLE C-2 Milwaukee River 100-Year Design Storm Event Comparison Between Pre-Project Model and Sheet Pile Cut-offs 1B and 1D Model
Lincoln Park/Milwaukee River Basis of Design Report
Reach River Sta
Pre-Project 100-year
Design Storm W.S. Elev (ft)
Phase 1 Sheet Pile Cut-Offs at
620 ft W.S. Elev (ft)
Difference (ft)
Phase 1 Sheet Pile Cut-Offs at
619 ft W.S. Elev (ft)
Difference (ft)
Phase 1 Sheet Pile Cut-Offs at
618 ft W.S. Elev (ft)
Difference (ft)
Phase 1 Sheet Pile Cut-Offs at
617 ft W.S. Elev (ft)
Difference (ft)
WELLS ST
Lower Reach 1.464 S 581.61 581.61 0 581.61 0 581.61 0 581.61 0
Lower Reach 1.445 581.63 581.63 0 581.63 0 581.63 0 581.63 0
Lower Reach 1.444 581.63 581.63 0 581.63 0 581.63 0 581.63 0
Lower Reach 1.443 581.62 581.62 0 581.62 0 581.62 0 581.62 0
Lower Reach 1.442 581.62 581.62 0 581.62 0 581.62 0 581.62 0
Lower Reach 1.441 581.63 581.63 0 581.63 0 581.63 0 581.63 0
Lower Reach 1.436 581.64 581.64 0 581.64 0 581.64 0 581.64 0
Lower Reach 1.4359 581.64 581.64 0 581.64 0 581.64 0 581.64 0
Lower Reach 1.4358 581.64 581.64 0 581.64 0 581.64 0 581.64 0
Lower Reach 1.4357 581.64 581.64 0 581.64 0 581.64 0 581.64 0
Lower Reach 1.4356 581.64 581.64 0 581.64 0 581.64 0 581.64 0
Lower Reach 1.416 581.59 581.59 0 581.59 0 581.59 0 581.59 0
Lower Reach 1.341 581.58 581.58 0 581.58 0 581.58 0 581.58 0
Lower Reach 1.34 581.58 581.58 0 581.58 0 581.58 0 581.58 0
Lower Reach 1.339 581.58 581.58 0 581.58 0 581.58 0 581.58 0
Lower Reach 1.338 581.58 581.58 0 581.58 0 581.58 0 581.58 0
Lower Reach 1.337 R 581.53 581.53 0 581.53 0 581.53 0 581.53 0
Lower Reach
1.320 WISCONSIN AVE Bridge
Lower Reach 1.313 Q 581.42 581.42 0 581.42 0 581.42 0 581.42 0
Lower Reach 1.312 581.41 581.41 0 581.41 0 581.41 0 581.41 0

C-20 MKE/110050005
TABLE C-2 Milwaukee River 100-Year Design Storm Event Comparison Between Pre-Project Model and Sheet Pile Cut-offs 1B and 1D Model
Lincoln Park/Milwaukee River Basis of Design Report
Reach River Sta
Pre-Project 100-year
Design Storm W.S. Elev (ft)
Phase 1 Sheet Pile Cut-Offs at
620 ft W.S. Elev (ft)
Difference (ft)
Phase 1 Sheet Pile Cut-Offs at
619 ft W.S. Elev (ft)
Difference (ft)
Phase 1 Sheet Pile Cut-Offs at
618 ft W.S. Elev (ft)
Difference (ft)
Phase 1 Sheet Pile Cut-Offs at
617 ft W.S. Elev (ft)
Difference (ft)
Lower Reach 1.311 581.4 581.4 0 581.4 0 581.4 0 581.4 0
Lower Reach 1.31 581.4 581.4 0 581.4 0 581.4 0 581.4 0
Lower Reach 1.309 581.39 581.39 0 581.39 0 581.39 0 581.39 0
Lower Reach 1.308 581.39 581.39 0 581.39 0 581.39 0 581.39 0
Lower Reach 1.307 581.4 581.4 0 581.4 0 581.4 0 581.4 0
Lower Reach 1.306 581.4 581.4 0 581.4 0 581.4 0 581.4 0
Lower Reach 1.305 581.4 581.4 0 581.4 0 581.4 0 581.4 0
Lower Reach 1.241 P 581.39 581.39 0 581.39 0 581.39 0 581.39 0
Lower Reach 1.230 MICHIGAN ST Bridge
Lower Reach 1.222 O 581.15 581.15 0 581.15 0 581.15 0 581.15 0
Lower Reach 1.16 PIERS FOR RIVERW Bridge
Lower Reach 1.153 N 581.16 581.16 0 581.16 0 581.16 0 581.16 0
Lower Reach
1.140 CLYBOURN ST Bridge
Lower Reach 1.134 M 581.06 581.06 0 581.06 0 581.06 0 581.06 0
Lower Reach
1.100 INTERSTATE 794 Bridge
Lower Reach 1.097 581.04 581.04 0 581.04 0 581.04 0 581.04 0
Lower Reach 1.07 PIERS FOR RIVERW Bridge
Lower Reach 1.063 L 581.04 581.04 0 581.04 0 581.04 0 581.04 0

MKE/110050005 C-21
TABLE C-2 Milwaukee River 100-Year Design Storm Event Comparison Between Pre-Project Model and Sheet Pile Cut-offs 1B and 1D Model
Lincoln Park/Milwaukee River Basis of Design Report
Reach River Sta
Pre-Project 100-year
Design Storm W.S. Elev (ft)
Phase 1 Sheet Pile Cut-Offs at
620 ft W.S. Elev (ft)
Difference (ft)
Phase 1 Sheet Pile Cut-Offs at
619 ft W.S. Elev (ft)
Difference (ft)
Phase 1 Sheet Pile Cut-Offs at
618 ft W.S. Elev (ft)
Difference (ft)
Phase 1 Sheet Pile Cut-Offs at
617 ft W.S. Elev (ft)
Difference (ft)
Lower Reach 1.050 ST. PAUL ST Bridge
Lower Reach 1.047 K 580.99 580.99 0 580.99 0 580.99 0 580.99 0
Lower Reach 1.023 PIERS FOR RIVERW Bridge
Lower Reach 0.999 J 581 581 0 581 0 581 0 581 0
Lower Reach .990 PIERS FOR RIVERW Bridge
Lower Reach 0.982 I 581 581 0 581 0 581 0 581 0
Lower Reach .900 PIERS FOR RIVERW Bridge
Lower Reach 0.880 H 580.89 580.89 0 580.89 0 580.89 0 580.89 0
Lower Reach 0.843 580.91 580.91 0 580.91 0 580.91 0 580.91 0
Lower Reach 0.808 580.94 580.94 0 580.94 0 580.94 0 580.94 0
Lower Reach 0.787 G 580.4 580.4 0 580.4 0 580.4 0 580.4 0
Lower Reach 0.775 WATER ST Bridge
Lower Reach 0.769 F 580.03 580.03 0 580.03 0 580.03 0 580.03 0
Lower Reach 0.715 580.08 580.08 0 580.08 0 580.08 0 580.08 0
Lower Reach .7125 PIERS FOR RIVERW Bridge
Lower Reach 0.71 580.07 580.07 0 580.07 0 580.07 0 580.07 0
Lower Reach 0.6394 580.07 580.07 0 580.07 0 580.07 0 580.07 0
Lower Reach 0.6393 580.08 580.08 0 580.08 0 580.08 0 580.08 0
Lower Reach 0.6391 580.07 580.07 0 580.07 0 580.07 0 580.07 0

C-22 MKE/110050005
TABLE C-2 Milwaukee River 100-Year Design Storm Event Comparison Between Pre-Project Model and Sheet Pile Cut-offs 1B and 1D Model
Lincoln Park/Milwaukee River Basis of Design Report
Reach River Sta
Pre-Project 100-year
Design Storm W.S. Elev (ft)
Phase 1 Sheet Pile Cut-Offs at
620 ft W.S. Elev (ft)
Difference (ft)
Phase 1 Sheet Pile Cut-Offs at
619 ft W.S. Elev (ft)
Difference (ft)
Phase 1 Sheet Pile Cut-Offs at
618 ft W.S. Elev (ft)
Difference (ft)
Phase 1 Sheet Pile Cut-Offs at
617 ft W.S. Elev (ft)
Difference (ft)
Lower Reach 0.639 580.05 580.05 0 580.05 0 580.05 0 580.05 0
Lower Reach 0.638 E 580.05 580.05 0 580.05 0 580.05 0 580.05 0
Lower Reach
0.630 BROADWAY ST Bridge
Lower Reach 0.623 D 579.62 579.62 0 579.62 0 579.62 0 579.62 0
Lower Reach 0.6225 579.61 579.61 0 579.61 0 579.61 0 579.61 0
Lower Reach 0.622 579.61 579.61 0 579.61 0 579.61 0 579.61 0
Lower Reach 0.621 579.61 579.61 0 579.61 0 579.61 0 579.61 0
Lower Reach 0.62 579.61 579.61 0 579.61 0 579.61 0 579.61 0
Lower Reach 0.619 579.65 579.65 0 579.65 0 579.65 0 579.65 0
Lower Reach 0.618 579.52 579.52 0 579.52 0 579.52 0 579.52 0
Lower Reach 0.544 579.55 579.55 0 579.55 0 579.55 0 579.55 0
Lower Reach 0.452 C 579.54 579.54 0 579.54 0 579.54 0 579.54 0
Lower Reach 0.441 579.54 579.54 0 579.54 0 579.54 0 579.54 0
Lower Reach 0.44 C&NW RAILROAD Bridge
Lower Reach 0.403 B 579.46 579.46 0 579.46 0 579.46 0 579.46 0
Lower Reach 0.190 A 579.5 579.5 0 579.5 0 579.5 0 579.5 0

MKE/110050005 C-23
TABLE C-3 Milwaukee River 100-year Design Storm Event Comparison Between Pre-Project Model and Sheet Pile Cut-offs 2A and 2B Model
Lincoln Park/Milwaukee River Basis of Design Report
Pre-Project 100-year Design Storm
Event (ft)
Phase 2 Sheet Pile Cut-Offs at elevation
620 ft (100-year Storm Event) (ft)
Difference (ft)
Phase 2 Sheet Pile Cut-Offs at elevation 619 ft (100-year storm
event) (ft) Difference
(ft)
Phase 2 Sheet Pile Cut-Offs at elevation
618 ft (100-year storm event) (ft)
Difference (ft)
Phase 2 Sheet Pile Cut-Offs at
elevation 617 ft (100-year
storm event) (ft)
Difference (ft)
Reach River Sta W.S. Elev W.S. Elev W.S. Elev W.S. Elev W.S. Elev
Upper Reach 15.337 DD 650.69 650.69 0 650.69 0 650.69 0 650.69 0
Upper Reach 15.307 650.65 650.65 0 650.65 0 650.65 0 650.65 0
Upper Reach
15.300 BROWN DEER RD Bridge
Upper Reach 15.279 DC 650.47 650.47 0 650.47 0 650.47 0 650.47 0
Upper Reach 15.27 650.57 650.57 0 650.57 0 650.57 0 650.57 0
Upper Reach 14.874 DB 650.25 650.25 0 650.25 0 650.25 0 650.25 0
Upper Reach 14.379 DA 649.92 649.92 0 649.92 0 649.92 0 649.92 0
Upper Reach 14.091 CZ 649.55 649.55 0 649.55 0 649.55 0 649.55 0
Upper Reach 14.083 649.46 649.46 0 649.46 0 649.46 0 649.46 0
Upper Reach
14.070 RANGE LINE RD Bridge
Upper Reach 14.062 649.2 649.2 0 649.2 0 649.2 0 649.2 0
Upper Reach 14.035 CY 649.18 649.18 0 649.18 0 649.18 0 649.18 0
Upper Reach 13.766 CX 648.78 648.78 0 648.78 0 648.78 0 648.78 0
Upper Reach 13.414 CW 648.15 648.15 0 648.15 0 648.15 0 648.15 0
Upper Reach
13.400 PEDESTRIAN BRIDG Bridge
Upper Reach 13.399 648.06 648.06 0 648.06 0 648.06 0 648.06 0
Upper Reach 13.394 648.04 648.04 0 648.04 0 648.04 0 648.04 0

C-24 MKE/110050005
TABLE C-3 Milwaukee River 100-year Design Storm Event Comparison Between Pre-Project Model and Sheet Pile Cut-offs 2A and 2B Model
Lincoln Park/Milwaukee River Basis of Design Report
Pre-Project 100-year Design Storm
Event (ft)
Phase 2 Sheet Pile Cut-Offs at elevation
620 ft (100-year Storm Event) (ft)
Difference (ft)
Phase 2 Sheet Pile Cut-Offs at elevation 619 ft (100-year storm
event) (ft) Difference
(ft)
Phase 2 Sheet Pile Cut-Offs at elevation
618 ft (100-year storm event) (ft)
Difference (ft)
Phase 2 Sheet Pile Cut-Offs at
elevation 617 ft (100-year
storm event) (ft)
Difference (ft)
Reach River Sta W.S. Elev W.S. Elev W.S. Elev W.S. Elev W.S. Elev
Upper Reach 13.089 CV 647.21 647.21 0 647.21 0 647.21 0 647.21 0
Upper Reach 13.079 647.14 647.14 0 647.14 0 647.14 0 647.14 0
Upper Reach
13.070 PEDESTRIAN BRIDG Bridge
Upper Reach 13.069 646.1 646.1 0 646.1 0 646.1 0 646.1 0
Upper Reach 13.068 CU 646.18 646.18 0 646.18 0 646.18 0 646.18 0
Upper Reach 12.890 CT 644.79 644.79 0 644.79 0 644.79 0 644.79 0
Upper Reach 12.481 CS 641.9 641.9 0 641.9 0 641.9 0 641.9 0
Upper Reach 12.131 CR 640.16 640.16 0 640.16 0 640.16 0 640.16 0
Upper Reach 11.960 CQ 639.56 639.56 0 639.56 0 639.56 0 639.56 0
Upper Reach 11.955 639.61 639.61 0 639.61 0 639.61 0 639.61 0
Upper Reach
11.940 GOOD HOPE RD Bridge
Upper Reach 11.923 639.21 639.21 0 639.21 0 639.21 0 639.21 0
Upper Reach 11.919 CP 639.01 639.01 0 639.01 0 639.01 0 639.01 0
Upper Reach 11.795 CO 638.53 638.53 0 638.53 0 638.53 0 638.53 0
Upper Reach 11.573 636.61 636.61 0 636.61 0 636.61 0 636.61 0
Upper Reach 11.55 636.51 636.5 -0.01 636.51 0 636.51 0 636.51 0
Upper Reach 11.537 CN 636.38 636.38 0 636.38 0 636.38 0 636.38 0
Upper Reach 11.530 GREEN TREE Bridge
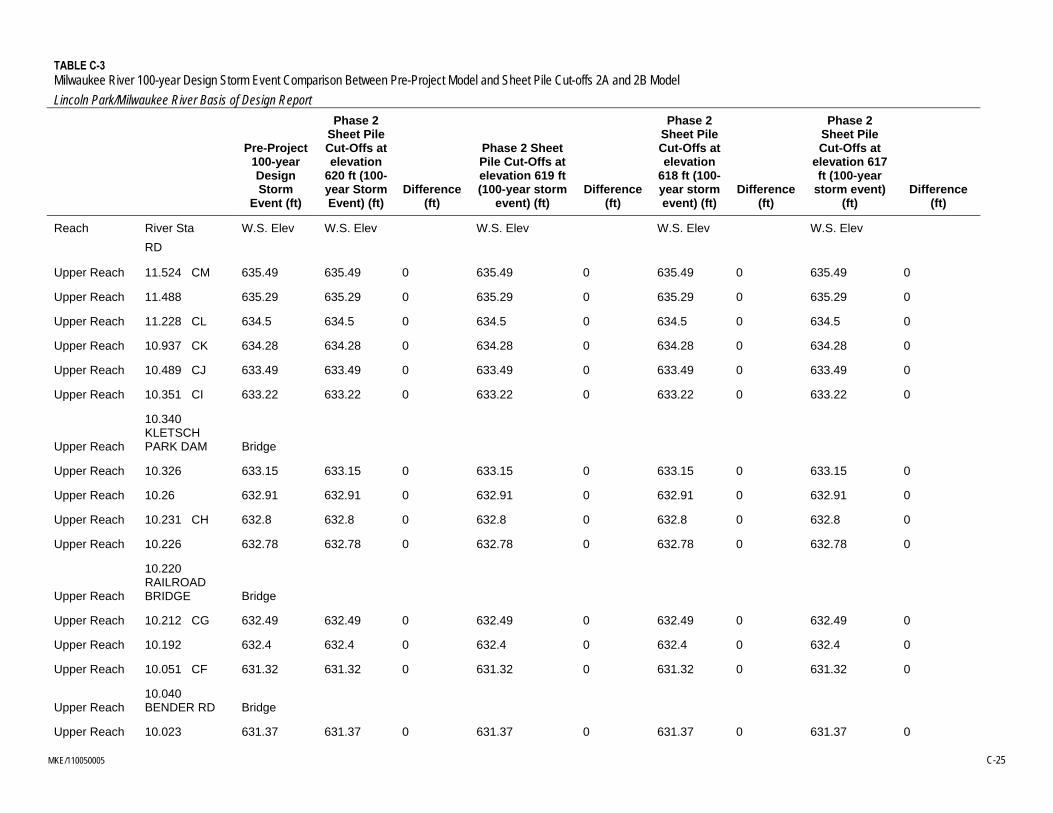
MKE/110050005 C-25
TABLE C-3 Milwaukee River 100-year Design Storm Event Comparison Between Pre-Project Model and Sheet Pile Cut-offs 2A and 2B Model
Lincoln Park/Milwaukee River Basis of Design Report
Pre-Project 100-year Design Storm
Event (ft)
Phase 2 Sheet Pile Cut-Offs at elevation
620 ft (100-year Storm Event) (ft)
Difference (ft)
Phase 2 Sheet Pile Cut-Offs at elevation 619 ft (100-year storm
event) (ft) Difference
(ft)
Phase 2 Sheet Pile Cut-Offs at elevation
618 ft (100-year storm event) (ft)
Difference (ft)
Phase 2 Sheet Pile Cut-Offs at
elevation 617 ft (100-year
storm event) (ft)
Difference (ft)
Reach River Sta W.S. Elev W.S. Elev W.S. Elev W.S. Elev W.S. Elev
RD
Upper Reach 11.524 CM 635.49 635.49 0 635.49 0 635.49 0 635.49 0
Upper Reach 11.488 635.29 635.29 0 635.29 0 635.29 0 635.29 0
Upper Reach 11.228 CL 634.5 634.5 0 634.5 0 634.5 0 634.5 0
Upper Reach 10.937 CK 634.28 634.28 0 634.28 0 634.28 0 634.28 0
Upper Reach 10.489 CJ 633.49 633.49 0 633.49 0 633.49 0 633.49 0
Upper Reach 10.351 CI 633.22 633.22 0 633.22 0 633.22 0 633.22 0
Upper Reach
10.340 KLETSCH PARK DAM Bridge
Upper Reach 10.326 633.15 633.15 0 633.15 0 633.15 0 633.15 0
Upper Reach 10.26 632.91 632.91 0 632.91 0 632.91 0 632.91 0
Upper Reach 10.231 CH 632.8 632.8 0 632.8 0 632.8 0 632.8 0
Upper Reach 10.226 632.78 632.78 0 632.78 0 632.78 0 632.78 0
Upper Reach
10.220 RAILROAD BRIDGE Bridge
Upper Reach 10.212 CG 632.49 632.49 0 632.49 0 632.49 0 632.49 0
Upper Reach 10.192 632.4 632.4 0 632.4 0 632.4 0 632.4 0
Upper Reach 10.051 CF 631.32 631.32 0 631.32 0 631.32 0 631.32 0
Upper Reach 10.040 BENDER RD Bridge
Upper Reach 10.023 631.37 631.37 0 631.37 0 631.37 0 631.37 0

C-26 MKE/110050005
TABLE C-3 Milwaukee River 100-year Design Storm Event Comparison Between Pre-Project Model and Sheet Pile Cut-offs 2A and 2B Model
Lincoln Park/Milwaukee River Basis of Design Report
Pre-Project 100-year Design Storm
Event (ft)
Phase 2 Sheet Pile Cut-Offs at elevation
620 ft (100-year Storm Event) (ft)
Difference (ft)
Phase 2 Sheet Pile Cut-Offs at elevation 619 ft (100-year storm
event) (ft) Difference
(ft)
Phase 2 Sheet Pile Cut-Offs at elevation
618 ft (100-year storm event) (ft)
Difference (ft)
Phase 2 Sheet Pile Cut-Offs at
elevation 617 ft (100-year
storm event) (ft)
Difference (ft)
Reach River Sta W.S. Elev W.S. Elev W.S. Elev W.S. Elev W.S. Elev
Upper Reach 10.009 CE 631.23 631.23 0 631.23 0 631.23 0 631.23 0
Upper Reach 9.846 CD 629.99 629.99 0 629.99 0 629.99 0 629.99 0
Upper Reach 9.669 CC 629.08 629.08 0 629.08 0 629.08 0 629.08 0
Upper Reach 9.427 CB 628.36 628.36 0 628.36 0 628.36 0 628.36 0
Upper Reach 9.125 CA 627.1 627.1 0 627.1 0 627.1 0 627.1 0
Upper Reach 8.963 BZ 626.63 626.63 0 626.63 0 626.63 0 626.63 0
Upper Reach 8.783 626.18 626.18 0 626.18 0 626.18 0 626.18 0
Upper Reach 8.759 BY 626.13 626.13 0 626.13 0 626.13 0 626.13 0
Upper Reach
8.740 SILVER SPRING RD Bridge
Upper Reach 8.730 BX 625.99 625.99 0 625.99 0 625.99 0 625.99 0
Upper Reach 8.716 626 626 0 626 0 626 0 626 0
Upper Reach 8.660 BW 625.87 625.87 0 625.87 0 625.87 0 625.87 0
Upper Reach 8.579 BV 625.55 625.55 0 625.55 0 625.55 0 625.55 0
Upper Reach 8.394 BU 624.81 624.81 0 624.81 0 624.81 0 624.81 0
Upper Reach 8.381 623.95 623.96 0.01 623.96 0.01 623.96 0.01 623.96 0.01
Upper Reach 8.375 623.9 623.91 0.01 623.9 0 623.9 0 623.9 0
Upper Reach
8.360 RAILROAD BRIDGE Bridge
Upper Reach 8.357 622.63 622.64 0.01 622.64 0.01 622.64 0.01 622.64 0.01

MKE/110050005 C-27
TABLE C-3 Milwaukee River 100-year Design Storm Event Comparison Between Pre-Project Model and Sheet Pile Cut-offs 2A and 2B Model
Lincoln Park/Milwaukee River Basis of Design Report
Pre-Project 100-year Design Storm
Event (ft)
Phase 2 Sheet Pile Cut-Offs at elevation
620 ft (100-year Storm Event) (ft)
Difference (ft)
Phase 2 Sheet Pile Cut-Offs at elevation 619 ft (100-year storm
event) (ft) Difference
(ft)
Phase 2 Sheet Pile Cut-Offs at elevation
618 ft (100-year storm event) (ft)
Difference (ft)
Phase 2 Sheet Pile Cut-Offs at
elevation 617 ft (100-year
storm event) (ft)
Difference (ft)
Reach River Sta W.S. Elev W.S. Elev W.S. Elev W.S. Elev W.S. Elev
Upper Reach 8.341 BT 623.11 623.12 0.01 623.12 0.01 623.12 0.01 623.12 0.01
Upper Reach 8.229 BS 623.01 623.02 0.01 623.01 0 623.01 0 623.01 0
Right Split 8.1551 623.19 623.17 -0.02 623.19 0 623.18 -0.01 623.17 -0.02
Right Split 8.1451 623.13 623.15 0.02 623.15 0.02 623.14 0.01 623.14 0.01
Right Split
8.1420 MILWAUKEE RIVER Bridge
Right Split 8.1411 BR 623.12 623.14 0.02 623.14 0.02 623.13 0.01 623.13 0.01
Right Split 8.1311 623.13 623.15 0.02 623.15 0.02 623.14 0.01 623.13 0
Right Split 8.124 623.14 623.15 0.01 623.15 0.01 623.14 0 623.14 0
Right Split 8.081 623.14 623.15 0.01 623.15 0.01 623.14 0 623.14 0
Right Split 8.0488 623.13 623.15 0.02 623.15 0.02 623.14 0.01 623.13 0
Right Split 8.0031 A 623.13 623.14 0.01 623.14 0.01 623.13 0 623.13 0
Right Split 7.94 623.09 623.12 0.03 623.12 0.03 623.11 0.02 623.1 0.01
Right Split 7.9341 623.09 623.12 0.03 623.11 0.02 623.11 0.02 623.1 0.01
Right Split
7.9000 MILWAUKEE RIVER Bridge
Right Split 7.8761 623.08 623.12 0.04 623.11 0.03 623.1 0.02 623.1 0.02
Right Split 7.7761 623.09 623.12 0.03 623.11 0.02 623.1 0.01 623.1 0.01
Right Split 7.71 623.08 623.09 0.01 623.09 0.01 623.09 0.01 623.09 0.01
Middle Rach 8.145 623.13 623.14 0.01 623.14 0.01 623.14 0.01 623.14 0.01

C-28 MKE/110050005
TABLE C-3 Milwaukee River 100-year Design Storm Event Comparison Between Pre-Project Model and Sheet Pile Cut-offs 2A and 2B Model
Lincoln Park/Milwaukee River Basis of Design Report
Pre-Project 100-year Design Storm
Event (ft)
Phase 2 Sheet Pile Cut-Offs at elevation
620 ft (100-year Storm Event) (ft)
Difference (ft)
Phase 2 Sheet Pile Cut-Offs at elevation 619 ft (100-year storm
event) (ft) Difference
(ft)
Phase 2 Sheet Pile Cut-Offs at elevation
618 ft (100-year storm event) (ft)
Difference (ft)
Phase 2 Sheet Pile Cut-Offs at
elevation 617 ft (100-year
storm event) (ft)
Difference (ft)
Reach River Sta W.S. Elev W.S. Elev W.S. Elev W.S. Elev W.S. Elev
Middle Rach 8.141 623.13 623.13 0 623.13 0 623.13 0 623.13 0
Middle Rach 8.132 623.13 623.14 0.01 623.13 0 623.13 0 623.13 0
Middle Rach 8.003 623.1 623.1 0 623.1 0 623.1 0 623.1 0
Middle Rach 7.934 623.09 623.08 -0.01 623.09 0 623.09 0 623.09 0
Middle Rach 7.876 BQ 623.07 623.07 0 623.07 0 623.07 0 623.07 0
Lower Reach 7.669 BP 622.75 622.75 0 622.75 0 622.75 0 622.75 0
Lower Reach
7.660 HAMPTON AVE Bridge
Lower Reach 7.654 BO 622.69 622.69 0 622.69 0 622.69 0 622.69 0
Lower Reach 7.633 622.63 622.63 0 622.63 0 622.63 0 622.63 0
Lower Reach 7.199 BN 621.82 621.82 0 621.82 0 621.82 0 621.82 0
Lower Reach
7.190 INTERSTATE 43 RA Bridge
Lower Reach 7.189 621.17 621.17 0 621.17 0 621.17 0 621.17 0
Lower Reach 7.183 BM 620.99 620.99 0 620.99 0 620.99 0 620.99 0
Lower Reach
7.170 INTERSTATE 43 Bridge
Lower Reach 7.160 BL 620.72 620.72 0 620.72 0 620.72 0 620.72 0
Lower Reach 7.117 BK 620.63 620.63 0 620.63 0 620.63 0 620.63 0
Lower Reach 7.110 PORT WASHINGTON Bridge

MKE/110050005 C-29
TABLE C-3 Milwaukee River 100-year Design Storm Event Comparison Between Pre-Project Model and Sheet Pile Cut-offs 2A and 2B Model
Lincoln Park/Milwaukee River Basis of Design Report
Pre-Project 100-year Design Storm
Event (ft)
Phase 2 Sheet Pile Cut-Offs at elevation
620 ft (100-year Storm Event) (ft)
Difference (ft)
Phase 2 Sheet Pile Cut-Offs at elevation 619 ft (100-year storm
event) (ft) Difference
(ft)
Phase 2 Sheet Pile Cut-Offs at elevation
618 ft (100-year storm event) (ft)
Difference (ft)
Phase 2 Sheet Pile Cut-Offs at
elevation 617 ft (100-year
storm event) (ft)
Difference (ft)
Reach River Sta W.S. Elev W.S. Elev W.S. Elev W.S. Elev W.S. Elev
Lower Reach 7.103 BJ 620.57 620.57 0 620.57 0 620.57 0 620.57 0
Lower Reach 7.087 620.56 620.56 0 620.56 0 620.56 0 620.56 0
Lower Reach 6.843 BI 620.47 620.47 0 620.47 0 620.47 0 620.47 0
Lower Reach 6.829 BH 620.46 620.46 0 620.46 0 620.46 0 620.46 0
Lower Reach
6.8275 ESTABROOK PARK D Bridge
Lower Reach 6.827 BG 619.23 619.23 0 619.23 0 619.23 0 619.23 0
Lower Reach 6.811 619.14 619.14 0 619.14 0 619.14 0 619.14 0
Lower Reach 6.756 BF 619.05 619.05 0 619.05 0 619.05 0 619.05 0
Lower Reach 6.610 BE 618.45 618.45 0 618.45 0 618.45 0 618.45 0
Lower Reach 6.567 BD 617.63 617.63 0 617.63 0 617.63 0 617.63 0
Lower Reach 6.54887* 617.48 617.48 0 617.48 0 617.48 0 617.48 0
Lower Reach 6.53075* 617.35 617.35 0 617.35 0 617.35 0 617.35 0
Lower Reach 6.51262* 617.21 617.21 0 617.21 0 617.21 0 617.21 0
Lower Reach 6.4945* 617.04 617.04 0 617.04 0 617.04 0 617.04 0
Lower Reach 6.47637* 616.82 616.82 0 616.82 0 616.82 0 616.82 0
Lower Reach 6.45825* 616.5 616.5 0 616.5 0 616.5 0 616.5 0
Lower Reach 6.44012* 615.99 615.99 0 615.99 0 615.99 0 615.99 0
Lower Reach 6.422 614.87 614.87 0 614.87 0 614.87 0 614.87 0
Lower Reach 6.408 BC 615.16 615.16 0 615.16 0 615.16 0 615.16 0
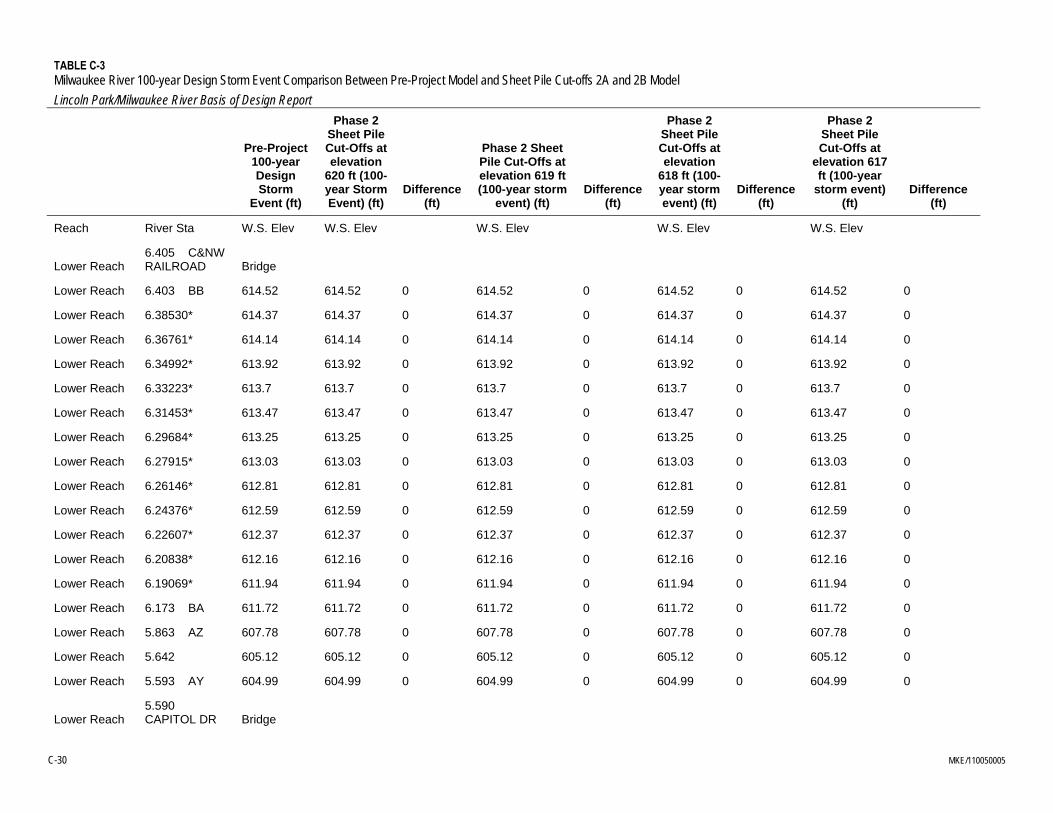
C-30 MKE/110050005
TABLE C-3 Milwaukee River 100-year Design Storm Event Comparison Between Pre-Project Model and Sheet Pile Cut-offs 2A and 2B Model
Lincoln Park/Milwaukee River Basis of Design Report
Pre-Project 100-year Design Storm
Event (ft)
Phase 2 Sheet Pile Cut-Offs at elevation
620 ft (100-year Storm Event) (ft)
Difference (ft)
Phase 2 Sheet Pile Cut-Offs at elevation 619 ft (100-year storm
event) (ft) Difference
(ft)
Phase 2 Sheet Pile Cut-Offs at elevation
618 ft (100-year storm event) (ft)
Difference (ft)
Phase 2 Sheet Pile Cut-Offs at
elevation 617 ft (100-year
storm event) (ft)
Difference (ft)
Reach River Sta W.S. Elev W.S. Elev W.S. Elev W.S. Elev W.S. Elev
Lower Reach 6.405 C&NW RAILROAD Bridge
Lower Reach 6.403 BB 614.52 614.52 0 614.52 0 614.52 0 614.52 0
Lower Reach 6.38530* 614.37 614.37 0 614.37 0 614.37 0 614.37 0
Lower Reach 6.36761* 614.14 614.14 0 614.14 0 614.14 0 614.14 0
Lower Reach 6.34992* 613.92 613.92 0 613.92 0 613.92 0 613.92 0
Lower Reach 6.33223* 613.7 613.7 0 613.7 0 613.7 0 613.7 0
Lower Reach 6.31453* 613.47 613.47 0 613.47 0 613.47 0 613.47 0
Lower Reach 6.29684* 613.25 613.25 0 613.25 0 613.25 0 613.25 0
Lower Reach 6.27915* 613.03 613.03 0 613.03 0 613.03 0 613.03 0
Lower Reach 6.26146* 612.81 612.81 0 612.81 0 612.81 0 612.81 0
Lower Reach 6.24376* 612.59 612.59 0 612.59 0 612.59 0 612.59 0
Lower Reach 6.22607* 612.37 612.37 0 612.37 0 612.37 0 612.37 0
Lower Reach 6.20838* 612.16 612.16 0 612.16 0 612.16 0 612.16 0
Lower Reach 6.19069* 611.94 611.94 0 611.94 0 611.94 0 611.94 0
Lower Reach 6.173 BA 611.72 611.72 0 611.72 0 611.72 0 611.72 0
Lower Reach 5.863 AZ 607.78 607.78 0 607.78 0 607.78 0 607.78 0
Lower Reach 5.642 605.12 605.12 0 605.12 0 605.12 0 605.12 0
Lower Reach 5.593 AY 604.99 604.99 0 604.99 0 604.99 0 604.99 0
Lower Reach 5.590 CAPITOL DR Bridge

MKE/110050005 C-31
TABLE C-3 Milwaukee River 100-year Design Storm Event Comparison Between Pre-Project Model and Sheet Pile Cut-offs 2A and 2B Model
Lincoln Park/Milwaukee River Basis of Design Report
Pre-Project 100-year Design Storm
Event (ft)
Phase 2 Sheet Pile Cut-Offs at elevation
620 ft (100-year Storm Event) (ft)
Difference (ft)
Phase 2 Sheet Pile Cut-Offs at elevation 619 ft (100-year storm
event) (ft) Difference
(ft)
Phase 2 Sheet Pile Cut-Offs at elevation
618 ft (100-year storm event) (ft)
Difference (ft)
Phase 2 Sheet Pile Cut-Offs at
elevation 617 ft (100-year
storm event) (ft)
Difference (ft)
Reach River Sta W.S. Elev W.S. Elev W.S. Elev W.S. Elev W.S. Elev
Lower Reach 5.558 AX 604.72 604.72 0 604.72 0 604.72 0 604.72 0
Lower Reach 5.326 AW 603.51 603.51 0 603.51 0 603.51 0 603.51 0
Lower Reach 5.022 AV 602.49 602.49 0 602.49 0 602.49 0 602.49 0
Lower Reach 4.791 601.88 601.88 0 601.88 0 601.88 0 601.88 0
Lower Reach 4.542 AU 601.15 601.15 0 601.15 0 601.15 0 601.15 0
Lower Reach 4.45 600.83 600.83 0 600.83 0 600.83 0 600.83 0
Lower Reach 4.296 600.35 600.35 0 600.35 0 600.35 0 600.35 0
Lower Reach 4.194 AT 599.96 599.96 0 599.96 0 599.96 0 599.96 0
Lower Reach 4.180 LOCUST ST Bridge
Lower Reach 4.175 AS 599.52 599.52 0 599.52 0 599.52 0 599.52 0
Lower Reach 4.109 599.39 599.39 0 599.39 0 599.39 0 599.39 0
Lower Reach 3.938 598.95 598.95 0 598.95 0 598.95 0 598.95 0
Lower Reach 3.765 AR 598.48 598.48 0 598.48 0 598.48 0 598.48 0
Lower Reach 3.647 598.05 598.05 0 598.05 0 598.05 0 598.05 0
Lower Reach 3.496 597.63 597.63 0 597.63 0 597.63 0 597.63 0
Lower Reach 3.391 596.8 596.8 0 596.8 0 596.8 0 596.8 0
Lower Reach 3.380 AQ 597.14 597.14 0 597.14 0 597.14 0 597.14 0
Lower Reach 3.370 NORTH AVE Bridge
Lower Reach 3.366 597.02 597.02 0 597.02 0 597.02 0 597.02 0

C-32 MKE/110050005
TABLE C-3 Milwaukee River 100-year Design Storm Event Comparison Between Pre-Project Model and Sheet Pile Cut-offs 2A and 2B Model
Lincoln Park/Milwaukee River Basis of Design Report
Pre-Project 100-year Design Storm
Event (ft)
Phase 2 Sheet Pile Cut-Offs at elevation
620 ft (100-year Storm Event) (ft)
Difference (ft)
Phase 2 Sheet Pile Cut-Offs at elevation 619 ft (100-year storm
event) (ft) Difference
(ft)
Phase 2 Sheet Pile Cut-Offs at elevation
618 ft (100-year storm event) (ft)
Difference (ft)
Phase 2 Sheet Pile Cut-Offs at
elevation 617 ft (100-year
storm event) (ft)
Difference (ft)
Reach River Sta W.S. Elev W.S. Elev W.S. Elev W.S. Elev W.S. Elev
Lower Reach 3.360 AP 597.09 597.09 0 597.09 0 597.09 0 597.09 0
Lower Reach 3.348 596.16 596.16 0 596.16 0 596.16 0 596.16 0
Lower Reach 3.292 595.92 595.92 0 595.92 0 595.92 0 595.92 0
Lower Reach 3.252 AO 595.38 595.38 0 595.38 0 595.38 0 595.38 0
Lower Reach 3.220 AN 592.22 592.22 0 592.22 0 592.22 0 592.22 0
Lower Reach 3.21 584.28 584.28 0 584.28 0 584.28 0 584.28 0
Lower Reach 3.192 AM 585.9 585.9 0 585.9 0 585.9 0 585.9 0
Lower Reach 3.132 585.53 585.53 0 585.53 0 585.53 0 585.53 0
Lower Reach 3.101 584.46 584.46 0 584.46 0 584.46 0 584.46 0
Lower Reach 3.0821 584.95 584.95 0 584.95 0 584.95 0 584.95 0
Lower Reach 3.082 584.95 584.95 0 584.95 0 584.95 0 584.95 0
Lower Reach 3.05 585.03 585.03 0 585.03 0 585.03 0 585.03 0
Lower Reach 3.042 584.75 584.75 0 584.75 0 584.75 0 584.75 0
Lower Reach 3.032 584.73 584.73 0 584.73 0 584.73 0 584.73 0
Lower Reach 3.021 584.76 584.76 0 584.76 0 584.76 0 584.76 0
Lower Reach 3.019 AL 584.74 584.74 0 584.74 0 584.74 0 584.74 0
Lower Reach
3.010 HUMBOLDT AVE Bridge
Lower Reach 3.006 AK 584.53 584.53 0 584.53 0 584.53 0 584.53 0
Lower Reach 2.875 584.62 584.62 0 584.62 0 584.62 0 584.62 0

MKE/110050005 C-33
TABLE C-3 Milwaukee River 100-year Design Storm Event Comparison Between Pre-Project Model and Sheet Pile Cut-offs 2A and 2B Model
Lincoln Park/Milwaukee River Basis of Design Report
Pre-Project 100-year Design Storm
Event (ft)
Phase 2 Sheet Pile Cut-Offs at elevation
620 ft (100-year Storm Event) (ft)
Difference (ft)
Phase 2 Sheet Pile Cut-Offs at elevation 619 ft (100-year storm
event) (ft) Difference
(ft)
Phase 2 Sheet Pile Cut-Offs at elevation
618 ft (100-year storm event) (ft)
Difference (ft)
Phase 2 Sheet Pile Cut-Offs at
elevation 617 ft (100-year
storm event) (ft)
Difference (ft)
Reach River Sta W.S. Elev W.S. Elev W.S. Elev W.S. Elev W.S. Elev
Lower Reach 2.798 AJ 584.55 584.55 0 584.55 0 584.55 0 584.55 0
Lower Reach 2.692 584.47 584.47 0 584.47 0 584.47 0 584.47 0
Lower Reach 2.645 AI 584.45 584.45 0 584.45 0 584.45 0 584.45 0
Lower Reach 2.630 HOLTON ST Bridge
Lower Reach 2.626 AH 584.34 584.34 0 584.34 0 584.34 0 584.34 0
Lower Reach 2.472 AG 584.09 584.09 0 584.09 0 584.09 0 584.09 0
Lower Reach 2.378 AF 584.1 584.1 0 584.1 0 584.1 0 584.1 0
Lower Reach 2.360 PLEASANT ST Bridge
Lower Reach 2.356 AE 584.04 584.04 0 584.04 0 584.04 0 584.04 0
Lower Reach 2.235 AD 584.01 584.01 0 584.01 0 584.01 0 584.01 0
Lower Reach 2.178 583.8 583.8 0 583.8 0 583.8 0 583.8 0
Lower Reach 2.092 AC 583.87 583.87 0 583.87 0 583.87 0 583.87 0
Lower Reach 2.080 CHERRY ST Bridge
Lower Reach 2.074 AB 583.61 583.61 0 583.61 0 583.61 0 583.61 0
Lower Reach 2.072 583.61 583.61 0 583.61 0 583.61 0 583.61 0
Lower Reach 2.037 583.63 583.63 0 583.63 0 583.63 0 583.63 0
Lower Reach 2.006 583.6 583.6 0 583.6 0 583.6 0 583.6 0
Lower Reach 1.985 583.59 583.59 0 583.59 0 583.59 0 583.59 0
Lower Reach 1.957 AA 583.55 583.55 0 583.55 0 583.55 0 583.55 0

C-34 MKE/110050005
TABLE C-3 Milwaukee River 100-year Design Storm Event Comparison Between Pre-Project Model and Sheet Pile Cut-offs 2A and 2B Model
Lincoln Park/Milwaukee River Basis of Design Report
Pre-Project 100-year Design Storm
Event (ft)
Phase 2 Sheet Pile Cut-Offs at elevation
620 ft (100-year Storm Event) (ft)
Difference (ft)
Phase 2 Sheet Pile Cut-Offs at elevation 619 ft (100-year storm
event) (ft) Difference
(ft)
Phase 2 Sheet Pile Cut-Offs at elevation
618 ft (100-year storm event) (ft)
Difference (ft)
Phase 2 Sheet Pile Cut-Offs at
elevation 617 ft (100-year
storm event) (ft)
Difference (ft)
Reach River Sta W.S. Elev W.S. Elev W.S. Elev W.S. Elev W.S. Elev
Lower Reach 1.948 583.46 583.46 0 583.46 0 583.46 0 583.46 0
Lower Reach 1.947 583.46 583.46 0 583.46 0 583.46 0 583.46 0
Lower Reach 1.946 583.46 583.46 0 583.46 0 583.46 0 583.46 0
Lower Reach 1.945 583.45 583.45 0 583.45 0 583.45 0 583.45 0
Lower Reach 1.931 583.45 583.45 0 583.45 0 583.45 0 583.45 0
Lower Reach
1.908 MCKINLEY ST-KNAP Bridge
Lower Reach 1.891 583.21 583.21 0 583.21 0 583.21 0 583.21 0
Lower Reach 1.883 582.93 582.93 0 582.93 0 582.93 0 582.93 0
Lower Reach 1.863 583.03 583.03 0 583.03 0 583.03 0 583.03 0
Lower Reach 1.858 Z 582.73 582.73 0 582.73 0 582.73 0 582.73 0
Lower Reach 1.840 JUNEAU AVE Bridge
Lower Reach 1.838 Y 582.32 582.32 0 582.32 0 582.32 0 582.32 0
Lower Reach 1.764 582.35 582.35 0 582.35 0 582.35 0 582.35 0
Lower Reach 1.763 582.35 582.35 0 582.35 0 582.35 0 582.35 0
Lower Reach 1.762 582.35 582.35 0 582.35 0 582.35 0 582.35 0
Lower Reach 1.761 582.35 582.35 0 582.35 0 582.35 0 582.35 0
Lower Reach 1.76 582.34 582.34 0 582.34 0 582.34 0 582.34 0
Lower Reach
1.75 HIGHLAND AVE Bridge

MKE/110050005 C-35
TABLE C-3 Milwaukee River 100-year Design Storm Event Comparison Between Pre-Project Model and Sheet Pile Cut-offs 2A and 2B Model
Lincoln Park/Milwaukee River Basis of Design Report
Pre-Project 100-year Design Storm
Event (ft)
Phase 2 Sheet Pile Cut-Offs at elevation
620 ft (100-year Storm Event) (ft)
Difference (ft)
Phase 2 Sheet Pile Cut-Offs at elevation 619 ft (100-year storm
event) (ft) Difference
(ft)
Phase 2 Sheet Pile Cut-Offs at elevation
618 ft (100-year storm event) (ft)
Difference (ft)
Phase 2 Sheet Pile Cut-Offs at
elevation 617 ft (100-year
storm event) (ft)
Difference (ft)
Reach River Sta W.S. Elev W.S. Elev W.S. Elev W.S. Elev W.S. Elev
Lower Reach 1.727 582.32 582.32 0 582.32 0 582.32 0 582.32 0
Lower Reach 1.719 582.33 582.33 0 582.33 0 582.33 0 582.33 0
Lower Reach 1.677 582.33 582.33 0 582.33 0 582.33 0 582.33 0
Lower Reach 1.676 582.33 582.33 0 582.33 0 582.33 0 582.33 0
Lower Reach 1.6755 582.33 582.33 0 582.33 0 582.33 0 582.33 0
Lower Reach 1.675 582.32 582.32 0 582.32 0 582.32 0 582.32 0
Lower Reach 1.674 582.33 582.33 0 582.33 0 582.33 0 582.33 0
Lower Reach 1.673 X 582.31 582.31 0 582.31 0 582.31 0 582.31 0
Lower Reach 1.660 STATE ST Bridge
Lower Reach 1.655 W 582.14 582.14 0 582.14 0 582.14 0 582.14 0
Lower Reach 1.651 582.13 582.13 0 582.13 0 582.13 0 582.13 0
Lower Reach 1.579 V 582.14 582.14 0 582.14 0 582.14 0 582.14 0
Lower Reach
1.570 KILBOURN AVE Bridge
Lower Reach 1.56 581.83 581.83 0 581.83 0 581.83 0 581.83 0
Lower Reach 1.552 581.8 581.8 0 581.8 0 581.8 0 581.8 0
Lower Reach 1.523 581.74 581.74 0 581.74 0 581.74 0 581.74 0
Lower Reach 1.522 U 581.74 581.74 0 581.74 0 581.74 0 581.74 0
Lower Reach 1.521 581.73 581.73 0 581.73 0 581.73 0 581.73 0
Lower Reach 1.52 581.73 581.73 0 581.73 0 581.73 0 581.73 0
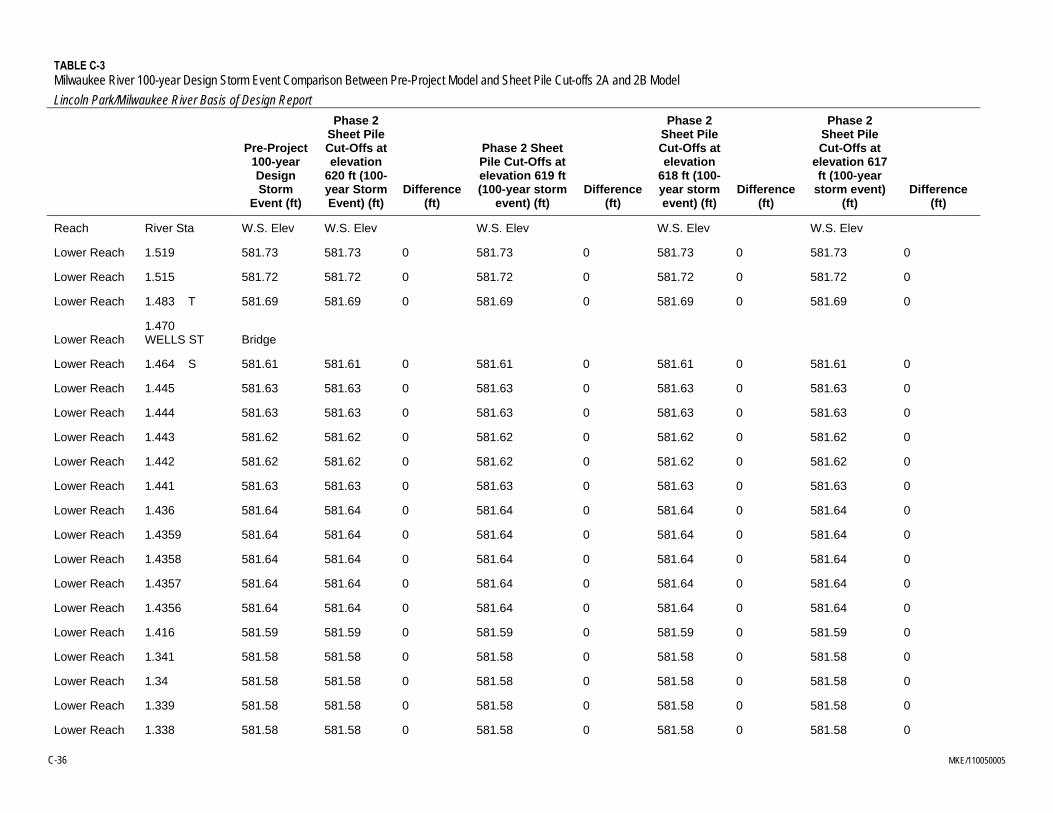
C-36 MKE/110050005
TABLE C-3 Milwaukee River 100-year Design Storm Event Comparison Between Pre-Project Model and Sheet Pile Cut-offs 2A and 2B Model
Lincoln Park/Milwaukee River Basis of Design Report
Pre-Project 100-year Design Storm
Event (ft)
Phase 2 Sheet Pile Cut-Offs at elevation
620 ft (100-year Storm Event) (ft)
Difference (ft)
Phase 2 Sheet Pile Cut-Offs at elevation 619 ft (100-year storm
event) (ft) Difference
(ft)
Phase 2 Sheet Pile Cut-Offs at elevation
618 ft (100-year storm event) (ft)
Difference (ft)
Phase 2 Sheet Pile Cut-Offs at
elevation 617 ft (100-year
storm event) (ft)
Difference (ft)
Reach River Sta W.S. Elev W.S. Elev W.S. Elev W.S. Elev W.S. Elev
Lower Reach 1.519 581.73 581.73 0 581.73 0 581.73 0 581.73 0
Lower Reach 1.515 581.72 581.72 0 581.72 0 581.72 0 581.72 0
Lower Reach 1.483 T 581.69 581.69 0 581.69 0 581.69 0 581.69 0
Lower Reach 1.470 WELLS ST Bridge
Lower Reach 1.464 S 581.61 581.61 0 581.61 0 581.61 0 581.61 0
Lower Reach 1.445 581.63 581.63 0 581.63 0 581.63 0 581.63 0
Lower Reach 1.444 581.63 581.63 0 581.63 0 581.63 0 581.63 0
Lower Reach 1.443 581.62 581.62 0 581.62 0 581.62 0 581.62 0
Lower Reach 1.442 581.62 581.62 0 581.62 0 581.62 0 581.62 0
Lower Reach 1.441 581.63 581.63 0 581.63 0 581.63 0 581.63 0
Lower Reach 1.436 581.64 581.64 0 581.64 0 581.64 0 581.64 0
Lower Reach 1.4359 581.64 581.64 0 581.64 0 581.64 0 581.64 0
Lower Reach 1.4358 581.64 581.64 0 581.64 0 581.64 0 581.64 0
Lower Reach 1.4357 581.64 581.64 0 581.64 0 581.64 0 581.64 0
Lower Reach 1.4356 581.64 581.64 0 581.64 0 581.64 0 581.64 0
Lower Reach 1.416 581.59 581.59 0 581.59 0 581.59 0 581.59 0
Lower Reach 1.341 581.58 581.58 0 581.58 0 581.58 0 581.58 0
Lower Reach 1.34 581.58 581.58 0 581.58 0 581.58 0 581.58 0
Lower Reach 1.339 581.58 581.58 0 581.58 0 581.58 0 581.58 0
Lower Reach 1.338 581.58 581.58 0 581.58 0 581.58 0 581.58 0

MKE/110050005 C-37
TABLE C-3 Milwaukee River 100-year Design Storm Event Comparison Between Pre-Project Model and Sheet Pile Cut-offs 2A and 2B Model
Lincoln Park/Milwaukee River Basis of Design Report
Pre-Project 100-year Design Storm
Event (ft)
Phase 2 Sheet Pile Cut-Offs at elevation
620 ft (100-year Storm Event) (ft)
Difference (ft)
Phase 2 Sheet Pile Cut-Offs at elevation 619 ft (100-year storm
event) (ft) Difference
(ft)
Phase 2 Sheet Pile Cut-Offs at elevation
618 ft (100-year storm event) (ft)
Difference (ft)
Phase 2 Sheet Pile Cut-Offs at
elevation 617 ft (100-year
storm event) (ft)
Difference (ft)
Reach River Sta W.S. Elev W.S. Elev W.S. Elev W.S. Elev W.S. Elev
Lower Reach 1.337 R 581.53 581.53 0 581.53 0 581.53 0 581.53 0
Lower Reach
1.320 WISCONSIN AVE Bridge
Lower Reach 1.313 Q 581.42 581.42 0 581.42 0 581.42 0 581.42 0
Lower Reach 1.312 581.41 581.41 0 581.41 0 581.41 0 581.41 0
Lower Reach 1.311 581.4 581.4 0 581.4 0 581.4 0 581.4 0
Lower Reach 1.31 581.4 581.4 0 581.4 0 581.4 0 581.4 0
Lower Reach 1.309 581.39 581.39 0 581.39 0 581.39 0 581.39 0
Lower Reach 1.308 581.39 581.39 0 581.39 0 581.39 0 581.39 0
Lower Reach 1.307 581.4 581.4 0 581.4 0 581.4 0 581.4 0
Lower Reach 1.306 581.4 581.4 0 581.4 0 581.4 0 581.4 0
Lower Reach 1.305 581.4 581.4 0 581.4 0 581.4 0 581.4 0
Lower Reach 1.241 P 581.39 581.39 0 581.39 0 581.39 0 581.39 0
Lower Reach 1.230 MICHIGAN ST Bridge
Lower Reach 1.222 O 581.15 581.15 0 581.15 0 581.15 0 581.15 0
Lower Reach 1.16 PIERS FOR RIVERW Bridge
Lower Reach 1.153 N 581.16 581.16 0 581.16 0 581.16 0 581.16 0
Lower Reach
1.140 CLYBOURN ST Bridge

C-38 MKE/110050005
TABLE C-3 Milwaukee River 100-year Design Storm Event Comparison Between Pre-Project Model and Sheet Pile Cut-offs 2A and 2B Model
Lincoln Park/Milwaukee River Basis of Design Report
Pre-Project 100-year Design Storm
Event (ft)
Phase 2 Sheet Pile Cut-Offs at elevation
620 ft (100-year Storm Event) (ft)
Difference (ft)
Phase 2 Sheet Pile Cut-Offs at elevation 619 ft (100-year storm
event) (ft) Difference
(ft)
Phase 2 Sheet Pile Cut-Offs at elevation
618 ft (100-year storm event) (ft)
Difference (ft)
Phase 2 Sheet Pile Cut-Offs at
elevation 617 ft (100-year
storm event) (ft)
Difference (ft)
Reach River Sta W.S. Elev W.S. Elev W.S. Elev W.S. Elev W.S. Elev
Lower Reach 1.134 M 581.06 581.06 0 581.06 0 581.06 0 581.06 0
Lower Reach
1.100 INTERSTATE 794 Bridge
Lower Reach 1.097 581.04 581.04 0 581.04 0 581.04 0 581.04 0
Lower Reach 1.07 PIERS FOR RIVERW Bridge
Lower Reach 1.063 L 581.04 581.04 0 581.04 0 581.04 0 581.04 0
Lower Reach 1.050 ST. PAUL ST Bridge
Lower Reach 1.047 K 580.99 580.99 0 580.99 0 580.99 0 580.99 0
Lower Reach 1.023 PIERS FOR RIVERW Bridge
Lower Reach 0.999 J 581 581 0 581 0 581 0 581 0
Lower Reach .990 PIERS FOR RIVERW Bridge
Lower Reach 0.982 I 581 581 0 581 0 581 0 581 0
Lower Reach .900 PIERS FOR RIVERW Bridge
Lower Reach 0.880 H 580.89 580.89 0 580.89 0 580.89 0 580.89 0
Lower Reach 0.843 580.91 580.91 0 580.91 0 580.91 0 580.91 0
Lower Reach 0.808 580.94 580.94 0 580.94 0 580.94 0 580.94 0
Lower Reach 0.787 G 580.4 580.4 0 580.4 0 580.4 0 580.4 0
Lower Reach 0.775 Bridge

MKE/110050005 C-39
TABLE C-3 Milwaukee River 100-year Design Storm Event Comparison Between Pre-Project Model and Sheet Pile Cut-offs 2A and 2B Model
Lincoln Park/Milwaukee River Basis of Design Report
Pre-Project 100-year Design Storm
Event (ft)
Phase 2 Sheet Pile Cut-Offs at elevation
620 ft (100-year Storm Event) (ft)
Difference (ft)
Phase 2 Sheet Pile Cut-Offs at elevation 619 ft (100-year storm
event) (ft) Difference
(ft)
Phase 2 Sheet Pile Cut-Offs at elevation
618 ft (100-year storm event) (ft)
Difference (ft)
Phase 2 Sheet Pile Cut-Offs at
elevation 617 ft (100-year
storm event) (ft)
Difference (ft)
Reach River Sta W.S. Elev W.S. Elev W.S. Elev W.S. Elev W.S. Elev
WATER ST
Lower Reach 0.769 F 580.03 580.03 0 580.03 0 580.03 0 580.03 0
Lower Reach 0.715 580.08 580.08 0 580.08 0 580.08 0 580.08 0
Lower Reach .7125 PIERS FOR RIVERW Bridge
Lower Reach 0.71 580.07 580.07 0 580.07 0 580.07 0 580.07 0
Lower Reach 0.6394 580.07 580.07 0 580.07 0 580.07 0 580.07 0
Lower Reach 0.6393 580.08 580.08 0 580.08 0 580.08 0 580.08 0
Lower Reach 0.6391 580.07 580.07 0 580.07 0 580.07 0 580.07 0
Lower Reach 0.639 580.05 580.05 0 580.05 0 580.05 0 580.05 0
Lower Reach 0.638 E 580.05 580.05 0 580.05 0 580.05 0 580.05 0
Lower Reach
0.630 BROADWAY ST Bridge
Lower Reach 0.623 D 579.62 579.62 0 579.62 0 579.62 0 579.62 0
Lower Reach 0.6225 579.61 579.61 0 579.61 0 579.61 0 579.61 0
Lower Reach 0.622 579.61 579.61 0 579.61 0 579.61 0 579.61 0
Lower Reach 0.621 579.61 579.61 0 579.61 0 579.61 0 579.61 0
Lower Reach 0.62 579.61 579.61 0 579.61 0 579.61 0 579.61 0
Lower Reach 0.619 579.65 579.65 0 579.65 0 579.65 0 579.65 0
Lower Reach 0.618 579.52 579.52 0 579.52 0 579.52 0 579.52 0
Lower Reach 0.544 579.55 579.55 0 579.55 0 579.55 0 579.55 0

C-40 MKE/110050005
TABLE C-3 Milwaukee River 100-year Design Storm Event Comparison Between Pre-Project Model and Sheet Pile Cut-offs 2A and 2B Model
Lincoln Park/Milwaukee River Basis of Design Report
Pre-Project 100-year Design Storm
Event (ft)
Phase 2 Sheet Pile Cut-Offs at elevation
620 ft (100-year Storm Event) (ft)
Difference (ft)
Phase 2 Sheet Pile Cut-Offs at elevation 619 ft (100-year storm
event) (ft) Difference
(ft)
Phase 2 Sheet Pile Cut-Offs at elevation
618 ft (100-year storm event) (ft)
Difference (ft)
Phase 2 Sheet Pile Cut-Offs at
elevation 617 ft (100-year
storm event) (ft)
Difference (ft)
Reach River Sta W.S. Elev W.S. Elev W.S. Elev W.S. Elev W.S. Elev
Lower Reach 0.452 C 579.54 579.54 0 579.54 0 579.54 0 579.54 0
Lower Reach 0.441 579.54 579.54 0 579.54 0 579.54 0 579.54 0
Lower Reach 0.44 C&NW RAILROAD Bridge
Lower Reach 0.403 B 579.46 579.46 0 579.46 0 579.46 0 579.46 0
Lower Reach 0.190 A 579.5 579.5 0 579.5 0 579.5 0 579.5 0

MKE/110050005 C-41
TABLE C-4
Lincoln Creek Comparison Between 100-year Design Storm Event Pre-Project model with Western Oxbow Extension and 10-and 100-year Design Storm Event Stage 2 Western Oxbow Extension Model Results
Lincoln Park/Milwaukee River Basis of Design Report
Reach
Pre-Project with Oxbow Extension (100-year) Design Cross
Sections with Oxbow Extension (100-year)
W.S. Elev (ft) Difference with Oxbow Ext (ft)
Design Cross Sections with Oxbow Extension and weir
diversion (100-year) W.S. Elev (ft)
Difference with Oxbow Ext (ft)
Design Cross Sections with Oxbow Extension (10-year)
W.S. Elev (ft) Difference with Oxbow Ext (ft)
River Sta
W.S. Elev (ft)
Lower Mainstream 1.95 634.44 634.44 0 634.44 0 631.38 -3.06
Lower Mainstream 1.92 634.15 634.15 0 634.15 0 631.2 -2.95
Lower Mainstream 1.912 634.14 634.14 0 634.14 0 631.2 -2.94
Lower Mainstream 1.904 Bridge
Lower Mainstream 1.9 633.77 633.77 0 633.77 0 630.97 -2.8
Lower Mainstream 1.89 633.73 633.73 0 633.72 -0.01 630.85 -2.88
Lower Mainstream 1.75 632.73 632.74 0.01 632.73 0 629.88 -2.85
Lower Mainstream 1.74 632.82 632.82 0 632.82 0 629.92 -2.9
Lower Mainstream 1.73 Bridge
Lower Mainstream 1.721 632.21 632.21 0 632.2 -0.01 629.58 -2.63
Lower Mainstream 1.72 632.16 632.16 0 632.16 0 629.51 -2.65
Lower Mainstream 1.67 631.1 631.1 0 631.09 -0.01 628.58 -2.52
Lower Mainstream 1.65 630.89 630.9 0.01 630.88 -0.01 628.4 -2.49
Lower Mainstream 1.645 Bridge

C-42 MKE/110050005
TABLE C-4
Lincoln Creek Comparison Between 100-year Design Storm Event Pre-Project model with Western Oxbow Extension and 10-and 100-year Design Storm Event Stage 2 Western Oxbow Extension Model Results
Lincoln Park/Milwaukee River Basis of Design Report
Reach
Pre-Project with Oxbow Extension (100-year) Design Cross
Sections with Oxbow Extension (100-year)
W.S. Elev (ft) Difference with Oxbow Ext (ft)
Design Cross Sections with Oxbow Extension and weir
diversion (100-year) W.S. Elev (ft)
Difference with Oxbow Ext (ft)
Design Cross Sections with Oxbow Extension (10-year)
W.S. Elev (ft) Difference with Oxbow Ext (ft)
River Sta
W.S. Elev (ft)
Lower Mainstream 1.64 630.21 630.21 0 630.2 -0.01 628.12 -2.09
Lower Mainstream 1.63 630.29 630.29 0 630.28 -0.01 628.15 -2.14
Lower Mainstream 1.56 630.01 630.01 0 629.99 -0.02 627.68 -2.33
Lower Mainstream 1.54 629.92 629.92 0 629.9 -0.02 627.62 -2.3
Lower Mainstream 1.53 629.53 629.54 0.01 629.51 -0.02 627.27 -2.26
Lower Mainstream 1.522 Bridge
Lower Mainstream 1.514 629.03 629.04 0.01 629 -0.03 626.92 -2.11
Lower Mainstream 1.51 629.08 629.08 0 629.05 -0.03 626.97 -2.11
Lower Mainstream 1.47 629.09 629.09 0 629.05 -0.04 626.84 -2.25
Lower Mainstream 1.37 628.79 628.8 0.01 628.76 -0.03 626.37 -2.42
Lower Mainstream 1.33 628.03 628.04 0.01 627.97 -0.06 625.32 -2.71
Lower Mainstream 1.31 628.08 628.09 0.01 628.03 -0.05 625.54 -2.54
Lower Mainstream 1.3 627.91 627.91 0 627.85 -0.06 625.39 -2.52
Lower Mainstream 1.289 Bridge
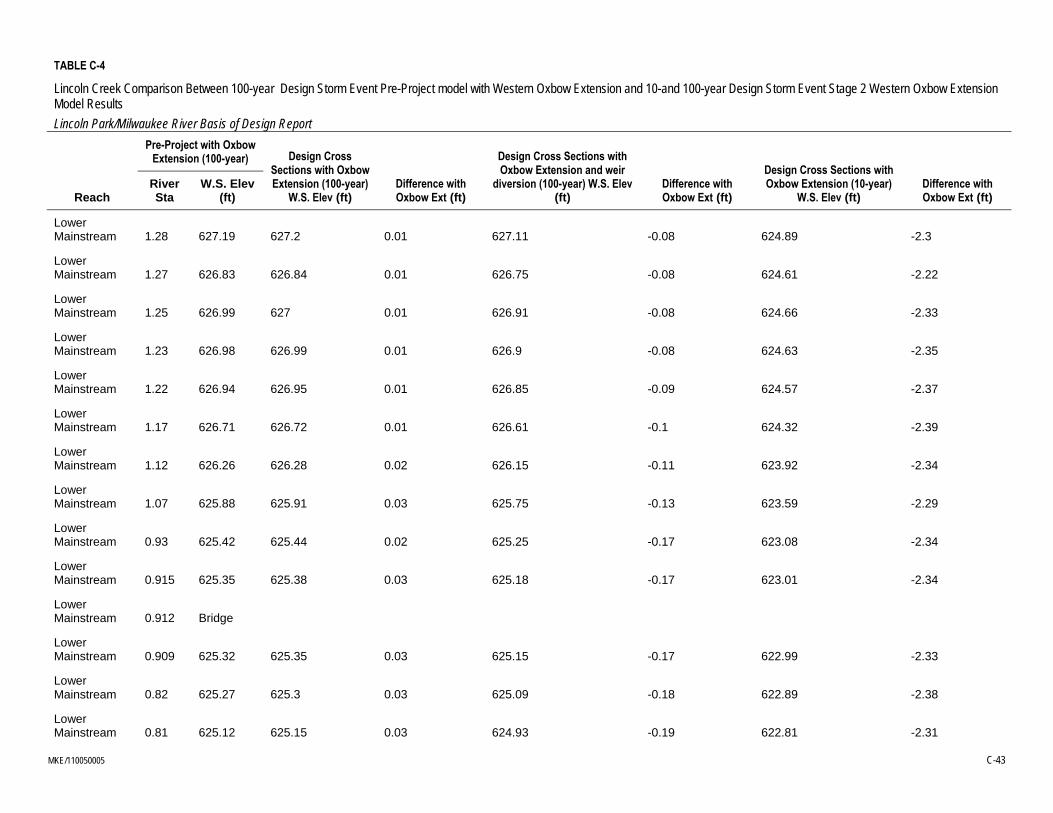
MKE/110050005 C-43
TABLE C-4
Lincoln Creek Comparison Between 100-year Design Storm Event Pre-Project model with Western Oxbow Extension and 10-and 100-year Design Storm Event Stage 2 Western Oxbow Extension Model Results
Lincoln Park/Milwaukee River Basis of Design Report
Reach
Pre-Project with Oxbow Extension (100-year) Design Cross
Sections with Oxbow Extension (100-year)
W.S. Elev (ft) Difference with Oxbow Ext (ft)
Design Cross Sections with Oxbow Extension and weir
diversion (100-year) W.S. Elev (ft)
Difference with Oxbow Ext (ft)
Design Cross Sections with Oxbow Extension (10-year)
W.S. Elev (ft) Difference with Oxbow Ext (ft)
River Sta
W.S. Elev (ft)
Lower Mainstream 1.28 627.19 627.2 0.01 627.11 -0.08 624.89 -2.3
Lower Mainstream 1.27 626.83 626.84 0.01 626.75 -0.08 624.61 -2.22
Lower Mainstream 1.25 626.99 627 0.01 626.91 -0.08 624.66 -2.33
Lower Mainstream 1.23 626.98 626.99 0.01 626.9 -0.08 624.63 -2.35
Lower Mainstream 1.22 626.94 626.95 0.01 626.85 -0.09 624.57 -2.37
Lower Mainstream 1.17 626.71 626.72 0.01 626.61 -0.1 624.32 -2.39
Lower Mainstream 1.12 626.26 626.28 0.02 626.15 -0.11 623.92 -2.34
Lower Mainstream 1.07 625.88 625.91 0.03 625.75 -0.13 623.59 -2.29
Lower Mainstream 0.93 625.42 625.44 0.02 625.25 -0.17 623.08 -2.34
Lower Mainstream 0.915 625.35 625.38 0.03 625.18 -0.17 623.01 -2.34
Lower Mainstream 0.912 Bridge
Lower Mainstream 0.909 625.32 625.35 0.03 625.15 -0.17 622.99 -2.33
Lower Mainstream 0.82 625.27 625.3 0.03 625.09 -0.18 622.89 -2.38
Lower Mainstream 0.81 625.12 625.15 0.03 624.93 -0.19 622.81 -2.31

C-44 MKE/110050005
TABLE C-4
Lincoln Creek Comparison Between 100-year Design Storm Event Pre-Project model with Western Oxbow Extension and 10-and 100-year Design Storm Event Stage 2 Western Oxbow Extension Model Results
Lincoln Park/Milwaukee River Basis of Design Report
Reach
Pre-Project with Oxbow Extension (100-year) Design Cross
Sections with Oxbow Extension (100-year)
W.S. Elev (ft) Difference with Oxbow Ext (ft)
Design Cross Sections with Oxbow Extension and weir
diversion (100-year) W.S. Elev (ft)
Difference with Oxbow Ext (ft)
Design Cross Sections with Oxbow Extension (10-year)
W.S. Elev (ft) Difference with Oxbow Ext (ft)
River Sta
W.S. Elev (ft)
Lower Mainstream 0.803 Bridge
Lower Mainstream 0.794 624.96 624.99 0.03 624.77 -0.19 622.69 -2.27
Lower Mainstream 0.79 624.93 624.96 0.03 624.74 -0.19 622.65 -2.28
Lower Mainstream 0.75 624.81 624.84 0.03 624.61 -0.2 622.56 -2.25
Lower Mainstream 0.71 624.69 624.73 0.04 624.47 -0.22 622.44 -2.25
Lower Mainstream 0.62 624.31 624.35 0.04 624.06 -0.25 622.1 -2.21
Lower Mainstream 0.61 623.88 623.92 0.04 623.59 -0.29 621.76 -2.12
Lower Mainstream 0.6 623.71 623.76 0.05 623.4 -0.31 621.64 -2.07
Lower Mainstream 0.54 623.77 623.82 0.05 623.44 -0.33 621.55 -2.22
Lower Mainstream 0.5 623.74 623.79 0.05 623.39 -0.35 621.43 -2.31
Lower Mainstream 0.47 623.66 623.71 0.05 623.3 -0.36 621.31 -2.35
Lower Mainstream 0.44 623.14 623.2 0.06 622.73 -0.41 620.98 -2.16
Lower Mainstream 0.43 623.16 623.22 0.06 622.76 -0.4 621 -2.16
Lower Mainstream 0.42 Bridge

MKE/110050005 C-45
TABLE C-4
Lincoln Creek Comparison Between 100-year Design Storm Event Pre-Project model with Western Oxbow Extension and 10-and 100-year Design Storm Event Stage 2 Western Oxbow Extension Model Results
Lincoln Park/Milwaukee River Basis of Design Report
Reach
Pre-Project with Oxbow Extension (100-year) Design Cross
Sections with Oxbow Extension (100-year)
W.S. Elev (ft) Difference with Oxbow Ext (ft)
Design Cross Sections with Oxbow Extension and weir
diversion (100-year) W.S. Elev (ft)
Difference with Oxbow Ext (ft)
Design Cross Sections with Oxbow Extension (10-year)
W.S. Elev (ft) Difference with Oxbow Ext (ft)
River Sta
W.S. Elev (ft)
Lower Mainstream 0.41 622.91 622.98 0.07 622.48 -0.43 620.82 -2.09
Lower Mainstream 0.4 622.96 623.04 0.08 622.55 -0.41 620.87 -2.09
Lower Mainstream 0.32 622.52 622.6 0.08 622 -0.52 620.49 -2.03
Lower Mainstream 0.25 622.41 622.49 0.08 621.8 -0.61 620.25 -2.16
Lower Mainstream 0.198 622.29 622.38 0.09 621.61 -0.68 620.15 -2.14
Lower Mainstream 0.189 622.14 622.22 0.08 621.54 -0.6 620.11 -2.03
Lower Mainstream 0.187 Bridge
Lower Mainstream 0.185 622.14 622.22 0.08 621.54 -0.6 620.11 -2.03
Lower Mainstream 0.175 622.09 622.17 0.08 621.48 -0.61 620.07 -2.02
Lower Mainstream 0.121 622.01 622.1 0.09 621.26 -0.75 619.88 -2.13
Lower Mainstream 0.103 621.95 622.05 0.1 621.24 -0.71 619.83 -2.12
Lower Mainstream 0.06 621.93 622.02 0.09 621.16 -0.77 619.74 -2.19
Lower Mainstream 0.001 621.86 621.96 0.1 621.05 -0.81 619.62 -2.24

Appendix J Hydraulic Modeling
MKE/110050005 1
T E C H N I C A L M E M O R A N D U M
Lincoln Park Sediment Remediation Pre-project: Lincoln Creek and Milwaukee River HEC-RAS Models PREPARED FOR: Lincoln Park Project Team
PREPARED BY: CH2M HILL
DATE: November 18, 2010
This memorandum outlines the updates to the Lincoln Creek and Milwaukee River HEC-RAS models (two models) to support the Lincoln Park/Milwaukee River Channel Sediments Site Preliminary Remedial Design Project.
These pre-project models updated from the duplicate effective Federal Emergency Management Agency (FEMA) models will provide the design team with information to support the project design, including: the effect that sheet pile and earthen cut-offs along the construction site have on water levels, design of bank stabilization techniques, and dredging activities. Modeling applications to support the design will be documented in separate memos. Simulating the Wisconsin Department of Natural Resources (WDNR) FEMA model in HEC-RAS 3.1.3 was designated the “duplicate effective” model. Updates to include refined topographic and bridge changes was designated the “pre-project” model.
Field surveys were collected in June 2010 to support the habitat design at stream cross section locations between the banks. Additional cross sections were surveyed in October 2010 at the request of the WDNR to include bridge details. To incorporate the field survey data into the model, the data was first converted from NAVD88 (the datum used in the survey) to NGVD29 (the datum used in the HEC-RAS models) by adding 0.325 foot to the surveyed data. The survey data was arranged by cross section and sorted from left bank to right bank, looking downstream.
When the field surveys were compared to the HEC-RAS model cross sections, many differences were observed likely because the duplicate effective HEC-RAS models are several years old and include outdated cross sections. As discussed with the project team during the August 31, 2010 hydraulic modeling meeting, the duplicate effective HEC-RAS cross section locations were replaced with the field survey cross section in the project area (i.e. the cross sections were moved to match the surveyed locations and the old model cross section locations deleted). The surveyed stream cross sections were merged with Milwaukee County 2-foot topographic data for areas outside of the surveyed cross section area (overbanks). Changes in flow rates in the duplicate effective models were adjusted to the nearest surveyed cross section in the pre-project models.
Lincoln Creek Model Updates The project team obtained a hydraulic model of Lincoln Creek that was used in the Milwaukee County Flood Insurance Study (FEMA, 2008). The model was provided by the

LINCOLN PARK SEDIMENT REMEDIATION PRE-PROJECT: LINCOLN CREEK AND MILWAUKEE RIVER HEC-RAS MODELS
2 MKE/110050005
WDNR and was run with steady-state flows using HEC-RAS 3.1.3. The Lincoln Creek model was provided with 10-, 50-, 100-, and 500-year flows.
Three cross sections were surveyed in June 2010 and seven cross sections were surveyed in October 2010 in Lincoln Creek between the western oxbow and Green Bay Avenue. The model was updated by removing the existing cross sections in the HEC-RAS duplicate effective model and replacing them with the survey data. Table 1 lists the comparison between the model cross section name and the survey data cross section name. Figure 1 shows the location of the June 2010 surveyed cross sections and the original HEC-RAS model cross section locations, while Figure 2 shows the locations of the June and October 2010 survey cross sections.
The bridge that services the Channel 58 TV antenna on the east side of Lincoln Creek was not included in the FEMA model. The June 2010 field survey did not collect information on that bridge and there are no known engineering drawings for it. The October 2010 survey included the cross sections associated with this bridge and the model was updated to include this bridge using the survey information.
The length of Lincoln Creek downstream of the Green Bay Avenue Bridge in the pre-project model is about 20 feet longer than the length in the duplicate effective model. The Lincoln Creek lengths were measured using aerial photographs and the field survey data. The additional length in the pre-project model compared to the duplicate effective model is likely due to rounding differences.
Only cross sections within the project site (downstream of river station 0.40) were changed in the pre-project model. The duplicate effective model at river station 0.40 had a low point (thalweg) 1.68 feet higher than the thalweg survey that was performed in June 2010 upstream end of the project site. To account for this difference, the two lowest points along the duplicate effective cross section (river station 0.40) were lowered 1.68 feet (lowest point is 610.12 feet) to match the thalweg survey. Changes to other cross sections downstream of river station 0.40 were made based upon the new survey obtained for the project. No changes to the model were made outside of the project area, which is upstream of river station 0.40.
The downstream boundary condition (starting water surface slope of 0.002) used in the duplicate effective model was also used in the pre-project model. The profile of the 100-year storm simulated in the duplicate effective model from Green Bay Avenue to the downstream end of the model (confluence with western oxbow) is shown in Figure 3. The profile of the 100-year storm simulated in the pre-project model from Green Bay Avenue to
TABLE 1 Pre-project Lincoln Creek Model Cross Section and Corresponding Survey Cross Section Lincoln Park/Milwaukee River Basis of Design Report
Pre-project Model Cross Section Survey Cross Section
0.32 LK-1
0.25 LK-2
0.198 AB-1
0.189 AB-2
0.185 AB-3
0.175 AB-4
0.121 LK-6
0.103 LK-4
0.06 LK-3
0.0 LK-5

LINCOLN PARK SEDIMENT REMEDIATION PRE-PROJECT: LINCOLN CREEK AND MILWAUKEE RIVER HEC-RAS MODELS
MKE/110050005 3
the downstream end of the model is shown in Figure 4. Figure 5 shows both the duplicate effective model and the pre-project model on the same profile.
A comparison of the 100-year storm water surface elevations calculated in HEC-RAS is shown in Table 2. The table lists water surface elevations from upstream of the bridge on 32nd Street downstream through the project reach to the confluence with the western oxbow of the Milwaukee River. At the 32nd Street location the differences are minor, while downstream of the Green Bay Avenue Bridge the differences are more significant. These differences appear to be caused by the lower cross section invert elevations found in the project surveys as compared to the higher invert information contained in the duplicate effective model. Near the Green Bay Avenue Bridge and within the project site the drop in water surface elevation is generally between 0.5 and 1.0 foot.
FIGURE 3 Duplicate Effective Model 100-Year Profile from Green Bay Avenue Bridge Lincoln Park/Milwaukee River Basis of Design Report
0 500 1000 1500 2000 2500
610
615
620
625
630
Lincoln Creek 2005 Plan: Lincoln Creek 2005 Revision 11/10/2010 Geom: Lincoln Creek 2005 Revision
Main Channel Distance (ft)
Ele
vatio
n (f
t)
Legend
WS 100-yr
Ground
0.00
0.03
0.14
0.16
0.18
0.21
0.33
0.40
0.41
0.42
0
0.44
0.47
0.50
0.54
Lincoln Creek Lower Mainstream
Green Bay Avenue

LINCOLN PARK SEDIMENT REMEDIATION PRE-PROJECT: LINCOLN CREEK AND MILWAUKEE RIVER HEC-RAS MODELS
4 MKE/110050005
FIGURE 4 Pre-project Model 100-Year Profile from Green Bay Avenue Bridge Lincoln Park/Milwaukee River Basis of Design Report
0 500 1000 1500 2000 2500
610
615
620
625
Lincoln Creek 2005 Plan: LincolnC_Survey_Update_Oct2010 11/10/2010 Geom: Pre-Project_SurveySections
Main Channel Distance (ft)
Ele
vatio
n (f
t)
Legend
WS 100-yr
Ground
0 .06
0.10
3
0.12
1
0.17
5
0.18
50.
187
0.19
8
.25
.32
0.40
0.41
0.42
0
0.44
0.47
Lincoln Creek Lower Mainstream
Green Bay Avenue
Antenna Bridge

LINCOLN PARK SEDIMENT REMEDIATION PRE-PROJECT: LINCOLN CREEK AND MILWAUKEE RIVER HEC-RAS MODELS
MKE/110050005 5
FIGURE 5 Both Duplicate Effective and Pre-project Model 100-year Profiles from Green Bay Avenue Bridge Lincoln Park/Milwaukee River Basis of Design Report
0 500 1000 1500 2000 2500
610
615
620
625
Lincoln Creek 2005 Plan: 1) SurveyOct201 11/10/2010 2) LC05-Revised 11/10/2010 Geom: Pre-Project_SurveySections
Main Channel Distance (f t)
Ele
vatio
n (f
t)
Legend
WS 100-yr - LC05-Revised
WS 100-yr - SurveyOct201
Ground
Ground
0 .06
0.10
3
0.12
1
0.17
5
0.18
50.
187
0.19
8
.25
.32
0.40
0.41
0.42
0
0.44
0.47
0.50
0.54
Lincoln Creek Lower Mainstream
Duplicate effective model invert
Pre-project model invert
0.5 foot difference
~ 1.5 to 2 foot difference
Duplicate effective model water surface
Pre-project model water surface
Green Bay Avenue
Antenna Bridge

LINCOLN PARK SEDIMENT REMEDIATION PRE-PROJECT: LINCOLN CREEK AND MILWAUKEE RIVER HEC-RAS MODELS
6 MKE/110050005
TABLE 2 Comparison of 100-Year Water Surface Elevations in Lincoln Creek Lincoln Park/Milwaukee River Basis of Design Report
Duplicate Effective
Model River Station
Pre-project Model River Station
Milwaukee County Flood Insurance
Study Water Surface Elevation (ft)
Duplicate Effective Model Simulation
Water Surface Elevation (ft)
Pre-project Model Simulation
Water Surface Elevation (ft)
Difference in Modeled Water
Surface Elevation
1.95 1.95 634.45 634.44 -0.01
1.92 1.92 634.2 634.16 634.15 -0.01
1.912 1.912 634.15 634.14 -0.01
1.904 1.904
1.9 1.9 633.7 633.78 633.77 -0.01
1.89 1.89 633.73 633.72 -0.01
1.75 1.75 632.8 632.75 632.73 -0.02
1.74 1.74 632.83 632.82 -0.01
1.73 1.73
1.721 1.721 632.22 632.21 -0.01
1.72 1.72 632.2 632.18 632.16 -0.02
1.67 1.67 631.1 631.12 631.09 -0.03
1.65 1.65 630.92 630.88 -0.04
1.645 1.645
1.64 1.64 630.24 630.2 -0.04
1.63 1.63 630.3 630.32 630.28 -0.04
1.56 1.56 630.1 630.05 629.99 -0.06
1.54 1.54 629.96 629.9 -0.06
1.53 1.53 629.58 629.51 -0.07
1.522 1.522
1.514 1.514 629.09 629 -0.09
1.51 1.51 629.14 629.05 -0.09
1.47 1.47 629.2 629.15 629.06 -0.09
1.37 1.37 628.87 628.76 -0.11
1.33 1.33 628.1 628.13 627.98 -0.15
1.31 1.31 628.18 628.04 -0.14
1.3 1.3 628.01 627.85 -0.16
1.289 1.289
1.28 1.28 627.31 627.12 -0.19
1.27 1.27 626.97 626.75 -0.22
1.25 1.25 627.1 627.13 626.92 -0.21
1.23 1.23 627.13 626.91 -0.22
1.22 1.22 627.08 626.86 -0.22
1.17 1.17 626.9 626.87 626.62 -0.25
1.12 1.12 626.45 626.16 -0.29

LINCOLN PARK SEDIMENT REMEDIATION PRE-PROJECT: LINCOLN CREEK AND MILWAUKEE RIVER HEC-RAS MODELS
MKE/110050005 7
TABLE 2 Comparison of 100-Year Water Surface Elevations in Lincoln Creek Lincoln Park/Milwaukee River Basis of Design Report
Duplicate Effective
Model River Station
Pre-project Model River Station
Milwaukee County Flood Insurance
Study Water Surface Elevation (ft)
Duplicate Effective Model Simulation
Water Surface Elevation (ft)
Pre-project Model Simulation
Water Surface Elevation (ft)
Difference in Modeled Water
Surface Elevation
1.07 1.07 626.1 626.12 625.76 -0.36
0.93 0.93 625.7 625.69 625.27 -0.42
0.915 0.915 625.64 625.20 -0.44
0.912 0.912
0.909 0.909 625.61 625.17 -0.44
0.82 0.82 625.6 625.57 625.11 -0.44
0.81 0.81 625.43 624.96 -0.47
0.803 0.803
0.794 0.794 625.28 624.79 -0.49
0.79 0.79 625.3 625.25 624.76 -0.49
0.75 0.75 625.15 624.63 -0.52
0.71 0.71 625.1 625.05 624.5 -0.55
0.62 0.62 624.3 624.72 624.09 -0.63
0.61 0.61 624.31 623.63 -0.68
0.6 0.6 624.18 623.43 -0.75
0.54 0.54 624.3 624.25 623.48 -0.77
0.5 0.5 624.25 623.43 -0.82
0.47 0.47 624.2 624.18 623.34 -0.84
0.44 0.44 623.72 622.78 -0.94
0.43 0.43 623.74 622.80 -0.94
0.42 0.42 Green Bay Avenue Bridge
0.41 0.41 623.52 622.53 -0.99
0.4 0.4 623.5 623.5 622.59 -0.91
0.33 0.32 622.7a 622.67 621.83 -0.84
0.25 N/A 621.49
0.21 0.198 622.0a 622.01 621.07 -0.94
0.18 0.189 621.78 620.81 -0.97
0.187 Antenna Bridge
0.185 N/A 620.82
0.16 0.175 621.3a 621.54 620.69 -0.85
0.14 0.121 621.29 620.26 -1.03
0.103 N/A 620.04
0.03 0.06 620.25 619.76 -0.49
0 0 619.85 619.31 -0.54
aFrom FEMA Flood Insurance Study without consideration of backwater effects from the Milwaukee River. Backwater (El 623.1 ft) controls mapped FIS elevations on Lincoln Creek downstream of Green Bay Avenue.

LINCOLN PARK SEDIMENT REMEDIATION PRE-PROJECT: LINCOLN CREEK AND MILWAUKEE RIVER HEC-RAS MODELS
8 MKE/110050005
Milwaukee River Model Updates The project team obtained a hydraulic model of the Milwaukee River (including the western oxbow) used in the Milwaukee County Flood Insurance Study (Federal Emergency Management Agency, 2008). The model was provided by WDNR and was run with steady-state flows using HEC-RAS 3.1.3. The Milwaukee River model was provided with 10-, 50-, 100-, and 500-year flows. The same as the Lincoln Creek model, running the WDNR FEMA model in HEC-RAS 3.1.3 was designated the “duplicate effective” model and the updates to include refined topographic and bridge changes was designated the “pre-project” model.
A survey of the Milwaukee River western oxbow channel was performed at five locations in June 2010 and six locations in October 2010 (Figure 2). Five of the survey sites are located along the western oxbow of the Milwaukee River upstream of the confluence with Lincoln Creek (northern half of the western oxbow). The remaining six survey sites are located upstream and downstream of the southern Milwaukee River Parkway Bridge. The same as the Lincoln Creek model update, the Milwaukee River duplicate effective model was updated by removing the cross sections and replacing them with the survey data. The out-of-bank areas were determined based on Milwaukee County 2-foot topographic data.
The Milwaukee River western oxbow has two bridges: northern Milwaukee River Parkway and southern Milwaukee River Parkway. The two bridges were recently designed and re-built as part of a Collins Engineers Inc. project, Milwaukee River Parkway Over North Fork Milwaukee River. Collins Engineers provided CH2M HILL with a HEC-RAS model with these two updated bridges and drawings of the designed bridges. The Milwaukee River duplicate effective model was updated with the bridge geometry from the Collins Engineering construction drawings and new cross section information to become the pre-project model.
The north bridge upstream and downstream face cross sections were derived using construction drawings. All other bridge cross section data for both the north and south bridges was from the October 2010 survey. At the time of the survey, the north Milwaukee River Parkway Bridge was still under construction.
Figure 1 shows the location of the surveyed cross sections and the original HEC-RAS model cross section locations. Table 3 lists the pre-project model cross sections and the corresponding survey cross sections. The length of the western oxbow in the pre-project model is about 90 feet longer than the length of the western oxbow of the duplicate effective
TABLE 3 Pre-project Milwaukee River Model Cross Section and Corresponding Survey Cross Section Lincoln Park/Milwaukee River Basis of Design Report
Pre-project Model Cross Section Survey Cross Section
8.1551 NB-1
8.1311 NB-2
8.124 SC-1
8.081 SC-2
8.0488 SC-3
8.0031 MC-3
7.9400 SB-1
7.9341 SB-2
7.8761 SB-3
7.7761 SB-4
7.71 MC-2

LINCOLN PARK SEDIMENT REMEDIATION PRE-PROJECT: LINCOLN CREEK AND MILWAUKEE RIVER HEC-RAS MODELS
MKE/110050005 9
model, for the corresponding area. The oxbow length was measured using aerial photographs and the field survey. The additional length is likely due to rounding differences and the limits of data available when the model was initially developed.
Furthermore, the pre-project model has an additional 140 feet of surveyed length due to additional cross sections upstream and downstream of the duplicate effective model area.
The Milwaukee River model was simulated with the Estabrook Dam gates open and the spillway stoplogs removed consistent with the approach included in the duplicate effective model received from the WDNR. The profile of the 100-year storm simulated in the duplicate effective model along the western oxbow of the Milwaukee River is shown in Figure 6. The profile of the 100-year storm simulated in the pre-project model along the western oxbow of the Milwaukee River is shown in Figure 7. Figure 8 shows both the duplicate effective model and the pre-project model on the same profile.
A comparison of the 100-year storm water surface elevations calculated in HEC-RAS is shown in Table 4. The table lists water surface elevations from Good Hope Road to the Interstate 43 bridge. There were no significant differences between the two models upstream and downstream of these locations.
FIGURE 6 Duplicate Effective Model 100-Year Profile along Western Oxbow of Milwaukee River Lincoln Park/Milwaukee River Basis of Design Report
0 500 1000 1500 2000 2500605
610
615
620
625
630
635
MilwaukeerivEncroahStudy032707 Plan: MIlRiverEncroachment Study 9/27/2010 Geom: ExisitngConditionsNewSplit020707
Main Channel Distance (ft)
Ele
vatio
n (f
t)
Legend
WS 100-Yr Flow
Ground
7.90
00
8.00
31
8.13
21
8.14
11
8.14
20
Milwaukee River Right Split
North Parkway Bridge South Parkway Bridge

LINCOLN PARK SEDIMENT REMEDIATION PRE-PROJECT: LINCOLN CREEK AND MILWAUKEE RIVER HEC-RAS MODELS
10 MKE/110050005
FIGURE 7 Pre-project Model 100-Year Profile Along Western Oxbow of Milwaukee River Lincoln Park/Milwaukee River Basis of Design Report
FIGURE 8 Both Duplicate Effective and Pre-project Model100-Year Profiles along Western Oxbow of Milwaukee River Lincoln Park/Milwaukee River Basis of Design Report
0 500 1000 1500 2000 2500 3000605
610
615
620
625
630
635
MilwaukeerivEncroahStudy032707 Plan: DamOpen_SpillwayOpenn_SurveyUpdate 11/10/2010 Geom: DamOpen_SpillwayOpen_SurveyUpdate
Main Channel Distance (ft)
Ele
vatio
n (f
t)
Legend
WS 100-Yr Flow
Ground
7.77
61
7.87
61
7.90
00
7.94
00
8.00
31
8.04
88
8.08
1
8.12
4
8.13
11
8.14
11
8.14
20
8.15
51
Milwaukee River Right Split
0 500 1000 1500 2000 2500
610
615
620
625
630
MilwaukeerivEncroahStudy032707 Plan: 1) DO_SO_Survey 11/10/2010 2) Encro032707 11/10/2010 Geom: DamOpen_SpillwayOpen_SurveyUpdate
Main Channel Distance (ft)
Ele
vatio
n (f
t)
Legend
WS 100-Yr Flow - DO_SO_Survey
WS 100-Yr Flow - Encro032707
Ground
Ground
7.71
7.77
61
7.87
61
7.90
00
7.94
00
8.00
31
8.04
88
8.08
1
8.12
4
8.13
11
8.14
...
8.14
...
8.15
51Milwaukee River Right Split
Duplicate Effective model invert Pre-project model invert
North Parkway Bridge South Parkway Bridge
North Parkway Bridge South Parkway Bridge
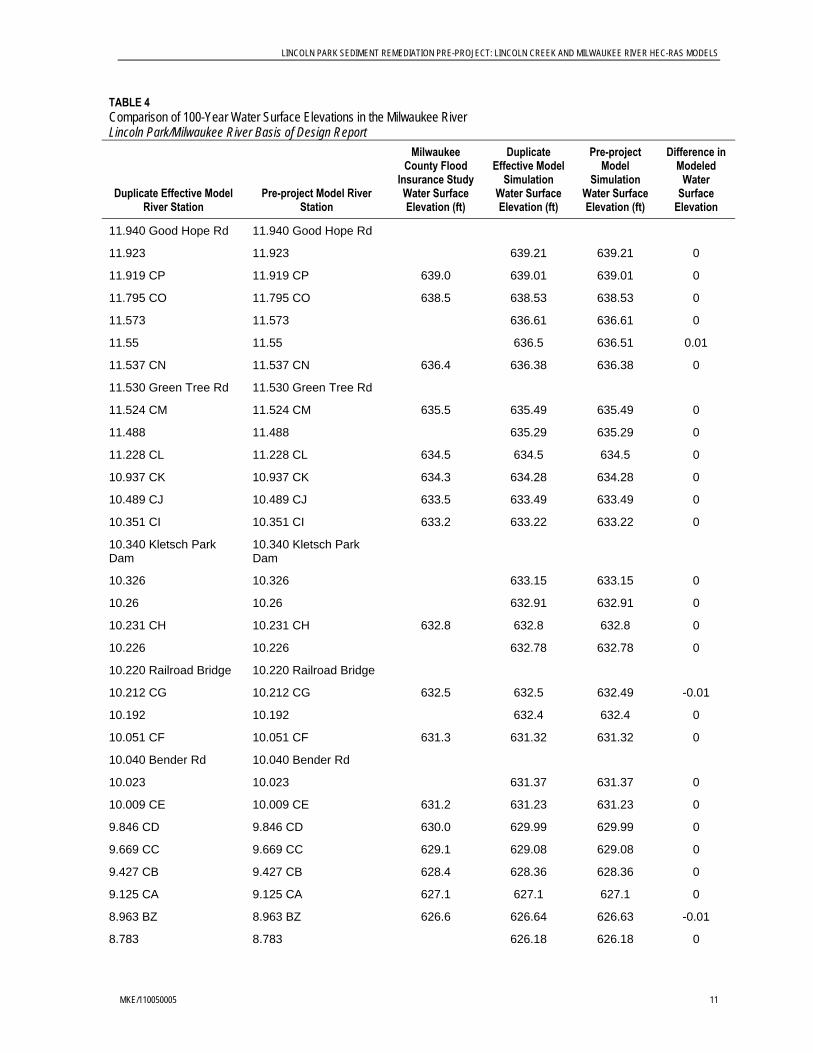
LINCOLN PARK SEDIMENT REMEDIATION PRE-PROJECT: LINCOLN CREEK AND MILWAUKEE RIVER HEC-RAS MODELS
MKE/110050005 11
TABLE 4 Comparison of 100-Year Water Surface Elevations in the Milwaukee River Lincoln Park/Milwaukee River Basis of Design Report
Duplicate Effective Model River Station
Pre-project Model River Station
Milwaukee County Flood
Insurance Study Water Surface Elevation (ft)
Duplicate Effective Model
Simulation Water Surface Elevation (ft)
Pre-project Model
Simulation Water Surface Elevation (ft)
Difference in Modeled
Water Surface
Elevation
11.940 Good Hope Rd 11.940 Good Hope Rd
11.923 11.923 639.21 639.21 0
11.919 CP 11.919 CP 639.0 639.01 639.01 0
11.795 CO 11.795 CO 638.5 638.53 638.53 0
11.573 11.573 636.61 636.61 0
11.55 11.55 636.5 636.51 0.01
11.537 CN 11.537 CN 636.4 636.38 636.38 0
11.530 Green Tree Rd 11.530 Green Tree Rd
11.524 CM 11.524 CM 635.5 635.49 635.49 0
11.488 11.488 635.29 635.29 0
11.228 CL 11.228 CL 634.5 634.5 634.5 0
10.937 CK 10.937 CK 634.3 634.28 634.28 0
10.489 CJ 10.489 CJ 633.5 633.49 633.49 0
10.351 CI 10.351 CI 633.2 633.22 633.22 0
10.340 Kletsch Park Dam
10.340 Kletsch Park Dam
10.326 10.326 633.15 633.15 0
10.26 10.26 632.91 632.91 0
10.231 CH 10.231 CH 632.8 632.8 632.8 0
10.226 10.226 632.78 632.78 0
10.220 Railroad Bridge 10.220 Railroad Bridge
10.212 CG 10.212 CG 632.5 632.5 632.49 -0.01
10.192 10.192 632.4 632.4 0
10.051 CF 10.051 CF 631.3 631.32 631.32 0
10.040 Bender Rd 10.040 Bender Rd
10.023 10.023 631.37 631.37 0
10.009 CE 10.009 CE 631.2 631.23 631.23 0
9.846 CD 9.846 CD 630.0 629.99 629.99 0
9.669 CC 9.669 CC 629.1 629.08 629.08 0
9.427 CB 9.427 CB 628.4 628.36 628.36 0
9.125 CA 9.125 CA 627.1 627.1 627.1 0
8.963 BZ 8.963 BZ 626.6 626.64 626.63 -0.01
8.783 8.783 626.18 626.18 0
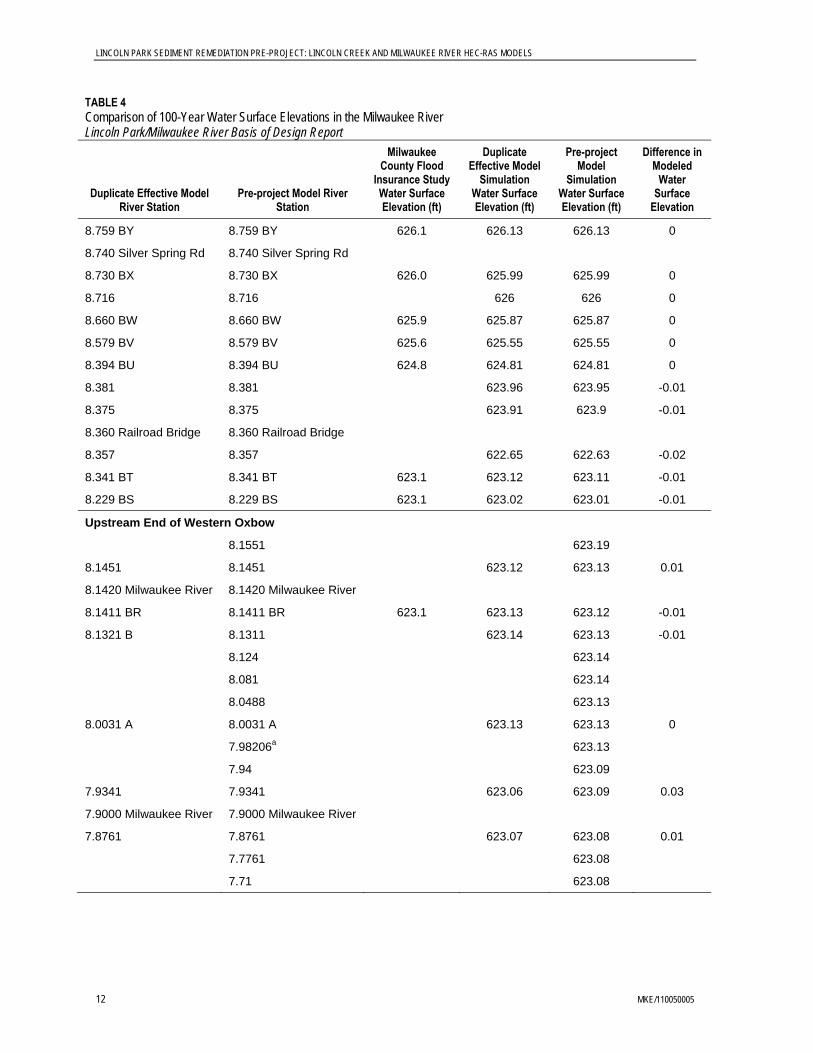
LINCOLN PARK SEDIMENT REMEDIATION PRE-PROJECT: LINCOLN CREEK AND MILWAUKEE RIVER HEC-RAS MODELS
12 MKE/110050005
TABLE 4 Comparison of 100-Year Water Surface Elevations in the Milwaukee River Lincoln Park/Milwaukee River Basis of Design Report
Duplicate Effective Model River Station
Pre-project Model River Station
Milwaukee County Flood
Insurance Study Water Surface Elevation (ft)
Duplicate Effective Model
Simulation Water Surface Elevation (ft)
Pre-project Model
Simulation Water Surface Elevation (ft)
Difference in Modeled
Water Surface
Elevation
8.759 BY 8.759 BY 626.1 626.13 626.13 0
8.740 Silver Spring Rd 8.740 Silver Spring Rd
8.730 BX 8.730 BX 626.0 625.99 625.99 0
8.716 8.716 626 626 0
8.660 BW 8.660 BW 625.9 625.87 625.87 0
8.579 BV 8.579 BV 625.6 625.55 625.55 0
8.394 BU 8.394 BU 624.8 624.81 624.81 0
8.381 8.381 623.96 623.95 -0.01
8.375 8.375 623.91 623.9 -0.01
8.360 Railroad Bridge 8.360 Railroad Bridge
8.357 8.357 622.65 622.63 -0.02
8.341 BT 8.341 BT 623.1 623.12 623.11 -0.01
8.229 BS 8.229 BS 623.1 623.02 623.01 -0.01
Upstream End of Western Oxbow
8.1551 623.19
8.1451 8.1451 623.12 623.13 0.01
8.1420 Milwaukee River 8.1420 Milwaukee River
8.1411 BR 8.1411 BR 623.1 623.13 623.12 -0.01
8.1321 B 8.1311 623.14 623.13 -0.01
8.124 623.14
8.081 623.14
8.0488 623.13
8.0031 A 8.0031 A 623.13 623.13 0
7.98206a 623.13
7.94 623.09
7.9341 7.9341 623.06 623.09 0.03
7.9000 Milwaukee River 7.9000 Milwaukee River
7.8761 7.8761 623.07 623.08 0.01
7.7761 623.08
7.71 623.08

LINCOLN PARK SEDIMENT REMEDIATION PRE-PROJECT: LINCOLN CREEK AND MILWAUKEE RIVER HEC-RAS MODELS
MKE/110050005 13
TABLE 4 Comparison of 100-Year Water Surface Elevations in the Milwaukee River Lincoln Park/Milwaukee River Basis of Design Report
Duplicate Effective Model River Station
Pre-project Model River Station
Milwaukee County Flood
Insurance Study Water Surface Elevation (ft)
Duplicate Effective Model
Simulation Water Surface Elevation (ft)
Pre-project Model
Simulation Water Surface Elevation (ft)
Difference in Modeled
Water Surface
Elevation
Main Channel Parallel to Western Oxbow
8.145 8.145 623.14 623.13 -0.01
8.141 8.141 623.14 623.13 -0.01
8.132 8.132 623.14 623.13 -0.01
8.003 8.003 623.1 623.1 0
7.934 7.934 623.08 623.09 0.01
7.876 BQ 7.876 BQ 623.1 623.07 623.07 0
Downstream of Western Oxbow
7.669 BP 7.669 BP 622.8 622.75 622.75 0
7.660 Hampton Ave 7.660 Hampton Ave
7.654 BO 7.654 BO 622.7 622.69 622.69 0
7.633 7.633 622.63 622.63 0
7.199 BN 7.199 BN 621.8 621.82 621.82 0
7.190 I-43 RA 7.190 I-43 RA aFrom FEMA Flood Insurance Study without consideration of backwater effects from the Milwaukee River. Backwater (El 623.1 ft) controls mapped FIS elevations on Lincoln Creek downstream of Green Bay Avenue.
Summary Several changes to the duplicate effective HEC-RAS models were completed using recent survey and bridge design drawings. The Lincoln Creek pre-project modeling results have lower water surface elevations (generally 0.5 to 1.0 foot lower in the project area) than the duplicate effective model 100-year design storm water surface elevations, because of the lower cross section invert elevations found during the survey. The Milwaukee River oxbow pre-project modeling results have very similar water surface elevations to the duplicate effective model 100-year design storm water surface elevations, because the survey of the Milwaukee River western oxbow is very similar to the duplicate effective mode cross sections.
The pre-project models are anticipated to provide the design team with information needed to design the bank stabilization and the temporary dams for construction staging while minimizing flood and construction impacts. The models will also provide a foundation for watercourse managers to update FEMA maps if necessary.
Attachment The duplicate effective HEC-RAS models of Lincoln Creek and the Milwaukee River as well as the pre-project models are located on the CD on the inside back cover of this report. A compilation of the survey information from the June and October 2010 surveys is also included on the CD.

Figure 1Duplicate Effective Model Cross Section Location Map

!
!
!!!!!!!!!!!!!!!!!!
!!!!!!!!!!!!!!!
!!!!!!!!!!!!!
!!!
!!!!!!!!!!!! !
!!!!!!!!!!!!!!!!!!!!!!!!
!
!!!!!!!!!!!!!!!!!!!
!!!!!!!!!!!
!!!!!!!!!!!!!!!
!
! !
!!
!!!!!
!!!!!!!!!!!!!!!!!!!!!!!!!!!!
!
!
!
!!
!
!!!!!!!!!!!!!!
! !
! !!!!!!! !!
!
!!!!!!!!!!!!!!!!!!!!!!!!!!!!!!!!!!
! !
!!!!!!!!!!!!!!!!!!!!!!!!!!!!!!!!!!!!!!!!
!!!!!!!!!!!!!!!!!!!!!!
!!
!!!!
!!!!!!!!!!!!
!!!!!!!!!!!!!!!!!!!
!
!!!!!!
!!
!!!!!!!
!
!!!
!!!!!!!!
!!!!!!!!!!!!!!!!!!!!!!!!!!!!!!!!!!!!!!!!!!!!!!
!!!
!!!!!!!!!!!!!!!!!!!!!!!!!
!!!
!!!!!!!!
!!!!!!!!!!!
!!!!!!!!
!
!
!!!!!!!!!!!!!!!!!!!!!!!!!!!!!
!!!!!
!!!!
!
!!!!!!!!!!!!!!!!!!!!!!!
!!!!!!!!!!!!!!!!!!!!!!!!!!!!!!!!!!!!!!!!!!!!!!!!!!
!!!!!
!!!!!!!!!!!!!!!!!!!!!!!!!!!!!!!!!!!!!!!!!!!!!!!!!!!!!!!!!
!! !!!!!!!!
!!!!!!
!
!!!!!!!!!!!!!! !
!!!!!! !!
!
!!!!
!!!!
!!
!!!!!!!!!!!!!!!!!!!!!!
Green Bay Avenue Bridge
Lincoln Creek XS 0.32
Survey XS LK-1
Antennae Bridge
Lincoln Creek XS 0.25
Survey XS LK-2
Lincoln Creek XS 0.189
Survey XS AB-2
Lincoln Creek XS 0.185
Survey XS AB-3
Lincoln Creek XS 0.198
Survey XS AB-1
Lincoln Creek XS 0.175
Survey XS AB-4
Lincoln Creek XS 0.121
Survey XS LK-6
Lincoln Creek XS 0.06
Survey XS LK-3
Lincoln Creek XS 0.103
Survey XS LK-4
Lincoln Creek XS 0.0
Survey XS LK-5
Milwaukee River Oxbow XS 8.0031
Survey XS MC-3
Milwaukee River Oxbow XS 8.0488
Survey XS SC-3
Milwaukee River Oxbow XS 7.9400
Survey XS SB-1
Milwaukee River Oxbow XS 7.9341
Survey XS SB-2
Milwaukee River Oxbow XS 7.8761
Survey XS SB-3
Milwaukee River Oxbow XS 7.7761
Survey XS SB-4
Milwaukee River Oxbow XS 7.71
Survey XS MC-2
Milwaukee River Oxbow XS 8.081
Survey XS SC-2
Milwaukee River Oxbow XS 8.124
Survey XS SC-1
Milwaukee River Oxbow XS 8.1311
Survey XS NB-2
Milwaukee River Oxbow XS 8.1551
Survey XS NB-1
Milwaukee River
Parkway Northern
Bridge
Milwaukee River
Parkway Southern
Bridge
Legend
! October2010SurveyData
June2010SurveyData
County Topographic Data Extended Cross SectionFigure 2
June and October 2010 Survey Locations

Appendix K Bank Stabilization
T E C H N I C A L M E M O R A N D U M
Lincoln Creek and Western Oxbow Bank Stabilization Design: Supplement to the Basis of Design Report PREPARED FOR: Lincoln Park Sediment Remediation Project Team
PREPARED BY: CH2M HILL
DATE: January 3, 2011
This memorandum summarizes the bank stabilization design details to supplement the Basis of Design Report (BODR). The intended recipients of this memorandum are familiar with the project site layout and general description of the project scope and location. This type of background information is included the BODR and is not reprinted here.
Creek and Western Oxbow Restoration The restoration of Lincoln Creek and the western oxbow will restore the areas affected by sediment excavation. The restoration will include stabilized shoreline between the undisturbed and the excavated areas. The slope stabilization will occur from the bottom of slope to the ordinary high watermark or to an existing stable part of the bank, whichever is higher. Many restoration efforts have been completed by the MMSD along upstream parts of the Lincoln Creek. The project restoration will use techniques similar to those previous restoration efforts but will differ because of the assumed Estabrook Park Dam backwater condition throughout the site. Stabilization will also be supportive of future habitat and recreational enhancements that could be completed, but are beyond the scope of the sediment remediation. Details of the design components included in this project restoration are discussed below.
Estabrook Park Dam
The water levels at the site would differ between dam-open or dam-closed scenarios. Based on discussions with the project stakeholders, the restoration design assumes a dam-closed scenario. Seasonal variation of water levels resulting from opening and closing of the dam is not expected. Instead, the dam is expected to remain closed, creating a pool throughout the site with a water surface elevation of 617 to 617.4 feet. Milwaukee County is completing a study of the dam to determine the costs to fix the dam or decommission it.
Hydrology and Hydraulics
Flood Flows. Hydraulic models of Lincoln Creek and the Milwaukee River (including the western oxbow) used in the Milwaukee County Flood Insurance Study (FIS) (Federal Emergency Management Agency, 2008) were also used to analyze different construction scenarios and post construction scenarios for the project. The models were provided by WDNR and were modified using updated cross section, bridge, and other survey information. The modifications are summarized in the memorandum Lincoln Park Sediment Remediation Pre-project Lincoln Creek and Milwaukee River HEC-RAS Models
MKE/110050005 1

LINCOLN CREEK AND WESTERN OXBOW BANK STABILIZATION DESIGN: INTERIM PRE-FINAL DESIGN REPORT UPDATE
(CH2M HILL, 2010). Both the Lincoln Creek model and the Milwaukee River model included 10-, 50-, 100-, and 500-year flows.
The bankfull discharge (an indicator of flood stages that typically vary between 1- to 3-year recurrence intervals and are generally associated with the “channel forming” flow rates) was assumed to be a 2-year flood, which is consistent with design criteria established by MMSD for upstream parts of Lincoln Creek (MMSD, 2002). Storm event water elevations (2through 100-year flows) are generally above the elevation where the project will require restoration because the project includes excavation of sediments below the ordinary high watermark (that is, the ordinary high watermark created by the backwater is less than thestorm flows). Therefore storm event
-
flows will be used for selecting scour resistant materials
the restoration will not increase flood levels to
ns
ected to evaluate a low-flow e
t
TABLE 1 Flood Flows for Linco MilwLincoln Park/Milwau o
M
Up of P
Linc ek at C ce
with kee
within the restoration and confirming thatprivate property.
The watershed size, imperviousness, and subsequent hydrology of the Lincoln Creek and Milwaukee River tributary areas will not change as a result of this project. Therefore noadjustments will be made to the current designstorm flow rates. Both models were provided with the 10-year storm as the smallest storm event. Smaller storm and low flow conditiowere needed for the design of the restoration channel and therefore those flows were calculated. Appendix I describes how the 2-year return period flow was calculated, and Appendix J provides additional hydraulic
ln Creek and kee River Basis
ilwaukee
aukee River f Design Report
oln CreRiver
streamroject
onfluen MilwauRiver
2-year (ft3/s) 4,850 2,580
10-year (ft3/s) 8,790 4,840
50-year (ft3/s) 12,550 6,570
100-year (ft3/s) 14,340 7,340
modeling and flow rate information. Table 1 lists the flood flows in the Milwaukee River just upstream of the project area and at the mouth of Lincoln Creek.
Low Flows. The low flows at the project site were calculated based on daily flow data from the United States Geologic Service (USGS) gages on Lincoln Creek (gage 040869416) and the Milwaukee River (gage 0408700). The Milwaukee River gage is located within Estabrook Park, less than 0.5 mile downstream of the project site. Although the Milwaukee River gage is downstream of the project site, it provides reliable data because there are no significant tributaries (that is, no significant flow increases) to the Milwaukee River between the project site and gage. Flow rates during low-flow conditions were selscenario in the restoration design for the western oxbow pond and the confluence with thMilwaukee River downstream of Lincoln Creek.
Low flows of 150 ft3/s and 500 ft3/s on the Milwaukee River were selected as additional flows to analyze in the project area. The 150 ft3/s flow corresponds to an 85 percent exceedance for the entire year of flows and the 500 ft3/s flow to a 75 percent exceedance flow for the month of March (an 85 percent exceedance flow is exceeded 85 percent of the time). The month of March was analyzed to determine flow rates that would occur during a typical northern pike (Esox lucius) season to aid evaluation of water depths and other habitarequirements beneficial to northern pike. Appendix I contains additional information.
2 MKE/110050005

LINCOLN CREEK AND WESTERN OXBOW BANK STABILIZATION DESIGN: SUPPLEMENT TO THE BASIS OF DESIGN REPORT
The Lincoln Creek USGS gage is located at the corner of Sherman Boulevard and CongresStreet, about 2.5 miles upstream of the project site. The Lincoln Creek tributary area is 21 square miles, and the gage has a 9.6-square-mile tributary area. The gage flow valuwere escalated by multiplying the gage flow rates by the fractional increase in the watershed area (21/9.6 = 2.1875). This method is appropriate, because the Lincoln Creek watershed is entirely developed and has relatively uniform land use throughout. A lowflow of 22 ft3/s was selected as a low-flow scenario to analyze in the project area and corresponds to a 20 percent
s
es
flow exceedance (flows of this magnitude are exceeded only 20 percent of the time). No analysis of March flows for northern pike habitat was conducted
ause Lincoln Creek is a highly urbanized watershed where flows
d by the
The ely affect properties near the site, and based on the
more ect
reek and the Milwaukee River. The pre-project models were
ated the 100-year design storm to
tory
r.
on Lincoln Creek, becfluctuate quickly and habitat conditions are less conducive to northern pike populations than the Milwaukee River.
Flood Improvements
MMSD has completed several flood improvement projects along Lincoln Creek. In LincolnCreek MMSD flood improvement projects ended at a point about 960 feet upstream of theLincoln Park/Milwaukee River site and were completed in 2002. A study completeSoutheastern Wisconsin Regional Planning Commission (SEWRPC) and MMSD concluded that removing 1 to 2 feet of sediment in Lincoln Creek downstream of Green Bay Avenue and the western oxbow channel could lower flood stages for properties near the site. remedial action will not adversanticipated sediment removal at the site, the remedial action may provide some flood relief based on the SEWRPC and MMSD study. However, if excess sedimentation continues along Lincoln Creek, the flood relief would be temporary. Sedimentation within the site is discussed later in this section.
Pre-project Flood Elevations. The Lincoln Creek and Milwaukee River FIS hydraulic models (HEC-RAS) were updated with surveyed cross sections from June and October 2010 toaccurately represent current conditions. The models were used to determine the pre-projflood elevations for Lincoln Cupdated from the duplicate effective Federal Emergency Management Agency (FEMA) FIS models. Details of the 2010 model updates can be found in the memorandum entitled Lincoln Park Sediment Remediation Pre-project Lincoln Creek and Milwaukee River HEC-RAS Models (CH2M HILL, 2010).
The Lincoln Creek and Milwaukee River models simuldetermine the pre-project water surface elevations. The Milwaukee River HEC-RAS model simulated the gates at the Estabrook Park Dam open, which is consistent with the modeling completed in the FIS, and allowed water surface elevations to be compared to the regulamodel and then ultimately to the post project model.
Table 2 summarizes the Lincoln Creek 100-year stormwater surface elevations calculated in pre-project model. The table lists water surface elevations from the 32nd Street Bridge upstream of the site to the confluence with the western oxbow of the Milwaukee Rive
Table 3 summarizes the 100-year stormwater surface elevations calculated by the pre-project model for the Milwaukee River and the FIS. The table lists water surface elevations from Good Hope Road upstream of the project to the Interstate 43 bridge downstream of the site.
MKE/110050005 3

LINCOLN CREEK AND WESTERN OXBOW BANK STABILIZATION DESIGN: INTERIM PRE-FINAL DESIGN REPORT UPDATE
Post-project Flood Elevations. The pre-project hydraulic models were updated with de(post-project) cross sections to evaluate the flood stage impacts of the project restoration. The post-project cross sections were determined based on the site continuing to function flood conveyance channel and in a backwater condition from the Estabrook Park Dam. Consequently, the project will stabilize the bank side slopes affected by the sediment removal. The shap
sign
as a
e of the channel bottom was determined by the sediment removal depths.
ith
generally match pre-project conditions and the bottom contouring was generally determined emoval depths from the pre-project elevation. Where bank
ign cross sections were added to the Lincoln Creek and Milwaukee River HEC-RAS models. The Manning’s roughness coefficients were not adjusted because t deled r ervative assumption that the waterway will return to the pre-p
TAPre-project 100-year Water Surf 2nd Street BriMilwaukee River Western Oxbow Lincoln Park/Milwaukee River Basis of Design Report
Pre-proje l Riv
Milwaukee CountyStudy Water Surface Elevation (ft)
Pre-project Mode lation Water Surfac (ft)
Some reshaping of the channel bottom is included in the restoration design to allow the channel to have a defined flow path during low flow periods and while Estabrook Park Dam remains open. Figure 1 shows an example cross section of the pre-project and post-project surfaces.
The post-project cross sections were developed by matching pre-project site conditions wthe sediment removal extents dictated by the remedial action. The channel side slopes
by subtracting the sediment rinstability was observed with vertical or mass wasting side slopes, the side slopes were matched to stable areas upstream or down steam, or observed elsewhere in the site.
Hydraulic Modeling Analysis
The post-project des
he restored banks and channel bed are anticipated to be similar to the FIS mooughness. This was a consroject conditions.
BLE 2 ace Elevations in Lincoln Creek between 3 dge and the
ct Modeer Station
Flood Insurance l Simue Elevation
1.95 634.44
1.92 634.2 634.15
1.912 634.14
1.904 Bridge
1.9 63 7
63 8
63 2
63 1
3. 633.77
1.89 633.72
1.75 2. 632.73
1.74 632.82
1.73 Bridge
1.721 632.21
1.72 2. 632.16
1.67 1. 631.09
1.65 630.88
4 MKE/110050005

LINCOLN CREEK AND WESTERN OXBOW BANK STABILIZATION DESIGN: SUPPLEMENT TO THE BASIS OF DESIGN REPORT
TABLE 2 Pre-project 100-year Water Surface Elevations in Lincoln Creek between 32nd Street Bridge and the Milwaukee River Western Oxbow Lincoln Park/Milwaukee River Basis of Design Report
Pre-project Model River Station
Milwaukee County Flood Insurance Study Water Surface Elevation (ft)
Pre-project Model Simulation Water Surface Elevation (ft)
1.645 Bridge
1.64 630.2
1.63 63 3
63 1
6
62 2
62 1
62 1
62 7
62 6
0. 630.28
1.56 0. 629.99
1.54 29.9
1.53 629.51
1.522 Bridge
1.514 629
1.51 629.05
1.47 9. 629.06
1.37 628.76
1.33 8. 627.98
1.31 628.04
1.3 627.85
1.289 Bridge
1.28 627.12
1.27 626.75
1.25 627.1 626.92
1.23 626.91
1.22 626.86
1.17 626.9 626.62
1.12 626.16
1.07 6. 625.76
0.93 5. 625.27
0.915 625.20
0.912 Bridge
0.909 625.17
0.82 5. 625.11
0.81 624.96
0.803 Bridge
0.794 624.79
MKE/110050005 5

LINCOLN CREEK AND WESTERN OXBOW BANK STABILIZATION DESIGN: INTERIM PRE-FINAL DESIGN REPORT UPDATE
TABLE 2 Pre-project 100-year Water Surface Elevations in Lincoln Creek between 32nd Street Bridge and the Milwaukee River Western Oxbow Lincoln Park/Milwaukee River Basis of Design Report
Pre-project Model River Station
Milwaukee County Flood Insurance Study Water Surface Elevation (ft)
Pre-project Model Simulation Water Surface Elevation (ft)
0.79 625.3 624.76
0.75 624.63
0.71 625.1
62 3
624.2 623.34
Green Bay Avenue Bridge
62 7a
621.49
62 0a
Antenna Bridge
a
0.121
0 619.31 aElevation from FIS without consideration of backwater effects from the Milwaukee River. Milwaukee River backwater (Elevation 623.1 feet) controls the mapped FIS elevations on Lincoln Creek downstream of Green Bay Avenue.
624.5
0.62 624.3 624.09
0.61 623.63
0.6 623.43
0.54 4. 623.48
0.5 623.43
0.47
0.44 622.78
0.43 622.80
0.42
0.41 622.53
0.4 623.5 622.59
0.32 2. 621.83
0.25
0.198 2. 621.07
0.189 620.81
0.187
0.185 620.82
0.175 621.3 620.69
620.26
0.103 620.04
0.06 619.76
6 MKE/110050005

LINCOLN CREEK AND WESTERN OXBOW BANK STABILIZATION DESIGN: SUPPLEMENT TO THE BASIS OF DESIGN REPORT
TABLE 3 Pre-project 100-year Water Surface Elevations in the Milwaukee River between Good Hope Road and Interstate 43 Lincoln Park/Milwaukee River Basis of Design Report
Pre-project Model River Station
Milwaukee County Flood Insurance Study Water Surface Elevation (ft)
Pre-project Model Simulation Water Surface Elevation (ft)
11.940 Good Hope Rd Bridge
11.923 639.21
11.919 CP 639.0 639.01
11.795 CO 638.5 638.53
11.573 636.61
11.55 636.51
11.537 CN 636.4 636.38
11.530 Green Tree Rd Bridge
11.524 CM 635.5 635.49
11.488 635.29
11.228 CL 634.5 634.5
10.937 CK 634.3 634.28
10.489 CJ 633.5 633.49
10.351 CI 633.2 633.22
10.340 Kletsch Park Dam Bridge
10.326 633.15
10.26 632.91
10.231 CH 632.8 632.8
10.226 632.78
10.220 Railroad Bridge Bridge
10.212 CG 632.5 632.49
10.192 632.4
10.051 CF 631.3 631.32
10.040 Bender Rd Bridge
10.023 631.37
10.009 CE 631.2 631.23
9.846 CD 630.0 629.99
9.669 CC 629.1 629.08
9.427 CB 628.4 628.36
9.125 CA 627.1 627.1
8.963 BZ 626.6 626.63
MKE/110050005 7
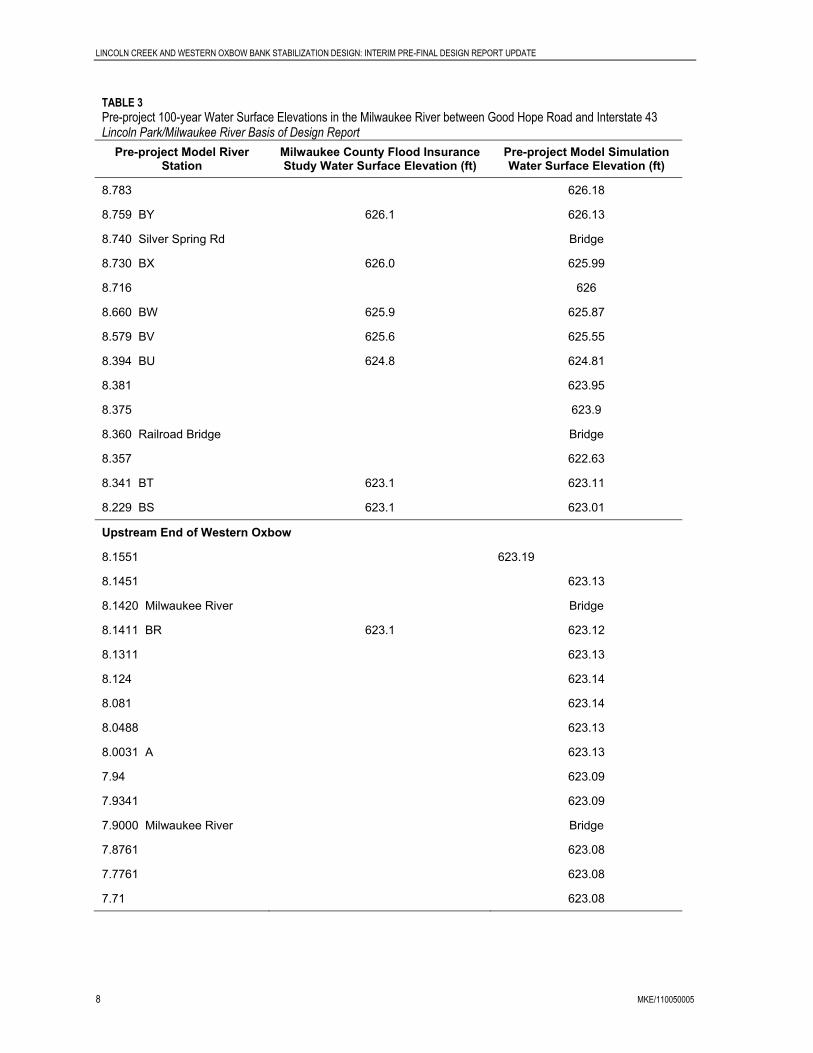
LINCOLN CREEK AND WESTERN OXBOW BANK STABILIZATION DESIGN: INTERIM PRE-FINAL DESIGN REPORT UPDATE
TABLE 3 Pre-project 100-year Water Surface Elevations in the Milwaukee River between Good Hope Road and Interstate 43 Lincoln Park/Milwaukee River Basis of Design Report
Pre-project Model River Station
Milwaukee County Flood Insurance Study Water Surface Elevation (ft)
Pre-project Model Simulation Water Surface Elevation (ft)
8.783 626.18
8.759 BY 626.1 626.13
8.740 Silver Spring Rd Bridge
8.730 BX 626.0 625.99
8.716 626
8.660 BW 625.9 625.87
8.579 BV 625.6 625.55
8.394 BU 624.8 624.81
8.381 623.95
8.375 623.9
8.360 Railroad Bridge Bridge
8.357 622.63
8.341 BT 623.1 623.11
8.229 BS 623.1 623.01
Upstream End of Western Oxbow
8.1551 623.19
8.1451 623.13
8.1420 Milwaukee River Bridge
8.1411 BR 623.1 623.12
8.1311 623.13
8.124 623.14
8.081 623.14
8.0488 623.13
8.0031 A 623.13
7.94 623.09
7.9341 623.09
7.9000 Milwaukee River Bridge
7.8761 623.08
7.7761 623.08
7.71 623.08
8 MKE/110050005

LINCOLN CREEK AND WESTERN OXBOW BANK STABILIZATION DESIGN: SUPPLEMENT TO THE BASIS OF DESIGN REPORT
TABLE 3 Pre-project 100-year Water Surface Elevations in the Milwaukee River between Good Hope Road and Interstate 43 Lincoln Park/Milwaukee River Basis of Design Report
Pre-project Model River Station
Milwaukee County Flood Insurance Study Water Surface Elevation (ft)
Pre-project Model Simulation Water Surface Elevation (ft)
Main Channel Parallel to Western Oxbow
8.145 623.13
8.141 623.13
8.132 623.13
8.003 623.1
7.934 623.09
7.876 BQ 623.1 623.07
Downstream of Western Oxbow
7.669 BP 622.8 622.75
7.660 Hampton Ave Bridge
7.654 BO 622.7 622.69
7.633 622.63
7.199 BN 621.8 621.82
7.190 Interstate 43 RA Bridge
FIGURE 1 Example Modeling Cross Section Showing Pre- and Post-project Surfaces Lincoln Park/Milwaukee River Basis of Design Report
605.00
607.00
609.00
611.00
613.00
615.00
617.00
619.00
621.00
623.00
625.00
500.00 550.00 600.00 650.00 700.00 750.00
PreProject Surface
Post Project Surface
Average Depth of Dredge: 1 ft
Extent of Sediment Removal and Channel Restoration
Anticipated Backwater Water Surface Elevation
MKE/110050005 9

LINCOLN CREEK AND WESTERN OXBOW BANK STABILIZATION DESIGN: INTERIM PRE-FINAL DESIGN REPORT UPDATE
Modeling iterations were completed using the post-project HEC-RAS models to compare the pre-project to post-project water surface elevations. The modeling (and post-project cross sections) was considered complete when it confirmed that flood elevations did not increase as a result of the bank stabilization and channel bottom regrading. Appendix I contains the post-project cross sections used in the hydraulic models. The design cross sections were simulated with the 100-year design storm, and the resulting water surface elevation were compared to the pre-project 100-year design stormwater surface elevations.
Lincoln Creek
Table 4 compares the Lincoln Creek pre- and post-project water surface elevations.
TABLE 4 Comparison of 100-Year Water Surface Elevations Pre- and Post-project for Lincoln Creek between 32nd Street Bridge and the Milwaukee River Western Oxbow Lincoln Park/Milwaukee River Basis of Design Report
River Station
Pre-project Water Surface Elevation (ft)
Design Cross Sections Water Surface Elevation (ft) Difference (ft)
1.95 634.44 634.44 0
1.92 634.15 634.15 0
1.912 634.14 634.14 0
1.904 Bridge
1.9 633.77 633.76 -0.01
1.89 633.72 633.72 0
1.75 632.73 632.72 -0.01
1.74 632.82 632.81 -0.01
1.73 Bridge
1.721 632.21 632.2 -0.01
1.72 632.16 632.15 -0.01
1.67 631.09 631.08 -0.01
1.65 630.88 630.87 -0.01
1.645 Bridge
1.64 630.2 630.18 -0.02
1.63 630.28 630.26 -0.02
1.56 629.99 629.97 -0.02
1.54 629.9 629.88 -0.02
1.53 629.51 629.48 -0.03
1.522 Bridge
1.514 629 628.96 -0.04
1.51 629.05 629.01 -0.04
1.47 629.06 629.01 -0.05
10 MKE/110050005

LINCOLN CREEK AND WESTERN OXBOW BANK STABILIZATION DESIGN: SUPPLEMENT TO THE BASIS OF DESIGN REPORT
TABLE 4 Comparison of 100-Year Water Surface Elevations Pre- and Post-project for Lincoln Creek between 32nd Street Bridge and the Milwaukee River Western Oxbow Lincoln Park/Milwaukee River Basis of Design Report
River Station
Pre-project Water Surface Elevation (ft)
Design Cross Sections Water Surface Elevation (ft) Difference (ft)
1.37 628.76 628.7 -0.06
1.33 627.98 627.89 -0.09
1.31 628.04 627.96 -0.08
1.3 627.85 627.77 -0.08
1.289 Bridge
1.28 627.12 627.02 -0.1
1.27 626.75 626.63 -0.12
1.25 626.92 626.8 -0.12
1.23 626.91 626.79 -0.12
1.22 626.86 626.74 -0.12
1.17 626.62 626.49 -0.13
1.12 626.16 626 -0.16
1.07 625.76 625.55 -0.21
0.93 625.27 625.01 -0.26
0.915 625.2 624.93 -0.27
0.912 Bridge
0.909 625.17 624.9 -0.27
0.82 625.11 624.83 -0.28
0.81 624.96 624.66 -0.3
0.803 Bridge
0.794 624.79 624.48 -0.31
0.79 624.76 624.45 -0.31
0.75 624.63 624.31 -0.32
0.71 624.5 624.15 -0.35
0.62 624.09 623.67 -0.42
0.61 623.63 623.15 -0.48
0.6 623.43 622.92 -0.51
0.54 623.48 622.92 -0.56
0.5 623.43 622.81 -0.62
0.47 623.34 622.66 -0.68
0.44 622.78 622.04 -0.74
MKE/110050005 11
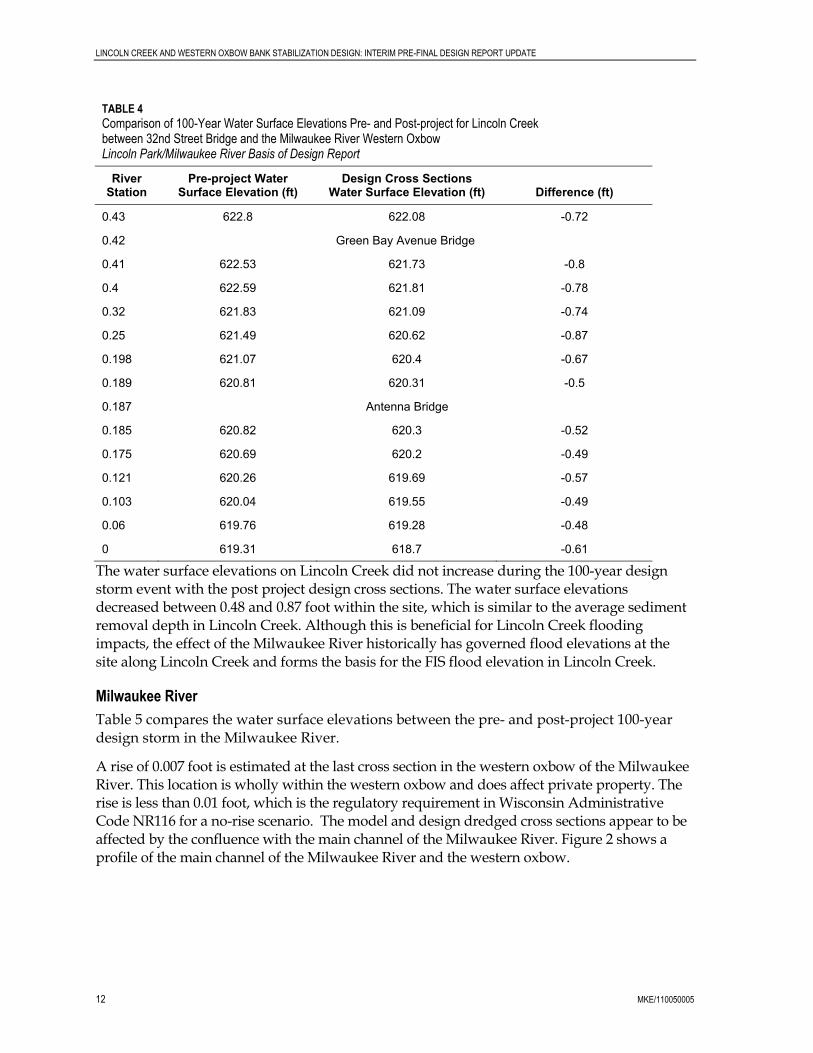
LINCOLN CREEK AND WESTERN OXBOW BANK STABILIZATION DESIGN: INTERIM PRE-FINAL DESIGN REPORT UPDATE
TABLE 4 Comparison of 100-Year Water Surface Elevations Pre- and Post-project for Lincoln Creek between 32nd Street Bridge and the Milwaukee River Western Oxbow Lincoln Park/Milwaukee River Basis of Design Report
River Station
Pre-project Water Surface Elevation (ft)
Design Cross Sections Water Surface Elevation (ft) Difference (ft)
0.43 622.8 622.08 -0.72
0.42 Green Bay Avenue Bridge
0.41 622.53 621.73 -0.8
0.4 622.59 621.81 -0.78
0.32 621.83 621.09 -0.74
0.25 621.49 620.62 -0.87
0.198 621.07 620.4 -0.67
0.189 620.81 620.31 -0.5
0.187 Antenna Bridge
0.185 620.82 620.3 -0.52
0.175 620.69 620.2 -0.49
0.121 620.26 619.69 -0.57
0.103 620.04 619.55 -0.49
0.06 619.76 619.28 -0.48
0 619.31 618.7 -0.61
The water surface elevations on Lincoln Creek did not increase during the 100-year design storm event with the post project design cross sections. The water surface elevations decreased between 0.48 and 0.87 foot within the site, which is similar to the average sediment removal depth in Lincoln Creek. Although this is beneficial for Lincoln Creek flooding impacts, the effect of the Milwaukee River historically has governed flood elevations at the site along Lincoln Creek and forms the basis for the FIS flood elevation in Lincoln Creek.
Milwaukee River
Table 5 compares the water surface elevations between the pre- and post-project 100-year design storm in the Milwaukee River.
A rise of 0.007 foot is estimated at the last cross section in the western oxbow of the Milwaukee River. This location is wholly within the western oxbow and does affect private property. The rise is less than 0.01 foot, which is the regulatory requirement in Wisconsin Administrative Code NR116 for a no-rise scenario. The model and design dredged cross sections appear to be affected by the confluence with the main channel of the Milwaukee River. Figure 2 shows a profile of the main channel of the Milwaukee River and the western oxbow.
12 MKE/110050005

LINCOLN CREEK AND WESTERN OXBOW BANK STABILIZATION DESIGN: SUPPLEMENT TO THE BASIS OF DESIGN REPORT
FIGURE 2 Comparison of 100-year Water Surface Elevations and Channel Bottom Pre- and Post-project for the Milwaukee River between Silver Spring Road and Interstate 43 Lincoln Park/Milwaukee River Basis of Design Report
TABLE 5 Comparison of 100-Year Water Surface Elevations Pre- and Post-project for the Milwaukee River between Good Hope Road and Interstate 43 Lincoln Park/Milwaukee River Basis of Design Report
River Station Pre-project Water
Surface Elevation (ft) Design Cross Section Water
Surface Elevation (ft) Difference
(ft)
11.940 Good Hope Rd Bridge
11.923 639.21 639.21 0
11.919 CP 639.01 639.01 0
11.795 CO 638.53 638.53 0
11.573 636.61 636.61 0
11.55 636.51 636.51 0
11.537 CN 636.38 636.38 0
11.530 Green Tree Rd Bridge
11.524 CM 635.49 635.49 0
11.488 635.29 635.29 0
11.228 CL 634.50 634.50 0
10.937 CK 634.28 634.28 0
38000 40000 42000 44000 46000
600
610
620
630
640
MilwaukeerivEncroahStudy032707 Plan: 1) DesignXS 12/2/2010 2) DO_SO_Survey 11/23/2010 Geom: DesignCrossSections
650
Main Channel Distance (ft)
Elev
atio
n (ft
)
Legend
WS 100-Yr Flow - DesignXS
WS 100-Yr Flow - DO_SO_Survey
Ground
Ground
7.16
07.
170
7.19
0
7.63
37.
654
7.66
9
7.71
7.77
617.
9000
8.00
31
8.04
88
8.08
1
8.12
4
8.13
118.
1420
8.22
9
8.34
18.
357
8.36
08.
394
8.57
9
8.66
0
8.71
6
8.74
0
8.78
3
Milwaukee River Lower Reach Milwaukee River Right Split Milwaukee River Upper Reach
100-year Design Storm Event Water Surface Elevation Post-project
channel bottom
Pre-project channel bottom
MKE/110050005 13

LINCOLN CREEK AND WESTERN OXBOW BANK STABILIZATION DESIGN: INTERIM PRE-FINAL DESIGN REPORT UPDATE
TABLE 5 Comparison of 100-Year Water Surface Elevations Pre- and Post-project for the Milwaukee River between Good Hope Road and Interstate 43 Lincoln Park/Milwaukee River Basis of Design Report
River Station Pre-project Water
Surface Elevation (ft) Design Cross Section Water
Surface Elevation (ft) Difference
(ft)
10.489 CJ 633.49 633.49 0
10.351 CI 633.22 633.22 0
10.340 Kletsch Park Dam Bridge
10.326 633.15 633.15 0
10.26 632.91 632.91 0
10.231 CH 632.80 632.80 0
10.226 632.78 632.78 0
10.220 Railroad Bridge Bridge
10.212 CG 632.49 632.49 0
10.192 632.40 632.40 0
10.051 CF 631.32 631.32 0
10.040 Bender Rd Bridge
10.023 631.37 631.37 0
10.009 CE 631.23 631.23 0
9.846 CD 629.99 629.99 0
9.669 CC 629.08 629.08 0
9.427 CB 628.36 628.36 0
9.125 CA 627.10 627.10 0
8.963 BZ 626.63 626.63 0
8.783 626.18 626.18 0
8.759 BY 626.13 626.13 0
8.740 Silver Spring Rd Bridge
8.730 BX 625.99 625.99 0
8.716 626.00 626.00 0
8.660 BW 625.87 625.87 0
8.579 BV 625.55 625.55 0
8.394 BU 624.81 624.81 0
8.381 623.95 623.95 0
8.375 623.90 623.90 0
8.360 Railroad Bridge Bridge
8.357 622.63 622.63 0
14 MKE/110050005
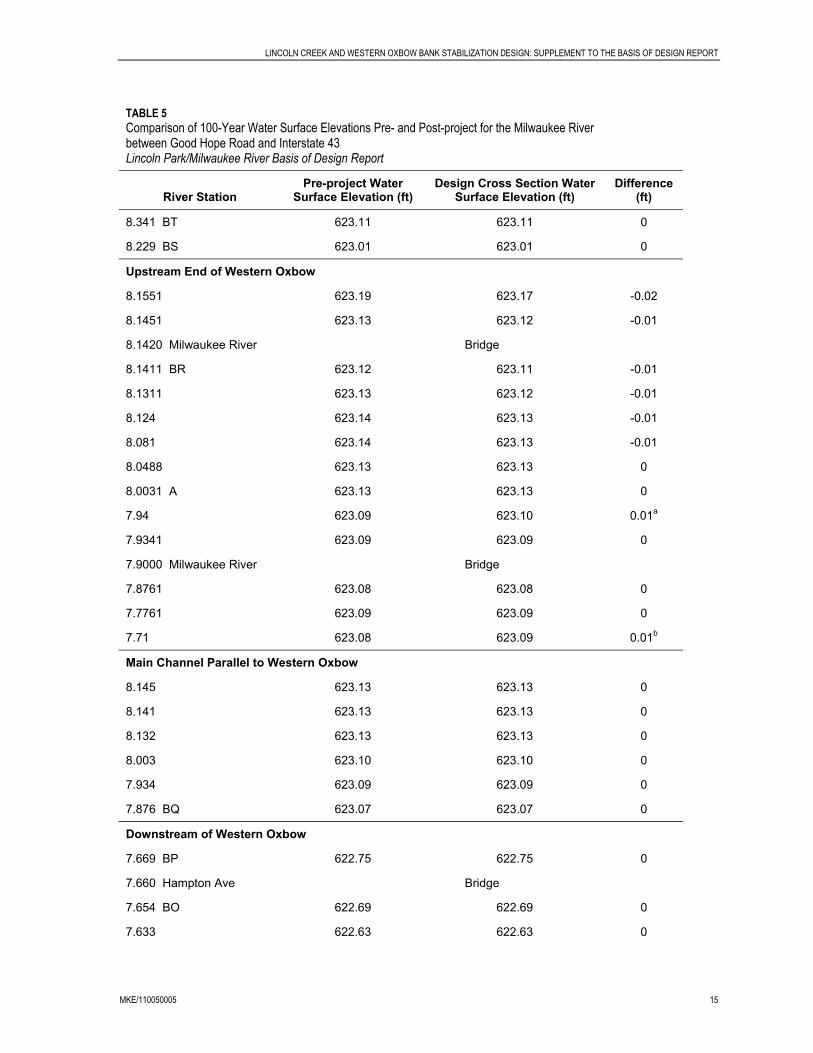
LINCOLN CREEK AND WESTERN OXBOW BANK STABILIZATION DESIGN: SUPPLEMENT TO THE BASIS OF DESIGN REPORT
TABLE 5 Comparison of 100-Year Water Surface Elevations Pre- and Post-project for the Milwaukee River between Good Hope Road and Interstate 43 Lincoln Park/Milwaukee River Basis of Design Report
River Station Pre-project Water
Surface Elevation (ft) Design Cross Section Water
Surface Elevation (ft) Difference
(ft)
8.341 BT 623.11 623.11 0
8.229 BS 623.01 623.01 0
Upstream End of Western Oxbow
8.1551 623.19 623.17 -0.02
8.1451 623.13 623.12 -0.01
8.1420 Milwaukee River Bridge
8.1411 BR 623.12 623.11 -0.01
8.1311 623.13 623.12 -0.01
8.124 623.14 623.13 -0.01
8.081 623.14 623.13 -0.01
8.0488 623.13 623.13 0
8.0031 A 623.13 623.13 0
7.94 623.09 623.10 0.01a
7.9341 623.09 623.09 0
7.9000 Milwaukee River Bridge
7.8761 623.08 623.08 0
7.7761 623.09 623.09 0
7.71 623.08 623.09 0.01b
Main Channel Parallel to Western Oxbow
8.145 623.13 623.13 0
8.141 623.13 623.13 0
8.132 623.13 623.13 0
8.003 623.10 623.10 0
7.934 623.09 623.09 0
7.876 BQ 623.07 623.07 0
Downstream of Western Oxbow
7.669 BP 622.75 622.75 0
7.660 Hampton Ave Bridge
7.654 BO 622.69 622.69 0
7.633 622.63 622.63 0
MKE/110050005 15

LINCOLN CREEK AND WESTERN OXBOW BANK STABILIZATION DESIGN: INTERIM PRE-FINAL DESIGN REPORT UPDATE
TABLE 5 Comparison of 100-Year Water Surface Elevations Pre- and Post-project for the Milwaukee River between Good Hope Road and Interstate 43 Lincoln Park/Milwaukee River Basis of Design Report
River Station Pre-project Water
Surface Elevation (ft) Design Cross Section Water
Surface Elevation (ft) Difference
(ft)
7.199 BN 621.82 621.82 0
7.190 Interstate 43 RA Bridge a Actual water surface elevation rise is 0.004 ft. Due to rounding of water surface elevation values within the model, rise calculated in this table as 0.01 ft. b Actual water surface elevation rise is 0.007 ft. Due to rounding of water surface elevation values, rise calculated in this table as 0.01 ft.
The profile shows that the post project channel bottom is lower than the original channel and must connect back to the main channel at an adverse slope. To determine if this was the cause of the 0.007-foot rise, the post-project model was simulated with higher channel inverts. This area of the river is expected to fill in naturally with sediment over time because of both the low gradient in the reach now with the Estabrook Park Dam open and the anticipated backwater condition with the Estabrook Park Dam closed. When the last two channel cross sections in the western oxbow were raised to simulate the anticipated natural sedimentation similar pre-project conditions (raise invert elevations in the middle of the channel), the model results indicated no rise in water surface elevation along the Milwaukee River.
The small rise in the western oxbow appears to be a result of the channel bed profile and the confluence with the Milwaukee River. While backfilling the channel to raise the bed elevation provides model output that provides for no-rise, this does not appear to be necessary because backfilling the channel is contrary to the project objectives of sediment removal, the maximum simulated rise in 100-year design stormwater surface elevation is less than 0.01 foot (0.007 foot) and occurs within the site, does not affect private property, and the channel is expected to fill in naturally over time with the backwater condition created by the Estabrook Park Dam.
Stormwater Outfalls. Stormwater outfalls along the project area will be preserved. There are five known outfalls within the site. Flows from the outfalls will be managed during the excavation and restoration construction, as are discussed later in this section. A detailed evaluation of the flooding and hydraulic impacts of the restored channel on the stormwater pipes and tributary pipes will not be conducted because the project will maintain the existing outfall. However, the project goal not to raise the flood stage should not adversely affect the outfalls, pipes, or in-pipe water levels.
Stormwater Outfalls and Utility Conflicts. Five stormwater outfalls have been identified and incorporated into the restoration design. Their locations are shown on the drawings.
• The first outfall (from upstream to downstream) is immediately downstream of the Green Bay Avenue Bridge. The storm sewer outfall is at a hole cut through the sheet pile wall along the northern bank of the creek to allow the outfall to protrude through. The outfall invert elevation is 612.55 feet and is about 4.5 feet below the anticipated backwater water surface elevation of 617 to 617.4 feet. No modifications are planned for this outfall.
16 MKE/110050005

LINCOLN CREEK AND WESTERN OXBOW BANK STABILIZATION DESIGN: SUPPLEMENT TO THE BASIS OF DESIGN REPORT
• A second outfall also protrudes through the sheet pile wall near the bend in Lincoln Creek as the channel bends south. It has an invert elevation of 613.5 feet. No modifications are planned for this outfall.
• A third outfall exists directly under the western abutment of the antenna bridge. The outfall invert elevation is 611.83 and is very near the bottom elevation of the creek bed and more than 5 feet below the design assumption of the future backwater water surface elevation. No modifications are planned for the outfall.
• A corrugated metal pipe outfall is located along the western bank of Lincoln Creek about 160 feet upstream of the confluence with the western oxbow. The outfall invert elevation is about 614.4 feet, or about 3 feet below the anticipated backwater water surface elevation. The creek bank has eroded, and the pipe has been bent, broken, and twisted along the bank. The headwall of the outfall is also missing. During the bank stabilization, the pipe will be cut off 5 feet from the bank face (a location where the pipe is still structurally sound) and replaced with a new 12-inch corrugated metal pipe. A flared end section will form the new pipe outfall and will be installed flush with the restored bank surface. The new outfall invert will be similar to the existing, to maintain the hydraulic capacity of the upstream pipe network.
• A large box culvert is located at the southwest corner of the western oxbow. It has an invert elevation of about 613.35 feet, which will be maintained after restoration. The outfall apron and headwall have deteriorated. Rock will be used to stabilize the bank in this area to reduce erosion and to protect the structure. A pool has been created by the water flowing out of the culvert. The pool will be kept as part of the restoration design to provide an area for energy dissipation from the outfall flow. No additional enhancements are expected to the outfall, because the box culvert outfall will be submerged with the anticipated backwater water surface elevation.
An AT&T communications conduit (4-conduit bundle) is partially exposed on the east bank of Lincoln Creek about 50 feet north of the antenna bridge. The conduit crosses the river and is exposed in some areas of the creek bottom. A manhole about 30 feet west of the western creek bank also exists. Milwaukee County has been in communication with AT&T to coordinate relocation or removal of the conduit and associated infrastructure. For purposes of the remedial action, the conduit is expected to be relocated and will not require design coordination with the sediment removal or bank stabilization design.
Bank Restoration. The bank restoration will use native vegetation for areas of the project site above the backwater water surface elevation. The restoration details are shown on the drawings. The restoration design accounts for the large variations in water levels between low- and flood-flow events, by selecting vegetation for the bioengineered bank stabilization that will function across the water levels. On the lower part of the bank (within 3.5 vertical feet of backwater water surface elevation), vegetation was selected that can survive temporarily inundated or wet soil conditions. Above the 3.5 feet to the top of the bank, vegetation was chosen that could withstand less frequent inundation while providing slope stability to the bioengineered banks. At the top of the bank, a low maintenance (no mow) grass seed mixture that has been applied in other Milwaukee County parks will be used. No tree plantings are expected. The vegetation schedules are shown on the drawings (Appendix B).
MKE/110050005 17

LINCOLN CREEK AND WESTERN OXBOW BANK STABILIZATION DESIGN: INTERIM PRE-FINAL DESIGN REPORT UPDATE
Depending on the side slopes and height of the banks affected by sediment removal, from the toe of slope to the top of the bank, different bioengineering techniques will be used. Along Lincoln Creek, when the banks are less than 10 feet high, a combination of a single soil lift with an erosion control fabric will be used. The straw and coir blend erosion fabric will provide temporary stabilization until the vegetation is established.
In areas where the banks are greater than 10 feet (up to a project maximum of 20 feet), soil lifts are used in 1-foot increments reinforced by a biaxial geogrid. The geogrid is needed to provide geotechnical stability for the tall and steep banks, to prevent slumping and slope failure. Each soil lift will be wrapped with a biodegradable woven netting to provide temporary stabilization until the vegetation is established. A straw and coir blend erosion matting will be provided between the woven netting and the soil to retain fine grained sediment in the soil lift until the vegetation is established.
These restoration techniques are also used in the western oxbow, but the flow velocity and shear stresses in some areas of the oxbow do not require highly engineered stabilization techniques as in Lincoln Creek. In areas with shallow side slopes and bank heights less than 10 feet, the banks will be sloped and covered with a biodegradable straw and coir blend erosion fabric to provide temporary stabilization until the vegetation is established. Appendix B contains details of the bank restoration techniques, and plan view drawings showing locations where the details will be applied in the creek and western oxbow.
Soil for the bank stabilization will be either imported, obtained from the Calumet stockpile at the Moss American site, or a combination of the two. The Calumet stockpile consists of sandy silt floodplain soils, with some gravel. The gravels will require screening, but the silty soils are anticipated to support the vegetated bank stabilization.
Rock will be used along the perimeter at the backwater water surface elevation and below, in areas that have side slopes 2H:1V (horizontal:vertical) or steeper. This includes the entire length of Lincoln Creek, except along the sheet pile and select areas within the oxbow. The rock will provide a stable foundation on which to construct the bank restoration and will provide erosion protection from flowing water. Vegetation will be planted above the rock. When the vegetation is established, it is expected to cover the rock so it will not be visible. Because of the steep side slopes observed at the site and the design assumption of backwater from the Estabrook Park Dam creating water depths near 6 feet deep along the banks, using earthen banks (with vegetation) was not possible.
Rock will be used at the upstream and downstream side of the bridge crossings, such as downstream of Green Bay Avenue, upstream and downstream of the antenna bridge, and between the end of the sheetpile in Lincoln Creek and the antenna bridge. Rock will extend from the toe of slope to the top of the bank where the stabilization ties into existing stable areas. In areas above the backwater water surface elevation, the rock will be covered with soil, seed, mulch, and erosion fabric, and will be “joint planted” with live cuttings and container plants. Joint planting the rock above the backwater elevation will cover the rock but allow it to provide armament when erosive forces occur.
Rock Size. The rock needed for the bank stabilization was determined using methods developed by the USGS (1943) using stream velocity information obtained from the HEC-RAS hydraulic models. Rock D50 values were calculated using the following equation:
18 MKE/110050005

LINCOLN CREEK AND WESTERN OXBOW BANK STABILIZATION DESIGN: SUPPLEMENT TO THE BASIS OF DESIGN REPORT
D50 = 0.055 Va2.44
Where:
D50 = nominal diameter of rock (ft) Va = average channel velocity in (fps) (provided)
The D50 value was check-verified with other methods that also base rock sizing on channel velocity. These included Brown and Clyde (1989), the California Department of Public Works (1970), Maynord (1978), and the U.S. Army Corps of Engineers (1985). The average of the rock size values calculated using these criteria were compared with the results obtained using the USGS method. Values obtained were then compared with Wisconsin Department of Transportation specification section 606 resulting in rock gradation requirement of “heavy riprap.”
Riprap thickness was selected to include all the rocks in the specified gradation within the layer. Oversized stones may contribute to failure by creating turbulence. Based on Brown and Clyde (1989), the riprap thickness normal to the slope should meet the criterion of not less the 350 mm, not less than (1.5)*(D50), and not less than D100.
The back slope and vertical extent of the riprap was determined based on properties of the materials specified and industry accepted standards. The unreinforced design slope will not be steeper than 2H:1V and the riprap will continue to the design water level (future permanent pool elevation) and include at least 1 foot of free board.
Toe scour is the most common cause of slope failure. Scour depths were calculated based on calculate D50 values using methods established by Brown and Clyde (1989). A rock filled toe trench is provided at the toe of the slope to prevent undermining.
Lincoln Creek Bottom Design
The drawings (Appendix B) show the bottom contours of Lincoln Creek. The contours were determined by modeling requirements to not increase the flood stage, and to minimize regrading the areas after sediment removal. Along the sheet pile near Green Bay Avenue, a pool was maintained along the outside bend. Downstream of the bend, the creek bottom grading includes a minor swale in the center of the channel to convey low flows until after the sediment removal project is complete and Estabrook Dam is closed to create the backwater. Much of Lincoln Creek will be backwater even before the Estabrook Dam is closed. This is because the sediment removal will lower Lincoln Creek 1 foot to 2 feet, which is more than the pre-project water surface elevation difference from the upstream end of Lincoln Creek (Green Bay Avenue) to the downstream extents at the mainstem of the Milwaukee River.
Western Oxbow Bottom Design
The drawings (Appendix B) show the bottom contours of the western oxbow. The contours were determined by modeling requirements to not increase the flood stage, and to minimize regrading the areas after sediment removal. Because large sediment removal depths are expected to create deep pools in parts of the western oxbow, the bottom contouring will maintain these areas and provide diversity of water depths.
MKE/110050005 19
LINCOLN CREEK AND WESTERN OXBOW BANK STABILIZATION DESIGN: INTERIM PRE-FINAL DESIGN REPORT UPDATE
The northern part of the oxbow includes an area that does require remedial action. This area will require regrading to blend upstream bottom elevations with downstream bottom elevations.
The rest of the western oxbow will have a permanent pool of water created by the main stem of the Milwaukee River. The bottom contours will provide varying water depths to support target fisheries and to minimize major earthwork. The western oxbow area is a natural depositional area, especially under the historical and anticipated Estabrook Park Dam operations that will provide deep water and slow velocities. The deeper water created after sediment removal will naturally fill in over time because of the apparent abundant supply of sediment from upstream sources and because it is a much wider and deeper area than Lincoln Creek or the Milwaukee River. Deposition will likely result in the disappearance of some of the deep water habitat over time compared to that immediately available after construction.
Target Fisheries
Northern pike and smallmouth bass species that could benefit from habitat enhancements and improved recreational and subsistence fishing opportunities. Northern pike spawning habitat has been identified as limiting the reproductive success and adult abundance of this species in the Milwaukee River and Lincoln Creek systems. Northern pike spawn from early March through the end of April or early May, depending on seasonal water temperatures. Critical habitat characteristics for successful spawning are adequate water depths during the spawning periods, ample aquatic vegetation for larval attachment, and low water velocity during the post-spawning, larval period. Preferred water depth is greater than 6 inches to water depths that can support rooted aquatic vegetation (roughly 3 to 4 feet). Because Estabrook Park Dam is expected to create a backwater condition with low velocities and depths greater than 6 inches throughout the site, the remedial action will support northern pike spawning and larval period habitat. However, aquatic vegetation planting will be needed in the future to provide habitat supportive of northern pike.
Smallmouth bass summer habitat improvements have been directly targeted. Reports from stakeholders indicate the presence of young smallmouth bass in the project area, but that adults do not generally reside in the project area during the warmer summer months. The focus of smallmouth bass habitat restoration is to increase adult summer habitat. Adult smallmouth bass need deeper pools of water in the summer to sustain summer temperatures and to provide bass with ample forage. Adult smallmouth bass habitat is provided by incorporating deeper and larger pools into the western oxbow restoration plan, which are anticipated throughout the year. Adult northern pike also need these types of habitat, so habitat improvements made for the smallmouth bass will also benefit northern pike. The habitat improvements support achievement of the remedial action objectives but long term sustainability of these habitats may not be possible because of sedimentation that may continue in the western oxbow and Lincoln Creek.
References Brown, S., and E. Clyde. March 1989. Design of Riprap Revetments. U.S. Department of Transportation, Federal Highway Administration, FHWA IP-89-016, Washington, D.C.
20 MKE/110050005

LINCOLN CREEK AND WESTERN OXBOW BANK STABILIZATION DESIGN: SUPPLEMENT TO THE BASIS OF DESIGN REPORT
California Department of Public Works, Division of Highways. 1970. Bank and Shore Protection in California Highway Practice.
Maynord, S. T. 1978. Practical Riprap Design. Miscellaneous Paper H-78-7, Hydraulics Laboratory, U.S. Army Engineer Waterways Experiment Station, Vicksburg, Miss.
Milwaukee Metropolitan Sewerage District (MMSD). March 6, 2002. Lincoln Creek Flood Control—Phase II Design.
U.S. Army Corps of Engineers. 1994. Hydraulic Design of Flood Control Channels. Engineers Manual EM-1110-2-1601.
U.S. Army Corps of Engineers. 1985. Design of Coastal Revetments, Seawalls, and Bulkheads. Engineering Manual EM-1110-2-1614. April.
U.S. Geologic Survey. 1943. Methods and Practices of the Geological Survey. U.S. Government Printing Office, Washington, D.C.
Wisconsin Department of Transportation. 2003. Standard Specifications for Highway and Structure Construction.
MKE/110050005 21

Appendix L Construction Schedule

ID Task Name Duration Start Finish Predecessors
1 LINCOLN PARK/MILWAUKEE RIVER RA SCHEDULE 0 days Fri 3/4/11 Fri 3/4/11
2
3 REMEDIAL ACTION 163 days Fri 3/4/11 Fri 10/21/11
4 Remedial Action Work Planning 74 days Fri 3/4/11 Thu 6/16/11
5 USEPA Preparation of RA WAF 30 edays Fri 3/4/11 Sun 4/3/11
6 CH2M HILL Receives RA WAF 0 days Sun 4/3/11 Sun 4/3/11 5
7 Work Plan Preparation 30 edays Sun 4/3/11 Tue 5/3/11 6
8 CH2M HILL Submits Work Plan 0 days Tue 5/3/11 Tue 5/3/11 7
9 USEPA Work Plan Review 30 edays Tue 5/3/11 Thu 6/2/11 8
10 Work Plan Negotiations 7 edays Thu 6/2/11 Thu 6/9/11 9
11 Revised Work Plan Preparation 7 edays Thu 6/9/11 Thu 6/16/11 10
12 Submit Revised Work Plan to USEPA 1 day Thu 6/16/11 Thu 6/16/11 11
13 USEPA Notice to Proceed 0 days Thu 6/16/11 Thu 6/16/11 12
14 Subcontractor Procurement 57 days Fri 3/4/11 Tue 5/24/11
15 Send Out RFP's 0 days Fri 3/4/11 Fri 3/4/11
16 Prebid Meeting 1 day Mon 3/14/11 Mon 3/14/11 15FS+10 edays
17 Subcontractor Develops Bids 30 edays Fri 3/4/11 Sun 4/3/11 15SS
18 Vendor/Subcontractors Submit Bids 0 days Mon 4/4/11 Mon 4/4/11 17FS+1 day
19 CH2M HILL Evaluates Bids 15 edays Mon 4/4/11 Tue 4/19/11 18
20 USEPA Review of Consent Package 9 edays Wed 4/20/11 Fri 4/29/11 19FS+2 days
21 CH2M HILL Issues Notice of Award 0 days Fri 4/29/11 Fri 4/29/11 20
22 Subcontractor Submittal Preparation 15 edays Mon 5/2/11 Tue 5/17/11 21FS+2 days
23 CH2M HILL Review of Subcontractor Submittals 7 edays Tue 5/17/11 Tue 5/24/11 22
24 CH2M HILL Issues Notice To Proceed 0 days Tue 5/24/11 Tue 5/24/11 23
25 On Site Construction 2 days Wed 6/8/11 Thu 6/9/11
26 Subcontractor Mobilizes to Site 2 days Wed 6/8/11 Thu 6/9/11 24FS+10 days
27 Site Preparation Tasks 13 days Fri 6/10/11 Tue 6/28/11
28 Construct Pads 4 days Fri 6/10/11 Wed 6/15/11 26
29 Establish Access Roads 3 days Thu 6/16/11 Mon 6/20/11 28
30 Mobilize Water Treatment Plant and Office Trailers 3 days Tue 6/21/11 Thu 6/23/11 29
31 Install Fence 3 days Fri 6/24/11 Tue 6/28/11 30
32 Water Management Tasks 25 days Fri 6/10/11 Fri 7/15/11
33 Sheetpile Installation 25 days Fri 6/10/11 Fri 7/15/11
34 Sheetpile at Junction of Zones 1, 2a, and 2b 14 days Fri 6/10/11 Wed 6/29/11 26
35 Sheetpile at South End of Zone 3a 11 days Thu 6/30/11 Fri 7/15/11 34
36 Lincoln Creek Berm Installation 3 days Thu 6/30/11 Tue 7/5/11 34
37 Sediment Excavation and Restoration 60 days Thu 6/30/11 Sat 9/24/11
38 Lincoln Park - Zone 1 18 days Thu 6/30/11 Wed 7/27/11
39 Install Water Bypass 7 edays Thu 6/30/11 Thu 7/7/11 36SS
40 Sediment Excavation 6 edays Thu 7/7/11 Wed 7/13/11 39
41 Restoration 15 edays Tue 7/12/11 Wed 7/27/11 40SS+5 edays
42 West Oxbow - Zone 2a 22 days Thu 7/7/11 Sun 8/7/11
43 Sediment Excavation 22 edays Thu 7/7/11 Fri 7/29/11 40SS
44 Restoration 21 edays Sun 7/17/11 Sun 8/7/11 43SS+10 edays
45 West Oxbow - Zone 2b 34 days Sun 8/7/11 Sat 9/24/11
46 Install Water Bypass 7 edays Sun 8/7/11 Sun 8/14/11 44
47 Sediment Excavation 28 edays Mon 8/15/11 Mon 9/12/11 46FS+1 day
48 Restoration 25 edays Tue 8/30/11 Sat 9/24/11 47SS+15 edays
49 West Oxbow - Zone 3a 9 days Mon 8/15/11 Sun 8/28/11
50 Sediment Excavation 8 edays Mon 8/15/11 Tue 8/23/11 47SS
51 Restoration 8 edays Sat 8/20/11 Sun 8/28/11 50SS+5 edays
52 Subcontractor Demobilizes from Site 20 days Mon 9/26/11 Fri 10/21/11 38,42,45,49
53 Sheetpile Removal 20 days Mon 9/26/11 Fri 10/21/11
54 Remove Water Treatment Plant Equipment 2 days Mon 9/26/11 Tue 9/27/11
55 Remove Fencing 2 days Wed 9/28/11 Thu 9/29/11 54
56 Demolish Pad 3 days Fri 9/30/11 Tue 10/4/11 55
57 Final Grading and Vegetation Establishment 3 days Wed 10/5/11 Fri 10/7/11 56
3/4
4/3
5/3
6/16
3/4
4/4
4/29
5/24
2/27 3/6 3/13 3/20 3/27 4/3 4/10 4/17 4/24 5/1 5/8 5/15 5/22 5/29 6/5 6/12 6/19 6/26 7/3 7/10 7/17 7/24 7/31 8/7 8/14 8/21 8/28 9/4 9/11 9/18 9/25 10/2 10/9 10/16
March April May June July August September October
Qtr 2, 2011 Qtr 3, 2011 Qtr 4, 2011
Task
Split
Progress
Milestone
Summary
Project Summary
External Tasks
External Milestone
Deadline
Page 1
Project: Lincoln Park-Milw River Pre-Final RD-RA Schedule 03-02-11_7d24hr.mpp

Appendix M Construction Schedule Comparison

T E C H N I C A L M E M O R A N D U M
Remedial Action Schedule: Lincoln Park / Milwaukee River Channel Sediments Site PREPARED FOR: USEPA
WDNR Milwaukee County
PREPARED BY: CH2M HILL
DATE: March 3, 2011
The Preliminary Design Basis of Design Report for the Lincoln Park/Milwaukee River Channel Sediments Site included a proposed remedial action schedule in Appendix F. The remedial action schedule was based on a production rate of 1,000 cubic yards per day working an average of 5 days per week, 12 hours per day, as described in the Basis of Design Report.
USEPA, WDNR, Milwaukee County, and CH2M HILL reviewed the schedule and sequence of construction activities, including potential risks associated with working in an area susceptible to inundation from large volumes of stormwater in a short period of time. The design includes several components to reduce the risk of stopping work as a result of an inundation of stormwater. In addition, the team asked that CH2M HILL evaluate construction 7 days a week, 24 hours a day, to further reduce risk by reducing the duration of calendar days of work.
CH2M HILL developed a remedial action schedule that changes the construction operation to 7 days a week, 24 hours a day. Two options are depicted in the Table 1. Option 1 depicts a schedule based on an estimated excavation production rate of 1,570 cubic yards per day, but maintains the original duration for restoration. Option 2 depicts the increase in excavation production rate plus a 50 percent increase in the productivity of restoration activities. This schedule of operation begins with the water bypass installation and sediment excavation in Lincoln Creek. The schedule returns to 5 days a week, 12 hours a day after completion of the excavation and restoration of all areas. Table 1 depicts the changes in proposed schedule and duration as a result of the change from 5 days a week, 12 hours a day to 7 days a week, 24 hours a day.
Using a schedule of 7 days a week, 24 hours a day reduces the calendar days working in Lincoln Creek and the western oxbow of the Milwaukee River. This reduces the risk of stopping work as a result of inundation of stormwater. In addition, the overall duration of the project is reduced, allowing greater overall flexibility of schedule to complete the work within one construction season if storms force a pause in the work.
General equipment utilized to complete the remedial action is estimated to include the following:
• 2 to 3 track-mounted excavators
• 2 to 3 bulldozers
MKE/110050005 1
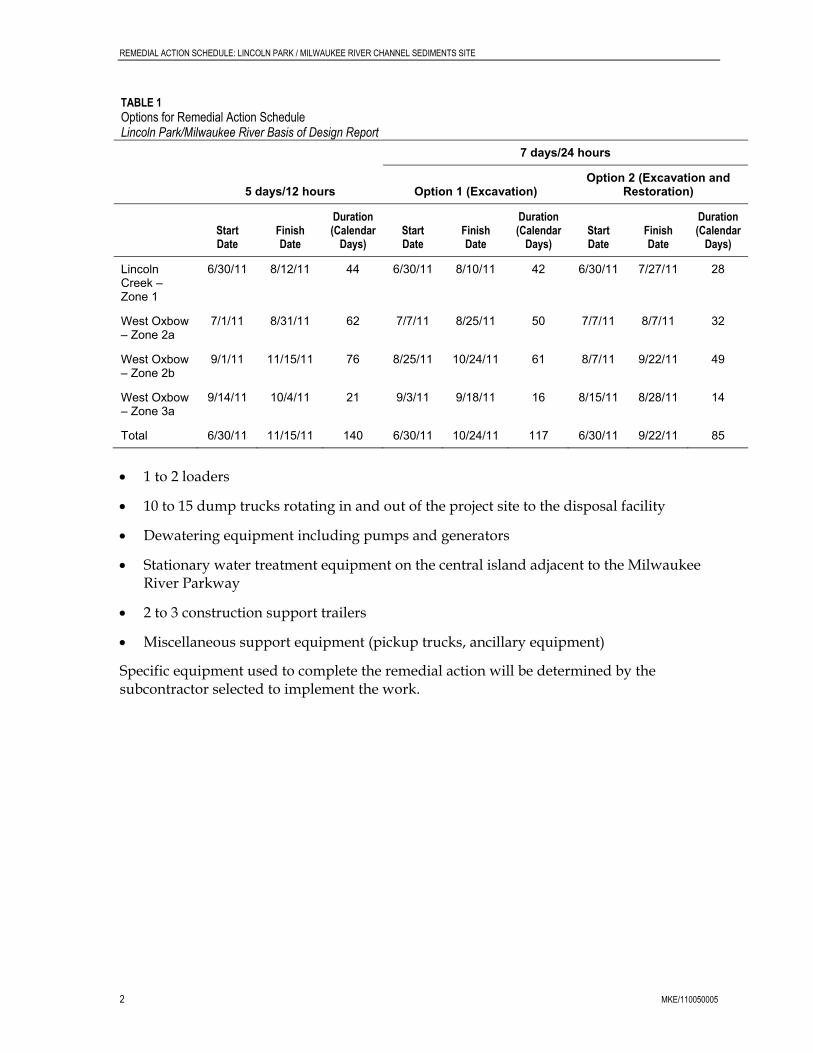
REMEDIAL ACTION SCHEDULE: LINCOLN PARK / MILWAUKEE RIVER CHANNEL SEDIMENTS SITE
2 MKE/110050005
TABLE 1 Options for Remedial Action Schedule Lincoln Park/Milwaukee River Basis of Design Report
7 days/24 hours
5 days/12 hours Option 1 (Excavation) Option 2 (Excavation and
Restoration)
Start Date
Finish Date
Duration (Calendar
Days) Start Date
Finish Date
Duration (Calendar
Days) Start Date
Finish Date
Duration (Calendar
Days)
Lincoln Creek – Zone 1
6/30/11 8/12/11 44 6/30/11 8/10/11 42 6/30/11 7/27/11 28
West Oxbow – Zone 2a
7/1/11 8/31/11 62 7/7/11 8/25/11 50 7/7/11 8/7/11 32
West Oxbow – Zone 2b
9/1/11 11/15/11 76 8/25/11 10/24/11 61 8/7/11 9/22/11 49
West Oxbow – Zone 3a
9/14/11 10/4/11 21 9/3/11 9/18/11 16 8/15/11 8/28/11 14
Total 6/30/11 11/15/11 140 6/30/11 10/24/11 117 6/30/11 9/22/11 85
• 1 to 2 loaders
• 10 to 15 dump trucks rotating in and out of the project site to the disposal facility
• Dewatering equipment including pumps and generators
• Stationary water treatment equipment on the central island adjacent to the Milwaukee River Parkway
• 2 to 3 construction support trailers
• Miscellaneous support equipment (pickup trucks, ancillary equipment)
Specific equipment used to complete the remedial action will be determined by the subcontractor selected to implement the work.

Appendix N Cost Estimate

LINCOLN PARK/MILWAUKEE RIVER SITEExcavation and Offsite DisposalMilwaukee, WIMarch 2011
Quantity Units Unit Cost Subtotal Total CommentsMobilization/Demobilization 2,408,261$
MOBILIZATION 1 LS 24,380$ 24,380$ Includes mob/demob of all civil equipment needed for the work.SITE PREPARATION 1 LS 26,866$ 26,866$ Clearing and grading of pad areas. Establish entrance roads to pad area. Establish admin parking area
WATER MANAGEMENT STRUCTURES INSTALL/REMOVE 1 LS 992,963$ 992,963$ Includes sheeting for water diversion as shown on the drawings. Includes earthen cut-off onstruction in Lincoln Creek.
INSTALL/MAINTAIN and REMOVE WATER MANAGEMENT PIPELINES 4,400 LF 104.94$ 461,752$ Includes installation and removal of 2 x 24 in x 2200 lf of water diversion piping from the Lincoln Creek Berm to Zone 1, 2a, 2b confluence.
HAUL ROAD INSTALLATION AND MAINTENANCE 1 LS 214,397$ 214,397$ Stone installation for truck entry into loading areas. Includes purchase of 1000 lf of board mats for access to the sediment excavation areas. All landside stone is removed for use under the site restoration item.
TRAFFIC CONTROL SIGNAGE 1 LS 42,998$ 42,998$ Includes detour signage to close Milwaukee Parkway during work hoursSITE SECURITY 1,607 HR 48.90$ 78,565$ Includes security guard during overnight working hours.CONSTRUCTION SURVEY CREW 45 DAY 1,553$ 69,379$ 20 days for every 30 days of excavation @ $1200/day plus office time.MOBILE LABORATORY MOBILIZATION 1 LS 4,600$ 4,600$ Vendor quote.MISC STORAGE FACILITIES, EQUIPMENT AND SUPPLIES 1 MO 3,850$ 3,850$ Storage trailers and misc supplies.PERIMETER FENCING 1 LF 75,900$ 75,900$ Includes 4 gates.SITE TRAILER AND UTILITIES 5 MO 3,978$ 19,889$ 2 trailers and electrical hookup from portable generator.ELECTRICAL CONNECTION ALLOWANCE 5 MO 18,418$ 92,090$ Mob/demob of generator, generator rental and fuel.EROSION CONTROL 1 LS 36,254$ 36,254$ Includes installation and maintenance of silt fence around all construction areas.SAFETY SUPPLY ALLOWANCE 1 LS 48,505$ 48,505$ Modified Level D for all personnel during sediment removal.DUST CONTROL 1 MO 180,303$ 180,303$ Includes water truck to maintain roads dust free.SUBMITTALS 1 LS 35,571$ 35,571$ Includes subcontractor plans and submittals.
Temporary Dewatering, WWT and Decontamination Pad Construction 188,158$
LEVEL/COMPACT AREA for DEWATERING, WWT and DECONTAMINATION PAD CONSTRUCTION 12,267 SY 0.77$ 9,461$ Assumes 500 x 200 dewatering pad, 20 x 40 decontamination pads and 80 x 80 WWT pad.INSTALL LINER AND UNDERLAYMENT 2,778 CY 51.64$ 143,433$ Includes, crusher run, PVC liner. ASPHALT PAD AND CURBS 100,000 SY -$ -$ 4 in asphalt surface and curbs.JERSEY BARRIERS/BIN BLOCKS 87 EA 160$ 13,942$ Ring dewatering/staging pads - 10' longSUMP AND SUMP PUMPS 2 LS 10,661$ 21,322$
Water Treatment Construction 444,286$ Includes 1 dirty and two clean Frac tanks Assumes holding water for initial testing only and then weekly testing
Capital Item
Lincoln Park ROM Estimate (1-5-11) V5 24 hpd ops_03-02-11.xls
RENTAL OF FRAC TANKS 5 MO 5,812$ 29,058$ Includes 1 dirty and two clean Frac tanks, Assumes holding water for initial testing only and then weekly testing thereafter.
MOB/DEMOB WWT SYSTEM 1 LS 36,855$ 36,855$ Includes mob and assembly of frac tanks, bag filters, carbon filters, hoses and all pumps.WATER TREATMENT SYSTEM RENTAL 5 MO 23,537$ 117,687$ Includes monthly rental of bag filter and carbon vessels.O&M COST/GALLON 1,100,000 GAL 0.23$ 252,061$ Includes system operation and expendables (carbon and bags)DISCHARGE MONITORING AND REPORTING 5 MO 1,725$ 8,625$ Quote from Mobile Lab supplier
Sediment Removal 2,381,455$ PUMP OUT SEGMENTS 96 DAY 11,915$ 1,139,607$ Includes labor, equipment and expendables to keep excavation areas dewatered.ADDITION OF DRYING AGENT (AVERAGE 5% PC) 1,001 TN 138$ 138,138$ Assumes 5% addition of Portland Cement to TSCA material.EXCAVATION/MIXING IN PLACE SEDIMENTS 96,600 CY 8.22$ 793,967$ Includes equipment, personnel and expendables to mix, move and dewater sediments.TRANSPORTATION OF MATERIAL TO DEWATERING PADS 14,300 CY 6.01$ 85,922$ Includes equipment, personnel and expendables to load and move TSCA sediments to pad.
MOBILE LABORATORY ANALYSIS 62 DAY 3,097$ 191,805$ Vendor quote to confirm PCB concentration in sediments daily during removal, 10 samples per day; 2 technicians.
OFFSITE LAB CONFIRMATION ANALYSIS 320 EA 100$ 32,016$ 4PIP2
Transpiration and Disposal Offsite 9,742,676$ LOAD TRUCKS WITH DEWATERED SEDIMENT 21,021 TON 40.31$ 847,416$ Includes mass of in-situ TSCA sediment + estimated additives.TRANSPORT DEWATERED SEDIMENT TO SUBTITLE D LANDFILL 115,220 TON 13.91$ 1,602,710$ 82,300 cy non-TSCA sediment x 1.4 tons/cy.DISPOSE DEWATERED SEDIMENT AT SUBTITLE D LANDFILL 115,220 TON 33.17$ 3,821,847$ 82,300 cy non-TSCA sediment x 1.4 tons/cy.TRANSPORT DEWATERED SEDIMENT TO SUBTITLE C LANDFILL 21,021 TON 41.09$ 863,711$ 14,300 cy TSCA sediment x 1.4 tons/cy + additives.DISPOSE DEWATERED SEDIMENT AT SUBTITLE C LANDFILL 21,021 TON 114.49$ 2,406,694$ 14,300 cy TSCA sediment x 1.4 tons/cy + additives.VERIFICATION SAMPLING PRIOR TO TRANSPORT 42 EA 132.25$ 5,560$ 1 sample for PCBs and 1 paint filter/500 tons.TRANSPORT AND DISPOSE DEBRIS AT SUBTITLE D LANDFILL 200 TON 48.37$ 9,675$ Item for large debris located in the dredge prism.DEMO DEWATERING PADS 3,385 TON 5.01$ 16,945$ Item for disposal of all work pads at end of project.TRANSPORT AND DISPOSE DEWATERING PAD MATERIALS TO SUBTITLE D LANDFILL 3,385 TON 49.67$ 168,117$ Item for transportation of all work pads at end of project.
Site Restoration 1,008,875$ DEMO AND GRADE ACCESS, DEWATERING and DECON AREAS 18,922 SY 0.90$ 17,097$ Includes removal and loading of pads and grading of area at end of project.TOPSOIL AND SEED 4 AC 18,067$ 72,267$ Includes 4 in topsoil and seeding.PLANTING 31,743 EA 3.73$ 118,427$ Per current drawings.ADDITIONAL FEATURES 12.5 EA 6,000$ 75,000$ EROSION CONTROL 272,250 SF 2.67$ 726,084$ Includes all fill, coir, coil logs, erosion control matting, ect per current drawings.
Demobilize 125,603$ RECORD DRAWINGS/TOPO INFORMATION 1 LS 14,950$ 14,950$ SUBCONTRACT CONTRACT CLOSEOUT 1 LS 25,875$ 25,875$ DEMOBILIZE EQUIPMENT 1 LS 84,778$ 84,778$
SUBCONTRACT SUBTOTAL 16,299,314$
Contingency 4% 651,973$
SUBCONTRACT TOTAL 16,951,286$
Payment/Performance Bonds and Insurance 1.5% 254,269$
SUBTOTAL 17,205,555$
Contractor Professional/Technical Services 5,548,723$ Field Project Management 8% 1,376,444$ Home Office Project Management/Procurement 2% 344,111$ Contractor G&A 13.0% 2,236,722$ Contractor Fee 5% 1,058,142$ Program Management Oversight 2.4% 533,303$
TOTAL ESTIMATED RA COST (FY 2011 DOLLARS) 22,754,278$
Lincoln Park ROM Estimate (1-5-11) V5 24 hpd ops_03-02-11.xls