Basin Scale Water Resources Assessment using Space Inputs
74
Basin Scale Water Resources Assessment using Space Inputs B.Simhadri Rao, Sc/Er”SG” Water Resources Group Remote Sensing Applications Area National Remote Sensing Centre NRSC & CWC Joint Study
Transcript of Basin Scale Water Resources Assessment using Space Inputs
Basin Scale Water Resources Assessment
using Space Inputs
B.Simhadri Rao, Sc/Er”SG” Water Resources Group
Remote Sensing Applications Area National Remote Sensing Centre
NRSC & CWC Joint Study
Basin Scale Water Resources Assessment using Space Inputs
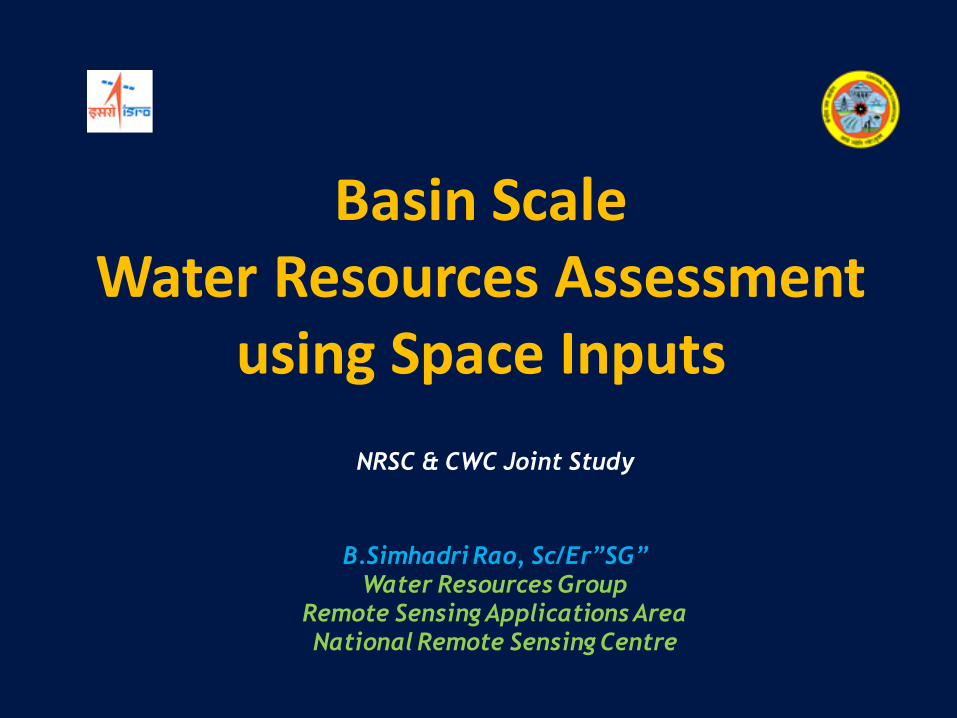
Source: World Water Balance and Water Resources of the Earth UNESCO, 1975
Estimated World Water Quantities
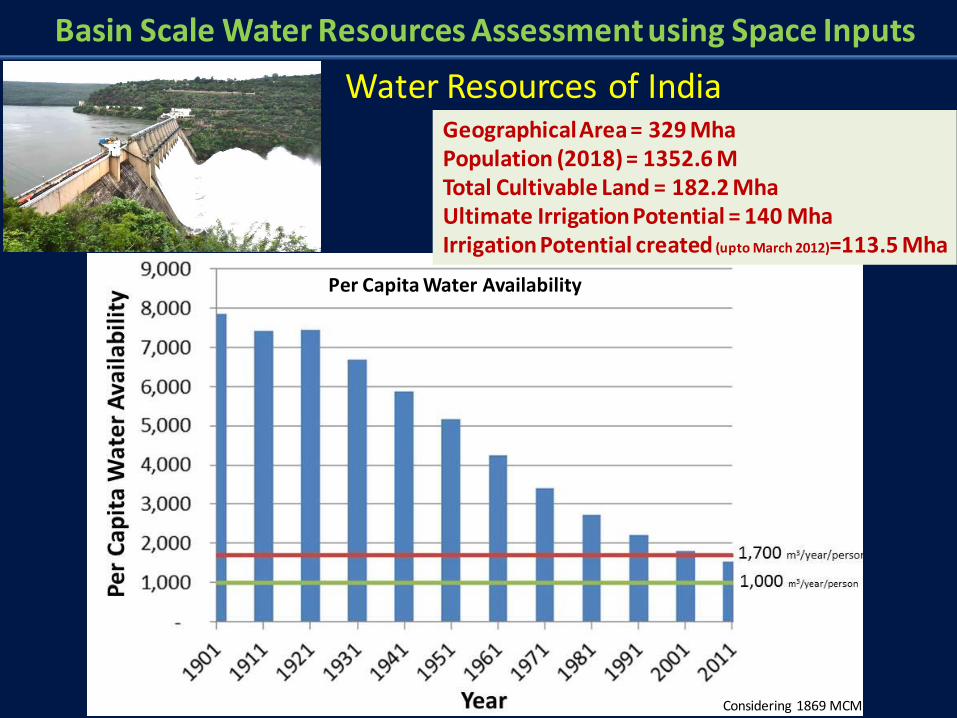
Water Resources of India
Per Capita Water Availability
Basin Scale Water Resources Assessment using Space Inputs
Geographical Area = 329 Mha Population (2018) = 1352.6 M Total Cultivable Land = 182.2 Mha Ultimate Irrigation Potential = 140 Mha Irrigation Potential created (upto March 2012)=113.5 Mha
Considering 1869 MCM
Basin Scale Water Resources Assessment using Space Inputs
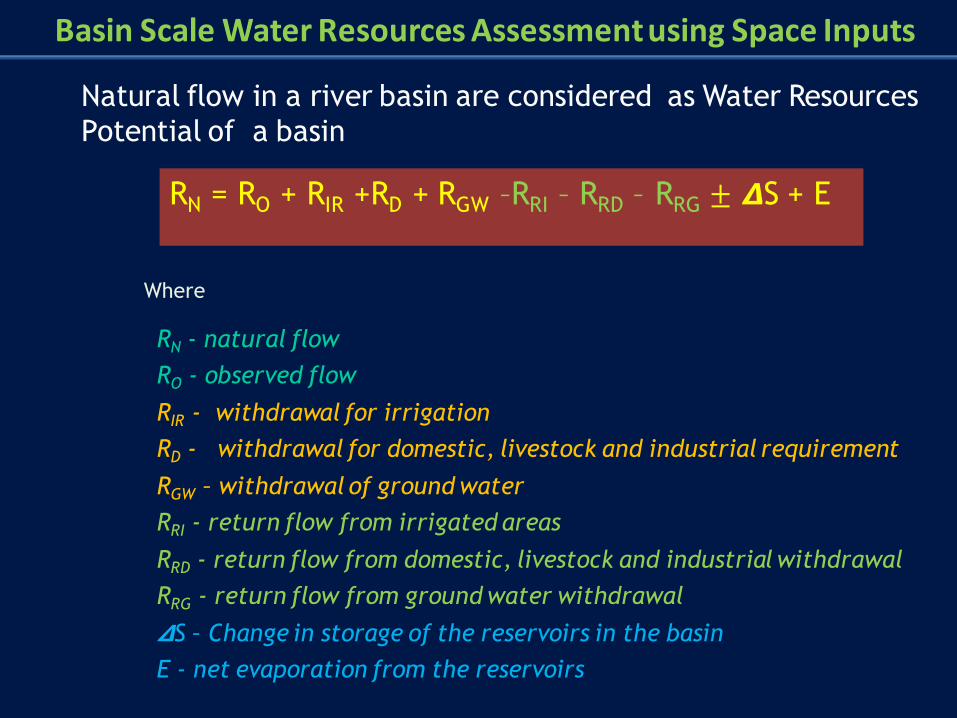
RN = RO + RIR +RD + RGW –RRI – RRD – RRG ± 𝞓S + E
RN - natural flow
RO - observed flow
RIR - withdrawal for irrigation
RD - withdrawal for domestic, livestock and industrial requirement
RGW – withdrawal of ground water
RRI - return flow from irrigated areas
RRD - return flow from domestic, livestock and industrial withdrawal
RRG - return flow from ground water withdrawal
𝞓S – Change in storage of the reservoirs in the basin
E - net evaporation from the reservoirs
Where
Natural flow in a river basin are considered as Water Resources Potential of a basin
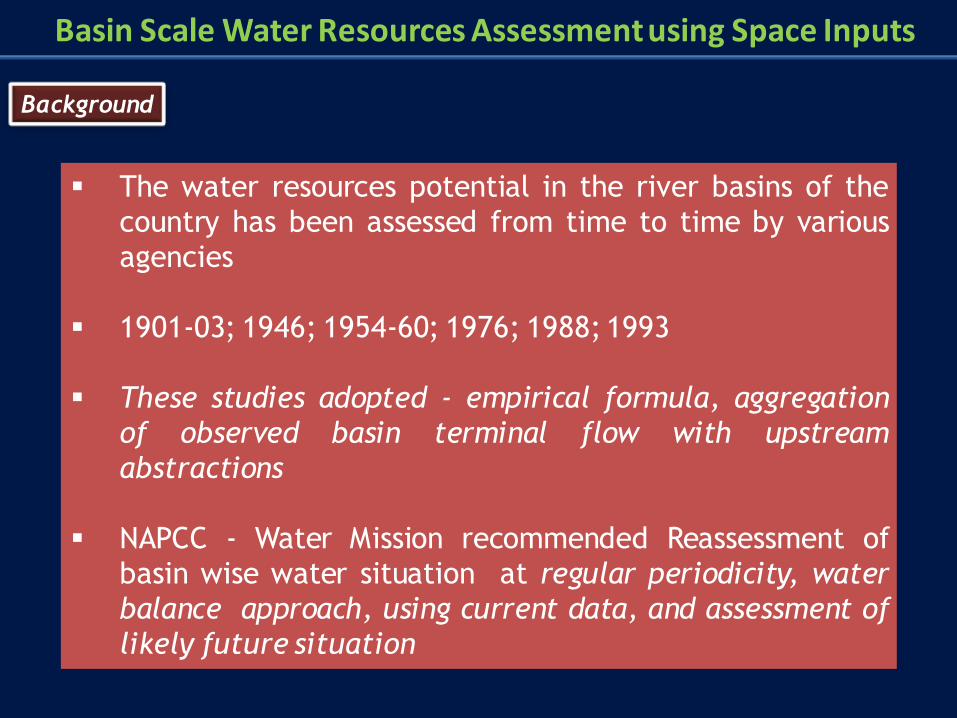
The water resources potential in the river basins of the
country has been assessed from time to time by various agencies
1901-03; 1946; 1954-60; 1976; 1988; 1993
These studies adopted - empirical formula, aggregation of observed basin terminal flow with upstream
abstractions
NAPCC - Water Mission recommended Reassessment of
basin wise water situation at regular periodicity, water balance approach, using current data, and assessment of
likely future situation
Background
Basin Scale Water Resources Assessment using Space Inputs
Previous Studies
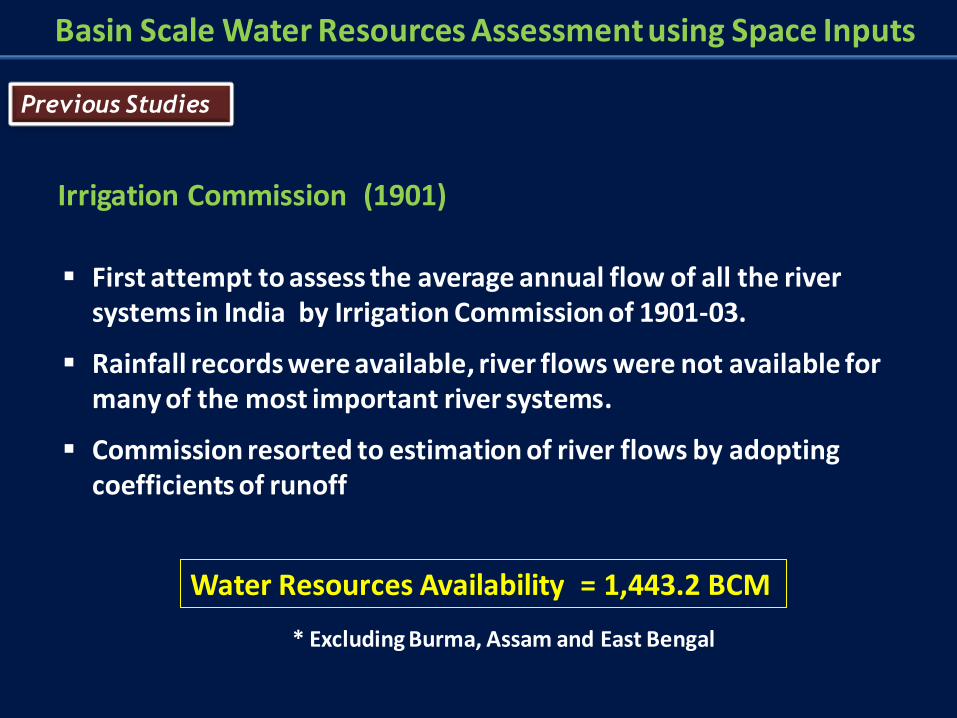
Irrigation Commission (1901)
First attempt to assess the average annual flow of all the river systems in India by Irrigation Commission of 1901-03.
Rainfall records were available, river flows were not available for many of the most important river systems.
Commission resorted to estimation of river flows by adopting coefficients of runoff
Basin Scale Water Resources Assessment using Space Inputs
Water Resources Availability = 1,443.2 BCM
* Excluding Burma, Assam and East Bengal
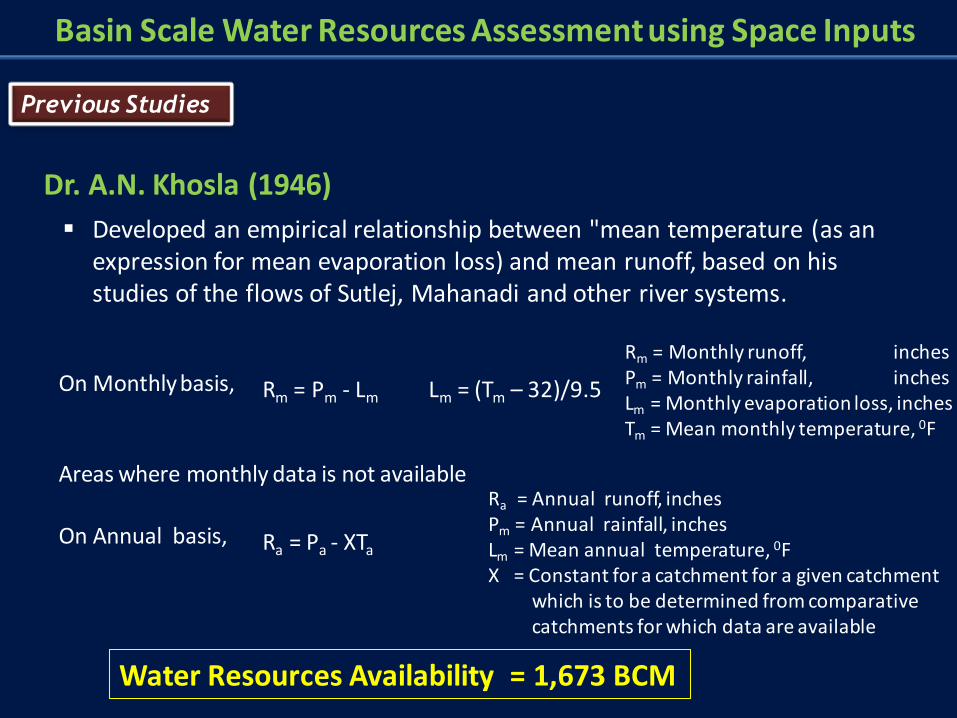
Dr. A.N. Khosla (1946)
Developed an empirical relationship between "mean temperature (as an expression for mean evaporation loss) and mean runoff, based on his studies of the flows of Sutlej, Mahanadi and other river systems.
On Monthly basis, Rm = Pm - Lm Lm = (Tm – 32)/9.5
On Annual basis, Ra = Pa - XTa
Areas where monthly data is not available
Basin Scale Water Resources Assessment using Space Inputs
Previous Studies
Rm = Monthly runoff, inches Pm = Monthly rainfall, inches Lm = Monthly evaporation loss, inches Tm = Mean monthly temperature, 0F
Ra = Annual runoff, inches Pm = Annual rainfall, inches Lm = Mean annual temperature, 0F X = Constant for a catchment for a given catchment which is to be determined from comparative catchments for which data are available
Water Resources Availability = 1,673 BCM
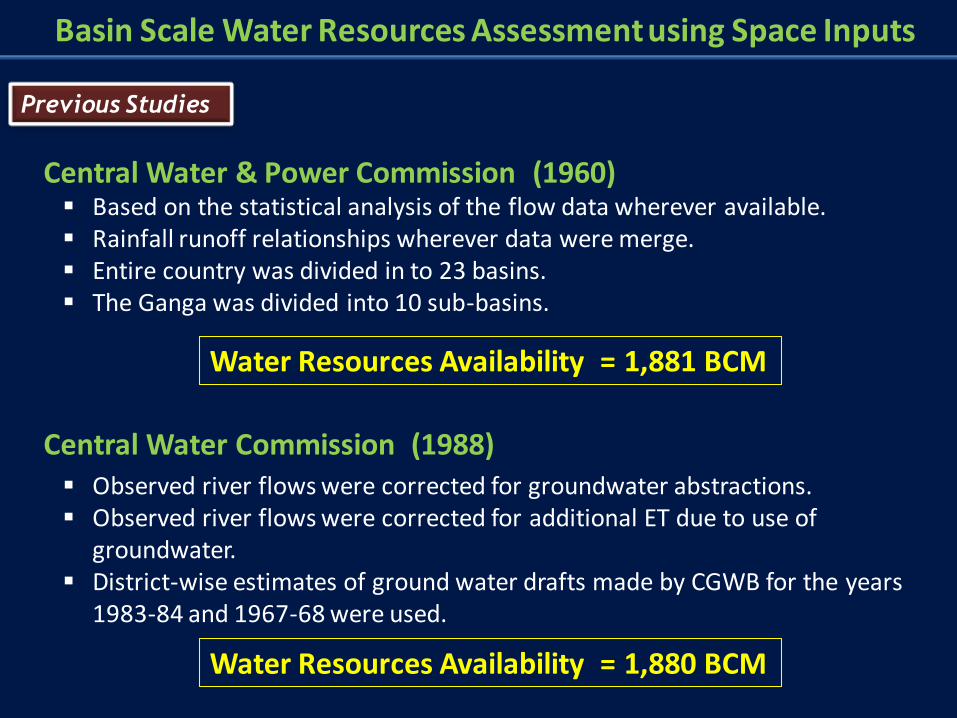
Central Water & Power Commission (1960) Based on the statistical analysis of the flow data wherever available. Rainfall runoff relationships wherever data were merge. Entire country was divided in to 23 basins. The Ganga was divided into 10 sub-basins.
Water Resources Availability = 1,881 BCM
Central Water Commission (1988) Observed river flows were corrected for groundwater abstractions. Observed river flows were corrected for additional ET due to use of
groundwater. District-wise estimates of ground water drafts made by CGWB for the years
1983-84 and 1967-68 were used.
Water Resources Availability = 1,880 BCM
Basin Scale Water Resources Assessment using Space Inputs
Previous Studies
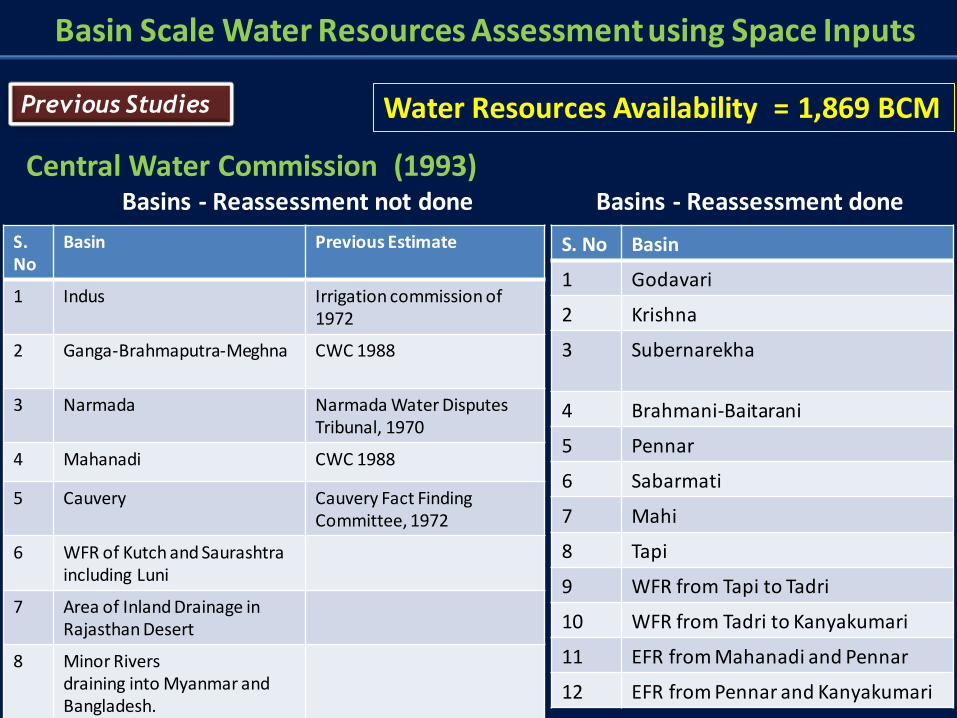
Central Water Commission (1993)
Water Resources Availability = 1,869 BCM
S. No
Basin Previous Estimate
1 Indus Irrigation commission of 1972
2 Ganga-Brahmaputra-Meghna CWC 1988
3 Narmada
Narmada Water Disputes Tribunal, 1970
4 Mahanadi CWC 1988
5 Cauvery Cauvery Fact Finding Committee, 1972
6 WFR of Kutch and Saurashtra including Luni
7 Area of Inland Drainage in Rajasthan Desert
8 Minor Rivers draining into Myanmar and Bangladesh.
S. No Basin
1 Godavari
2 Krishna
3 Subernarekha
4 Brahmani-Baitarani
5 Pennar
6 Sabarmati
7 Mahi
8 Tapi
9 WFR from Tapi to Tadri
10 WFR from Tadri to Kanyakumari
11 EFR from Mahanadi and Pennar
12 EFR from Pennar and Kanyakumari
Basins - Reassessment not done Basins - Reassessment done
Basin Scale Water Resources Assessment using Space Inputs
Previous Studies
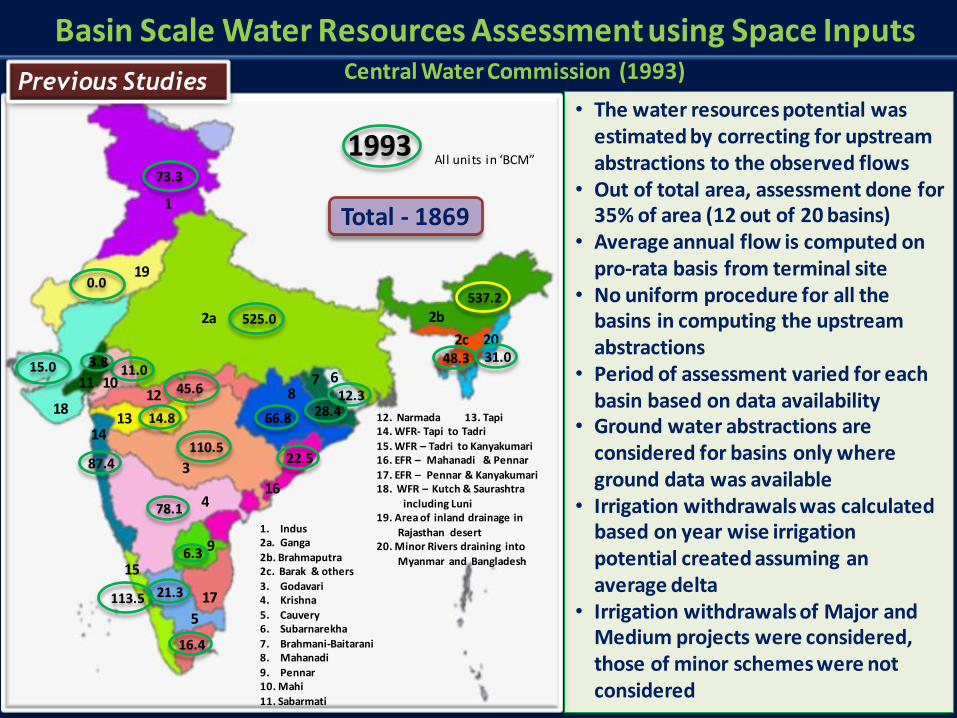
• The water resources potential was estimated by correcting for upstream abstractions to the observed flows
• Out of total area, assessment done for 35% of area (12 out of 20 basins)
• Average annual flow is computed on pro-rata basis from terminal site
• No uniform procedure for all the basins in computing the upstream abstractions
• Period of assessment varied for each basin based on data availability
• Ground water abstractions are considered for basins only where ground data was available
• Irrigation withdrawals was calculated based on year wise irrigation potential created assuming an average delta
• Irrigation withdrawals of Major and Medium projects were considered, those of minor schemes were not considered
12. Narmada 13. Tapi 14. WFR- Tapi to Tadri
15. WFR – Tadri to Kanyakumari 16. EFR – Mahanadi & Pennar
17. EFR – Pennar & Kanyakumari 18. WFR – Kutch & Saurashtra
including Luni 19. Area of inland drainage in
Rajasthan desert 20. Minor Rivers draining into
Myanmar and Bangladesh
1
3
2a 2b
2c
4
5
6 7 8
9
11 10 12
13 14
15
16
17
18
19
20
All units in ‘BCM”
73.3
537.2
525.0
1993
11.0
3.8
15.0
45.6
14.8
87.4
78.1
110.5
66.8
28.4
12.3
22.5
48.3
31.0
113.5
6.3
21.3
16.4
Total - 1869
0.0
1. Indus 2a. Ganga
2b. Brahmaputra 2c. Barak & others
3. Godavari 4. Krishna
5. Cauvery 6. Subarnarekha
7. Brahmani-Baitarani 8. Mahanadi
9. Pennar 10. Mahi
11. Sabarmati
Central Water Commission (1993)
Basin Scale Water Resources Assessment using Space Inputs
Previous Studies
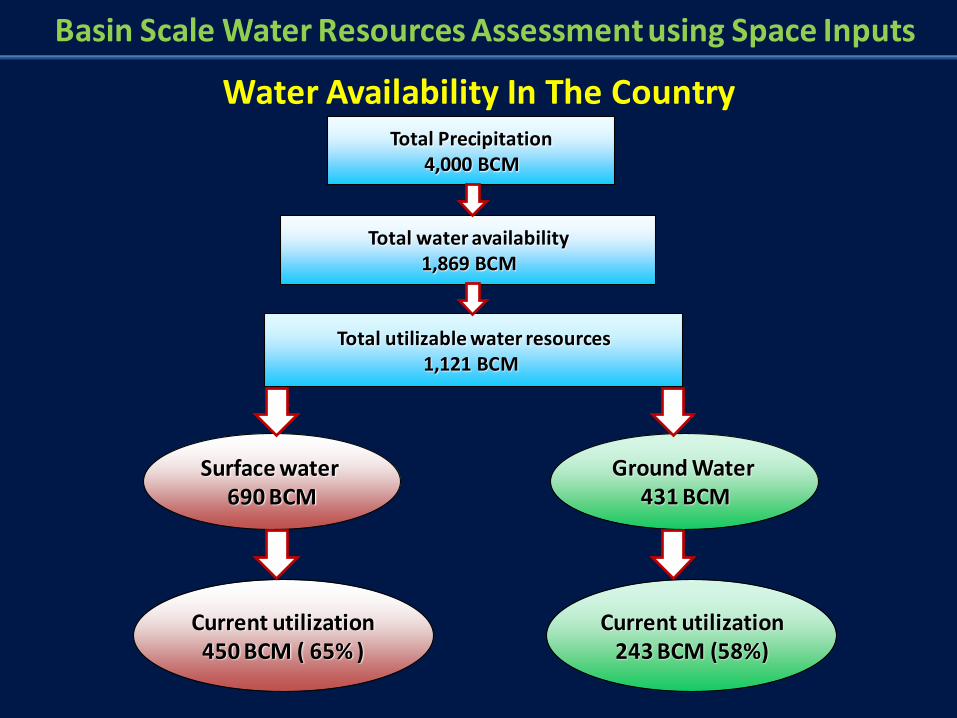
Water Availability In The Country
Total utilizable water resources 1,121 BCM
Ground Water 431 BCM
Surface water 690 BCM
Current utilization 450 BCM ( 65% )
Current utilization 243 BCM (58%)
Total water availability 1,869 BCM
Total Precipitation 4,000 BCM
Basin Scale Water Resources Assessment using Space Inputs
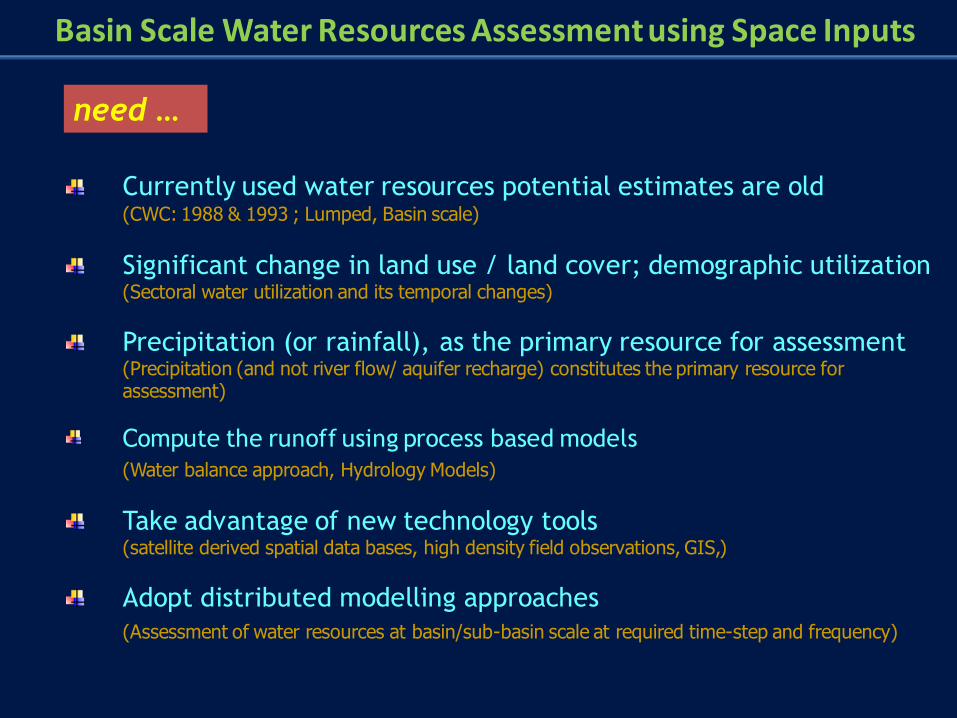
Currently used water resources potential estimates are old (CWC: 1988 & 1993 ; Lumped, Basin scale)
Significant change in land use / land cover; demographic utilization (Sectoral water utilization and its temporal changes)
Precipitation (or rainfall), as the primary resource for assessment (Precipitation (and not river flow/ aquifer recharge) constitutes the primary resource for assessment)
Compute the runoff using process based models
(Water balance approach, Hydrology Models)
Take advantage of new technology tools (satellite derived spatial data bases, high density field observations, GIS,)
Adopt distributed modelling approaches
(Assessment of water resources at basin/sub-basin scale at required time-step and frequency)
need …
Basin Scale Water Resources Assessment using Space Inputs
background …
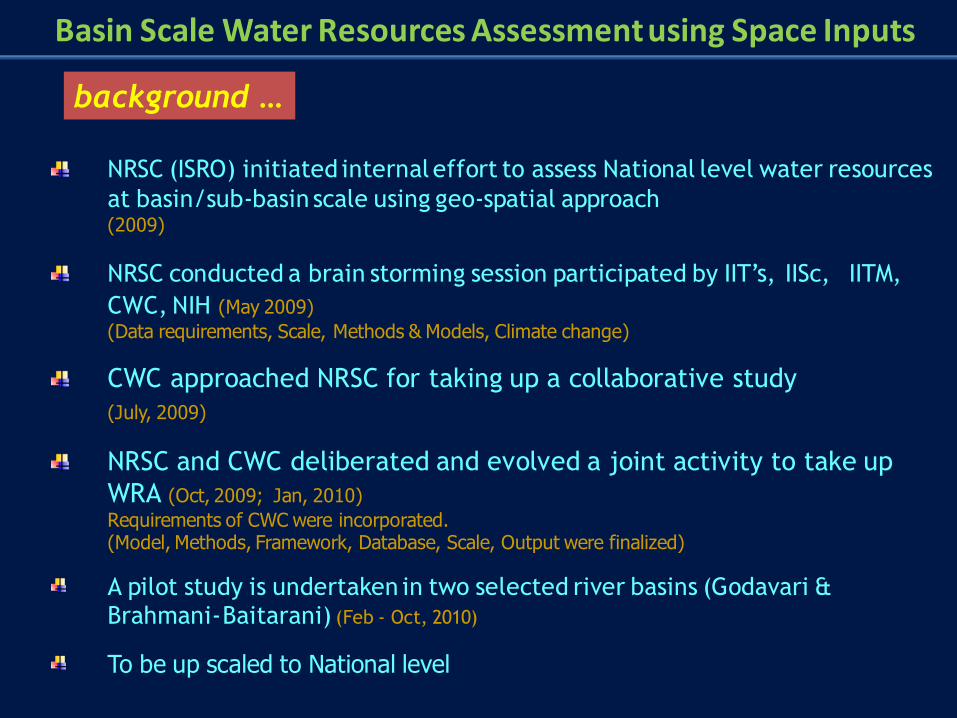
NRSC (ISRO) initiated internal effort to assess National level water resources
at basin/sub-basin scale using geo-spatial approach (2009)
NRSC conducted a brain storming session participated by IIT’s, IISc, IITM,
CWC, NIH (May 2009) (Data requirements, Scale, Methods & Models, Climate change)
CWC approached NRSC for taking up a collaborative study
(July, 2009)
NRSC and CWC deliberated and evolved a joint activity to take up
WRA (Oct, 2009; Jan, 2010)
Requirements of CWC were incorporated. (Model, Methods, Framework, Database, Scale, Output were finalized)
A pilot study is undertaken in two selected river basins (Godavari & Brahmani- Baitarani) (Feb - Oct, 2010)
To be up scaled to National level
Basin Scale Water Resources Assessment using Space Inputs
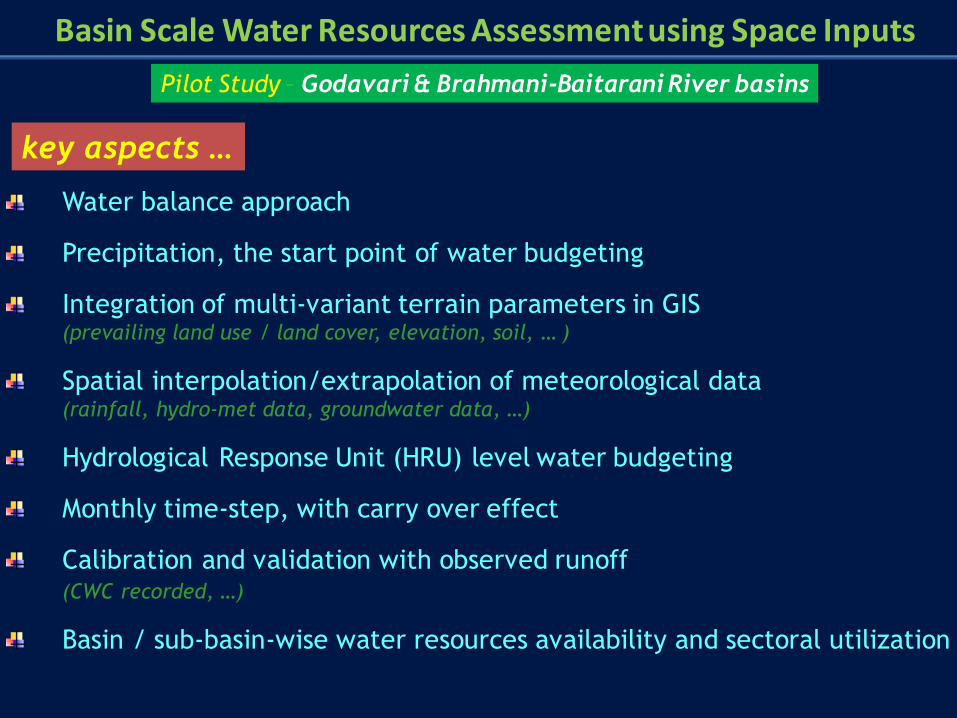
Water balance approach
Precipitation, the start point of water budgeting
Integration of multi-variant terrain parameters in GIS (prevailing land use / land cover, elevation, soil, … )
Spatial interpolation/extrapolation of meteorological data (rainfall, hydro-met data, groundwater data, …)
Hydrological Response Unit (HRU) level water budgeting
Monthly time-step, with carry over effect
Calibration and validation with observed runoff (CWC recorded, …)
Basin / sub-basin-wise water resources availability and sectoral utilization
key aspects …
Pilot Study – Godavari & Brahmani-Baitarani River basins
Basin Scale Water Resources Assessment using Space Inputs
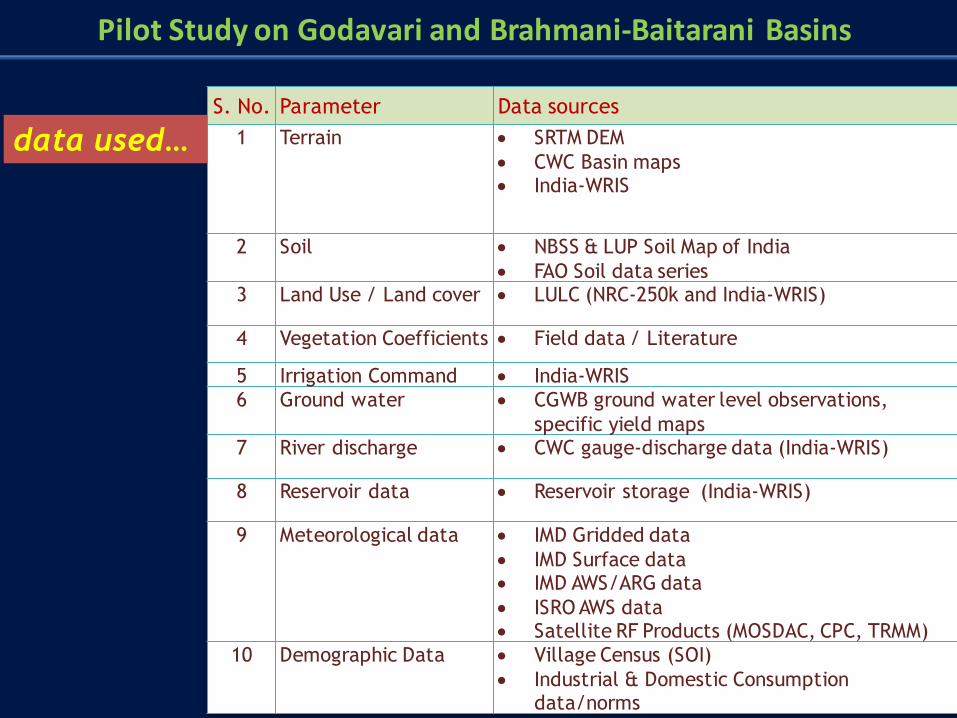
S. No. Parameter Data sources
1 Terrain SRTM DEM
CWC Basin maps India-WRIS
2 Soil NBSS & LUP Soil Map of India
FAO Soil data series 3 Land Use / Land cover LULC (NRC-250k and India-WRIS)
4 Vegetation Coefficients Field data / Literature
5 Irrigation Command India-WRIS
6 Ground water CGWB ground water level observations,
specific yield maps 7 River discharge CWC gauge-discharge data (India-WRIS)
8 Reservoir data Reservoir storage (India-WRIS)
9 Meteorological data IMD Gridded data
IMD Surface data IMD AWS/ARG data
ISRO AWS data Satellite RF Products (MOSDAC, CPC, TRMM)
10 Demographic Data Village Census (SOI)
Industrial & Domestic Consumption data/norms
data used…
Pilot Study on Godavari and Brahmani-Baitarani Basins
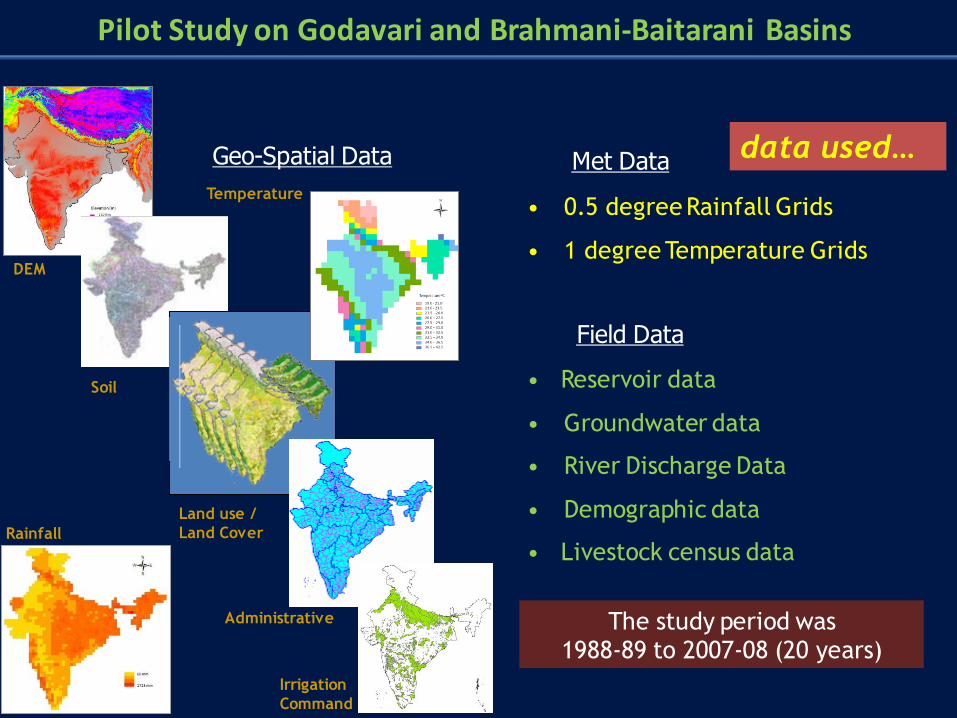
Soil
DEM
• 0.5 degree Rainfall Grids
• 1 degree Temperature Grids
• Reservoir data
• Groundwater data
• River Discharge Data
• Demographic data
• Livestock census data
Land use /
Land Cover
Geo-Spatial Data
Field Data
Administrative The study period was 1988-89 to 2007-08 (20 years)
Rainfall
Temperature
Irrigation
Command
Met Data data used…
Pilot Study on Godavari and Brahmani-Baitarani Basins
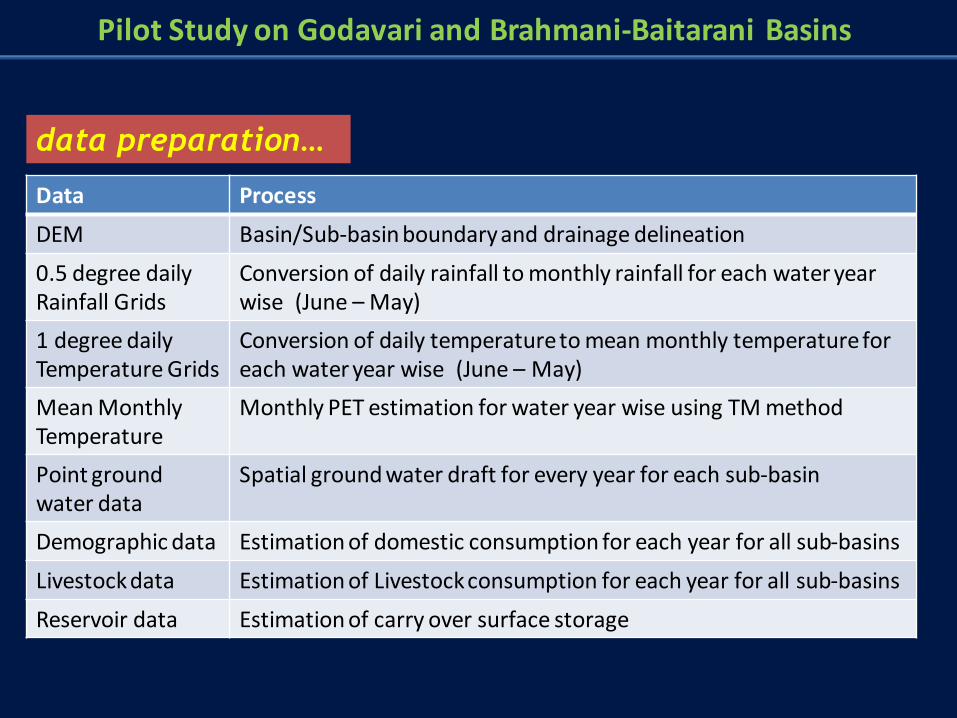
Data Process
DEM Basin/Sub-basin boundary and drainage delineation
0.5 degree daily Rainfall Grids
Conversion of daily rainfall to monthly rainfall for each water year wise (June – May)
1 degree daily Temperature Grids
Conversion of daily temperature to mean monthly temperature for each water year wise (June – May)
Mean Monthly Temperature
Monthly PET estimation for water year wise using TM method
Point ground water data
Spatial ground water draft for every year for each sub-basin
Demographic data Estimation of domestic consumption for each year for all sub-basins
Livestock data Estimation of Livestock consumption for each year for all sub-basins
Reservoir data Estimation of carry over surface storage
data preparation…
Pilot Study on Godavari and Brahmani-Baitarani Basins
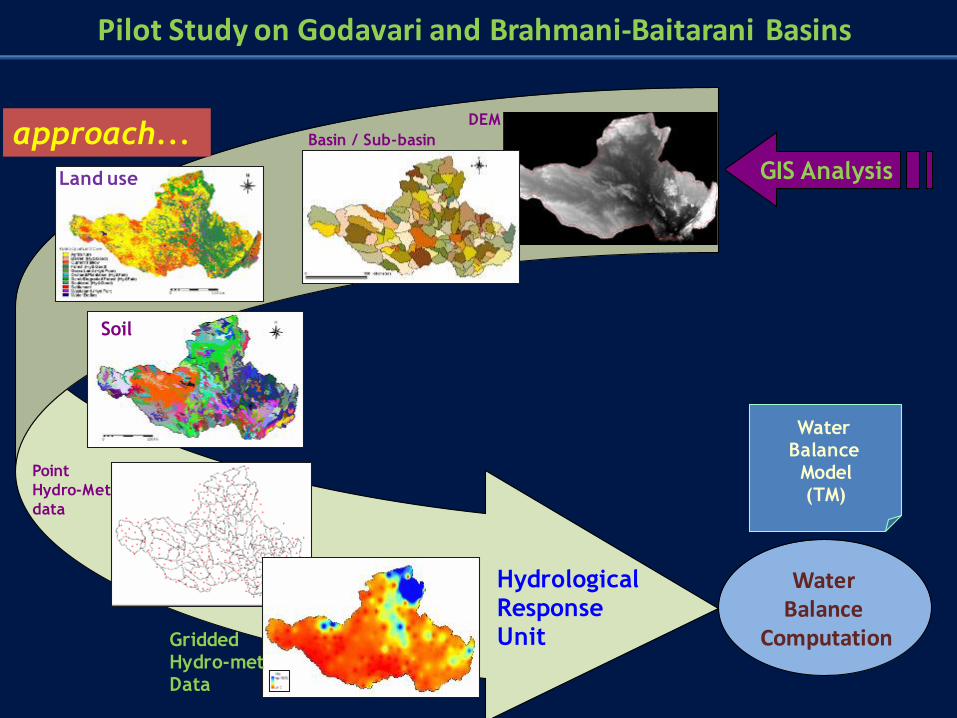
GIS Analysis
Basin / Sub-basin
Soil
Gridded Hydro-met Data
Point
Hydro-Met
data
DEM
Land use
Hydrological Response Unit
Water Balance
Model (TM)
Water Balance
Computation
approach...
Pilot Study on Godavari and Brahmani-Baitarani Basins
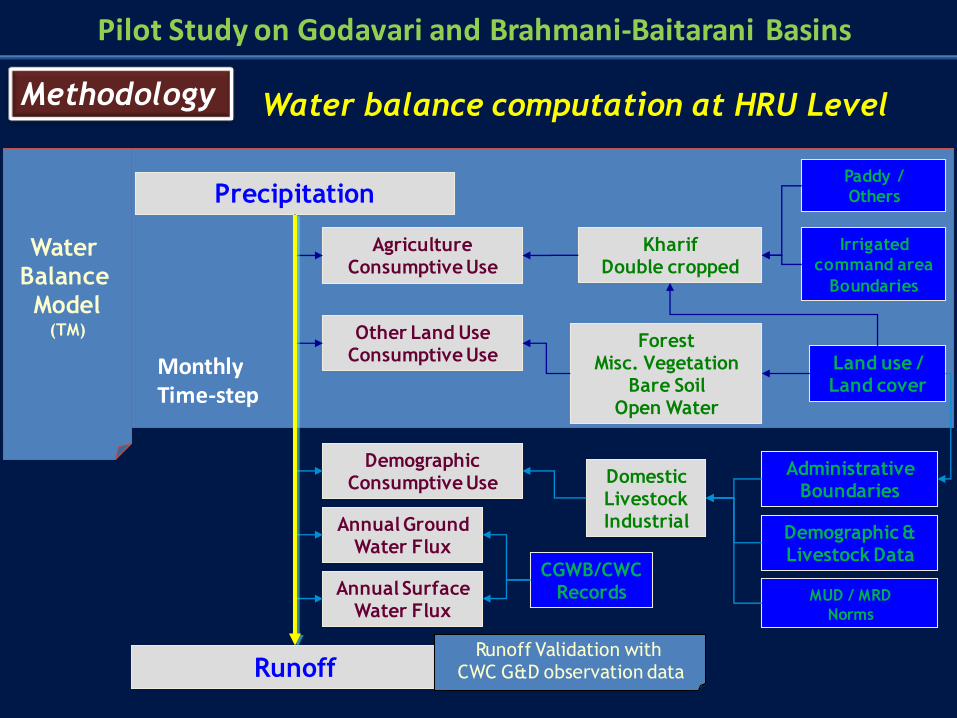
Water balance computation at HRU Level
Precipitation
Land use / Land cover
Kharif Double cropped
Runoff
Annual Ground Water Flux
Agriculture Consumptive Use
Other Land Use Consumptive Use
Forest Misc. Vegetation
Bare Soil Open Water
Annual Surface Water Flux
Demographic Consumptive Use
Administrative Boundaries
Demographic & Livestock Data
MUD / MRD
Norms
CGWB/CWC Records
Domestic Livestock Industrial
Irrigated
command area
Boundaries
Paddy /
Others
Water Balance Model
(TM)
Runoff Validation with CWC G&D observation data
Methodology
Monthly Time-step
Pilot Study on Godavari and Brahmani-Baitarani Basins
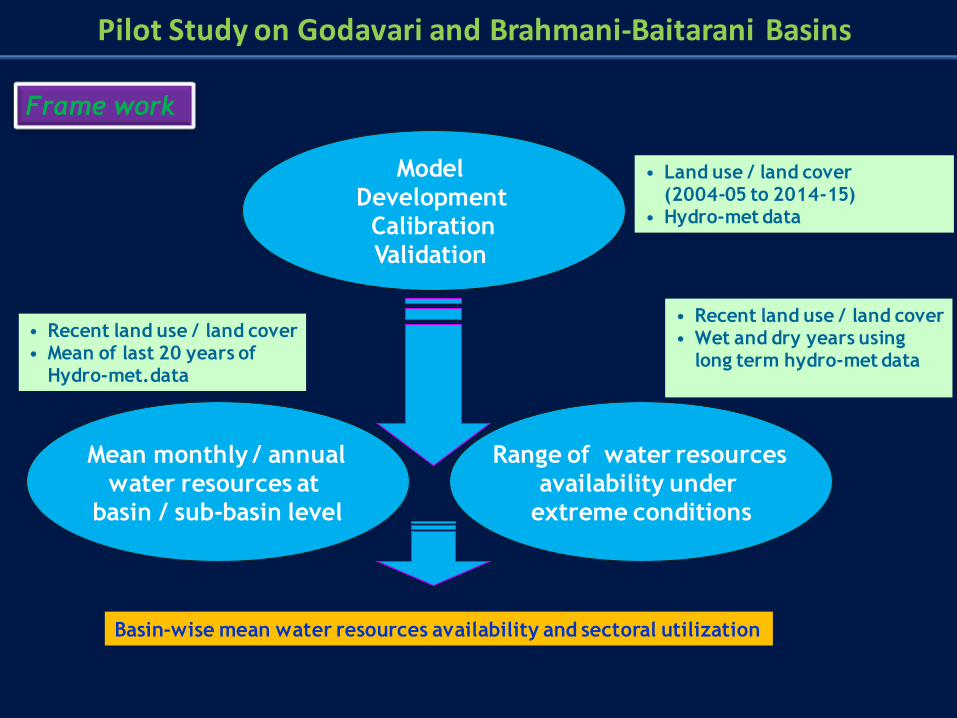
Frame work
• Land use / land cover (2004-05 to 2014-15) • Hydro-met data
• Recent land use / land cover • Mean of last 20 years of Hydro-met.data
• Recent land use / land cover • Wet and dry years using long term hydro-met data
Range of water resources availability under
extreme conditions
Model Development
Calibration Validation
Mean monthly / annual water resources at
basin / sub-basin level
Basin-wise mean water resources availability and sectoral utilization
Pilot Study on Godavari and Brahmani-Baitarani Basins
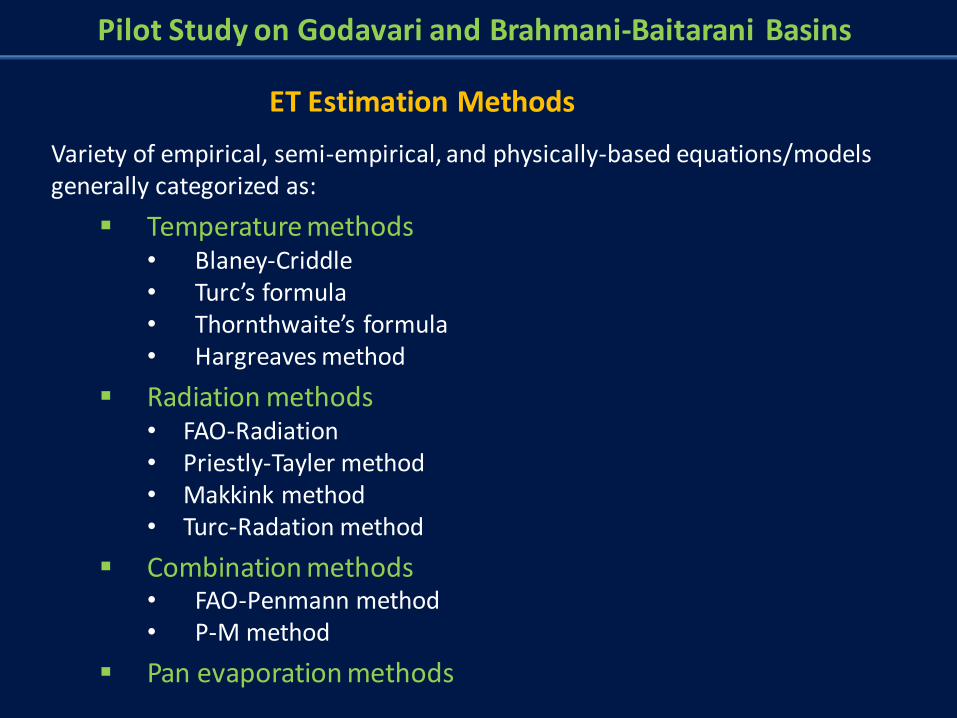
ET Estimation Methods
Variety of empirical, semi-empirical, and physically-based equations/models generally categorized as:
Temperature methods • Blaney-Criddle • Turc’s formula • Thornthwaite’s formula • Hargreaves method
Radiation methods • FAO-Radiation • Priestly-Tayler method • Makkink method • Turc-Radation method
Combination methods • FAO-Penmann method • P-M method
Pan evaporation methods
Pilot Study on Godavari and Brahmani-Baitarani Basins
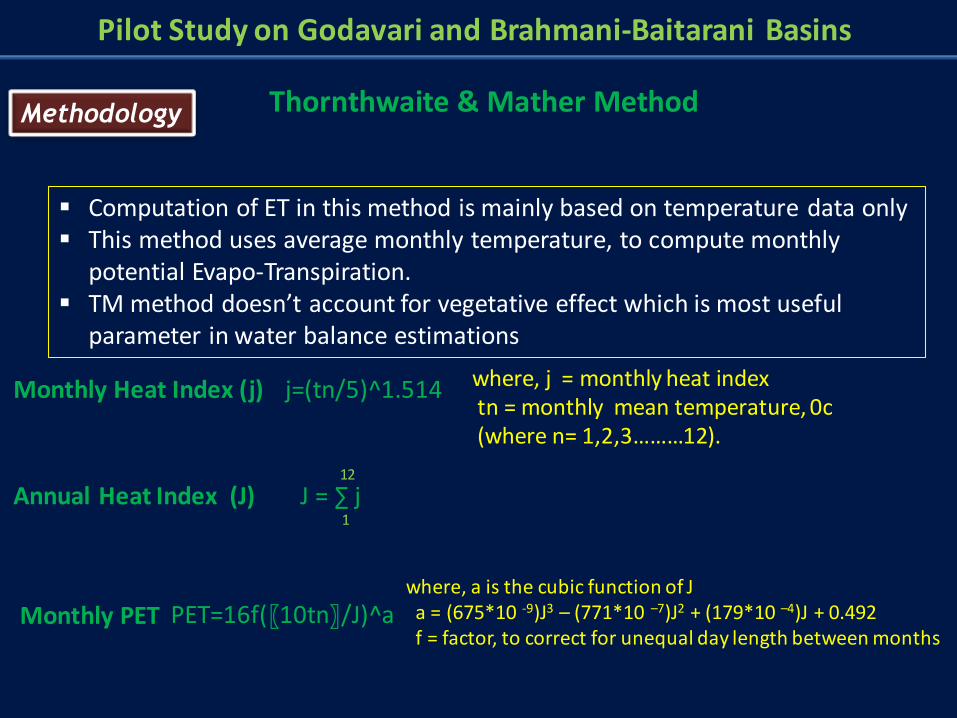
Computation of ET in this method is mainly based on temperature data only This method uses average monthly temperature, to compute monthly
potential Evapo-Transpiration. TM method doesn’t account for vegetative effect which is most useful
parameter in water balance estimations
Monthly Heat Index (j) j=(tn/5)^1.514 where, j = monthly heat index tn = monthly mean temperature, 0c (where n= 1,2,3………12).
Monthly PET PET=16f(〖10tn〗/J)^a where, a is the cubic function of J a = (675*10 -9)J3 – (771*10 –7)J2 + (179*10 –4)J + 0.492 f = factor, to correct for unequal day length between months
Annual Heat Index (J) J = ∑ j 1
12
Thornthwaite & Mather Method Methodology
Pilot Study on Godavari and Brahmani-Baitarani Basins
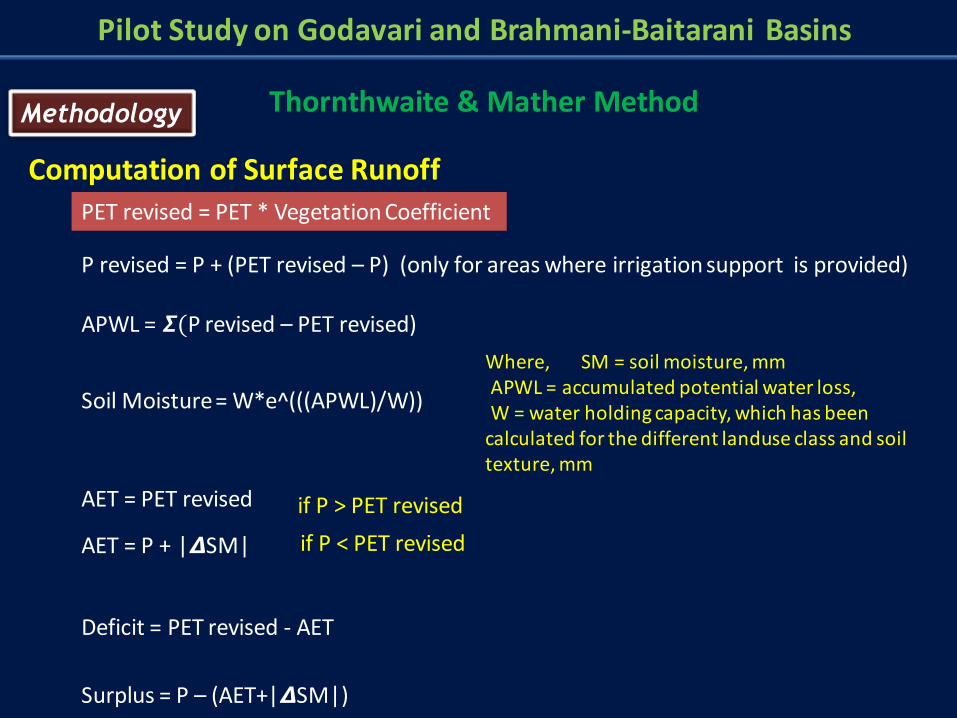
PET revised = PET * Vegetation Coefficient
P revised = P + (PET revised – P) (only for areas where irrigation support is provided)
APWL = 𝞢(P revised – PET revised)
Soil Moisture = W*e^(((APWL)/W))
Where, SM = soil moisture, mm APWL = accumulated potential water loss, W = water holding capacity, which has been calculated for the different landuse class and soil texture, mm
AET = PET revised
AET = P + |𝞓SM|
if P > PET revised
if P < PET revised
Deficit = PET revised - AET
Surplus = P – (AET+|𝞓SM|)
Computation of Surface Runoff
Thornthwaite & Mather Method Methodology
Pilot Study on Godavari and Brahmani-Baitarani Basins
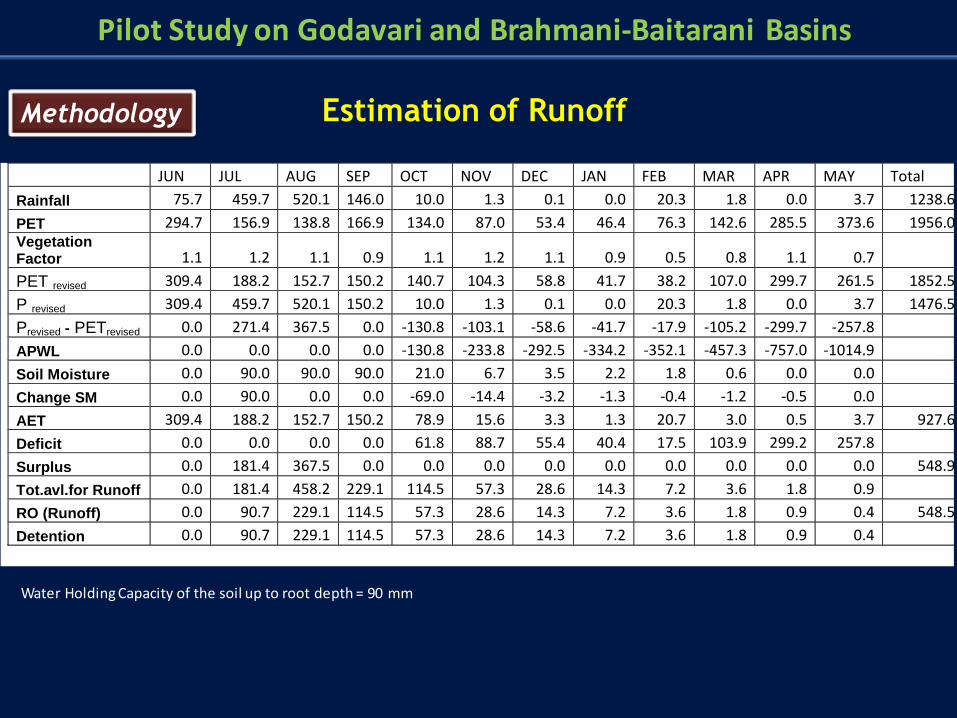
JUN JUL AUG SEP OCT NOV DEC JAN FEB MAR APR MAY Total
Rainfall 75.7 459.7 520.1 146.0 10.0 1.3 0.1 0.0 20.3 1.8 0.0 3.7 1238.6
PET 294.7 156.9 138.8 166.9 134.0 87.0 53.4 46.4 76.3 142.6 285.5 373.6 1956.0 Vegetation Factor 1.1 1.2 1.1 0.9 1.1 1.2 1.1 0.9 0.5 0.8 1.1 0.7
PET revised 309.4 188.2 152.7 150.2 140.7 104.3 58.8 41.7 38.2 107.0 299.7 261.5 1852.5
P revised 309.4 459.7 520.1 150.2 10.0 1.3 0.1 0.0 20.3 1.8 0.0 3.7 1476.5
Prevised - PETrevised 0.0 271.4 367.5 0.0 -130.8 -103.1 -58.6 -41.7 -17.9 -105.2 -299.7 -257.8
APWL 0.0 0.0 0.0 0.0 -130.8 -233.8 -292.5 -334.2 -352.1 -457.3 -757.0 -1014.9
Soil Moisture 0.0 90.0 90.0 90.0 21.0 6.7 3.5 2.2 1.8 0.6 0.0 0.0
Change SM 0.0 90.0 0.0 0.0 -69.0 -14.4 -3.2 -1.3 -0.4 -1.2 -0.5 0.0
AET 309.4 188.2 152.7 150.2 78.9 15.6 3.3 1.3 20.7 3.0 0.5 3.7 927.6
Deficit 0.0 0.0 0.0 0.0 61.8 88.7 55.4 40.4 17.5 103.9 299.2 257.8
Surplus 0.0 181.4 367.5 0.0 0.0 0.0 0.0 0.0 0.0 0.0 0.0 0.0 548.9
Tot.avl.for Runoff 0.0 181.4 458.2 229.1 114.5 57.3 28.6 14.3 7.2 3.6 1.8 0.9
RO (Runoff) 0.0 90.7 229.1 114.5 57.3 28.6 14.3 7.2 3.6 1.8 0.9 0.4 548.5
Detention 0.0 90.7 229.1 114.5 57.3 28.6 14.3 7.2 3.6 1.8 0.9 0.4
Water Holding Capacity of the soil up to root depth = 90 mm
Estimation of Runoff Methodology
Pilot Study on Godavari and Brahmani-Baitarani Basins
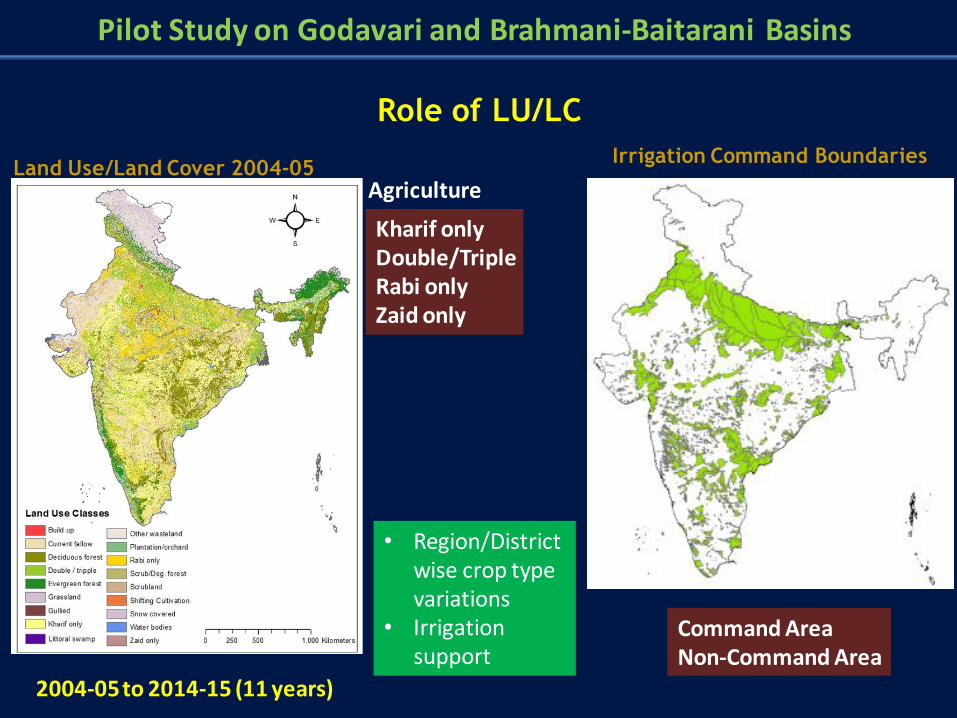
Agriculture
Kharif only Double/Triple Rabi only Zaid only
Command Area Non-Command Area
Irrigation Command Boundaries Land Use/Land Cover 2004-05
• Region/District wise crop type variations
• Irrigation support
2004-05 to 2014-15 (11 years)
Role of LU/LC
Pilot Study on Godavari and Brahmani-Baitarani Basins
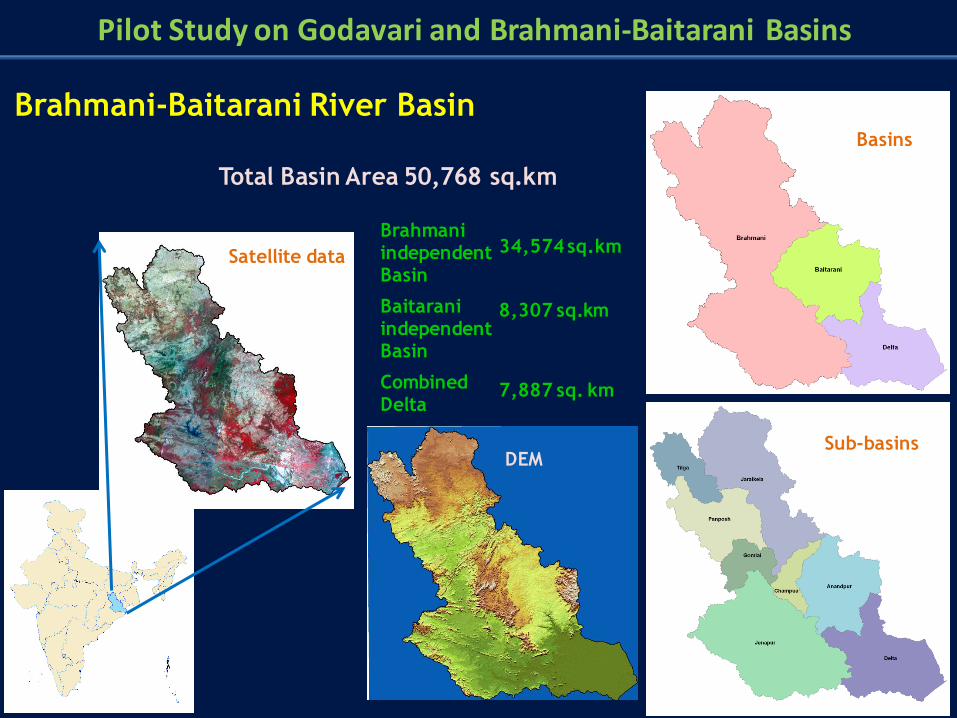
Brahmani-Baitarani River Basin
Satellite data
DEM Sub-basins
Total Basin Area 50,768 sq.km
Basins
Brahmani independent Basin
8,307 sq.km
7,887 sq. km
Baitarani independent Basin
Combined Delta
34,574 sq.km
Pilot Study on Godavari and Brahmani-Baitarani Basins
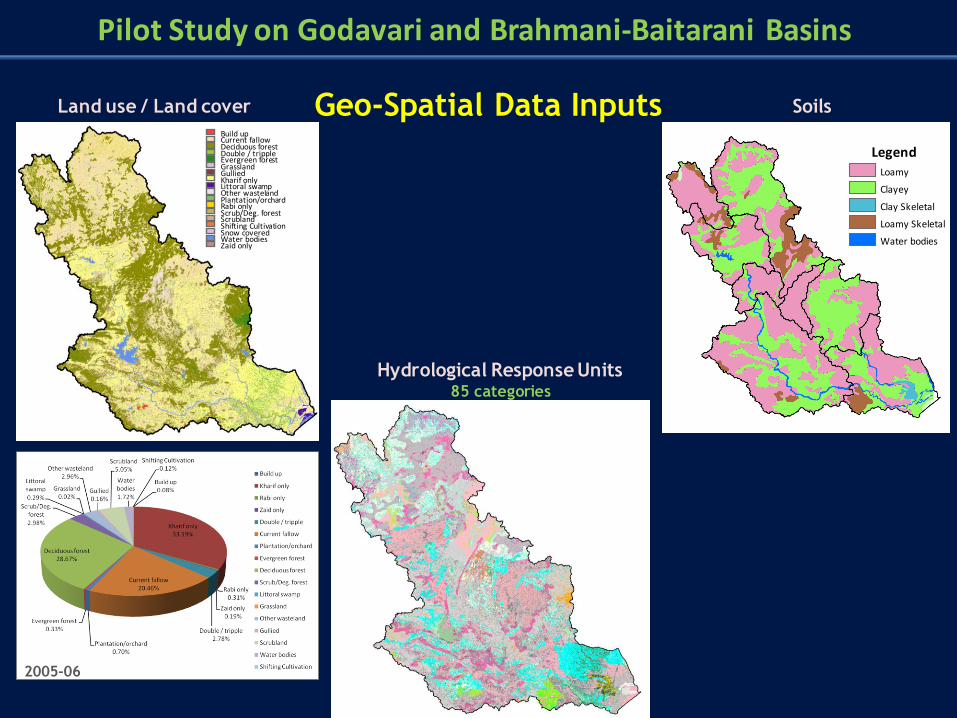
Build up Current fallow Deciduous forest Double / tripple Evergreen forest Grassland Gullied Kharif only Littoral swamp Other wasteland Plantation/orchard Rabi only Scrub/Deg. forest Scrubland Shifting Cultivation Snow covered Water bodies Zaid only
Legend Loamy
Clayey
Clay Skeletal
Loamy Skeletal
Water bodies
Land use / Land cover Geo-Spatial Data Inputs Soils
Hydrological Response Units 85 categories
2005-06
Pilot Study on Godavari and Brahmani-Baitarani Basins
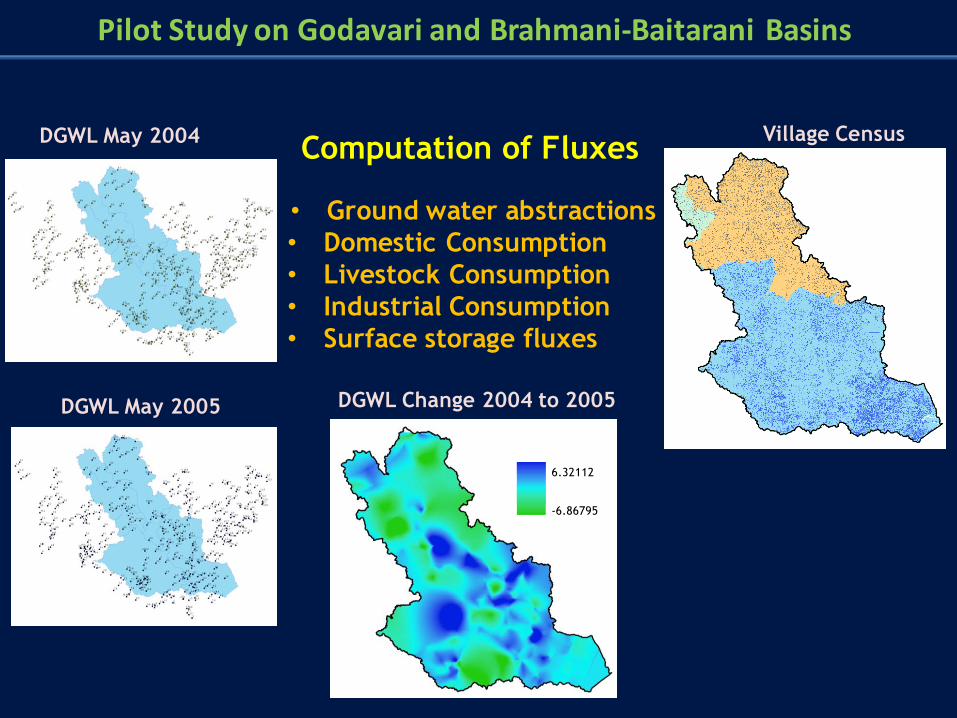
DGWL May 2005 DGWL Change 2004 to 2005
6.32112
-6.86795
Computation of Fluxes Village Census DGWL May 2004
• Ground water abstractions
• Domestic Consumption
• Livestock Consumption
• Industrial Consumption
• Surface storage fluxes
Pilot Study on Godavari and Brahmani-Baitarani Basins
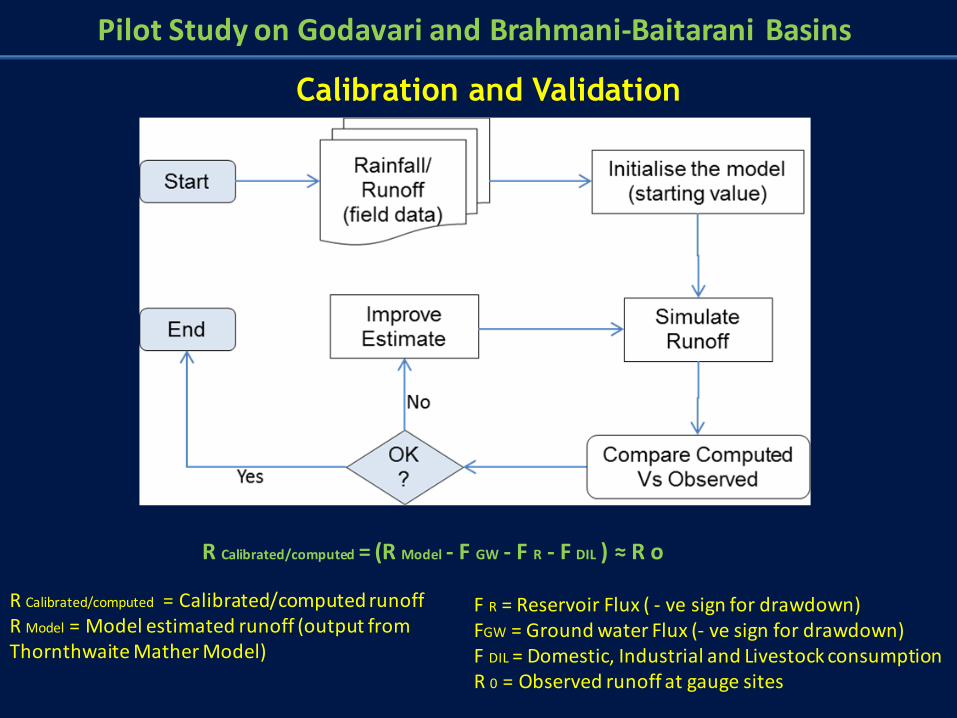
Calibration and Validation
R Calibrated/computed = (R Model - F GW - F R - F DIL ) ≈ R o
R Calibrated/computed = Calibrated/computed runoff R Model = Model estimated runoff (output from Thornthwaite Mather Model)
F R = Reservoir Flux ( - ve sign for drawdown) FGW = Ground water Flux (- ve sign for drawdown) F DIL = Domestic, Industrial and Livestock consumption R 0 = Observed runoff at gauge sites
Pilot Study on Godavari and Brahmani-Baitarani Basins
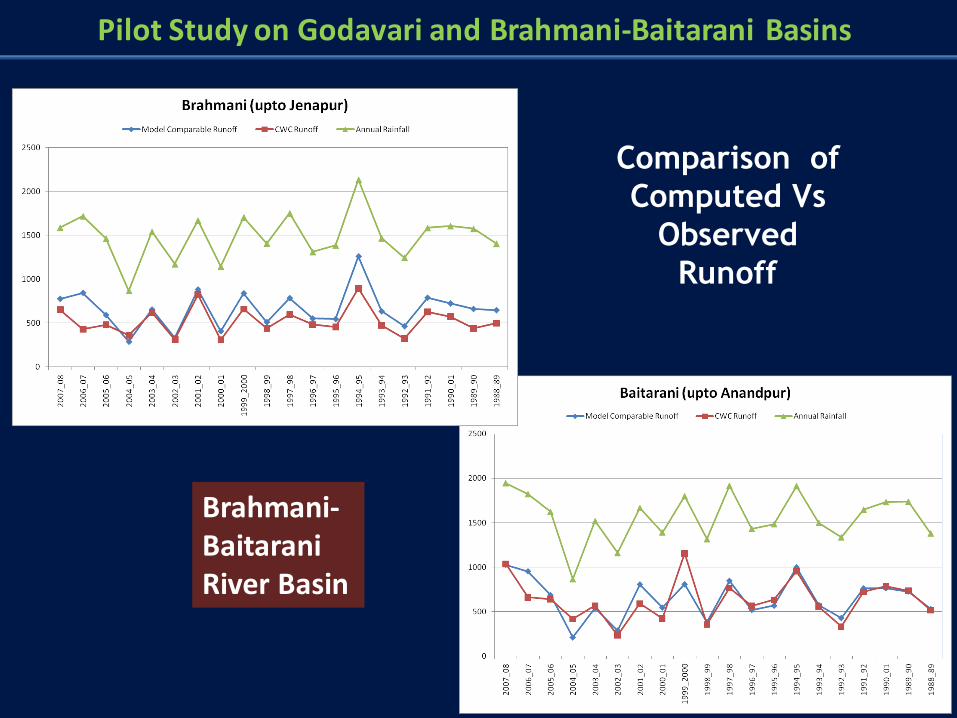
Comparison of
Computed Vs
Observed
Runoff
Brahmani-Baitarani River Basin
Pilot Study on Godavari and Brahmani-Baitarani Basins
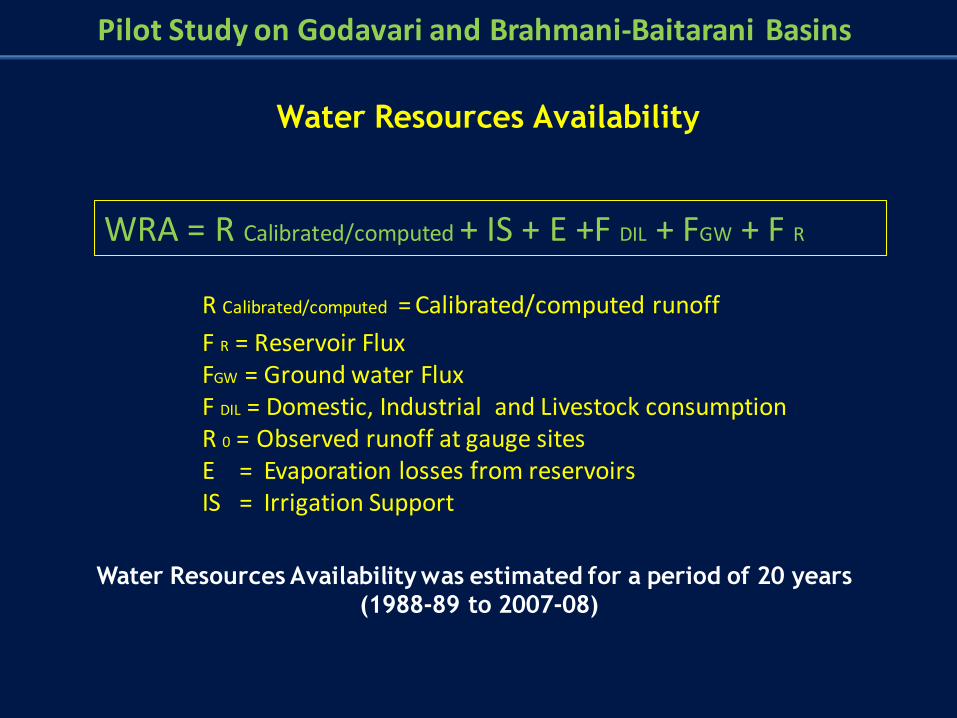
Water Resources Availability
R Calibrated/computed = Calibrated/computed runoff F R = Reservoir Flux FGW = Ground water Flux F DIL = Domestic, Industrial and Livestock consumption R 0 = Observed runoff at gauge sites E = Evaporation losses from reservoirs IS = Irrigation Support
WRA = R Calibrated/computed + IS + E +F DIL + FGW + F R
Water Resources Availability was estimated for a period of 20 years (1988-89 to 2007-08)
Pilot Study on Godavari and Brahmani-Baitarani Basins
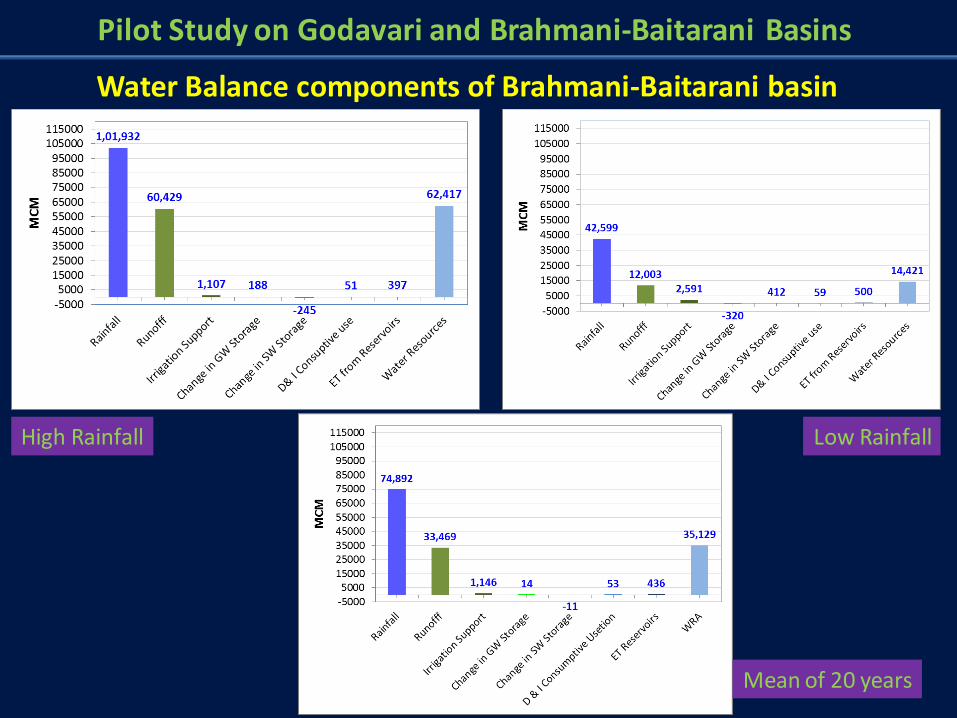
Mean of 20 years
High Rainfall Low Rainfall
Water Balance components of Brahmani-Baitarani basin
Pilot Study on Godavari and Brahmani-Baitarani Basins
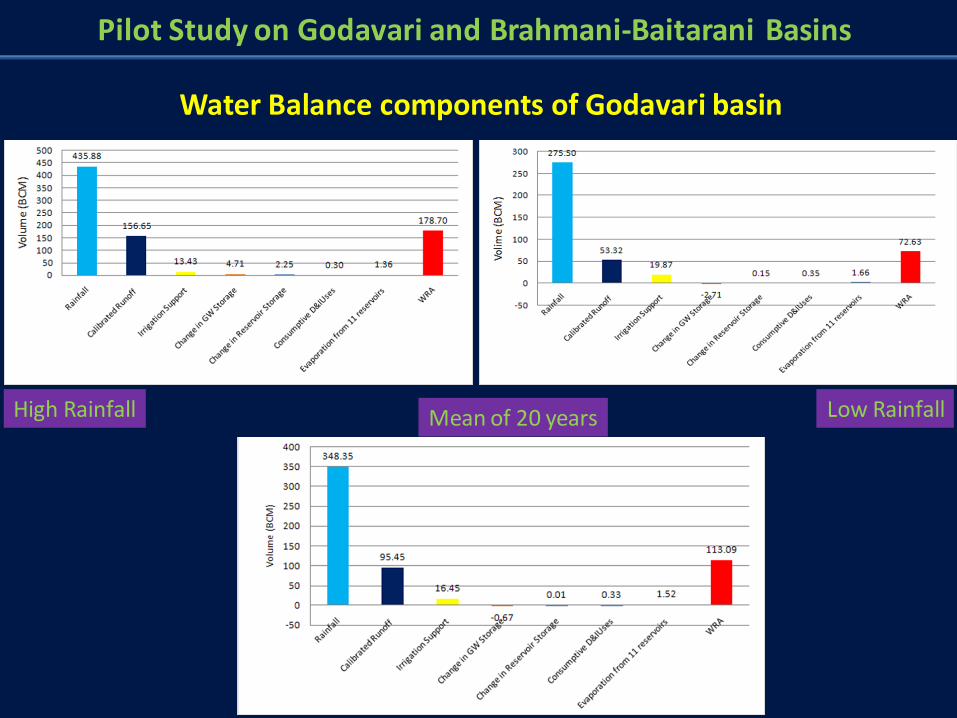
Water Balance components of Godavari basin
Mean of 20 years High Rainfall Low Rainfall
Pilot Study on Godavari and Brahmani-Baitarani Basins
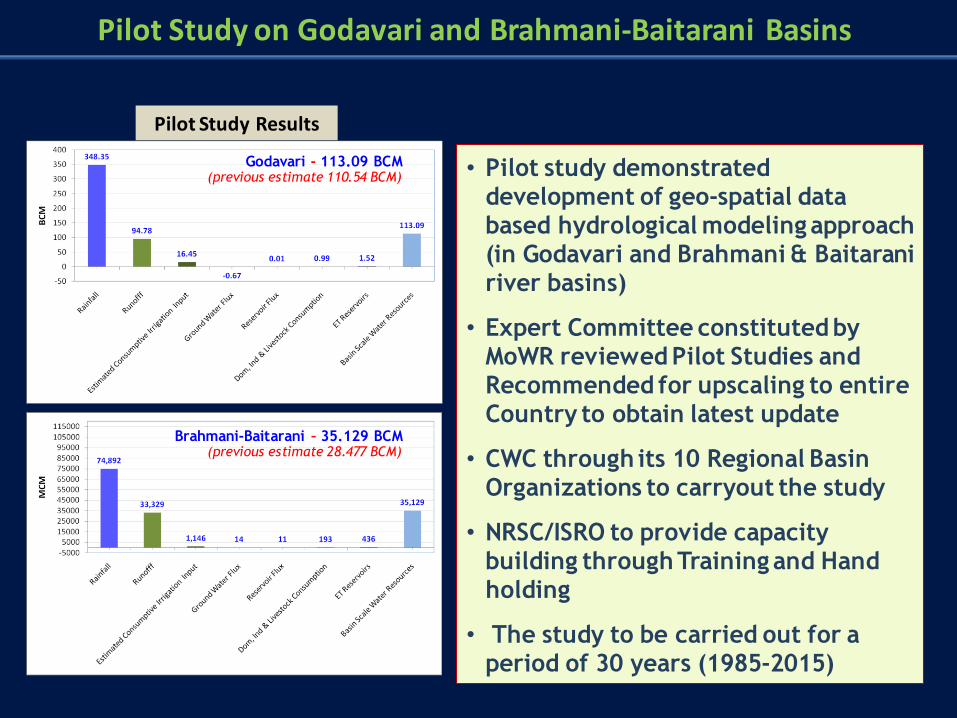
• Pilot study demonstrated development of geo-spatial data based hydrological modeling approach (in Godavari and Brahmani & Baitarani river basins)
• Expert Committee constituted by MoWR reviewed Pilot Studies and Recommended for upscaling to entire Country to obtain latest update
• CWC through its 10 Regional Basin Organizations to carryout the study
• NRSC/ISRO to provide capacity building through Training and Hand holding
• The study to be carried out for a period of 30 years (1985-2015)
Pilot Study Results
Godavari - 113.09 BCM
Brahmani-Baitarani – 35.129 BCM
(previous estimate 110.54 BCM)
(previous estimate 28.477 BCM)
Pilot Study on Godavari and Brahmani-Baitarani Basins
NRSC and CWC Signed MoU during Jul, 2016 for
Capacity Building and Technical Collaboration by
NRSC on Reassessment of Water Availability in
India using Satellite Based Inputs to Central
Water Commission.
CWC Procured requisite Computer Hardware and
Geo-Spatial Analysis Software for executing the
project activities
The project was initiated from July 2016 with
duration of one year.
Reassessment of Water Availability in India using Space Inputs
Capacity Building and Technical Collaboration on Reassessment of WA
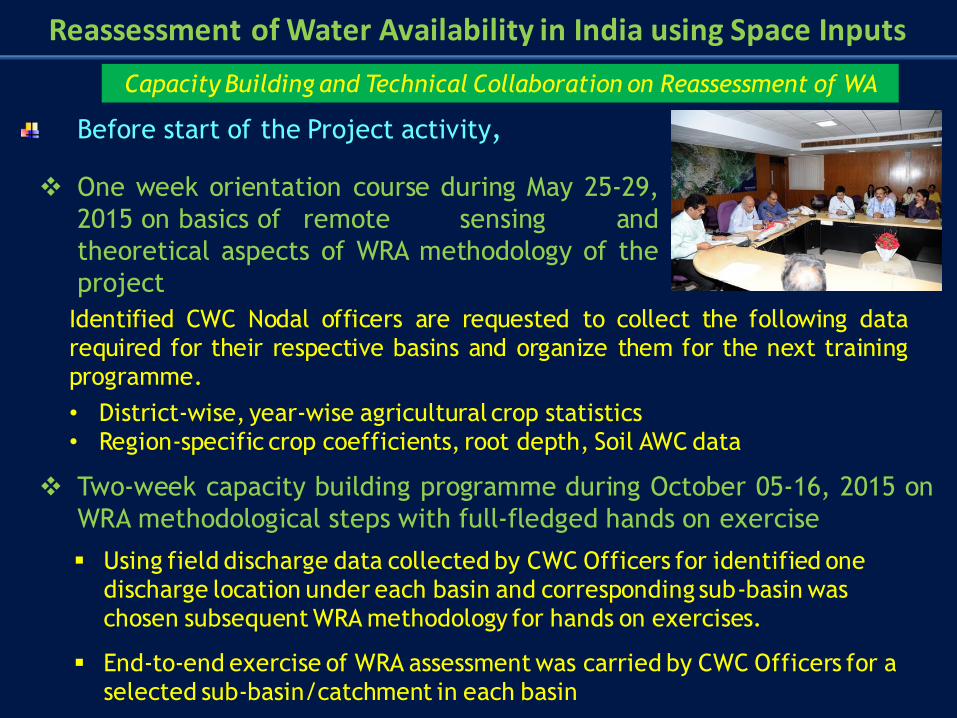
Before start of the Project activity,
One week orientation course during May 25-29,
2015 on basics of remote sensing and
theoretical aspects of WRA methodology of the
project
Identified CWC Nodal officers are requested to collect the following data required for their respective basins and organize them for the next training programme.
• District-wise, year-wise agricultural crop statistics • Region-specific crop coefficients, root depth, Soil AWC data
Two-week capacity building programme during October 05-16, 2015 on
WRA methodological steps with full-fledged hands on exercise
Using field discharge data collected by CWC Officers for identified one discharge location under each basin and corresponding sub-basin was chosen subsequent WRA methodology for hands on exercises.
End-to-end exercise of WRA assessment was carried by CWC Officers for a selected sub-basin/catchment in each basin
Capacity Building and Technical Collaboration on Reassessment of WA
Reassessment of Water Availability in India using Space Inputs
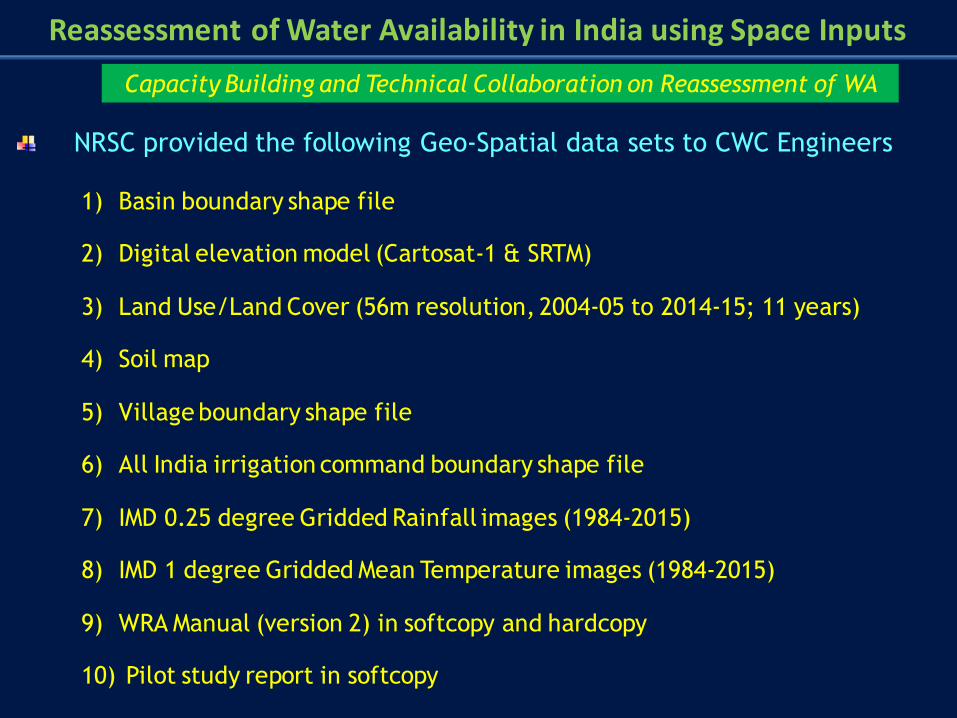
NRSC provided the following Geo-Spatial data sets to CWC Engineers
1) Basin boundary shape file
2) Digital elevation model (Cartosat-1 & SRTM)
3) Land Use/Land Cover (56m resolution, 2004-05 to 2014-15; 11 years)
4) Soil map
5) Village boundary shape file
6) All India irrigation command boundary shape file
7) IMD 0.25 degree Gridded Rainfall images (1984-2015)
8) IMD 1 degree Gridded Mean Temperature images (1984-2015)
9) WRA Manual (version 2) in softcopy and hardcopy
10) Pilot study report in softcopy
Capacity Building and Technical Collaboration on Reassessment of WA
Reassessment of Water Availability in India using Space Inputs
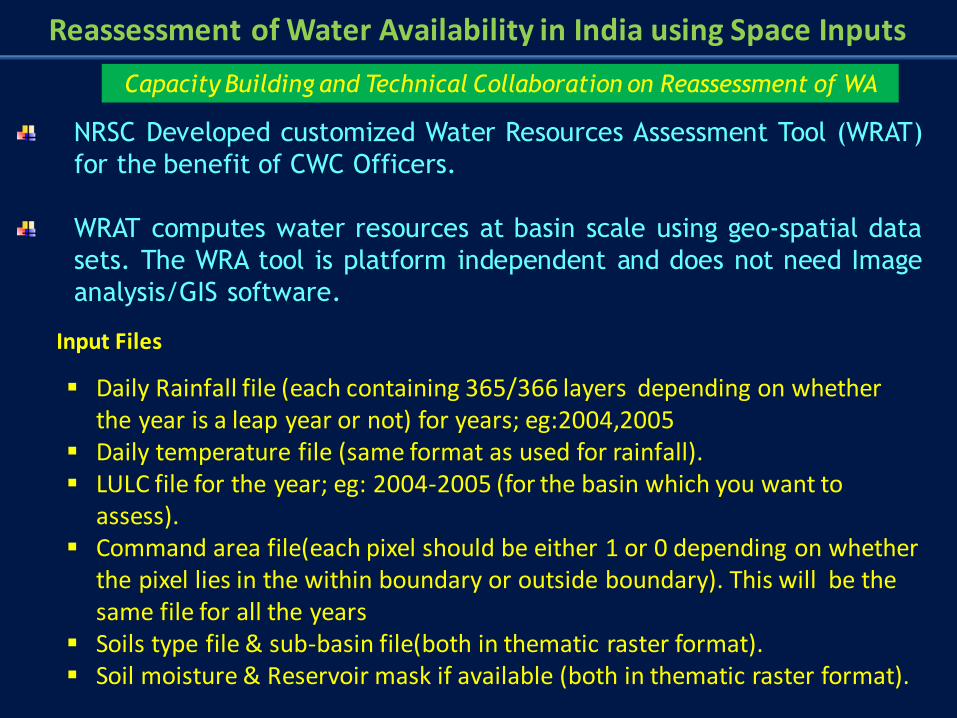
NRSC Developed customized Water Resources Assessment Tool (WRAT)
for the benefit of CWC Officers.
WRAT computes water resources at basin scale using geo-spatial data
sets. The WRA tool is platform independent and does not need Image
analysis/GIS software.
Input Files
Daily Rainfall file (each containing 365/366 layers depending on whether the year is a leap year or not) for years; eg:2004,2005
Daily temperature file (same format as used for rainfall). LULC file for the year; eg: 2004-2005 (for the basin which you want to
assess). Command area file(each pixel should be either 1 or 0 depending on whether
the pixel lies in the within boundary or outside boundary). This will be the same file for all the years
Soils type file & sub-basin file(both in thematic raster format). Soil moisture & Reservoir mask if available (both in thematic raster format).
Capacity Building and Technical Collaboration on Reassessment of WA
Reassessment of Water Availability in India using Space Inputs
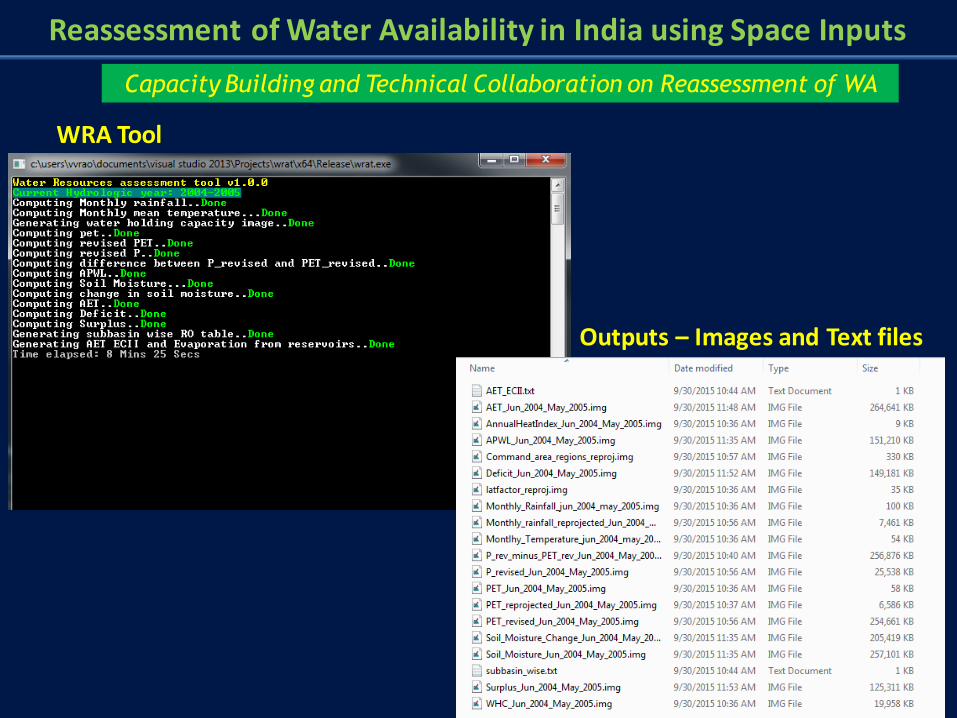
WRA Tool
Outputs – Images and Text files
Capacity Building and Technical Collaboration on Reassessment of WA
Reassessment of Water Availability in India using Space Inputs
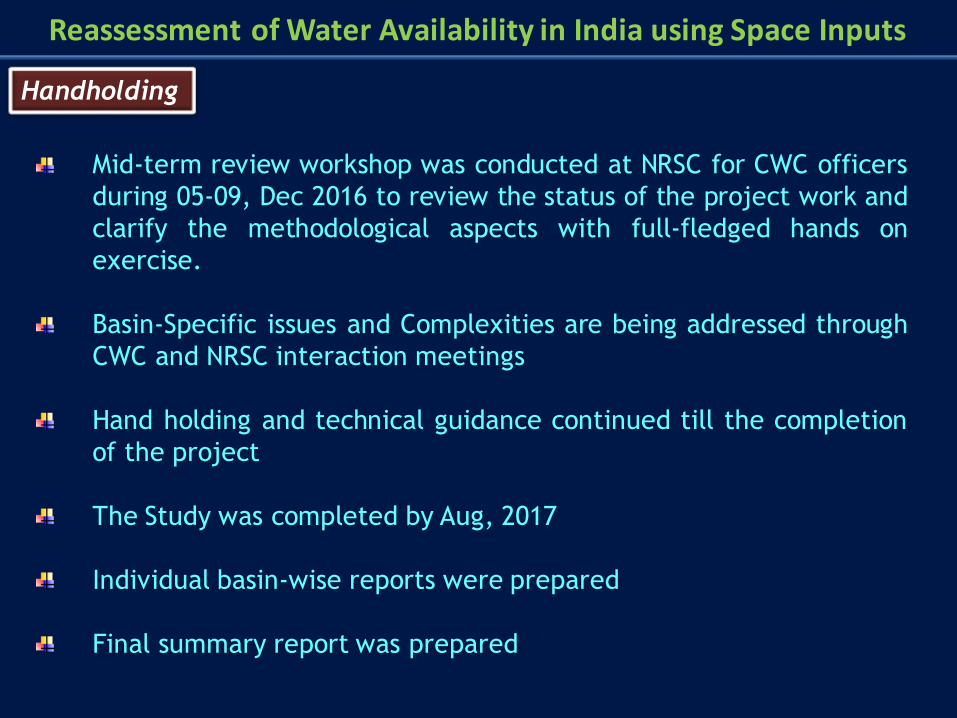
Mid-term review workshop was conducted at NRSC for CWC officers
during 05-09, Dec 2016 to review the status of the project work and
clarify the methodological aspects with full-fledged hands on
exercise.
Basin-Specific issues and Complexities are being addressed through
CWC and NRSC interaction meetings
Hand holding and technical guidance continued till the completion
of the project
The Study was completed by Aug, 2017
Individual basin-wise reports were prepared
Final summary report was prepared
Handholding
Reassessment of Water Availability in India using Space Inputs
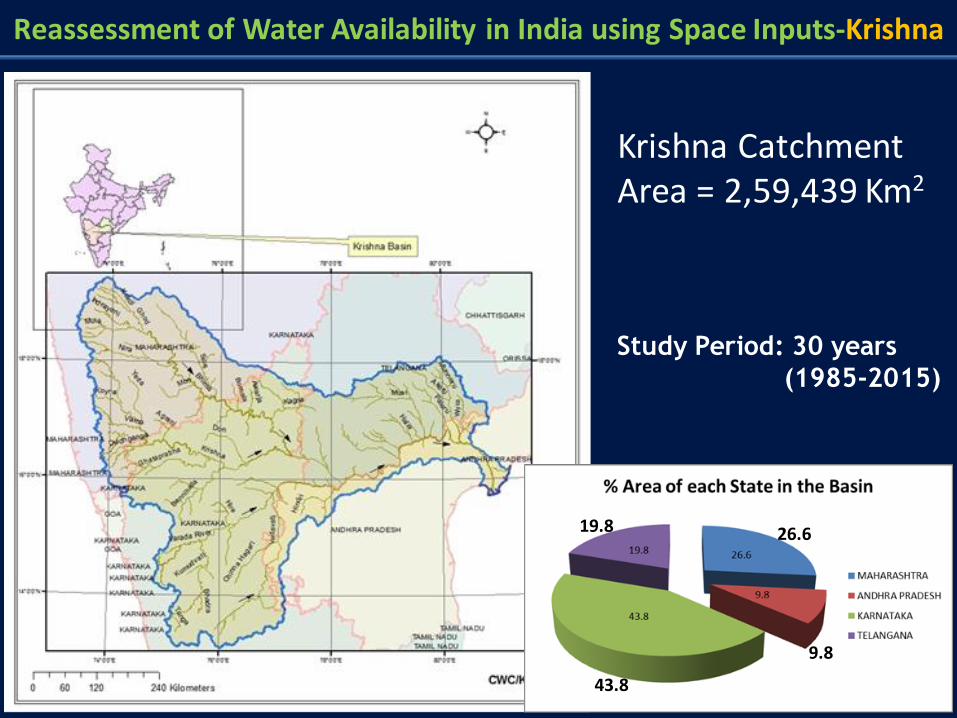
Reassessment of Water Availability in India using Space Inputs-Krishna
Krishna Catchment Area = 2,59,439 Km2
26.6
9.8
43.8
19.8
Study Period: 30 years
(1985-2015)
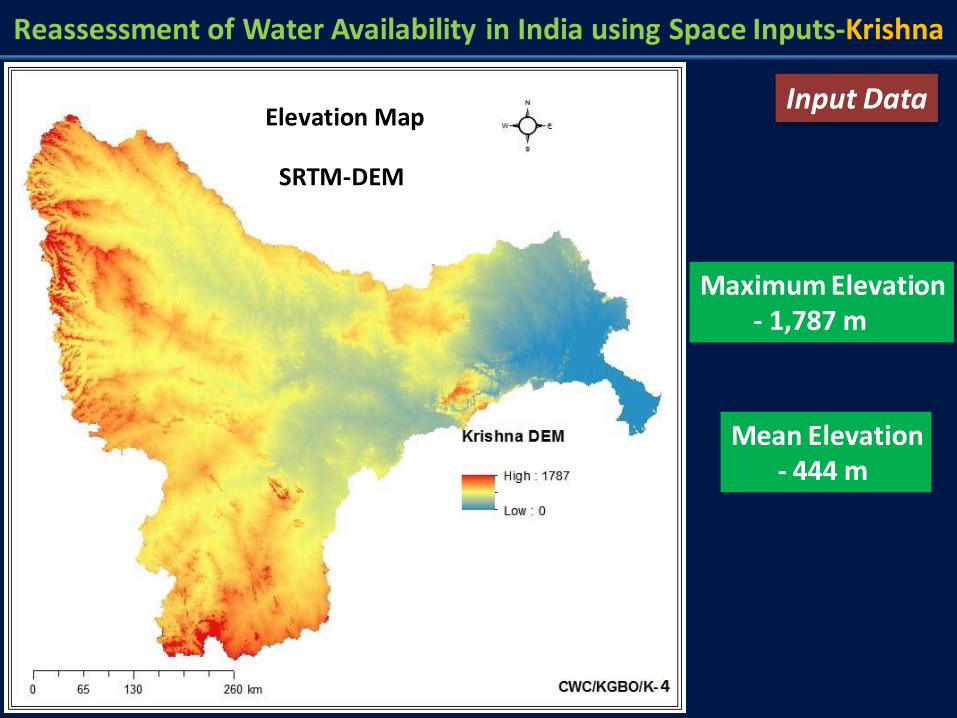
Reassessment of Water Availability in India using Space Inputs-Krishna
SRTM-DEM
Maximum Elevation - 1,787 m
Mean Elevation - 444 m
Elevation Map Input Data
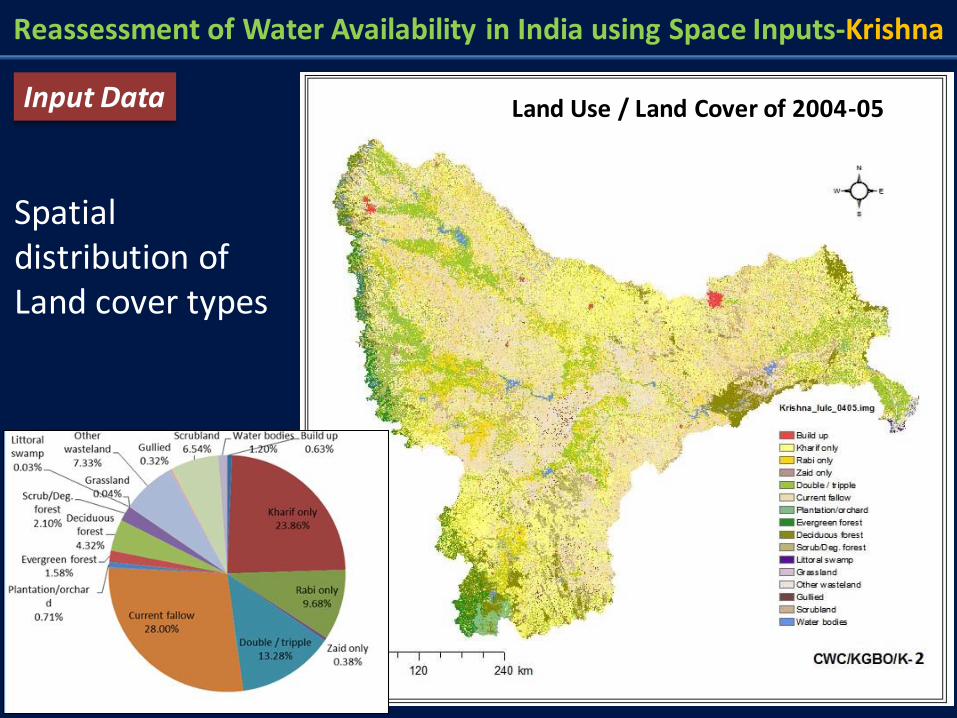
Land Use / Land Cover of 2004-05
Reassessment of Water Availability in India using Space Inputs-Krishna
Spatial distribution of Land cover types
Input Data
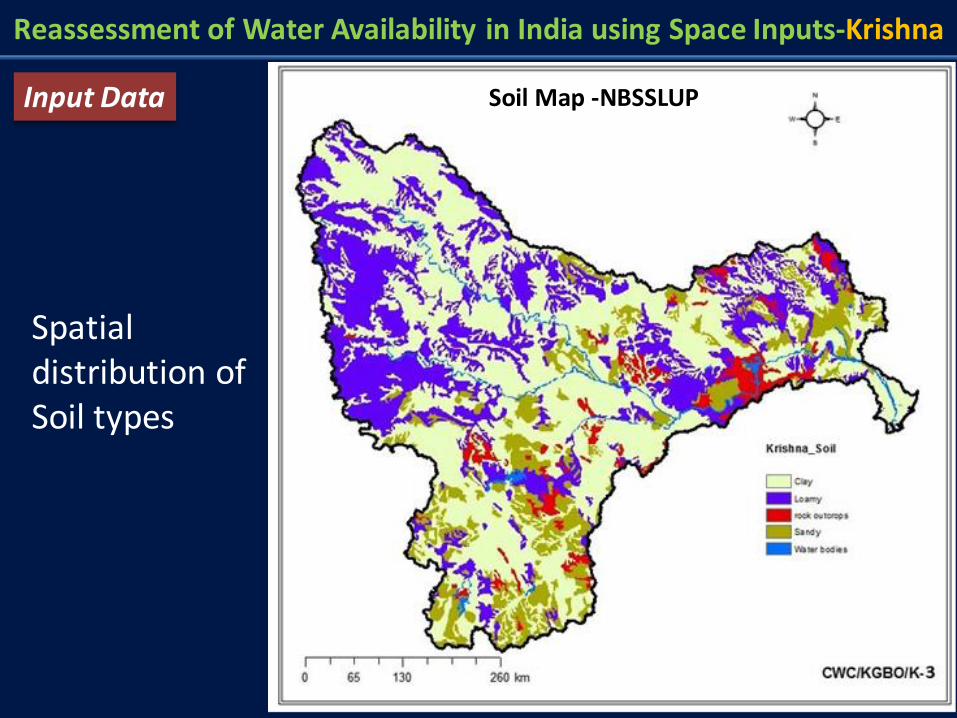
Reassessment of Water Availability in India using Space Inputs-Krishna
Spatial distribution of Soil types
Soil Map -NBSSLUP Input Data
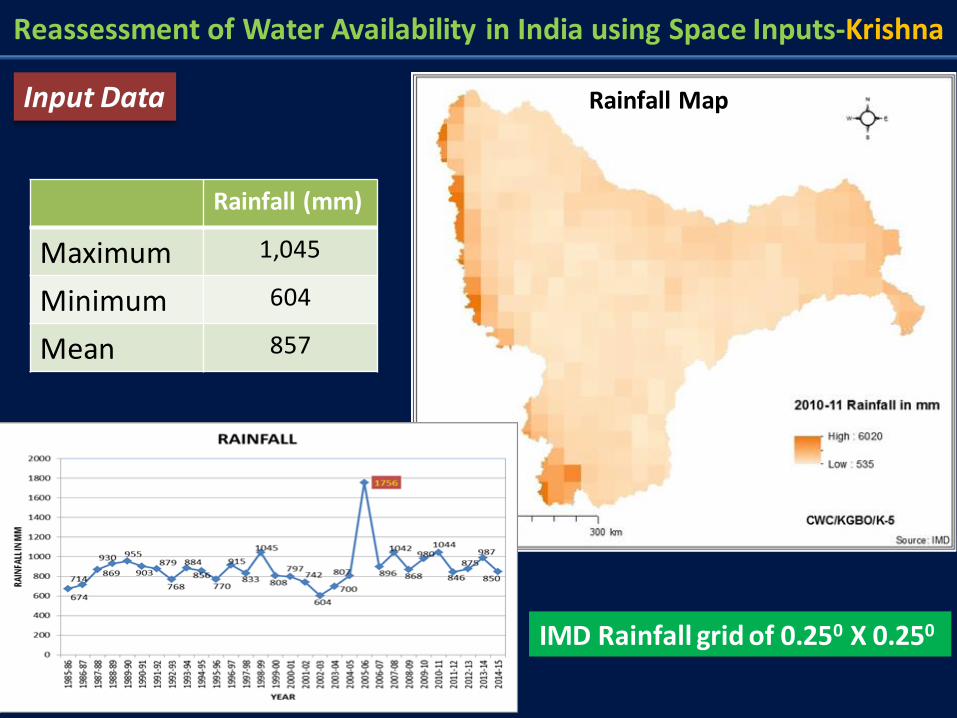
Reassessment of Water Availability in India using Space Inputs-Krishna
Rainfall Map
IMD Rainfall grid of 0.250 X 0.250
Rainfall (mm)
Maximum 1,045
Minimum 604
Mean 857
Input Data
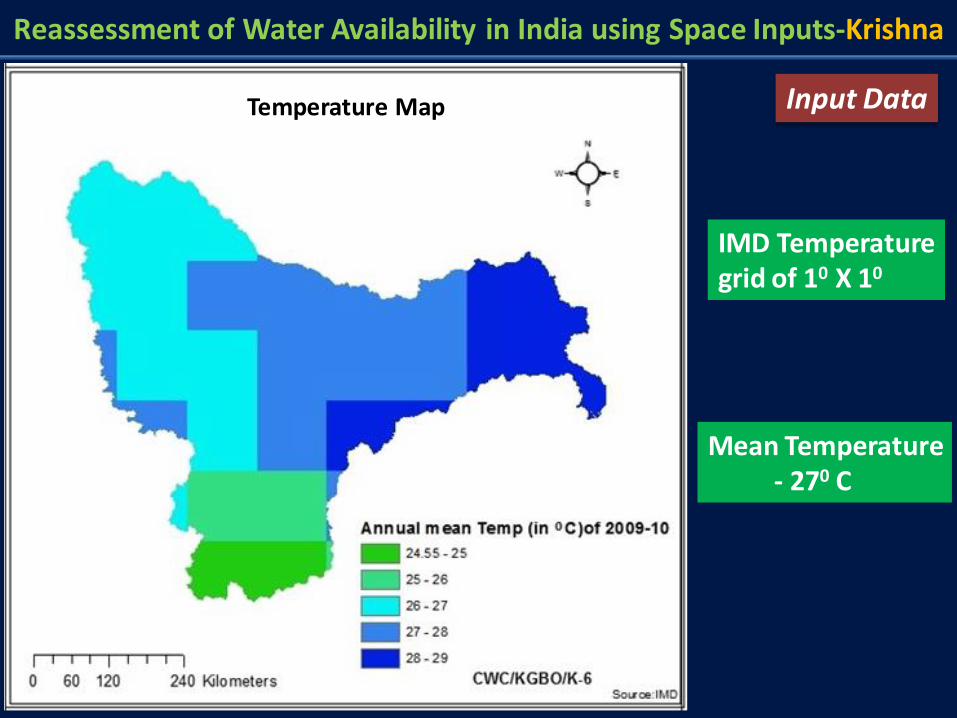
Reassessment of Water Availability in India using Space Inputs-Krishna
Temperature Map
IMD Temperature grid of 10 X 10
Mean Temperature - 270 C
Input Data
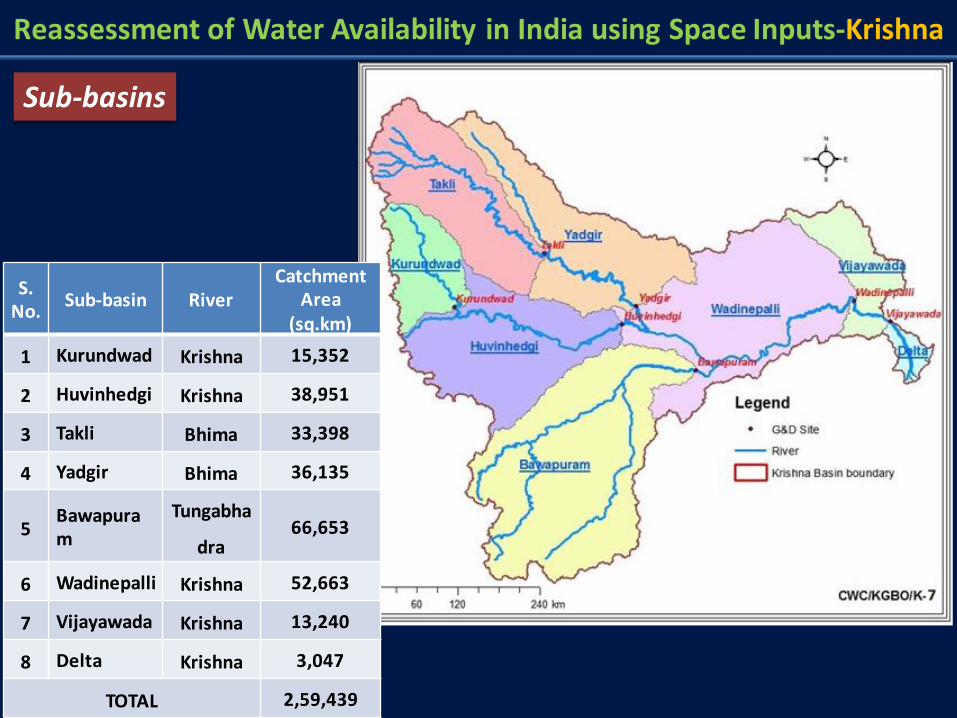
S. No.
Sub-basin River Catchment
Area (sq.km)
1 Kurundwad Krishna 15,352
2 Huvinhedgi Krishna 38,951
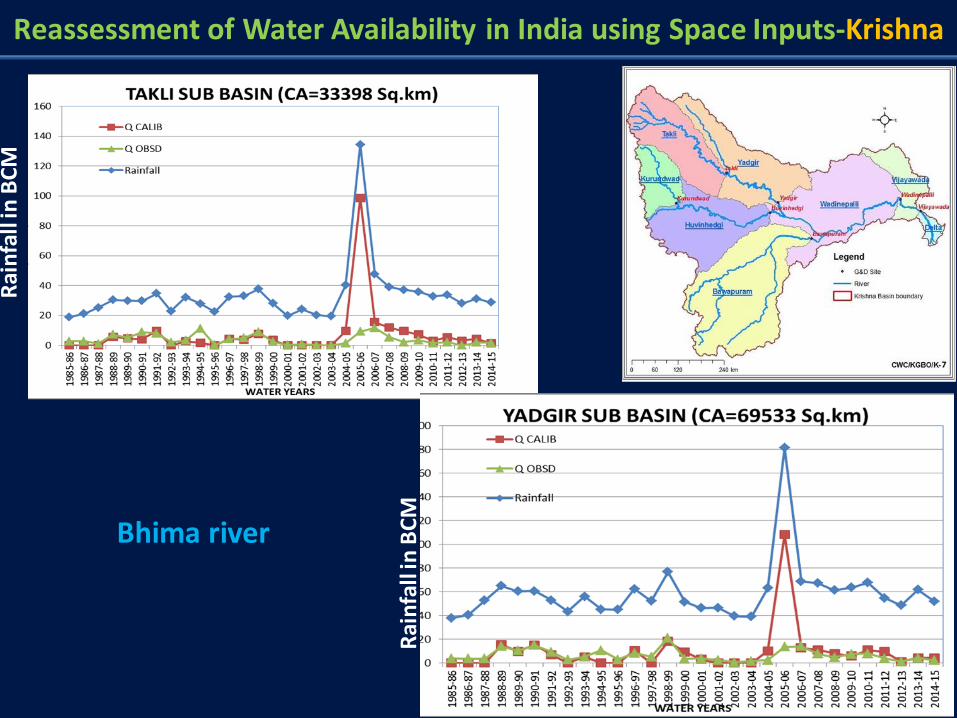
3 Takli Bhima 33,398
4 Yadgir Bhima 36,135
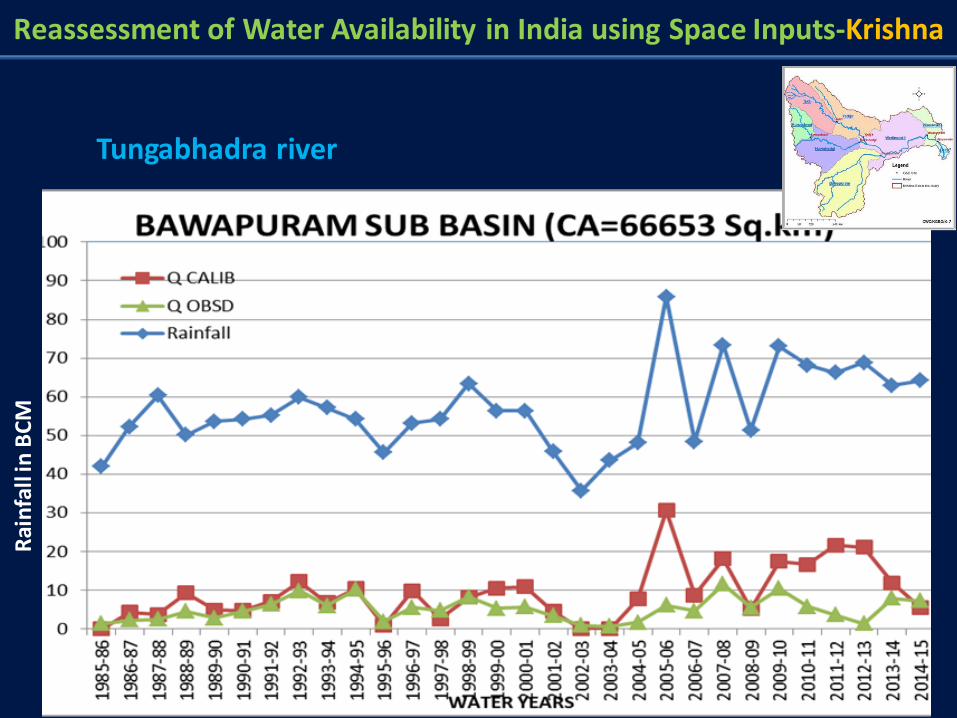
5 Bawapuram
Tungabha
dra 66,653
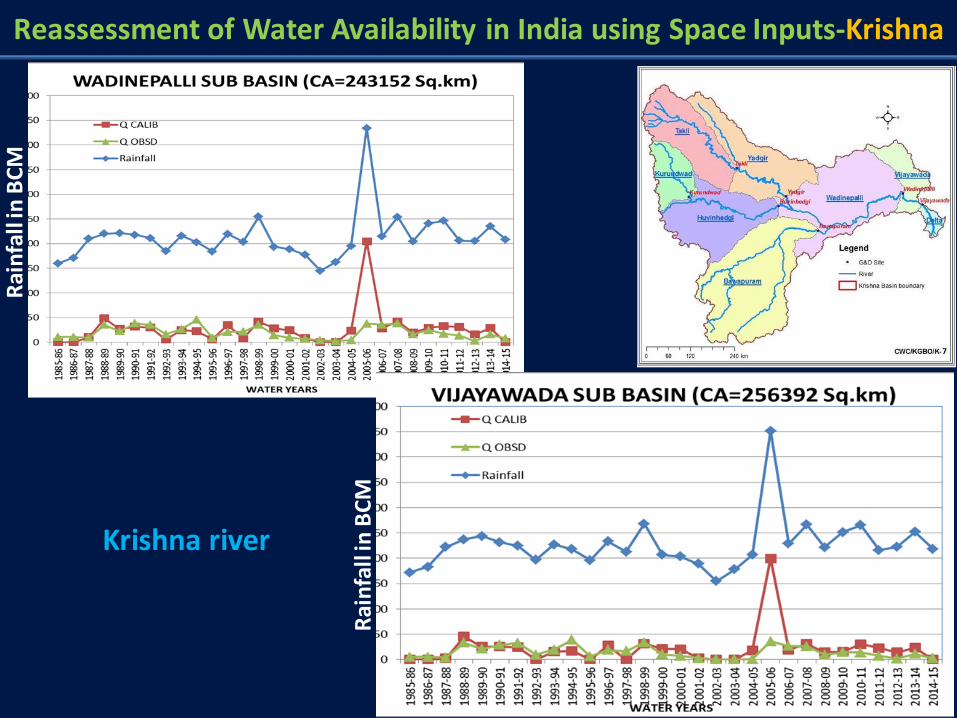
6 Wadinepalli Krishna 52,663
7 Vijayawada Krishna 13,240
8 Delta Krishna 3,047
TOTAL 2,59,439
Reassessment of Water Availability in India using Space Inputs-Krishna
Sub-basins
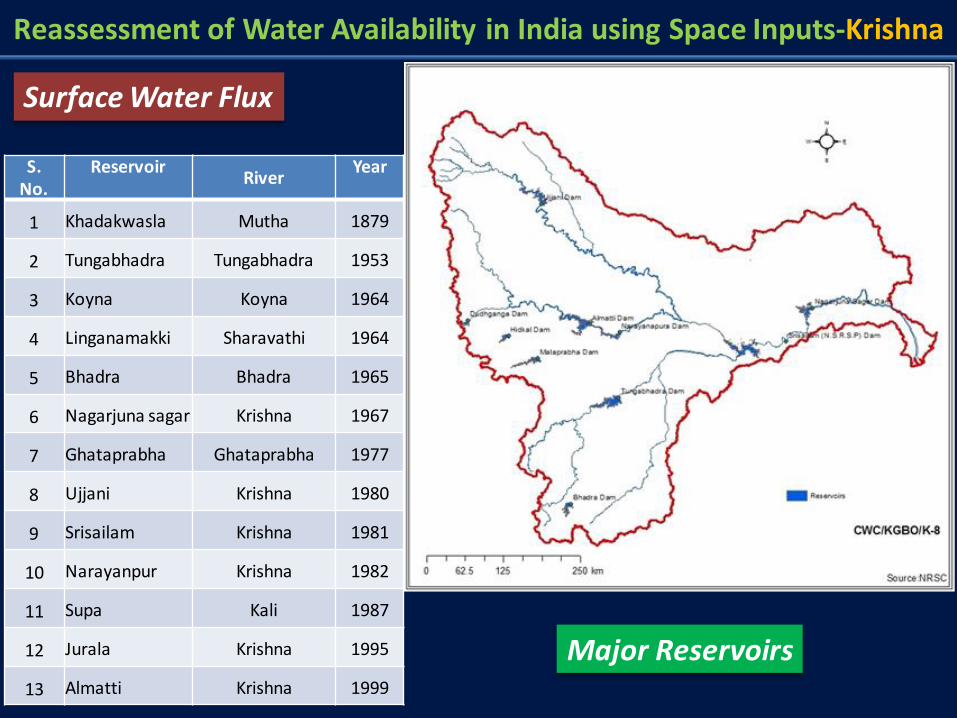
S. No.
Reservoir
River Year
1 Khadakwasla Mutha 1879
2 Tungabhadra Tungabhadra 1953
3 Koyna Koyna 1964
4 Linganamakki Sharavathi 1964
5 Bhadra Bhadra 1965
6 Nagarjuna sagar Krishna 1967
7 Ghataprabha Ghataprabha 1977
8 Ujjani Krishna 1980
9 Srisailam Krishna 1981
10 Narayanpur Krishna 1982
11 Supa Kali 1987
12 Jurala Krishna 1995
13 Almatti Krishna 1999
Reassessment of Water Availability in India using Space Inputs-Krishna
Major Reservoirs
Surface Water Flux
Reassessment of Water Availability in India using Space Inputs-Krishna
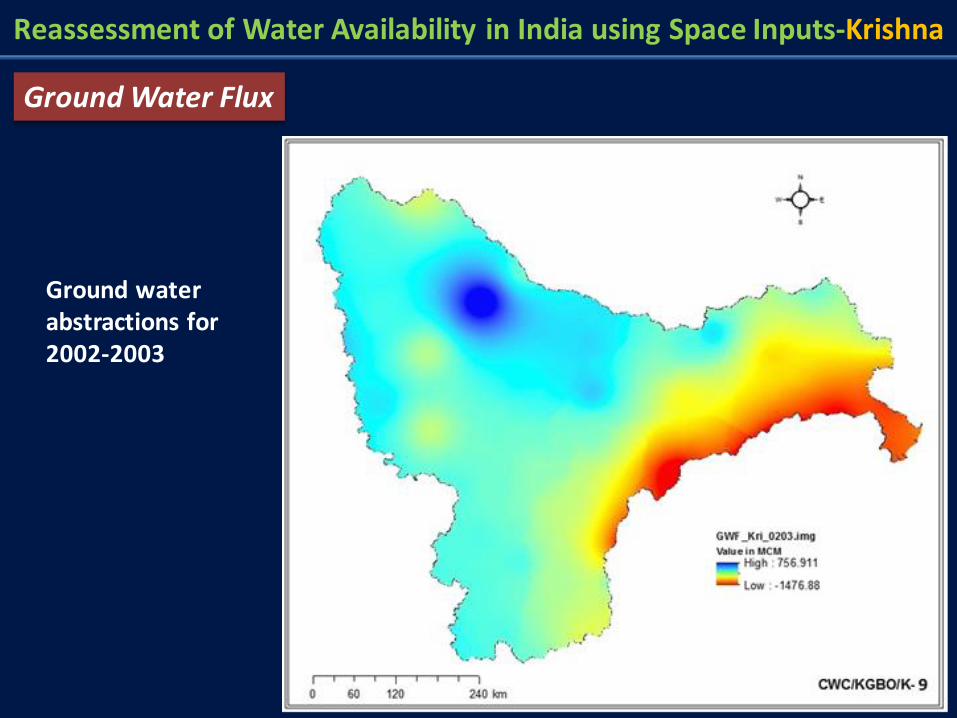
Ground Water Flux
Ground water abstractions for 2002-2003
Reassessment of Water Availability in India using Space Inputs-Krishna
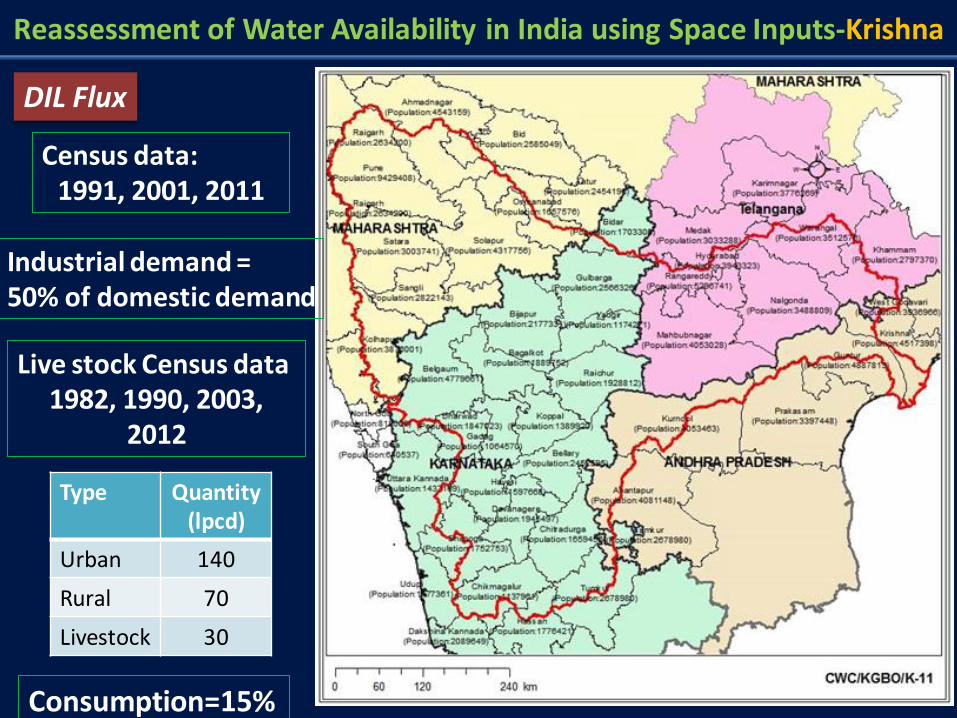
DIL Flux
Census data: 1991, 2001, 2011
Live stock Census data 1982, 1990, 2003,
2012
Type Quantity (lpcd)
Urban 140
Rural 70
Livestock 30
Consumption=15%
Industrial demand = 50% of domestic demand
Reassessment of Water Availability in India using Space Inputs-Krishna
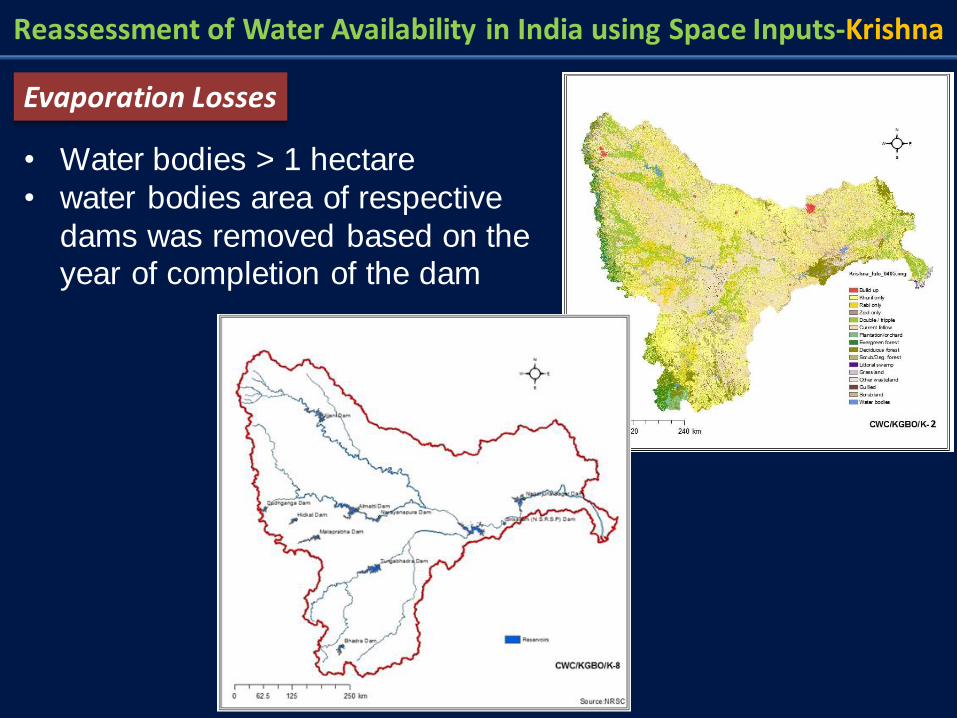
• Water bodies > 1 hectare
• water bodies area of respective
dams was removed based on the year of completion of the dam
Evaporation Losses
Reassessment of Water Availability in India using Space Inputs-Krishna
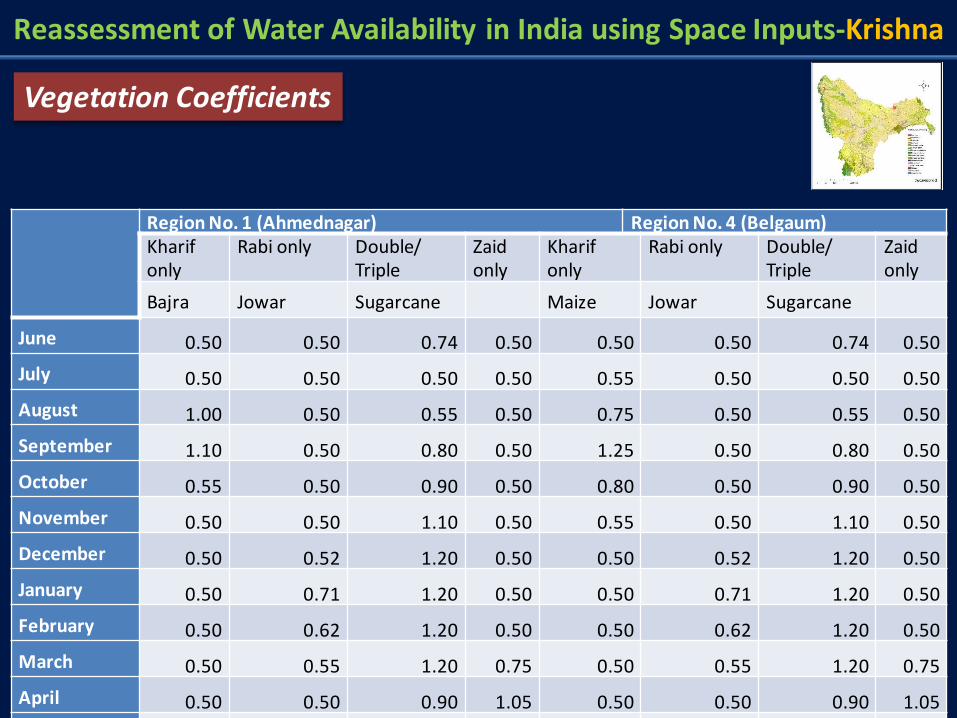
Vegetation Coefficients
Region No. 1 (Ahmednagar) Region No. 4 (Belgaum) Kharif only
Rabi only
Double/ Triple
Zaid only
Kharif only
Rabi only
Double/ Triple
Zaid only
Bajra Jowar Sugarcane Maize Jowar Sugarcane
June 0.50 0.50 0.74 0.50 0.50 0.50 0.74 0.50
July 0.50 0.50 0.50 0.50 0.55 0.50 0.50 0.50
August 1.00 0.50 0.55 0.50 0.75 0.50 0.55 0.50
September 1.10 0.50 0.80 0.50 1.25 0.50 0.80 0.50
October 0.55 0.50 0.90 0.50 0.80 0.50 0.90 0.50
November 0.50 0.50 1.10 0.50 0.55 0.50 1.10 0.50
December 0.50 0.52 1.20 0.50 0.50 0.52 1.20 0.50
January 0.50 0.71 1.20 0.50 0.50 0.71 1.20 0.50
February 0.50 0.62 1.20 0.50 0.50 0.62 1.20 0.50
March 0.50 0.55 1.20 0.75 0.50 0.55 1.20 0.75
April 0.50 0.50 0.90 1.05 0.50 0.50 0.90 1.05
May 0.50 0.50 0.90 0.50 0.50 0.50 0.90 0.50
Reassessment of Water Availability in India using Space Inputs-Krishna
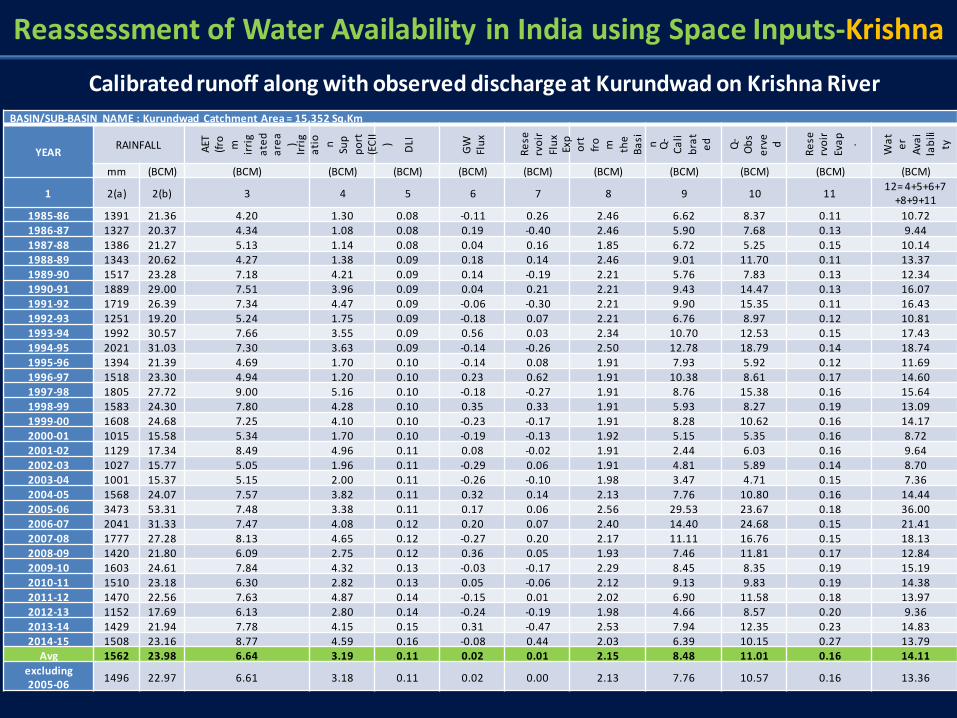
BASIN/SUB-BASIN NAME : Kurundwad Catchment Area = 15,352 Sq.Km
YEAR RAINFALL A
ET
(fro m
ir
rig
ate
d
are
a
) Ir
rig
ati
o
n
Sup
po
rt
(EC
II
)
DLI
GW
Fl
ux
Re
serv
oir
Flu
x Ex
po
rt
fro m
the
B
asi n
Q-
Ca
li
bra
te
d
Q-
Ob
s
erv
ed
Re
serv
oir
Eva
p.
Wa
te
r
Ava
ila
bili
ty
mm (BCM) (BCM) (BCM) (BCM) (BCM) (BCM) (BCM) (BCM) (BCM) (BCM) (BCM)
1 2(a) 2(b) 3 4 5 6 7 8 9 10 11 12= 4+5+6+7
+8+9+11
1985-86 1391 21.36 4.20 1.30 0.08 -0.11 0.26 2.46 6.62 8.37 0.11 10.72
1986-87 1327 20.37 4.34 1.08 0.08 0.19 -0.40 2.46 5.90 7.68 0.13 9.44
1987-88 1386 21.27 5.13 1.14 0.08 0.04 0.16 1.85 6.72 5.25 0.15 10.14
1988-89 1343 20.62 4.27 1.38 0.09 0.18 0.14 2.46 9.01 11.70 0.11 13.37
1989-90 1517 23.28 7.18 4.21 0.09 0.14 -0.19 2.21 5.76 7.83 0.13 12.34
1990-91 1889 29.00 7.51 3.96 0.09 0.04 0.21 2.21 9.43 14.47 0.13 16.07
1991-92 1719 26.39 7.34 4.47 0.09 -0.06 -0.30 2.21 9.90 15.35 0.11 16.43
1992-93 1251 19.20 5.24 1.75 0.09 -0.18 0.07 2.21 6.76 8.97 0.12 10.81
1993-94 1992 30.57 7.66 3.55 0.09 0.56 0.03 2.34 10.70 12.53 0.15 17.43
1994-95 2021 31.03 7.30 3.63 0.09 -0.14 -0.26 2.50 12.78 18.79 0.14 18.74
1995-96 1394 21.39 4.69 1.70 0.10 -0.14 0.08 1.91 7.93 5.92 0.12 11.69
1996-97 1518 23.30 4.94 1.20 0.10 0.23 0.62 1.91 10.38 8.61 0.17 14.60
1997-98 1805 27.72 9.00 5.16 0.10 -0.18 -0.27 1.91 8.76 15.38 0.16 15.64
1998-99 1583 24.30 7.80 4.28 0.10 0.35 0.33 1.91 5.93 8.27 0.19 13.09
1999-00 1608 24.68 7.25 4.10 0.10 -0.23 -0.17 1.91 8.28 10.62 0.16 14.17
2000-01 1015 15.58 5.34 1.70 0.10 -0.19 -0.13 1.92 5.15 5.35 0.16 8.72
2001-02 1129 17.34 8.49 4.96 0.11 0.08 -0.02 1.91 2.44 6.03 0.16 9.64
2002-03 1027 15.77 5.05 1.96 0.11 -0.29 0.06 1.91 4.81 5.89 0.14 8.70
2003-04 1001 15.37 5.15 2.00 0.11 -0.26 -0.10 1.98 3.47 4.71 0.15 7.36
2004-05 1568 24.07 7.57 3.82 0.11 0.32 0.14 2.13 7.76 10.80 0.16 14.44
2005-06 3473 53.31 7.48 3.38 0.11 0.17 0.06 2.56 29.53 23.67 0.18 36.00
2006-07 2041 31.33 7.47 4.08 0.12 0.20 0.07 2.40 14.40 24.68 0.15 21.41
2007-08 1777 27.28 8.13 4.65 0.12 -0.27 0.20 2.17 11.11 16.76 0.15 18.13
2008-09 1420 21.80 6.09 2.75 0.12 0.36 0.05 1.93 7.46 11.81 0.17 12.84
2009-10 1603 24.61 7.84 4.32 0.13 -0.03 -0.17 2.29 8.45 8.35 0.19 15.19
2010-11 1510 23.18 6.30 2.82 0.13 0.05 -0.06 2.12 9.13 9.83 0.19 14.38
2011-12 1470 22.56 7.63 4.87 0.14 -0.15 0.01 2.02 6.90 11.58 0.18 13.97
2012-13 1152 17.69 6.13 2.80 0.14 -0.24 -0.19 1.98 4.66 8.57 0.20 9.36
2013-14 1429 21.94 7.78 4.15 0.15 0.31 -0.47 2.53 7.94 12.35 0.23 14.83
2014-15 1508 23.16 8.77 4.59 0.16 -0.08 0.44 2.03 6.39 10.15 0.27 13.79
Avg 1562 23.98 6.64 3.19 0.11 0.02 0.01 2.15 8.48 11.01 0.16 14.11
excluding 2005-06
1496 22.97 6.61 3.18 0.11 0.02 0.00 2.13 7.76 10.57 0.16 13.36
Calibrated runoff along with observed discharge at Kurundwad on Krishna River
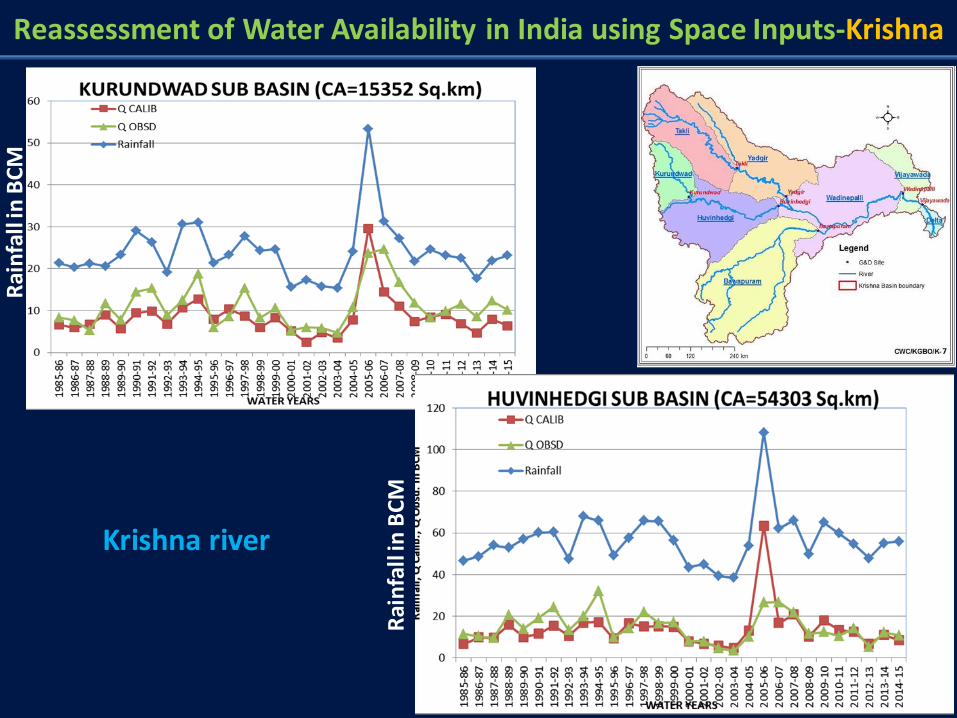
Reassessment of Water Availability in India using Space Inputs-Krishna R
ain
fall
in B
CM
Rai
nfa
ll in
BC
M
Krishna river
Reassessment of Water Availability in India using Space Inputs-Krishna R
ain
fall
in B
CM
Rai
nfa
ll in
BC
M
Bhima river
Reassessment of Water Availability in India using Space Inputs-Krishna R
ain
fall
in B
CM
Tungabhadra river
Reassessment of Water Availability in India using Space Inputs-Krishna R
ain
fall
in B
CM
Rai
nfa
ll in
BC
M
Krishna river
Reassessment of Water Availability in India using Space Inputs-Krishna
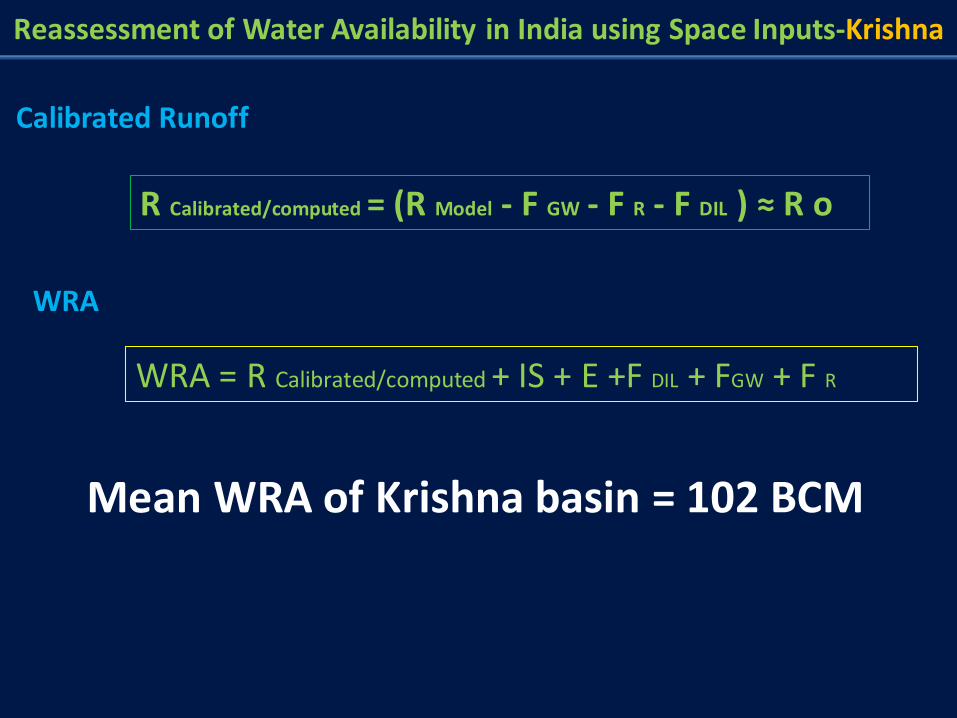
WRA = R Calibrated/computed + IS + E +F DIL + FGW + F R
R Calibrated/computed = (R Model - F GW - F R - F DIL ) ≈ R o
Calibrated Runoff
WRA
Mean WRA of Krishna basin = 102 BCM
Reassessment of Water Availability in India using Space Inputs-Krishna
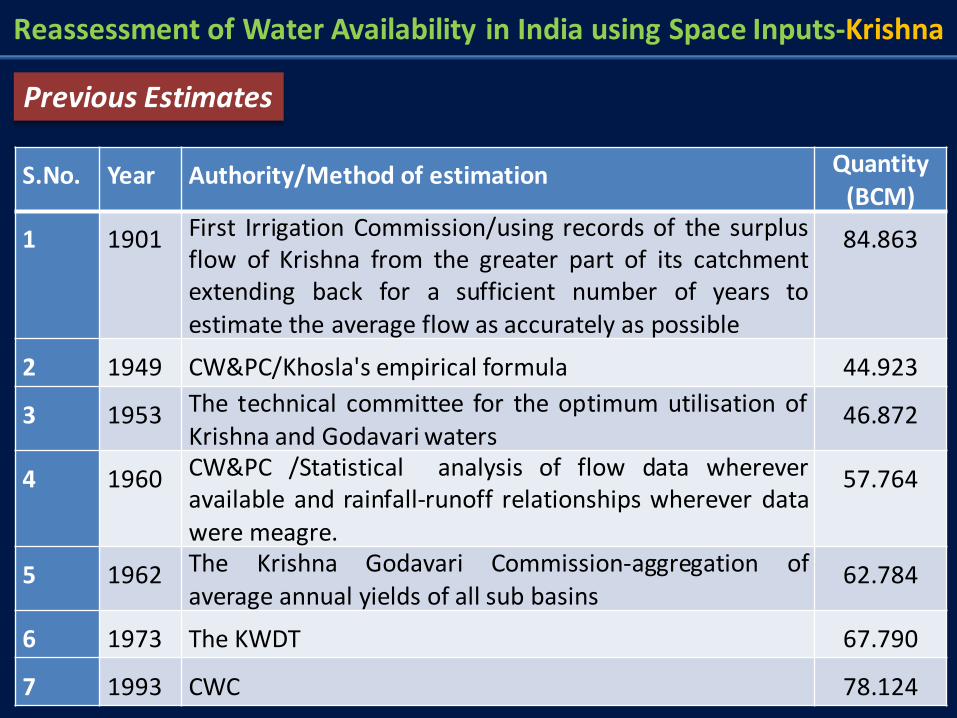
S.No. Year Authority/Method of estimation Quantity (BCM)
1 1901 First Irrigation Commission/using records of the surplus flow of Krishna from the greater part of its catchment extending back for a sufficient number of years to estimate the average flow as accurately as possible
84.863
2 1949 CW&PC/Khosla's empirical formula 44.923
3 1953 The technical committee for the optimum utilisation of Krishna and Godavari waters
46.872
4 1960 CW&PC /Statistical analysis of flow data wherever available and rainfall-runoff relationships wherever data were meagre.
57.764
5 1962 The Krishna Godavari Commission-aggregation of average annual yields of all sub basins
62.784
6 1973 The KWDT 67.790
7 1993 CWC 78.124
Previous Estimates
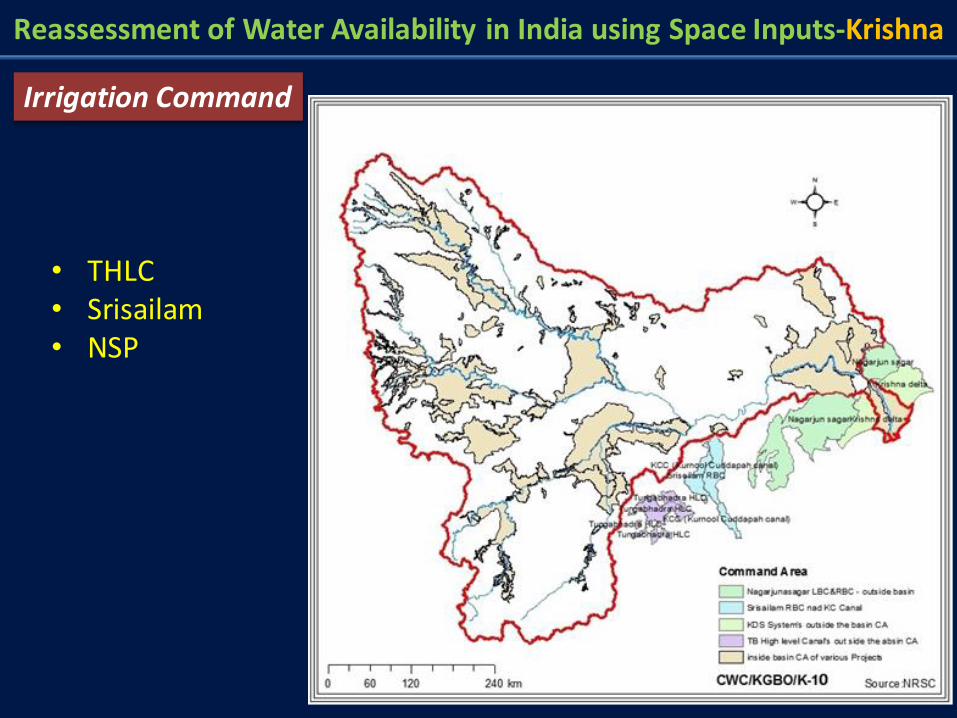
Reassessment of Water Availability in India using Space Inputs-Krishna
Irrigation Command
• THLC • Srisailam • NSP
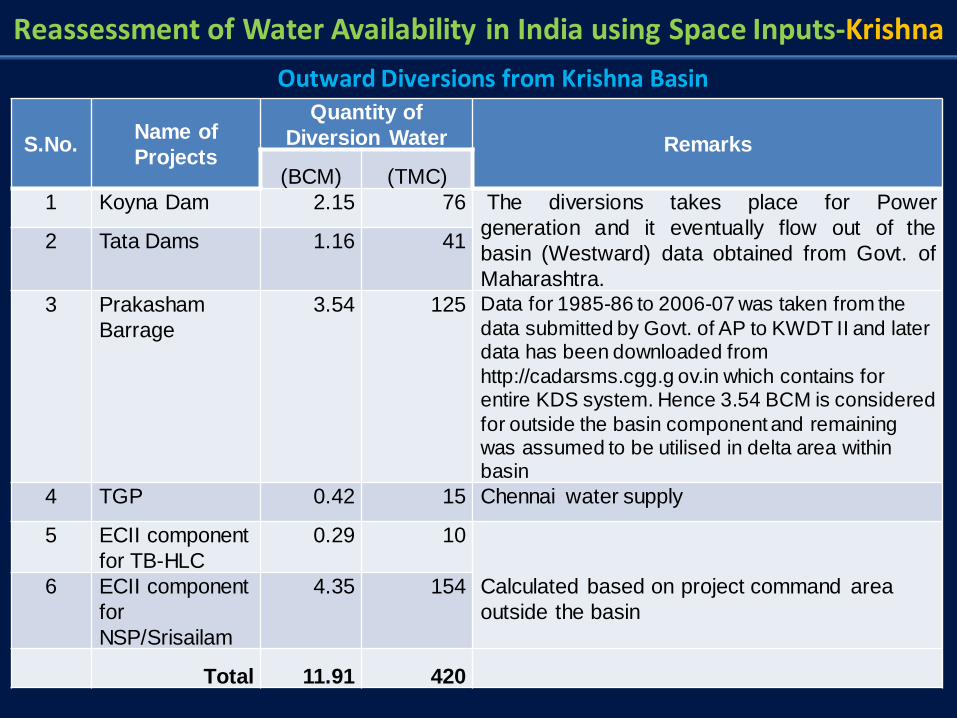
S.No. Name of
Projects
Quantity of
Diversion Water Remarks
(BCM) (TMC)
1 Koyna Dam 2.15 76 The diversions takes place for Power
generation and it eventually flow out of the
basin (Westward) data obtained from Govt. of
Maharashtra.
2 Tata Dams 1.16 41
3 Prakasham
Barrage
3.54 125 Data for 1985-86 to 2006-07 was taken from the
data submitted by Govt. of AP to KWDT II and later data has been downloaded from
http://cadarsms.cgg.g ov.in which contains for entire KDS system. Hence 3.54 BCM is considered
for outside the basin component and remaining was assumed to be utilised in delta area within basin
4 TGP 0.42 15 Chennai water supply
5 ECII component
for TB-HLC
0.29 10
Calculated based on project command area
outside the basin
6 ECII component
for
NSP/Srisailam
4.35 154
Total 11.91 420
Reassessment of Water Availability in India using Space Inputs-Krishna
Outward Diversions from Krishna Basin
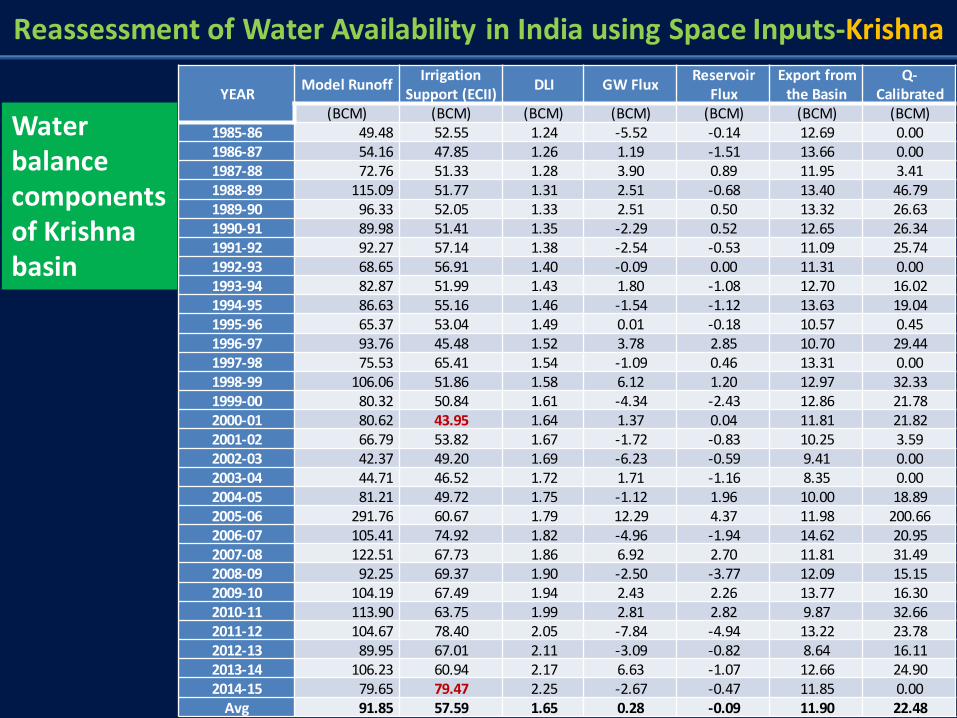
Reassessment of Water Availability in India using Space Inputs-Krishna
YEAR Model Runoff
Irrigation Support (ECII)
DLI GW Flux Reservoir
Flux
Export from the Basin
Q-Calibrated
(BCM) (BCM) (BCM) (BCM) (BCM) (BCM) (BCM) 1985-86 49.48 52.55 1.24 -5.52 -0.14 12.69 0.00
1986-87 54.16 47.85 1.26 1.19 -1.51 13.66 0.00
1987-88 72.76 51.33 1.28 3.90 0.89 11.95 3.41
1988-89 115.09 51.77 1.31 2.51 -0.68 13.40 46.79
1989-90 96.33 52.05 1.33 2.51 0.50 13.32 26.63
1990-91 89.98 51.41 1.35 -2.29 0.52 12.65 26.34
1991-92 92.27 57.14 1.38 -2.54 -0.53 11.09 25.74
1992-93 68.65 56.91 1.40 -0.09 0.00 11.31 0.00
1993-94 82.87 51.99 1.43 1.80 -1.08 12.70 16.02
1994-95 86.63 55.16 1.46 -1.54 -1.12 13.63 19.04
1995-96 65.37 53.04 1.49 0.01 -0.18 10.57 0.45
1996-97 93.76 45.48 1.52 3.78 2.85 10.70 29.44
1997-98 75.53 65.41 1.54 -1.09 0.46 13.31 0.00
1998-99 106.06 51.86 1.58 6.12 1.20 12.97 32.33
1999-00 80.32 50.84 1.61 -4.34 -2.43 12.86 21.78
2000-01 80.62 43.95 1.64 1.37 0.04 11.81 21.82
2001-02 66.79 53.82 1.67 -1.72 -0.83 10.25 3.59
2002-03 42.37 49.20 1.69 -6.23 -0.59 9.41 0.00
2003-04 44.71 46.52 1.72 1.71 -1.16 8.35 0.00
2004-05 81.21 49.72 1.75 -1.12 1.96 10.00 18.89
2005-06 291.76 60.67 1.79 12.29 4.37 11.98 200.66
2006-07 105.41 74.92 1.82 -4.96 -1.94 14.62 20.95
2007-08 122.51 67.73 1.86 6.92 2.70 11.81 31.49
2008-09 92.25 69.37 1.90 -2.50 -3.77 12.09 15.15
2009-10 104.19 67.49 1.94 2.43 2.26 13.77 16.30
2010-11 113.90 63.75 1.99 2.81 2.82 9.87 32.66
2011-12 104.67 78.40 2.05 -7.84 -4.94 13.22 23.78
2012-13 89.95 67.01 2.11 -3.09 -0.82 8.64 16.11
2013-14 106.23 60.94 2.17 6.63 -1.07 12.66 24.90
2014-15 79.65 79.47 2.25 -2.67 -0.47 11.85 0.00
Avg 91.85 57.59 1.65 0.28 -0.09 11.90 22.48
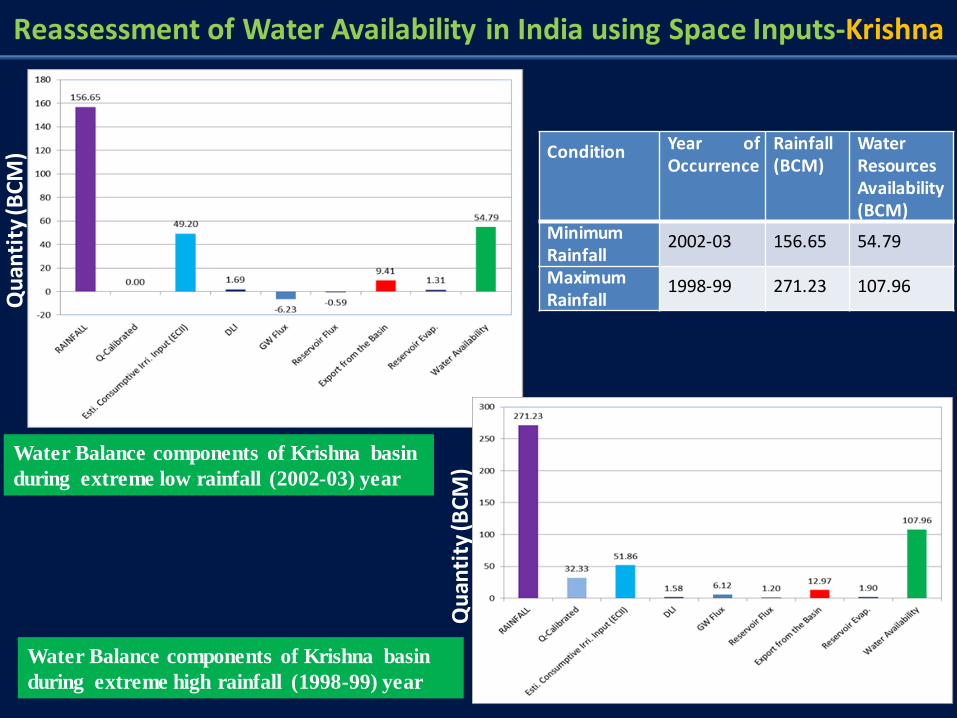
Water balance components of Krishna basin
Reassessment of Water Availability in India using Space Inputs-Krishna
Condition Year of Occurrence
Rainfall (BCM)
Water Resources Availability (BCM)
Minimum Rainfall
2002-03 156.65 54.79
Maximum Rainfall
1998-99 271.23 107.96
Qu
anti
ty (B
CM
)
Qu
anti
ty (B
CM
)
Water Balance components of Krishna basin
during extreme high rainfall (1998-99) year
Water Balance components of Krishna basin
during extreme low rainfall (2002-03) year
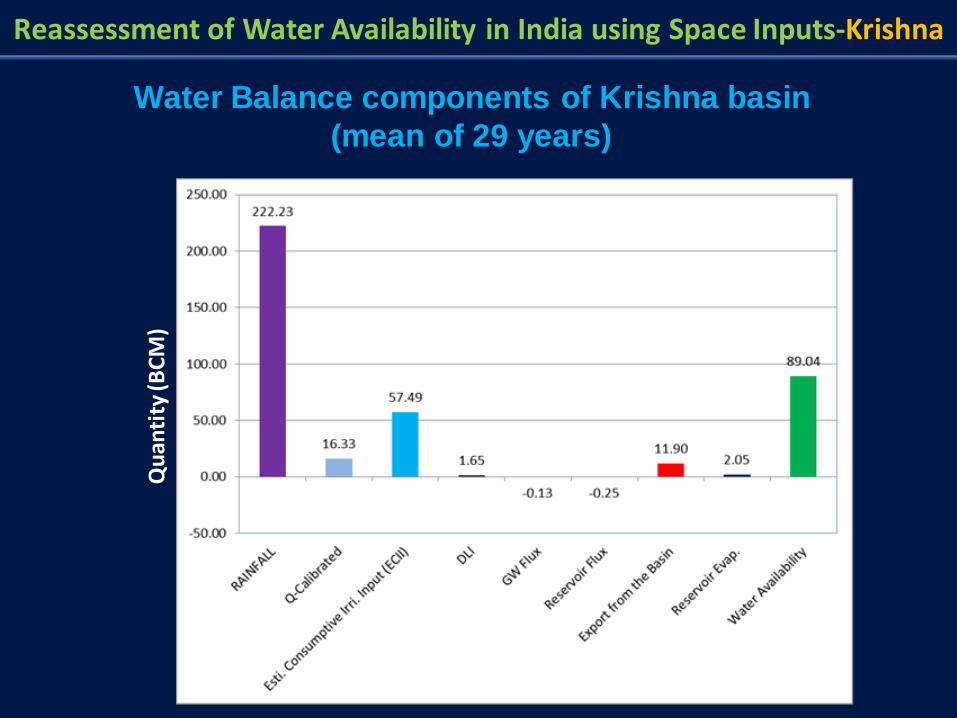
Reassessment of Water Availability in India using Space Inputs-Krishna
Water Balance components of Krishna basin
(mean of 29 years) Q
uan
tity
(BC
M)
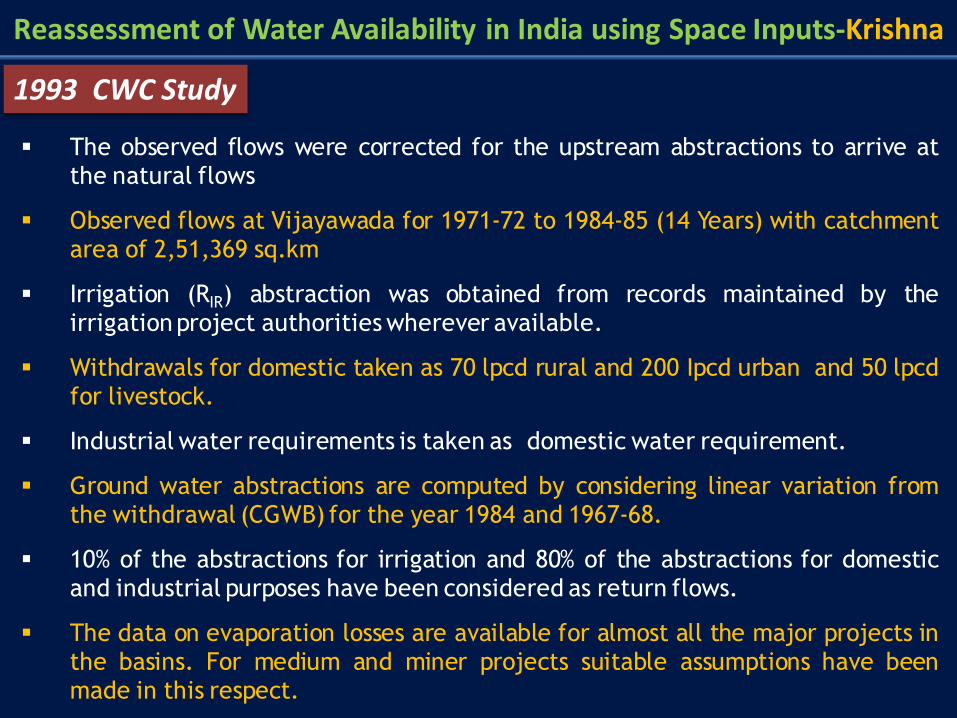
Reassessment of Water Availability in India using Space Inputs-Krishna
The observed flows were corrected for the upstream abstractions to arrive at the natural flows
Observed flows at Vijayawada for 1971-72 to 1984-85 (14 Years) with catchment area of 2,51,369 sq.km
Irrigation (RIR) abstraction was obtained from records maintained by the irrigation project authorities wherever available.
Withdrawals for domestic taken as 70 lpcd rural and 200 Ipcd urban and 50 lpcd for livestock.
Industrial water requirements is taken as domestic water requirement.
Ground water abstractions are computed by considering linear variation from the withdrawal (CGWB) for the year 1984 and 1967-68.
10% of the abstractions for irrigation and 80% of the abstractions for domestic and industrial purposes have been considered as return flows.
The data on evaporation losses are available for almost all the major projects in the basins. For medium and miner projects suitable assumptions have been made in this respect.
1993 CWC Study
Reassessment of Water Availability in India using Space Inputs-Krishna Q
uan
tity
(BC
M)
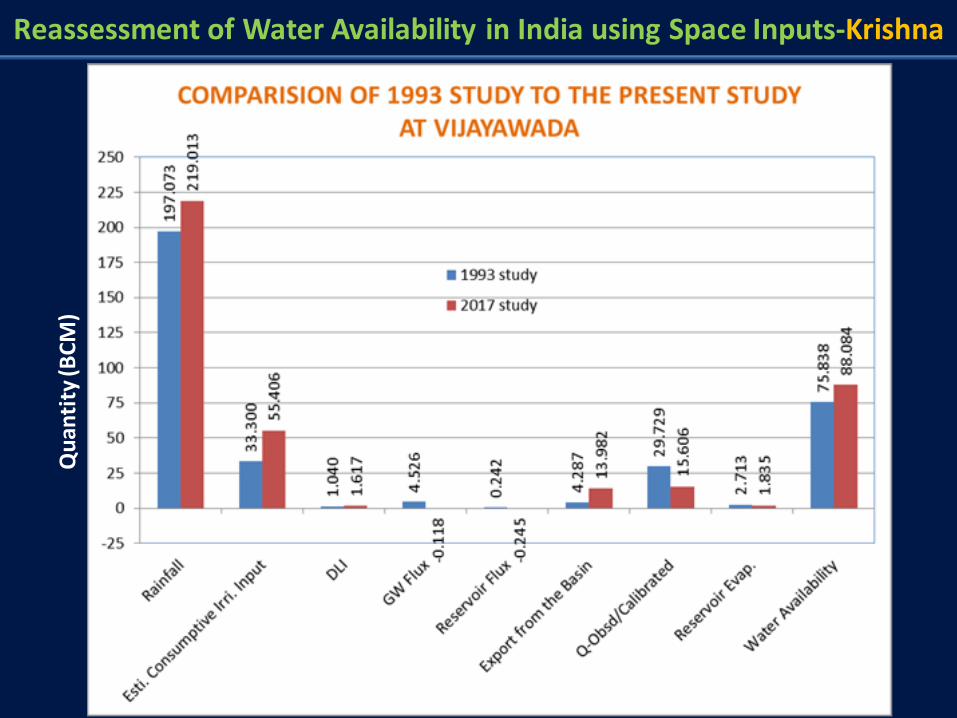
Reassessment of Water Availability in India using Space Inputs-Krishna
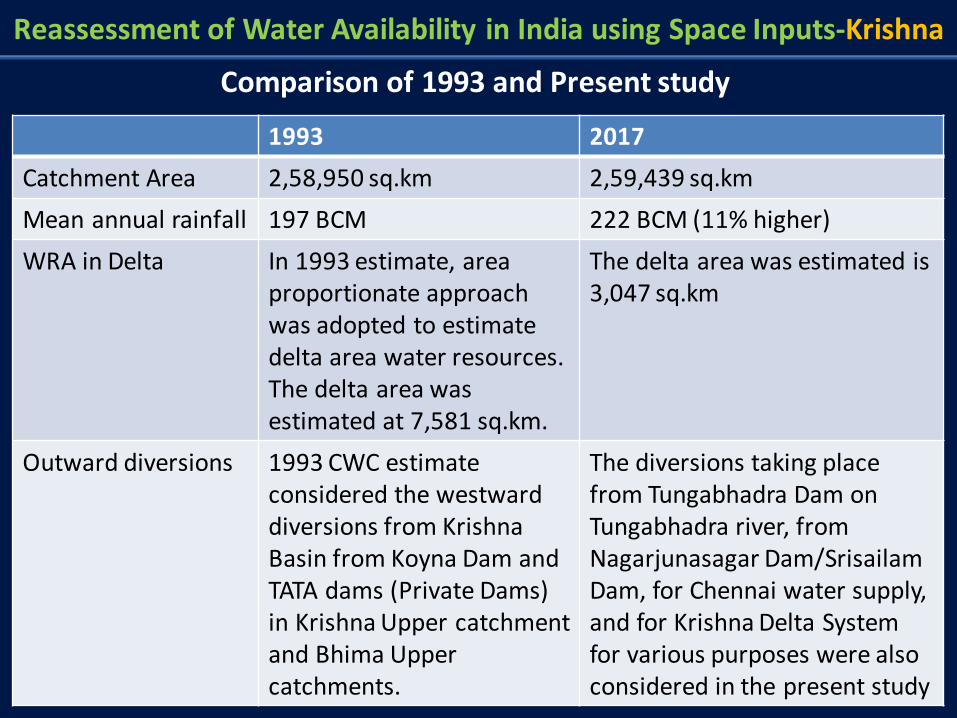
1993 2017
Catchment Area 2,58,950 sq.km 2,59,439 sq.km
Mean annual rainfall 197 BCM 222 BCM (11% higher)
WRA in Delta In 1993 estimate, area proportionate approach was adopted to estimate delta area water resources. The delta area was estimated at 7,581 sq.km.
The delta area was estimated is 3,047 sq.km
Outward diversions 1993 CWC estimate considered the westward diversions from Krishna Basin from Koyna Dam and TATA dams (Private Dams) in Krishna Upper catchment and Bhima Upper catchments.
The diversions taking place from Tungabhadra Dam on Tungabhadra river, from Nagarjunasagar Dam/Srisailam Dam, for Chennai water supply, and for Krishna Delta System for various purposes were also considered in the present study
Comparison of 1993 and Present study
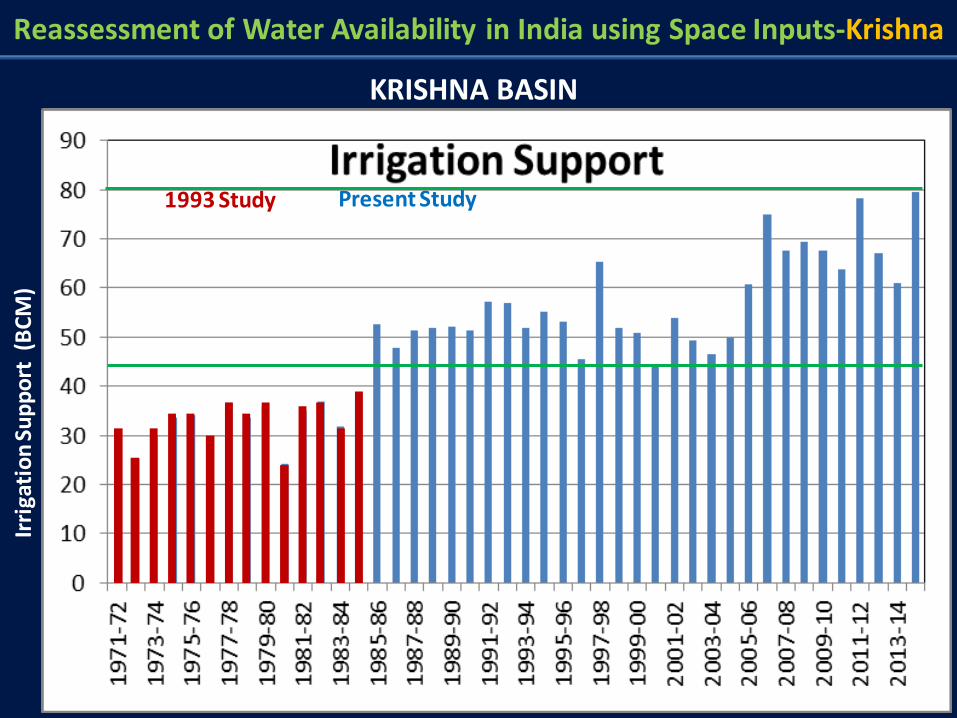
Irri
gati
on
Su
pp
ort
(B
CM
)
KRISHNA BASIN
1993 Study Present Study
Reassessment of Water Availability in India using Space Inputs-Krishna
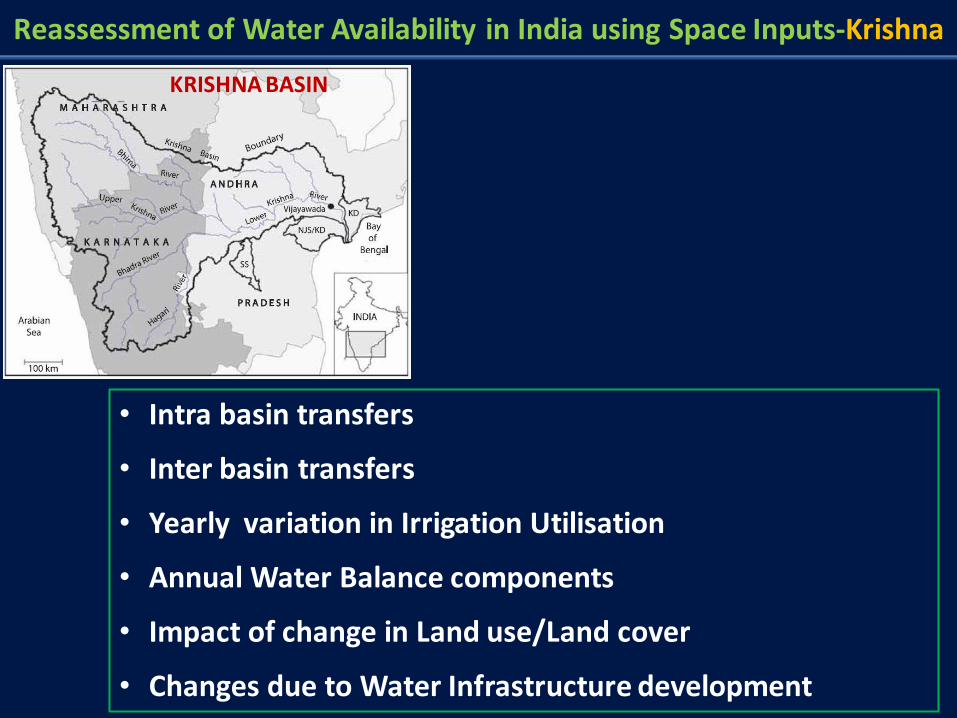
KRISHNA BASIN
• Intra basin transfers
• Inter basin transfers
• Yearly variation in Irrigation Utilisation
• Annual Water Balance components
• Impact of change in Land use/Land cover
• Changes due to Water Infrastructure development
Reassessment of Water Availability in India using Space Inputs-Krishna
Reassessment of Water Availability in India using Space Inputs
12. Narmada 13. Tapi 14. WFR- Tapi to Tadri
15. WFR – Tadri to Kanyakumari 16. EFR – Mahanadi & Pennar
17. EFR – Pennar & Kanyakumari 18. WFR – Kutch & Saurashtra
including Luni 19. Area of inland drainage in
Rajasthan desert 20. Minor Rivers draining into
Myanmar and Bangladesh
1
1. Indus 2a. Ganga
2b. Brahmaputra 2c. Barak & others
3. Godavari 4. Krishna
5. Cauvery 6. Subarnarekha
7. Brahmani-Baitarani 8. Mahanadi
9. Pennar 10. Mahi
11. Sabarmati
3
2a 2b
2c
4
5
6 7 8
9
11 10 12
13 14
15
16
17
18
19
20
45.5 _ _ _ _ ___ ____ ____ ____ ___
73.3
14.9 _ _ _ _ ___ ____ ____ __
11.0
527.3 _ _ _ _ ___ ____ ____ ____ ____
537.2
117.7 _ _ _ _ ___ ____ ____ ____ ____ __
110.5
89.0 _ _ _ _ ___ ____ ____ ____ ___
78.1
2017 _ _ _ _ ___ ____ ____ ____ ____ __
1993 All units in ‘BCM”
27.6 _ _ _ _ ___ ____ ____ ____ ___
21.3
15.0 _ _ _ _ ___ ____ ____ ____ __
12.3 35.6 _ _ _ _ ___ ____ ____ ____ __
28.4 73.0 _ _ _ _ ___ ____ ____ ____ ____
66.8
11.0 _ _ _ _ ___ ____ ____ ___
6.3
509.5 _ _ _ _ ___ ____ ____ ____ ____ _
525.0 12.9 _ _ _ _ ___ ____ ____ ___
3.8 26.9 _ _ _ _ ___ ____ ____ ____ ___
15.0
0.0 _ _ _ _ ___ ____ ____
0.0
58.2 _ _ _ _ ___ ____ ____ ____ __
45.6
26.2 _ _ _ _ ___ ____ ____ ____ ____
14.8
118.5 _ _ _ _ ___ ____ ____ ____ ____ __
87.4
119.0 _ _ _ _ ___ ____ ____ ____ ____ __
113.5
26.7 _ _ _ _ ___ ____ ____ ____ ___
16.4
26.4 _ _ _ _ ___ ____ ____ ____ _
22.5
86.6 _ _ _ _ ___ ____ ____ ____ ___
48.3
31.1 _ _ _ _ ___ ____ ____ ____ ___
31.0
Total – 1999.2
1869 _____
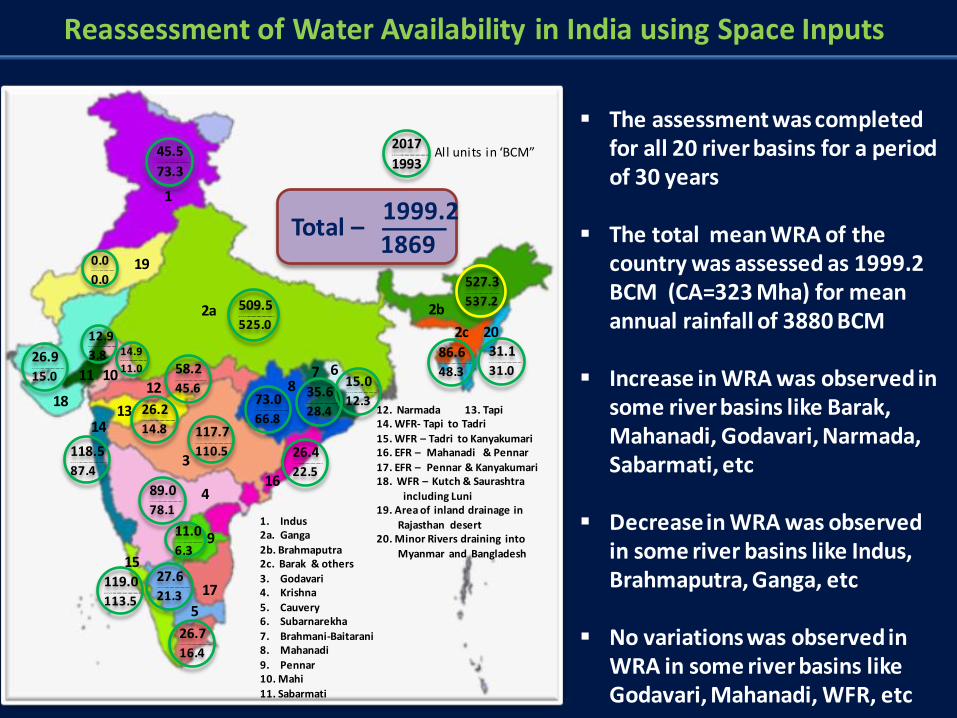
The assessment was completed for all 20 river basins for a period of 30 years
The total mean WRA of the country was assessed as 1999.2 BCM (CA=323 Mha) for mean annual rainfall of 3880 BCM
Increase in WRA was observed in some river basins like Barak, Mahanadi, Godavari, Narmada, Sabarmati, etc
Decrease in WRA was observed in some river basins like Indus, Brahmaputra, Ganga, etc
No variations was observed in WRA in some river basins like Godavari, Mahanadi, WFR, etc
Reassessment of Water Availability in India using Space Inputs
Reassessment of Water Availability in India using Space Inputs
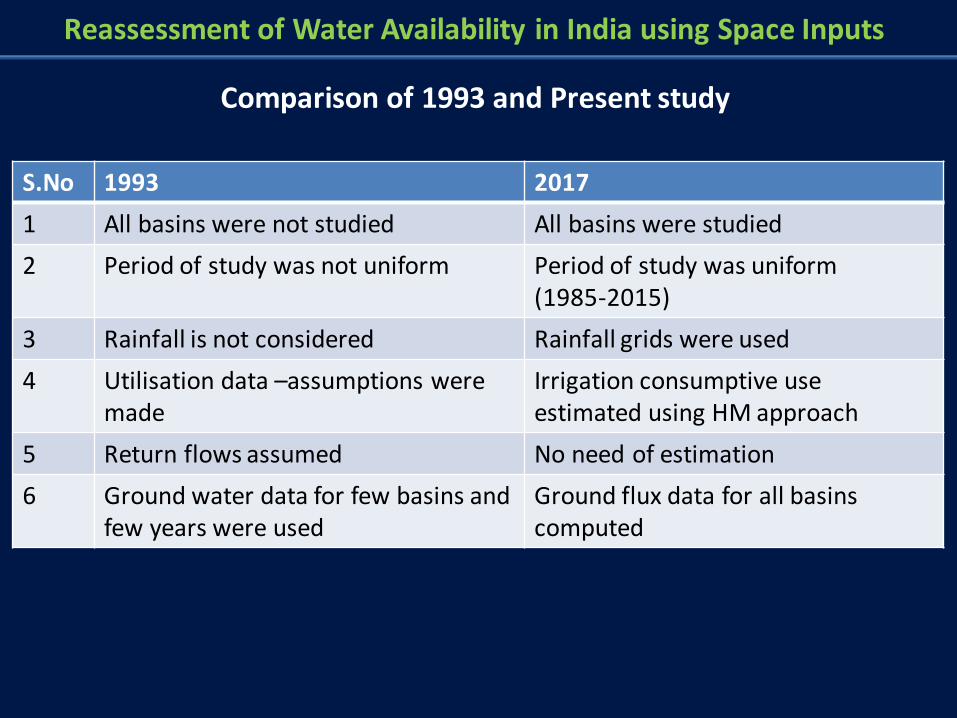
S.No 1993 2017
1 All basins were not studied All basins were studied
2 Period of study was not uniform Period of study was uniform (1985-2015)
3 Rainfall is not considered Rainfall grids were used
4 Utilisation data –assumptions were made
Irrigation consumptive use estimated using HM approach
5 Return flows assumed No need of estimation
6 Ground water data for few basins and few years were used
Ground flux data for all basins computed
Comparison of 1993 and Present study
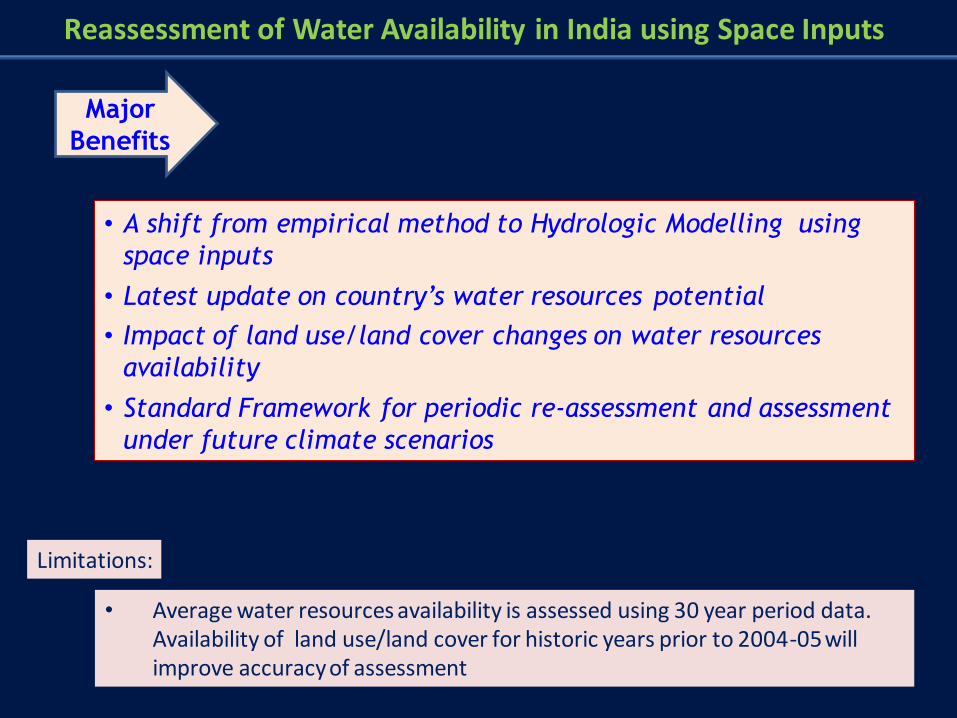
Reassessment of Water Availability in India using Space Inputs
• A shift from empirical method to Hydrologic Modelling using
space inputs
• Latest update on country’s water resources potential
• Impact of land use/land cover changes on water resources
availability
• Standard Framework for periodic re-assessment and assessment
under future climate scenarios
Major
Benefits
Limitations:
• Average water resources availability is assessed using 30 year period data. Availability of land use/land cover for historic years prior to 2004-05 will improve accuracy of assessment