![Handbook of Instrumental Techniques for Analytical CHemistry - Fran a.settle[1]](https://static.fdocuments.us/doc/165x107/55cf99c4550346d0339f0de1/handbook-of-instrumental-techniques-for-analytical-chemistry-fran-asettle1.jpg)
Handbook of Instrumental Techniques for Analytical CHemistry - Fran a.settle[1]
date post
19-Dec-2015Category
view
213download
0
Basic Questions Regarding All Analytical & Instrumental Methods (p 17-18)
What accuracy and precision are required?
How much sample do I have available, and how much money do we have available for the analysis?
What concentration is the analyte present at and can we pre-concentrate or dilute the sample?
What interferences might be present and can we eliminate or mask them?
What are the properties of the sample matrix?
How much time do I have?

NUMERICAL CRITERIA FOR COMPARING ANALYTICAL METHODS
1) Precision (StdDev, RSD, etc)
2) Bias (systematic error)
3) Sensitivity (DL, LOD, MDL, etc)
4) Detection Limit (blank + 3 x StdDev of blank)
5) Dynamic Range (LOQ LOL: linearity)
6) Selectivity (coefficient of selectivity)
Table 1-3 p 19

EVERY ANALYSIS YOU PERFORM WITH AN EVERY ANALYSIS YOU PERFORM WITH AN INSTRUMENT WILL BE A COMPETITION:INSTRUMENT WILL BE A COMPETITION:
THE COMPETITION BETWEEN THE COMPETITION BETWEEN SIGNALSIGNAL AND AND SELECTIVITYSELECTIVITY!!
There is no way to maximize both. You have to choose some There is no way to maximize both. You have to choose some happy medium,happy medium, where you get enough signal to detect the where you get enough signal to detect the analyte, but can also be selective enough so that you are analyte, but can also be selective enough so that you are certain of what you are detecting.certain of what you are detecting.
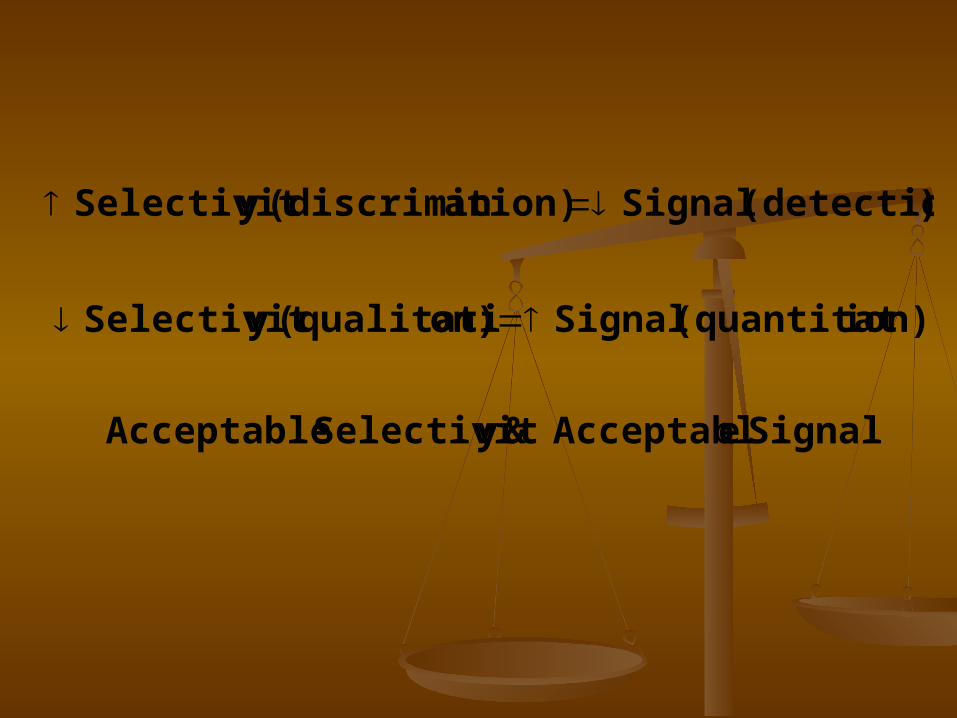
Signal e Acceptabl& ySelectivit Acceptable
ion)(quantitat Signal on)(qualitati ySelectivit
)(detection Signal ation)(discrimin ySelectivit

CALIBRATION OF INSTRUMENTAL METHODSCALIBRATION OF INSTRUMENTAL METHODS
Calibration CurveCalibration Curve
Standard Addition MethodStandard Addition Method
Internal Standard MethodInternal Standard Method

Calibration CurveCalibration Curve
Known concentrations of analyte standards are Known concentrations of analyte standards are prepared and measured over suspected range of prepared and measured over suspected range of analyteanalyte
Blank is subtracted manually or auto by instrumentBlank is subtracted manually or auto by instrument
Graph: Corrected signal vs. concentration of standardsGraph: Corrected signal vs. concentration of standards
Least-squares line fit to generate equationLeast-squares line fit to generate equation
e.g., spectrophotometric protein analysise.g., spectrophotometric protein analysis

CALIBRATION OF INSTRUMENTAL METHODSCALIBRATION OF INSTRUMENTAL METHODS
Calibration CurveCalibration Curve
Standard Addition MethodStandard Addition Method
Internal Standard MethodInternal Standard Method
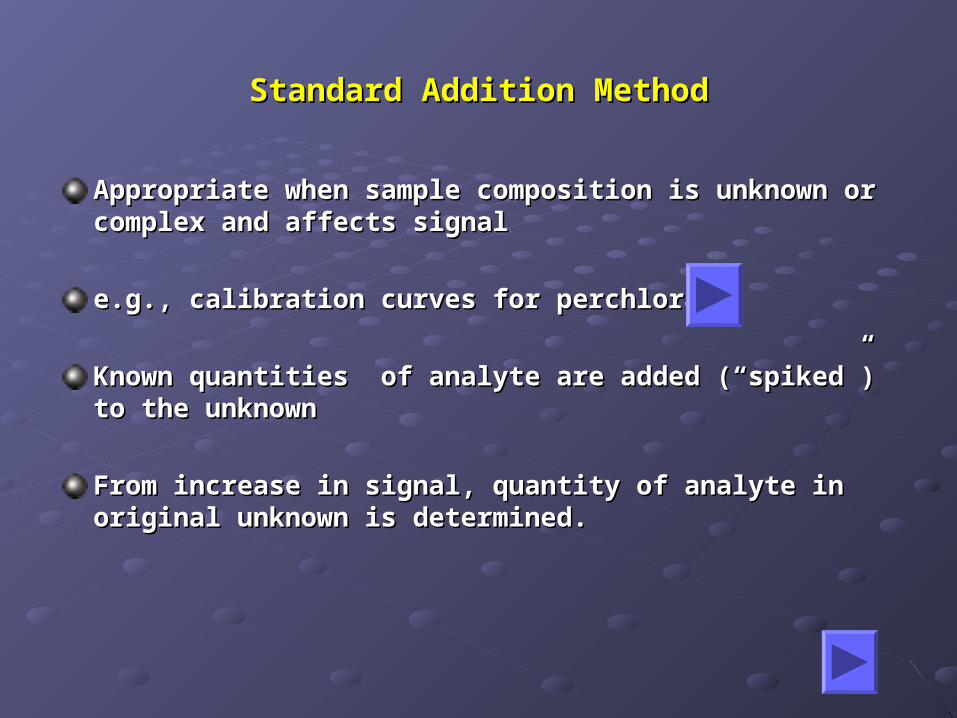
Standard Addition MethodStandard Addition Method
Appropriate when sample composition is unknown or Appropriate when sample composition is unknown or complex and affects signalcomplex and affects signal
e.g., calibration curves for perchlorate e.g., calibration curves for perchlorate
Known quantities of analyte are added (“spiked”) to Known quantities of analyte are added (“spiked”) to the unknownthe unknown
From increase in signal, quantity of analyte in From increase in signal, quantity of analyte in original unknown is determined. original unknown is determined.


Fig 1-10

CALIBRATION OF INSTRUMENTAL METHODSCALIBRATION OF INSTRUMENTAL METHODS
Calibration CurveCalibration Curve
Standard Addition MethodStandard Addition Method
Internal Standard MethodInternal Standard Method

Internal Standard MethodInternal Standard Method
A standard A standard differentdifferent from analyte is added in from analyte is added in constant amount to all samples, blanks, and constant amount to all samples, blanks, and standardsstandards
Useful when quantity of samples varies from run to Useful when quantity of samples varies from run to runrun
Calibration plot:Calibration plot:
e.g., Li used as internal standard for determination e.g., Li used as internal standard for determination of Na or K in blood serum by ion chromatographyof Na or K in blood serum by ion chromatography
vs.vs.is
Sx
S
stdsC

Ion chromatographic separation of
unknown (X) and internal standard (S)
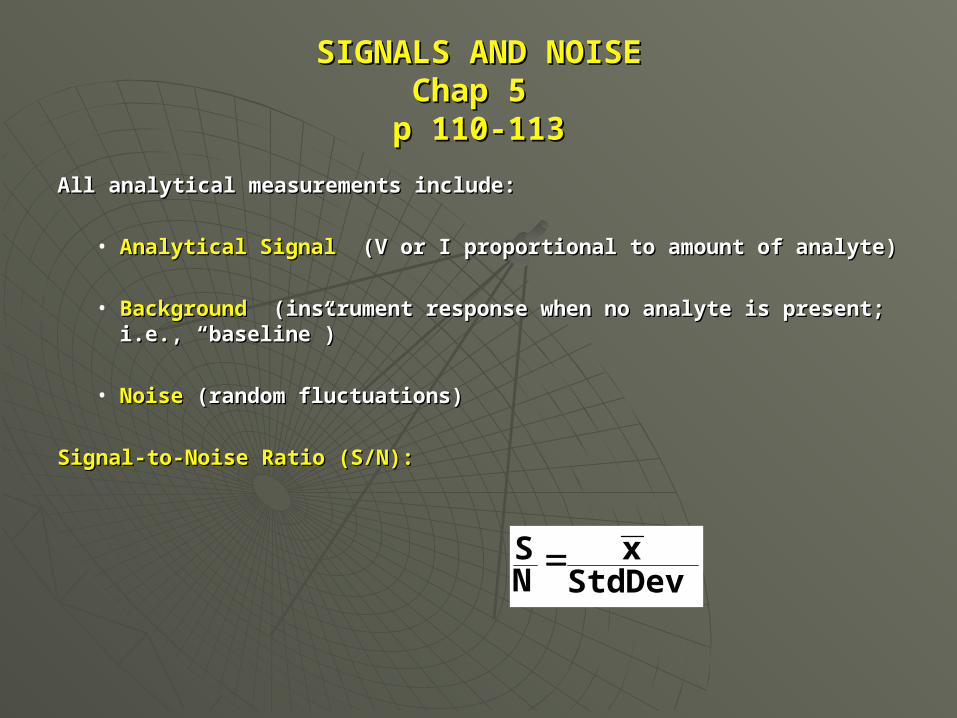
SIGNALS AND NOISESIGNALS AND NOISEChap 5 Chap 5
p 110-113p 110-113
All analytical measurements include:All analytical measurements include:
• Analytical SignalAnalytical Signal (V or I proportional to amount of analyte) (V or I proportional to amount of analyte)
• Background Background (instrument response when no analyte is (instrument response when no analyte is present; i.e., “baseline”)present; i.e., “baseline”)
• NoiseNoise (random fluctuations) (random fluctuations)
Signal-to-Noise Ratio (S/N):Signal-to-Noise Ratio (S/N):
StdDevx
NS

SOURCES OF NOISESOURCES OF NOISE
Chemical NoiseChemical Noise: (fluctuations in T, P, humidity, light, etc): (fluctuations in T, P, humidity, light, etc)
Instrumental NoiseInstrumental Noise: (from all instrumental components): (from all instrumental components)
• ThermalThermal (heated components, i.e., resistors and conductors) (heated components, i.e., resistors and conductors)
• Shot Shot (non-homogeneous current flow) (non-homogeneous current flow)
• FlickerFlicker (1/f dependent; results in “drift”) (1/f dependent; results in “drift”)
• EnvironmentalEnvironmental (stray light, 60 Hz, EMI, RF, vibrations, etc) (stray light, 60 Hz, EMI, RF, vibrations, etc)


![Handbook of Instrumental Techniques for Analytical CHemistry - Fran a[1].Settle](https://static.fdocuments.us/doc/165x107/553343414a795994618b47cf/handbook-of-instrumental-techniques-for-analytical-chemistry-fran-a1settle.jpg)