Basic Physics Of Transoesophageal Echocardiography For The Workshop2
80
Department of Anaesthesiology, Narayana Hrudayalaya Physics of Echocardiography Dr. Anil Kumar H.R Junior Consultant Department of Anaesthesiology Narayana Hrudayalaya
-
Upload
aniyahr -
Category
Health & Medicine
-
view
6.314 -
download
2
Transcript of Basic Physics Of Transoesophageal Echocardiography For The Workshop2

Department of Anaesthesiology, Narayana Hrudayalaya
Physics of Echocardiography
Dr. Anil Kumar H.RJunior Consultant
Department of Anaesthesiology Narayana Hrudayalaya

Department of Anaesthesiology, Narayana Hrudayalaya
History of Ultrasound Imaging▫ 1760 - Abbe Lazzaro Spallanzani – Father of ultrasound▫ 1912 - First practical application for rather unsuccessful
search for Titanic▫ 1942 - First used as diagnostic tool for localizing brain tumors
by Karl Dussik▫ 1953 - First reflected Ultrasound to examine the heart, the
beginning of clinical echocardiography – Dr.Helmut Hertz , a Swedish Engineer and Dr. Inge Edler a cardiologist
▫ 1970s - Origin of TEE ,Lee Frazin, a cardiologist from Chicago mounts M-mode probe on a Transoesophageal probe.
•

Department of Anaesthesiology, Narayana Hrudayalaya
I will be discussing about..
Ultrasound and its propertiesInteractions of ultrasound with tissuesInstrumentation and Image formation by ultrasoundDoppler effect and its applications

Department of Anaesthesiology, Narayana Hrudayalaya
Sound Mechanical vibration transmitted through an elastic mediumPressure waves when propagate thro’ air at appropriate frequency produce sensation of hearing
Surface Vibration Pressure Wave Ear
Vibration Propagation Perception

Department of Anaesthesiology, Narayana Hrudayalaya
As sound propagates through a medium the particles of the medium vibrate
Air at equilibrium, in the absence of a sound wave
Compressions and rarefactions that constitute a sound wave

Department of Anaesthesiology, Narayana Hrudayalaya
Compressions and rarefactions which constitute the sound wave can be represented as “Sine wave”
Amplitude - maximal compression of particles above the baseline
Wavelength - distance between the two nearest points of equal pressure and density

Department of Anaesthesiology, Narayana Hrudayalaya
Frequency – No. of wavelenghths per unit time 1 cycle/ sec = 1 Hz
So, Frequency is inversely related to wavelength
Velocity – Speed at which waves propagate through a medium
Dependent on physical properties of the medium through which it travels Directly proportional to stiffness of the materialInversely proportional to density till a physiological limit
Velocity = frequency * Wavelength

Department of Anaesthesiology, Narayana Hrudayalaya
Sound velocity in different materials
Material Velocity ( m/s)
Air 330
Water 1497
Metal 3000 - 6000
Fat 1440
Blood 1570
Soft tissue 1540

Department of Anaesthesiology, Narayana Hrudayalaya
ULTRASOUND
Ultrasound is sound with a frequency over 20,000 Hz, which is the upper limit of human hearing.The basic principles and properties are same as that of audible sound
Frequencies used for diagnostic ultrasound are between 1 to 20 MHz

Department of Anaesthesiology, Narayana Hrudayalaya
Interaction of ultrasound wave with tissues
1. Attenuation2. Reflection 3. Scattering 4. Absorption

Department of Anaesthesiology, Narayana Hrudayalaya
Attenuation
Loss of intensity and amplitude of ultrasound wave as it travels through the tissues
Due to reflection, scattering and absorption Proportional to Frequency and the distance the wave
front travels – Higher frequency , more attenuation Longer the distance (Depth), more the attenuation
And also on the type of tissue through which the beam has to pass
Expressed as “Half – power distance” For most of soft tissues it is 0.5 – 1.0 dB/cm/MHz

Department of Anaesthesiology, Narayana Hrudayalaya
Reflection
Basis of all ultrasound imagingFrom relatively large, regularly shaped objects with smooth surfaces and lateral dimensions greater than one wavelength – Specular Echoes These echoes are relatively intense and angle dependent. From endocardial and epicardial surfaces, valves and pericardiumAmount of ultrasound beam that is reflected depends on the difference in Acoustic impedance between the mediums

Department of Anaesthesiology, Narayana Hrudayalaya
The resistance that a material offers to the passage of sound wave Velocity of propagation “v” varies between different tissues
Tissues also have differing densities “ρ”Acoustic impedance
“Z = ρv” Soft tissue / bone and soft tissue / air interfaces have large “Acoustic Impedance mismatch”
Acoustic Impedance

Department of Anaesthesiology, Narayana Hrudayalaya
Scattering
Type of reflection that occurs when ultrasound wave strikes smaller(less than one wavelength) , irregularly shaped objects - Rayleigh Scatterers ( e.g.. RBCs)Are less angle dependant and less intense. Weaker than Specular echoesResult in “Speckle” that produces the texture within the tissues

Department of Anaesthesiology, Narayana Hrudayalaya

Department of Anaesthesiology, Narayana Hrudayalaya
How is ultrasound imaging done?
“From sound to image”

Department of Anaesthesiology, Narayana Hrudayalaya
Pierre Curie (1859-1906),Nobel Prize in Physics, 1903
Jacques Curie (1856-1941)
PIEZOELECTRIC EFFECT

Department of Anaesthesiology, Narayana Hrudayalaya
Crystals of tourmaline, quartz, topaz, cane sugar, and Rochelle salt have the ability to generate an electric charge in response to applied mechanical stress
“Piezoelectricity" after the Greek word Piezein, which means to squeeze or press.
“Converse” of this effect is also true

Department of Anaesthesiology, Narayana Hrudayalaya
Construction of a Transducer
Backing Material
Electrodes
Piezoelectric crystal

Department of Anaesthesiology, Narayana Hrudayalaya
Electronic Phased Array which uses the principle of Electronic Delay
Phased Array Transducers

Department of Anaesthesiology, Narayana Hrudayalaya
Electronic Focusing
Electronic beam steering
Department of Anaesthesiology, Narayana Hrudayalaya
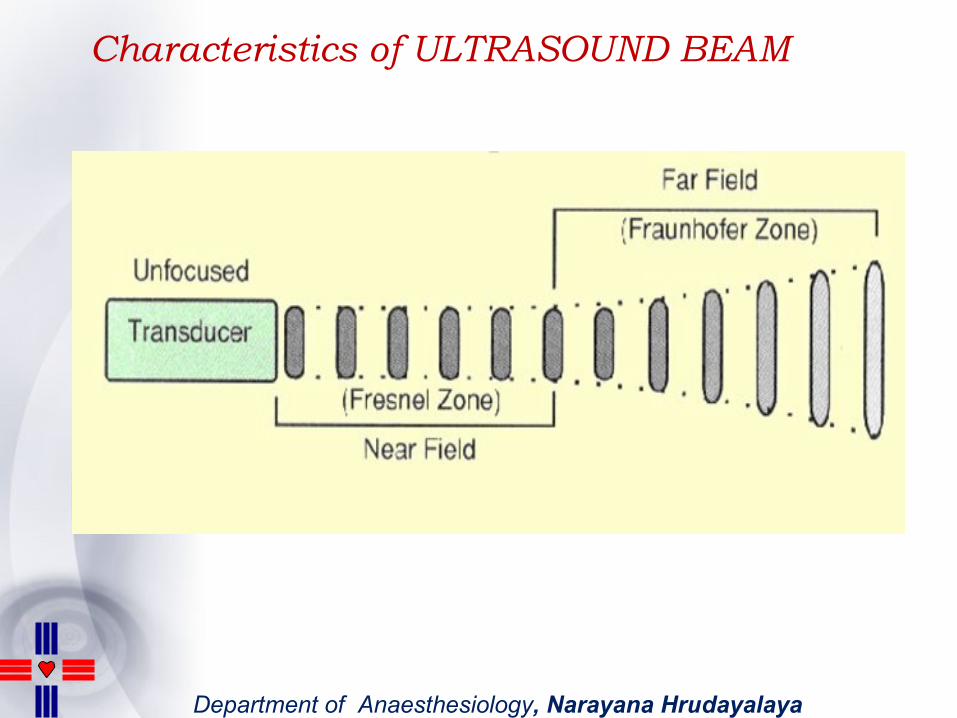
Characteristics of ULTRASOUND BEAM

Department of Anaesthesiology, Narayana Hrudayalaya
Length of near field = ( radius)2 / wavelength of emitted ultrasound

Department of Anaesthesiology, Narayana Hrudayalaya
2. Piezoelectric crystal3. High frequency electrical signal with continuously
changing polarity 4. Crystal resonates with high frequency 5. Producing ULTRASOUND 6. Directed towards the area to be imaged 7. Crystal “listens” for the returning echoes for a
given period of time 8. Reflected waves converted to electric signals by the
crystal9. processed and displayed

Department of Anaesthesiology, Narayana Hrudayalaya
Schematic representation of the recording and display of the 2-D image

Department of Anaesthesiology, Narayana Hrudayalaya
Our TEE Work Station..

Department of Anaesthesiology, Narayana Hrudayalaya
Resolution
Ability to distinguish two points in spaceTwo components –
Spatial – Smallest distance that two targets can be seperated for the system to distinguish between them.
Two components – Axial and Lateral
Temporal

Department of Anaesthesiology, Narayana Hrudayalaya
• Axial Resolution ▫ The minimum separation
between structures the ultrasound beam can distinguish parallel to its path.
▫ Determinants:▫ Wavelength – smaller the
better▫ Pulse length – shorter the
train of cycles greater the resolution

Department of Anaesthesiology, Narayana Hrudayalaya
• Lateral Resolution▫ Minimum separation between
structures the ultrasound beam can distinguish in a plane perpendicular to its path.
▫ Determinants: ▫ Depends on beam width –
smaller the better ▫ Depth ▫ Gain

Department of Anaesthesiology, Narayana Hrudayalaya
Temporal resolution
Ability of system to accurately track moving targets over timeAnything that requires more time will decrease temporal resolutionDeterminants:
DepthSweep angleLine densityPRF

Department of Anaesthesiology, Narayana Hrudayalaya
The Trade off ..

Department of Anaesthesiology, Narayana Hrudayalaya
To visualise smaller objects shorter wavelengths should be used which can be obtained by increasing frequency of U/S wave.Drawbacks of high frequency –
More scatter by insignificant inhomogeneityMore attenuation Limited depth of penetration
For visualising deeper objects lower frequency is useful, but will be at the cost of poor resolution
So..

Department of Anaesthesiology, Narayana Hrudayalaya
The reflected signal can be displayed in four modes..
A- modeB- mode M- mode2-Dimensional

Department of Anaesthesiology, Narayana Hrudayalaya
A –mode shows the
Amplitude of reflected energy at
certain depth
B- Brightness mode shows the energy as the brightness
of the point
M- Motion mode the reflector is moving so if the
depth is shown in a time plot, the
motion will be seen as a curve
A
B
C

Department of Anaesthesiology, Narayana Hrudayalaya
M- mode
• Timed Motion display ; B – Mode with time reference
• A diagram that shows how the positions of the structures along the path of the beam change during the course of the cardiac cycle
• Strength of the returning echoes vertically and temporal variation horizontally

Department of Anaesthesiology, Narayana Hrudayalaya
M – Mode uses..
Great temporal resolution- Updated 1000/sec. Useful for precise timing of events with in a cardiac cycleAlong with color flow Doppler – for the timing of abnormal flows Quantitative measurements of size , distance & velocity possible with out sophisticated analyzing stations

Department of Anaesthesiology, Narayana Hrudayalaya
M-mode beam through Mitral Valve
M-Mode Imaging

Department of Anaesthesiology, Narayana Hrudayalaya
2 – D MODE
Provides more structural and functional informationRapid repetitive scanning along many different radii with in an area in the shape of a fan2-D image is built up by firing a beam , waiting for the return echoes, maintaining the information and then firing a new line from a neighboring transducer along a neighboring line in a sequence of B-mode lines.

Department of Anaesthesiology, Narayana Hrudayalaya
2-D imaging by steering the transducer over an area that needs to be imaged

Department of Anaesthesiology, Narayana Hrudayalaya
Mechanical Steering of the Transducer

Department of Anaesthesiology, Narayana Hrudayalaya
Electronic Phased Array Transducers for 2-D imaging
Linear Array Curvilinear Array

Department of Anaesthesiology, Narayana Hrudayalaya
A single ‘FRAME’ being formed from one full sweep of beams
A ‘CINE LOOP’ from multiple FRAMES

Department of Anaesthesiology, Narayana Hrudayalaya
Resembles an anatomic section – easy to interpret2-D imaging provides information about the spatial relationships of different parts of the heart to each other.Updated 30- 60 times/sec ; lesser temporal resolution compared to M-mode

Department of Anaesthesiology, Narayana Hrudayalaya
Study of blood flow dynamics
Detects the direction and velocity of moving blood within the heart.
Doppler Study

Department of Anaesthesiology, Narayana Hrudayalaya
Comparison between 2-D and Doppler
2-D Doppler
Ultrasound target
Tissue Blood
Goal of diagnosis
Anatomy Physiology
Type of information
Structural Functional
So, both are complementary to each other

Department of Anaesthesiology, Narayana Hrudayalaya
Christian Andreas Doppler (1803 – 1853)
DOPPLER EFFECT

Department of Anaesthesiology, Narayana Hrudayalaya
DOPPLER EFFECT- Certain properties of light emitted from stars depend upon
the relative motion of the observer and the wave source.
Colored appearance of some stars as due to their motion relative to the earth, the blue ones moving toward earth and the red ones moving away.

Department of Anaesthesiology, Narayana Hrudayalaya
OBSERVER 2 Long wavelength Low frequency
OBSERVER 1Small wavelengthHigh frequency

Department of Anaesthesiology, Narayana Hrudayalaya
Doppler Frequency Shift - Higher returned frequency if RBCs are moving towards the and lower if the cells are moving away
Doppler principle as applied in Echo..

Department of Anaesthesiology, Narayana Hrudayalaya
The Doppler equation
Velocity is given by Doppler equation..
V = c fd / 2 fo cos V – target velocity C – speed of sound in tissue fd –frequency shift fo –frequency of emitted U/S
- angle between U/S beam & direction of target velocity( received beam , not the emitted)

Department of Anaesthesiology, Narayana Hrudayalaya
Doppler Equation

Department of Anaesthesiology, Narayana Hrudayalaya
Doppler blood flow velocities are
displayed as waveforms

Department of Anaesthesiology, Narayana Hrudayalaya
When flow is perpendicular to U/S beam angle of incidence will be 900/2700 ; cosine of which is 0 – no blood flow detected
Flow velocity measured most accurately when beam is either parallel or anti parallel to blood flow.
Diversion up to 200 can be tolerated( error of < or = to 6%)
Important consideration !

Department of Anaesthesiology, Narayana Hrudayalaya
“Twin Paradoxes of Doppler”
Best Doppler measurements are made when the Doppler probe is aligned parallel to the blood flow
High quality Doppler signals require low Doppler frequencies( < 2MHz)

Department of Anaesthesiology, Narayana Hrudayalaya
Importance of being parallel to flow when detecting flow through the aortic valve

Department of Anaesthesiology, Narayana Hrudayalaya
Velocity is directly proportional to frequency shift and for clinical use it is usual to discuss velocity rather than frequency shift ( although either is correct)
V fd / cos V = c fd / 2 fo cos V fd

Department of Anaesthesiology, Narayana Hrudayalaya
Applications of Doppler - Different modes to measure blood velocities
Continuous wavePulsed waveColour Flow Mapping

Department of Anaesthesiology, Narayana Hrudayalaya
Modern echo scanners combine Doppler capabilites
with 2D imaging capabilities
Imaging mode is switced off (sometimes with the image held in memory) while the Doppler modes are in operation

Department of Anaesthesiology, Narayana Hrudayalaya
CONTINUOUS WAVE DOPPLER Continuous generation of ultrasound waves coupled with
continuous ultrasound reception using a two crystal transducer

Department of Anaesthesiology, Narayana Hrudayalaya
CWD at LVOT in Deep TG Aortic Long axis view

Department of Anaesthesiology, Narayana Hrudayalaya
Can measure high velocity flows ( in excess of 7m/sec)Lack of selectivity or depth discrimination -Region where flow dynamics are being measured cannot be precisely localizedMost common use – Quantification of pressure drop across a stenosis by applying Bernoulli equation

Department of Anaesthesiology, Narayana Hrudayalaya
1/2 PV2 Pressure
Kinetic Energy
Potential Energy
P = 4V2
Bernoulli EquationBalancing Kinetic and Potential energy
This goes down..As this goes up..

Department of Anaesthesiology, Narayana Hrudayalaya
PULSED WAVE DOPPLER
Doppler interrogation at a particular depth rather than across entire line of U/S beam.Ultrasound pulses at specific frequency - Pulse Repetition Frequency (PRF) or Sampling rateRANGE GATED - The instrument only listens for a very brief and fixed time after the transmission of ultrasound pulseDepth of sampling by varied by varying the time delay for sampling

Department of Anaesthesiology, Narayana Hrudayalaya
Transducer alternately transmits and receives the ultrasound data to a sample volume. Also known as Range-gated Doppler.

Department of Anaesthesiology, Narayana Hrudayalaya
PWD at LVOT in Deep TG aortic long axis view

Department of Anaesthesiology, Narayana Hrudayalaya
PRF for a given transducer of a given frequency at a particular depth is fixed; But to measure higher velocities higher PRFs are necessary
Drawback – ambiguous information obtained when flow velocity is high velocities (above 1.5 to 2 m/sec)
This effect is called Aliasing

Department of Anaesthesiology, Narayana Hrudayalaya
ALIASING
Aliasing will occur if low pulse repetition frequencies or velocity scales are used and high velocities are encountered
Abnormal velocity of sample volume exceeds the rate at which the pulsed wave system can record it properly.
Blood velocities appear in the direction opposite to the conventional one

Department of Anaesthesiology, Narayana Hrudayalaya
Full spectral display of a high velocity profile fully recorded by CW Doppler
PW display is aliased, or cut off, and the top is placed at the bottom

Department of Anaesthesiology, Narayana Hrudayalaya
Aliasing occurs if the frequency of the sample volume is more than the Nyquist limit
Nyquist limit = PRF/2

Department of Anaesthesiology, Narayana Hrudayalaya
To avoid Aliasing - PRF = 2 ( Doppler shift frequency or Maximum velocity of Sample volume)
Can be achieved by – Decreasing the frequency of transducer, decrease the depth of interrogation by changing the view ( this increases the PRF)

Department of Anaesthesiology, Narayana Hrudayalaya
Color Flow Doppler
Displays flow data on 2-D Echocardiographic imageImparts more spatial information to Doppler data Displays real-time blood flow with in the heart as colors while showing 2D images in gray scaleAllows estimation of velocity, direction and pattern of blood flow

Department of Anaesthesiology, Narayana Hrudayalaya
Multigated, PW Doppler in which blood flow velocities are sampled at many locations along many lines covering the entire imaging sector

Department of Anaesthesiology, Narayana Hrudayalaya
Echo data is processed through two channels that ultimately combine the image with the color flow data in the final display.

Department of Anaesthesiology, Narayana Hrudayalaya
Color Flow Doppler..Flow toward transducer – red Flow away from transducer – blue Faster the velocity – more intense is the colour Flow velocity that changes by more than a preset value within a brief time interval (flow variance) – green / flame

Department of Anaesthesiology, Narayana Hrudayalaya
CFM v/s Angiography
CFM Angiography
Records velocity not flow; So in MR, CFM jet area consists of both atrial and ventricular blood – Billiard Ball Effect
Records flow
Larger regurgitant orifice area there will be smaller jet area
Larger regurgitant orifice area there will be larger jet area

Department of Anaesthesiology, Narayana Hrudayalaya
Instrumentation factors in Color Doppler Imaging
Eccentric jets appear smaller than equivalently sized central jets – Coanda EffectHigh pressure jet will appear larger than a low-pressure jet for the same amount of flowAs gain increases, jet appears largerAs ultrasound output power increases, jet area increasesLowering PRF makes the jet largerIncreasing the transducer frequency makes the jet appear larger

Department of Anaesthesiology, Narayana Hrudayalaya
To Summarise..
Knowledge of physics helps us appreciate “why we are seeing what we are seeing, And what we can do to see it better”
Echocardiography is based on the electrical conversion of reflected ultrasound waves from structures and blood flow within the cardiovascular system.

Department of Anaesthesiology, Narayana Hrudayalaya
To Summarise..
Good quality image is a compromise between resolution and depth of interrogation
Doppler study complements 2-D echo
Aligning Doppler beam parallel to direction of target velocity is key to obtaining accurate measurements.

Department of Anaesthesiology, Narayana Hrudayalaya

Department of Anaesthesiology, Narayana Hrudayalaya