Page 1 W4///cow." S s S. S 13 SYAWAL 1437'H s SUBUH 5.49 S ...

1
SYNOPSIS
Havells India is a billion-dollar-plus organization, and is one of the largest & India's fastest growing electrical and power distribution equipment manufacturer.
With expansion in product portfolio, strong distribution network and efficient acquisitions, Havells India would be multiplying its sales going forward.
Net Sales and PAT of the company are expected to grow at a CAGR of 15% and 9% over 2010 to 2013E respectively.
Havells and its brands have emerged as the preferred choice of electrical products for discerning individuals and industrial consumers both in India and abroad.
The company has acquired a number of International certifications, like CSA, KEMA, CB, CE, ASTA, CPA, SEMKO, SIRIUM (Malaysia), SPRING (Singapore), TSE (Turkey), SNI (Indonesia) and EDD (Bahrain) for various products.
The Company has posted a net profit of Rs. 575.00 million for the quarter ended June 30, 2011 as compared to Rs. 533.30 million for the quarter ended June 30, 2010.
Years Net sales EBITDA Net Profit EPS P/E
FY 11 28989.00 3550.20 2415.80 19.40 16.44
FY 12E 33337.35 3972.31 2683.66 21.51 14.83
FY 13E 37337.83 4374.21 2965.68 23.77 13.42
Stock Data:
Sector: Electrical Equipment
Face Value Rs. 5.00
52 wk. High/Low (Rs.) 451.25/290.10
Volume (2 wk. Avg.) 94000
BSE Code 517354
Market Cap (Rs in mn) 39804.82
Share Holding Pattern
1 Year Comparative Graph
HAVELLS INDIA BSE SENSEX
C.M.P: Rs.319.00 Target Price: Rs.360.00 Date: Aug 26th 2011 BUY
Havells India Ltd Result Update: Q1 FY 12

2
Peer Group Comparison
Name of the company CMP(Rs.) Market
Cap.(Rs.Mn.) EPS(Rs.) P/E(x) P/Bv(x) Dividend (%)
Havells India Ltd 319.00 39804.82 19.40 16.44 2.97 50.00
Crompton Greaves Ltd 136.45 87531.5 2.12 64.36 15.61 110.00
Finolex Cables Ltd 39.25 6002.9 5.49 7.15 0.84 35.00
Kirloskar Electric Co 32.10 1621.7 - - 0.89 0.00
Investment Highlights
Q1 FY12 Results Update
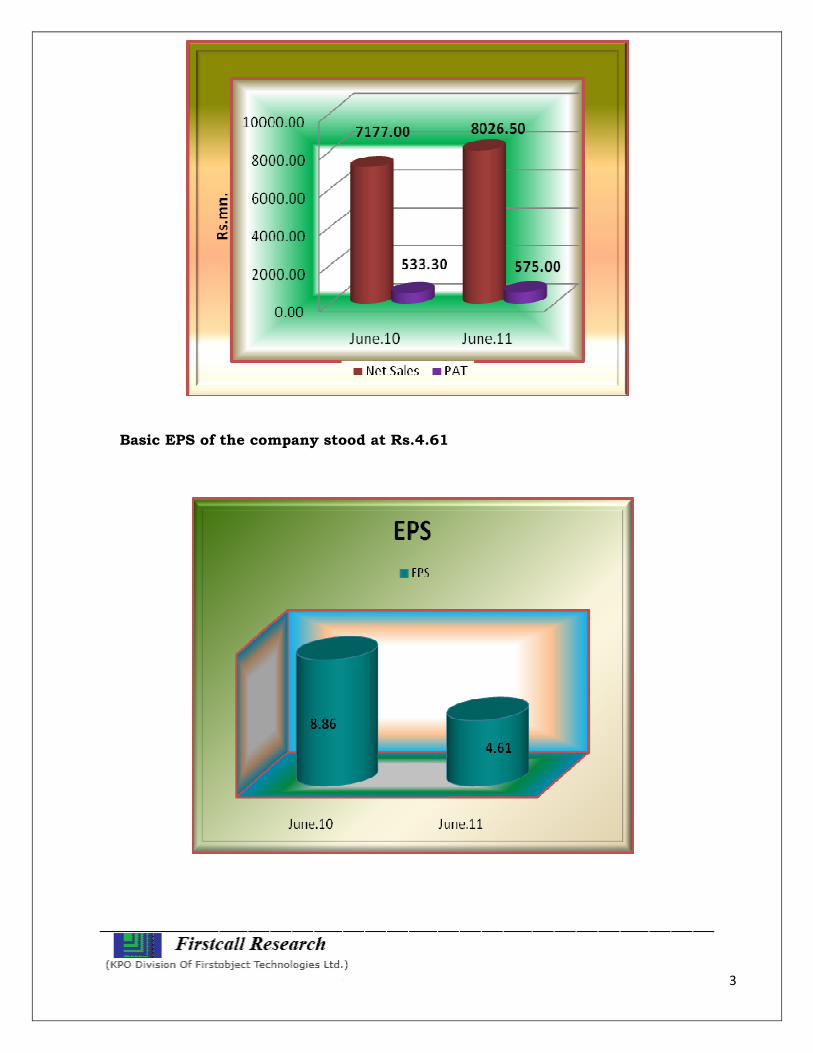
Havells India Ltd has posted net profit of Rs.575.00 million for the quarter ended
on June 30, 2011 as against Rs.533.30 million in the same quarter last year, an
increase of 8%. It has reported net sales of Rs.8026.50 million for the quarter
ended on June 30, 2011 as against Rs.7177.00 million in the same quarter last
year, a rise of 12%. Total income grew by 11.84% to Rs.8027.90 million from
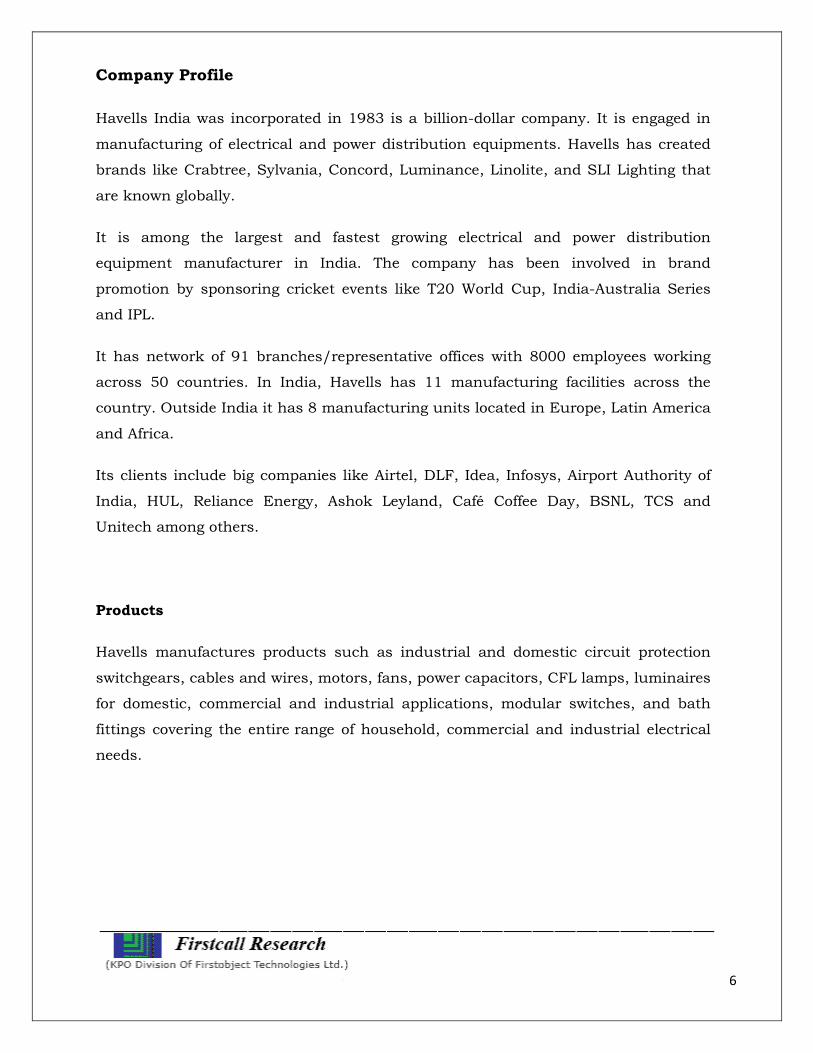
Rs.7177.90 million in the same quarter last year. During the quarter, EPS is
declined to Rs.4.61 due to equity capital increase.
Quarterly Results - Standalone (Rs in mn)
As At June-11 June-10 %change
Net sales 8026.50 7177.00 12
Net Profit 575.00 533.30 8
Basic EPS 4.61 8.86 (48)
3
Basic EPS of the company stood at Rs.4.61

4
Break up of Expenditure
Expenditure for the quarter stood at Rs.7142.40mn, which is around 12% higher
than the corresponding period of the previous year. Raw material cost of the
company for the quarter accounts for 59% of the sales of the company and stood
at Rs.4748.40mn from Rs.3975.70mn of the corresponding period of the previous
year. Other Expenditure cost increased 5%YoY to Rs.1982.4mn from
Rs.1891.50mn and accounts for 25% of the revenue of the company for the
quarter.
OPM and NPM for the quarter stood at 11% and 7% respectively from 11% and 7%
respectively of the same period of the last year.

5
FY11 Performance
Net profit of the company has increased at 7% yoy Rs.2420.50mn from
Rs.2271.00mn of same period of last year. Total revenue for the year stood at
Rs.28989.00 mn from Rs.24872.70 which is 17% increased than that of a year ago.
EPS for the year stood at Rs.19.40 per equity share of Rs.5.00 each.
Operating profit of the company stood at Rs.3550.20mn. OPM for the year stood at
12.25%. Expenditure of the company increased 17% YoY to Rs.25443.50 mn.
Interest expenses for the year stood at Rs.158.10mn.
Board recommended Dividend
Havells India Ltd has recommendation of Dividend @ Rs. 2.50 per equity share of
Rs. 5/- each i.e. 50% the financial year 2010-11.
6
Company Profile
Havells India was incorporated in 1983 is a billion-dollar company. It is engaged in
manufacturing of electrical and power distribution equipments. Havells has created
brands like Crabtree, Sylvania, Concord, Luminance, Linolite, and SLI Lighting that
are known globally.
It is among the largest and fastest growing electrical and power distribution
equipment manufacturer in India. The company has been involved in brand
promotion by sponsoring cricket events like T20 World Cup, India-Australia Series
and IPL.
It has network of 91 branches/representative offices with 8000 employees working
across 50 countries. In India, Havells has 11 manufacturing facilities across the
country. Outside India it has 8 manufacturing units located in Europe, Latin America
and Africa.
Its clients include big companies like Airtel, DLF, Idea, Infosys, Airport Authority of
India, HUL, Reliance Energy, Ashok Leyland, Café Coffee Day, BSNL, TCS and
Unitech among others.
Products
Havells manufactures products such as industrial and domestic circuit protection
switchgears, cables and wires, motors, fans, power capacitors, CFL lamps, luminaires
for domestic, commercial and industrial applications, modular switches, and bath
fittings covering the entire range of household, commercial and industrial electrical
needs.

7
Financial Results
12 Months Ended Profit & Loss Account (Standalone)
Value(Rs.in million) FY10A FY11A FY12E FY13E
12m 12m 12m 12m
Description
Net Sales 24872.70 28989.00 33337.35 37337.83
Other Income 8.90 4.70 5.17 5.69
Total Income 24881.60 28993.70 33342.52 37343.52
Expenditure -21684.00 -25443.50 -29370.21 -32969.31
Operating Profit 3197.60 3550.20 3972.31 4374.21
Interest -64.30 -158.10 -252.54 -265.17
Gross Profit 3133.30 3392.10 3719.77 4109.04
Depreciation -232.70 -293.40 -322.74 -355.01
Profit before Tax 2900.60 3098.70 3397.03 3754.03
Tax -629.60 -682.90 -713.38 -788.35
Profit after Tax 2271.00 2415.80 2683.66 2965.68
Extraordinary Items 0.00 4.70 0.00 0.00
Net profit 2271.00 2420.50 2683.66 2965.68
Equity Capital 300.80 623.90 623.90 623.90
Reserves 11040.00 12784.20 15467.86 18433.54
Face Value(Rs.) 5.00 5.00 5.00 5.00
EPS 37.75 19.40 21.51 23.77
*A=Actual, *E=Estimated

8
Quarterly Ended Profit & Loss Account (Standalone)
Value(Rs.in million) 30-Dec-10 30-Mar-11 30-Jun-11 30-Sep-11
3m(A) 3m(A) 3m(A) 3m(E)
Description
Net Sales 7278.70 8452.60 8026.50 7785.71
Other Income 1.40 1.00 1.40 1.47
Total Income 7280.10 8453.60 8027.90 7787.18
Expenditure -6365.00 -7464.60 -7142.40 -6843.63
Operating Profit 915.10 989.00 885.50 943.54
Interest -52.00 -55.20 -83.80 -59.80
Gross Profit 863.10 933.80 801.70 883.74
Depreciation -75.20 -76.10 -83.30 -88.30
Profit before Tax 787.90 857.70 718.40 795.44
Tax -176.70 -167.30 -143.40 -167.04
Profit after Tax 611.20 690.40 575.00 628.40
Equity Capital 623.90 623.90 623.90 623.90
Face Value(Rs.) 5.00 5.00 5.00 5.00
EPS 4.90 5.53 4.61 5.04
*A=Actual, *E=Estimated

9
Key Ratios
Particulars FY10 FY11 FY12E FY13E
EPS (Rs.) 37.75 19.40 21.51 23.77
EBITDA Margin (%) 12.86% 12.25% 11.92% 11.72%
PAT Margin (%) 9.13% 8.33% 8.05% 7.94%
P/E Ratio (x) 20.83 16.44 14.83 13.42
ROE (%) 20.03% 18.02% 16.68% 15.56%
ROCE (%) 23.72% 22.09% 20.86% 19.58%
EV/EBITDA (x) 14.79 11.21 10.02 9.10
Debt-Equity Ratio 0.10 0.10 0.09 0.08
Book Value (Rs.) 188.51 107.45 128.96 152.73
P/BV 4.17 2.97 2.47 2.09
Charts:

10

11

12
Outlook and Conclusion
At the current market price of Rs.319.00, the stock is trading at 14.83 x FY12E
and 13.42 x FY13E respectively.
Earning per share (EPS) of the company for the earnings for FY12E and FY13E
is seen at Rs.21.51 and Rs.23.77 respectively.
On the basis of EV/EBITDA, the stock trades at 10.02 x for FY12E and 9.10 x
for FY13E.
Net Sales and PAT of the company are expected to grow at a CAGR of 15% and
9% over 2010 to 2013E respectively.
Price to Book Value of the stock is expected to be at 2.47 x and 2.09 x
respectively for FY12E and FY13E.
We expect that the company will keep its growth story in the coming quarters
also. We recommend ‘BUY’ in this particular scrip with a target price of
Rs.360.00 for Medium to Long term investment.

13
Industry Overview
Electrical equipment industry:
Recovery in India’s manufacturing sector is in full swing. While revival of automation
projects — typically one of the first indicators for any growth in the economy — is
already under way, an 11.3% rise in the electrical equipment industry has
underscored the overall growth story in the world’s second fastest growing economy.
The Rs 52,000-crore industry, which sells cables, switchgears, transformers and other
large electrical products, saw a major part of its growth come in the second half of
2009-10, after liquidity improved and companies resumed expansion plans.
According to the Indian Electrical and Electronics Manufacturers Association (IEEMA),
an apex body representing the Indian electrical equipment industry, the sector grew
about 20% in the second quarter, compared with 1.7% in the first half. “This demand
growth could likely see a two-fold increase in the next 2-3 years. Adding that this was
due to a pick-up in housing and construction.
Some of the companies in this sector are Siemens, L&T, ABB, Crompton Greaves,
Havells, Schneider Electric and WS Industries. Coming after a lull of two years, the
growth in electricals will strengthen policy measures as the government is working to
restrict Chinese power equipment makers. “Since spends on automation and
electricals in any project are equal, it was expected that growth in automation would
also give a boost to the electricals sector. Also as prices of electrical equipment are
typically stable unlike that of the automation sector, higher electricals sales implies
that projects have been revived.
The industry has posted a 30% growth in the fourth quarter in sales of rotating
machines, switchgear and cables as a recovery in real estate and infrastructure
pushed up the demand for such products. The growth in demand mainly came from
industries such as power, textile, steel and cement. Analysts and industry experts said
the growth will be sustained as most of the transmission and distribution projects are
likely to begin in the next fiscal year, mainly by the Power Grid Corporation.
Demand for power equipment is expected to rise as India is targeting at least 9% GDP

14
growth for the year ahead. India has historically faced a demand-supply gap and this
will feed the electricals industry.
However, most of the orders would be through EPC route with more new players
entering the business and sub-contracting the same to existing contractors. It is
expected that competition would be intense. The government plans to add about
12,000 mw of capacity by the end of this fiscal, including from renewable sources. The
Central Electricity Authority has set a target to add more than 21,000 mw capacity by
the end of 2012.
The government has also taken policy initiatives to speed up power sector
development, such as the Rajiv Gandhi Gramin Vidyutikaran Yojana. “The power
sector reforms if implemented as scheduled will create large business for power sector
equipment manufacturers and service providers.
______________ ____ _________________________ Disclaimer:
This document prepared by our research analysts does not constitute an offer or solicitation
for the purchase or sale of any financial instrument or as an official confirmation of any
transaction. The information contained herein is from publicly available data or other
sources believed to be reliable but do not represent that it is accurate or complete and it
should not be relied on as such. Firstcall India Equity Advisors Pvt. Ltd. or any of it’s
affiliates shall not be in any way responsible for any loss or damage that may arise to any
person from any inadvertent error in the information contained in this report. This document
is provide for assistance only and is not intended to be and must not alone be taken as the
basis for an investment decision.

15
Firstcall India Equity Research: Email – [email protected]
C.V.S.L.Kameswari Pharma
U. Janaki Rao Capital Goods
D. Ashakirankumar Automobile
A. Rajesh Babu FMCG
H.Lavanya Oil & Gas
Dheeraj Bhatia Diversified
Manoj kotian Diversified
Nimesh Gada Diversified
Firstcall India also provides
Firstcall India Equity Advisors Pvt.Ltd focuses on, IPO’s, QIP’s, F.P.O’s, Takeover
Offers, Offer for Sale and Buy Back Offerings.
Corporate Finance Offerings include Foreign Currency Loan Syndications,
Placement of Equity / Debt with multilateral organizations, Short Term Funds
Management Debt & Equity, Working Capital Limits, Equity & Debt
Syndications and Structured Deals.
Corporate Advisory Offerings include Mergers & Acquisitions (domestic and
cross-border), divestitures, spin-offs, valuation of business, corporate
restructuring-Capital and Debt, Turnkey Corporate Revival – Planning &
Execution, Project Financing, Venture capital, Private Equity and Financial
Joint Ventures
Firstcall India also provides Financial Advisory services with respect to raising
of capital through FCCBs, GDRs, ADRs and listing of the same on International
Stock Exchanges namely AIMs, Luxembourg, Singapore Stock Exchanges and
other international stock exchanges.
For Further Details Contact:
3rd Floor,Sankalp,The Bureau,Dr.R.C.Marg,Chembur,Mumbai 400 071
Tel. : 022-2527 2510/2527 6077/25276089 Telefax : 022-25276089
E-mail: [email protected]
www.firstcallindiaequity.com


![Untitled-2 [parthenonpizza.com]parthenonpizza.com/wp-content/uploads/2019/05/Pantheon... · 2019-05-17 · .$23.99 .PartyS2.99 .Party S 5.49 Trio halian meatball, manicotti Baked](https://static.fdocuments.us/doc/165x107/5f054a3f7e708231d4123aab/untitled-2-2019-05-17-2399-partys299-party-s-549-trio-halian-meatball.jpg)