Basic Business Statistics, 11e © 2009 Prentice-Hall, Inc. Chap 10-1 Chapter 2c Two-Sample Tests.
Upload
charla-staffordCategory
view
223download
2
Basic Business Statistics, 11e © 2009 Prentice-Hall, Inc. Chap 8-1
Chapter 8
Confidence Interval Estimation
Basic Business Statistics11th Edition
Basic Business Statistics, 11e © 2009 Prentice-Hall, Inc.. Chap 8-2
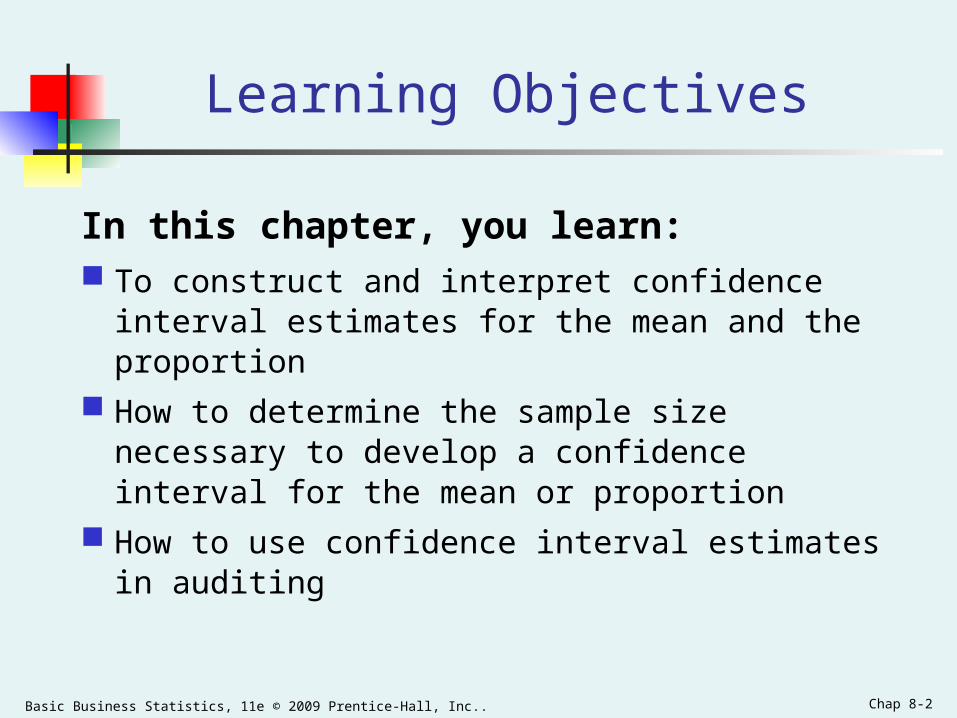
Learning Objectives
In this chapter, you learn: To construct and interpret confidence interval estimates
for the mean and the proportion
How to determine the sample size necessary to develop a confidence interval for the mean or proportion
How to use confidence interval estimates in auditing
Basic Business Statistics, 11e © 2009 Prentice-Hall, Inc.. Chap 8-3
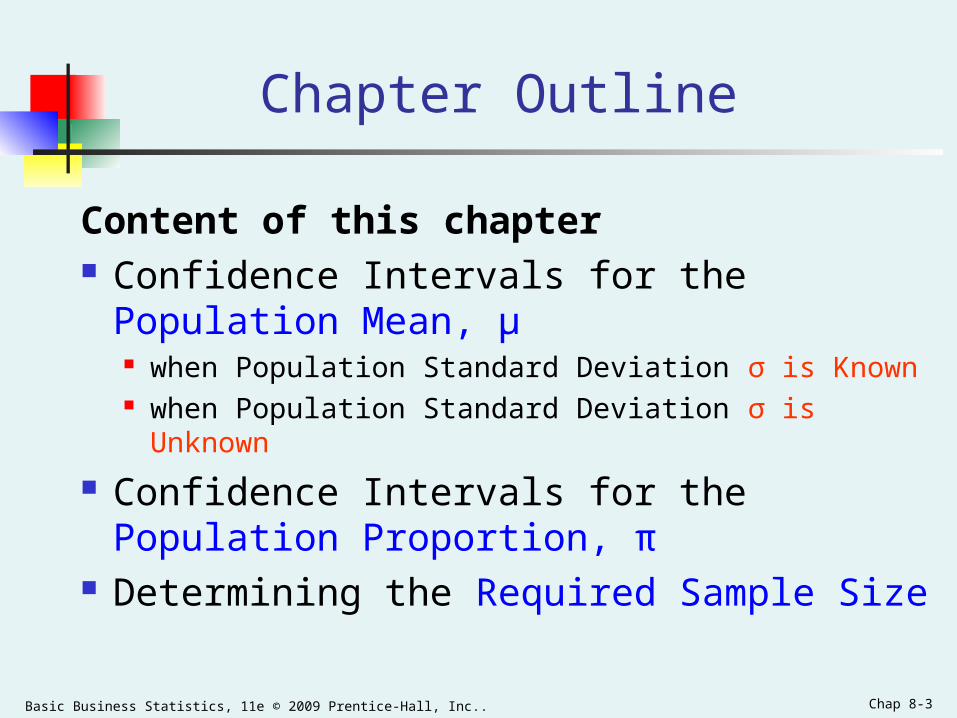
Chapter Outline
Content of this chapter Confidence Intervals for the Population
Mean, μ when Population Standard Deviation σ is Known when Population Standard Deviation σ is Unknown
Confidence Intervals for the Population Proportion, π
Determining the Required Sample Size
Basic Business Statistics, 11e © 2009 Prentice-Hall, Inc.. Chap 8-4
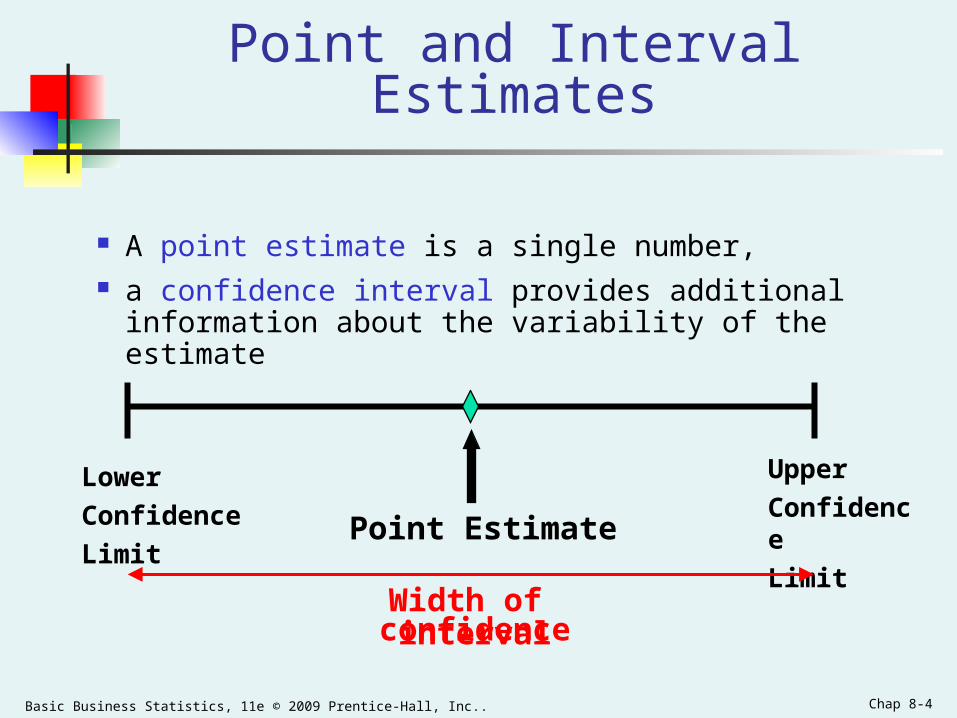
Point and Interval Estimates
A point estimate is a single number, a confidence interval provides additional
information about the variability of the estimate
Point Estimate
Lower
Confidence
Limit
Upper
Confidence
Limit
Width of confidence interval
Basic Business Statistics, 11e © 2009 Prentice-Hall, Inc.. Chap 8-5
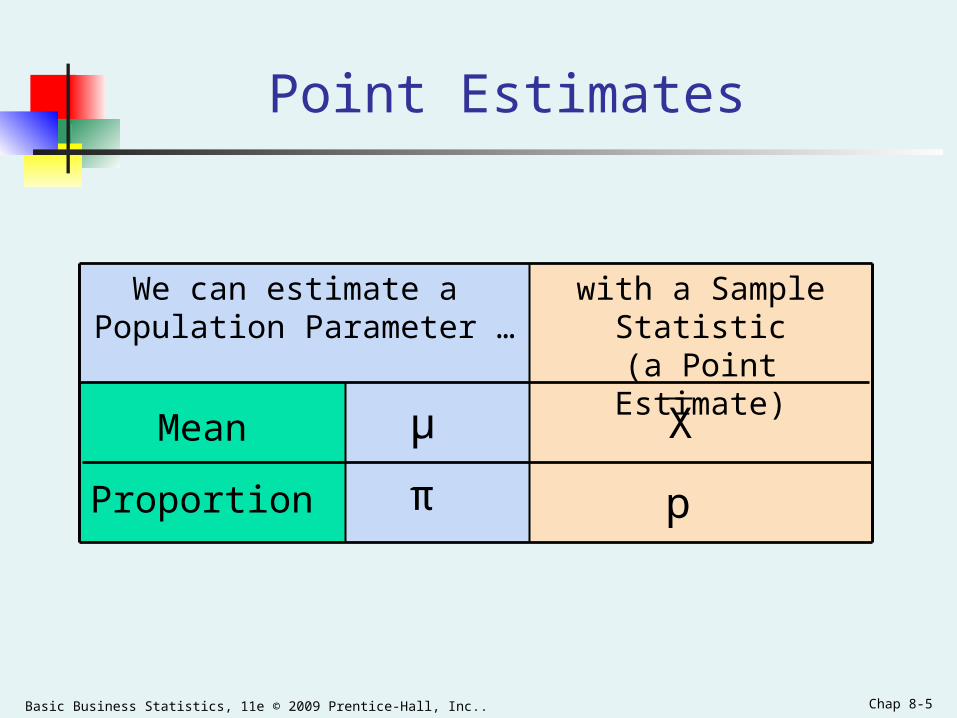
We can estimate a Population Parameter …
Point Estimates
with a SampleStatistic
(a Point Estimate)
Mean
Proportion pπ
Xμ

Basic Business Statistics, 11e © 2009 Prentice-Hall, Inc.. Chap 8-6
Confidence Intervals
How much uncertainty is associated with a point estimate of a population parameter?
An interval estimate provides more information about a population characteristic than does a point estimate
Such interval estimates are called confidence intervals
Basic Business Statistics, 11e © 2009 Prentice-Hall, Inc.. Chap 8-7
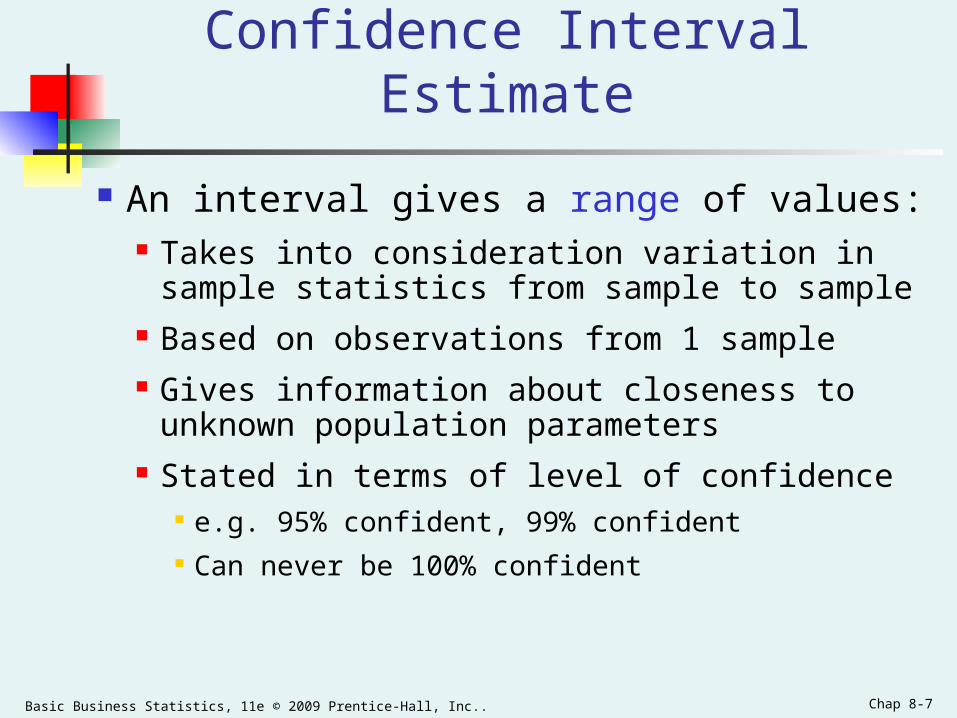
Confidence Interval Estimate
An interval gives a range of values: Takes into consideration variation in sample
statistics from sample to sample Based on observations from 1 sample Gives information about closeness to
unknown population parameters Stated in terms of level of confidence
e.g. 95% confident, 99% confident Can never be 100% confident
Basic Business Statistics, 11e © 2009 Prentice-Hall, Inc.. Chap 8-8
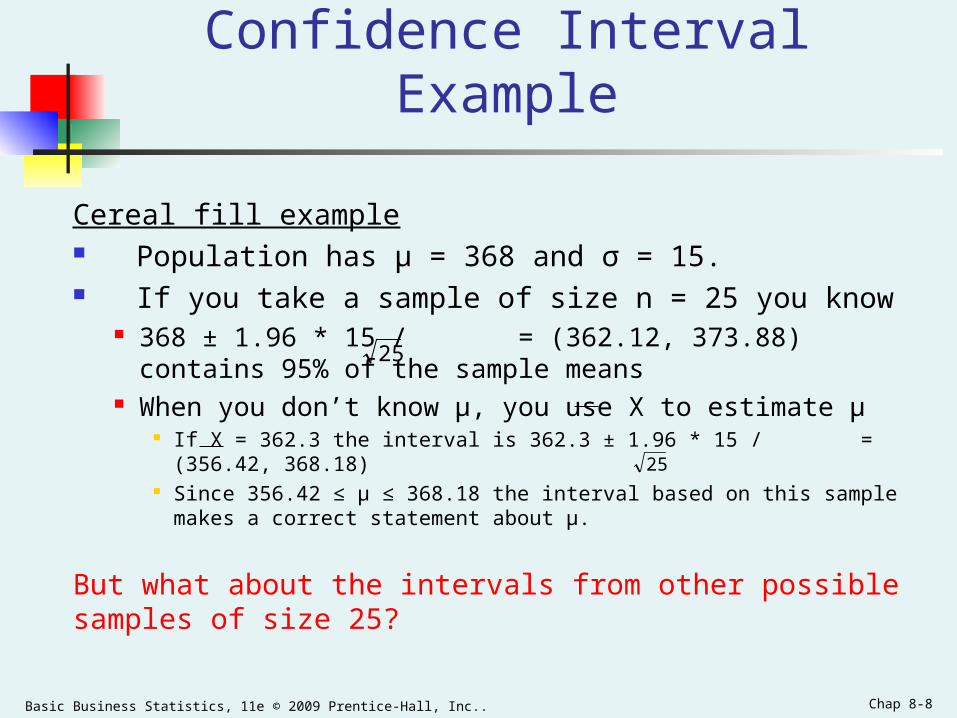
Confidence Interval Example
Cereal fill example Population has µ = 368 and σ = 15. If you take a sample of size n = 25 you know
368 ± 1.96 * 15 / = (362.12, 373.88) contains 95% of the sample means
When you don’t know µ, you use X to estimate µ If X = 362.3 the interval is 362.3 ± 1.96 * 15 / = (356.42, 368.18) Since 356.42 ≤ µ ≤ 368.18 the interval based on this sample makes a
correct statement about µ.
But what about the intervals from other possible samples of size 25?
25
25
Basic Business Statistics, 11e © 2009 Prentice-Hall, Inc.. Chap 8-9
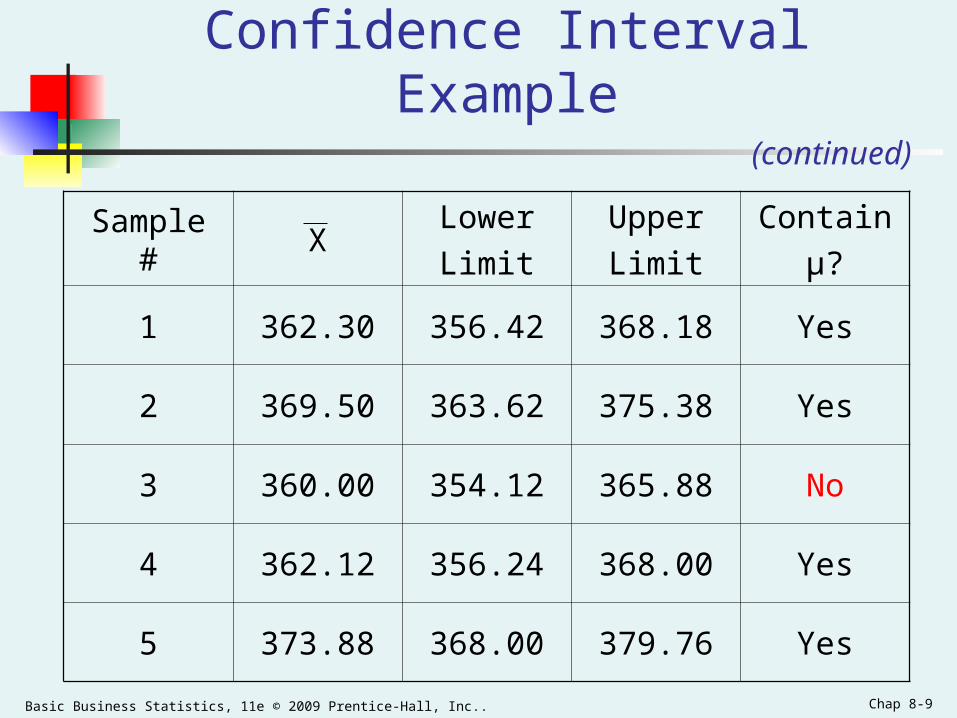
Confidence Interval Example(continued)
Sample # XLower
Limit
Upper
Limit
Contain
µ?
1 362.30 356.42 368.18 Yes
2 369.50 363.62 375.38 Yes
3 360.00 354.12 365.88 No
4 362.12 356.24 368.00 Yes
5 373.88 368.00 379.76 Yes

Basic Business Statistics, 11e © 2009 Prentice-Hall, Inc.. Chap 8-10
Confidence Interval Example
In practice you only take one sample of size n In practice you do not know µ so you do not
know if the interval actually contains µ However you do know that 95% of the intervals
formed in this manner will contain µ Thus, based on the one sample, you actually
selected you can be 95% confident your interval will contain µ (this is a 95% confidence interval)
(continued)
Note: 95% confidence is based on the fact that we used Z = 1.96.

Basic Business Statistics, 11e © 2009 Prentice-Hall, Inc.. Chap 8-11
Estimation Process
(mean, μ, is unknown)
Population
Random Sample
Mean X = 50
Sample
I am 95% confident that μ is between 40 & 60.
Basic Business Statistics, 11e © 2009 Prentice-Hall, Inc.. Chap 8-12
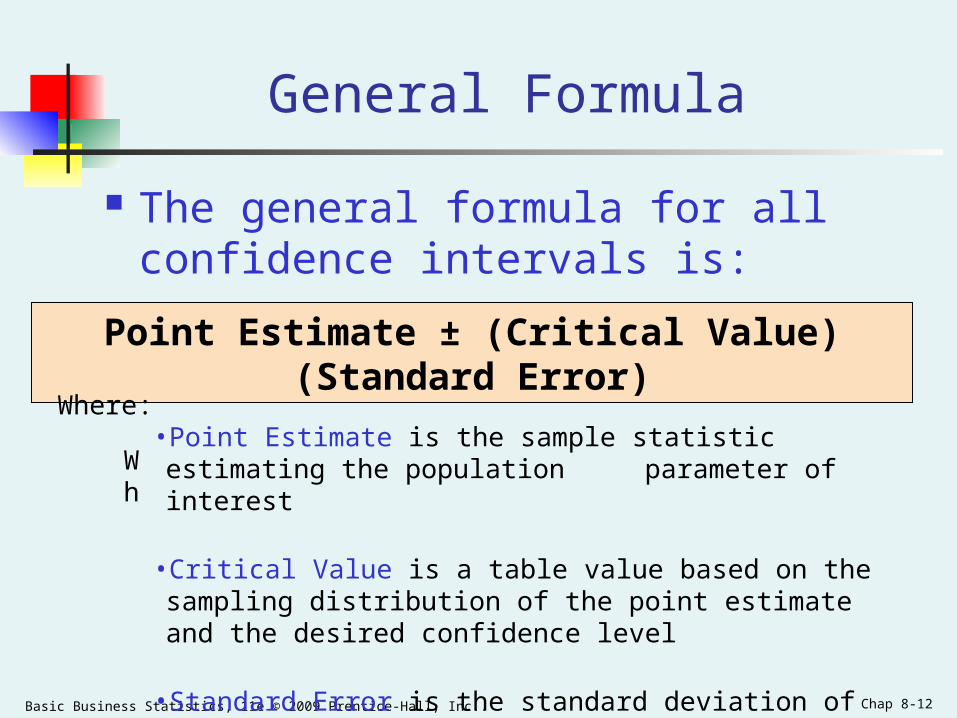
General Formula
The general formula for all confidence intervals is:
Point Estimate ± (Critical Value)(Standard Error)
Wh
Where:•Point Estimate is the sample statistic estimating the population parameter of interest
•Critical Value is a table value based on the sampling distribution of the point estimate and the desired confidence level
•Standard Error is the standard deviation of the point estimate

Basic Business Statistics, 11e © 2009 Prentice-Hall, Inc.. Chap 8-13
Confidence Level
Confidence Level
Confidence the interval will contain the unknown population parameter
A percentage (less than 100%)
Basic Business Statistics, 11e © 2009 Prentice-Hall, Inc.. Chap 8-14
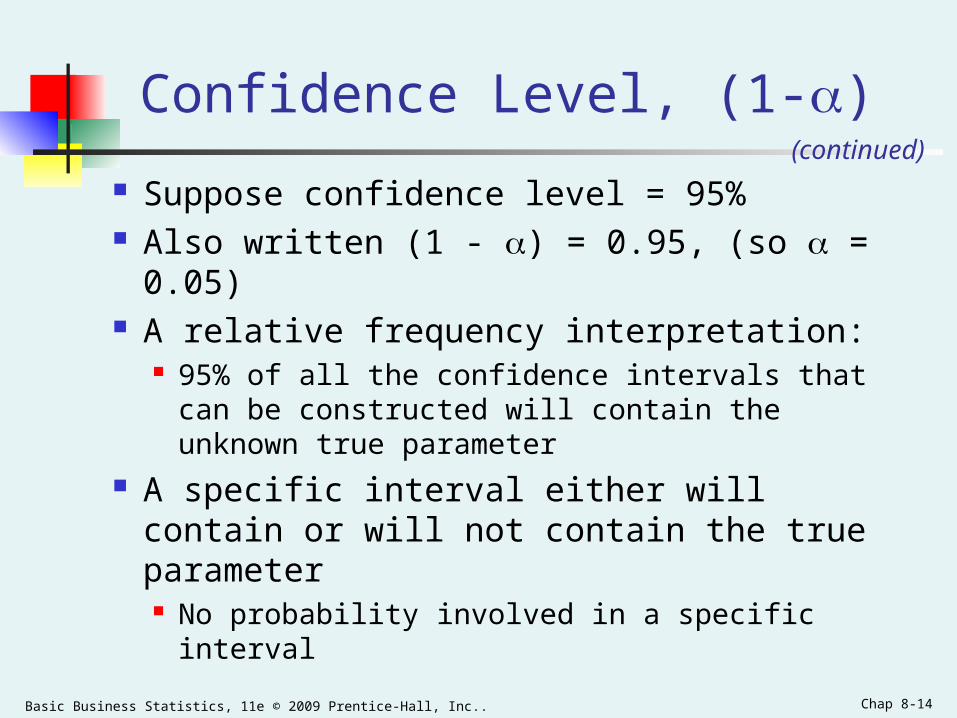
Confidence Level, (1-)
Suppose confidence level = 95% Also written (1 - ) = 0.95, (so = 0.05) A relative frequency interpretation:
95% of all the confidence intervals that can be constructed will contain the unknown true parameter
A specific interval either will contain or will not contain the true parameter No probability involved in a specific interval
(continued)
Basic Business Statistics, 11e © 2009 Prentice-Hall, Inc.. Chap 8-15
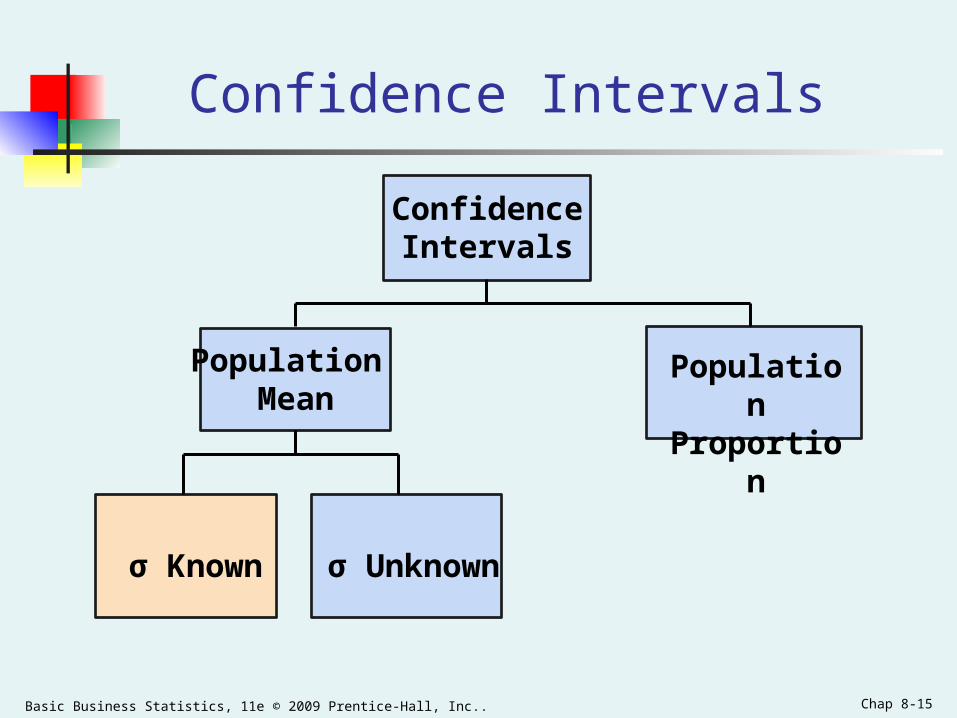
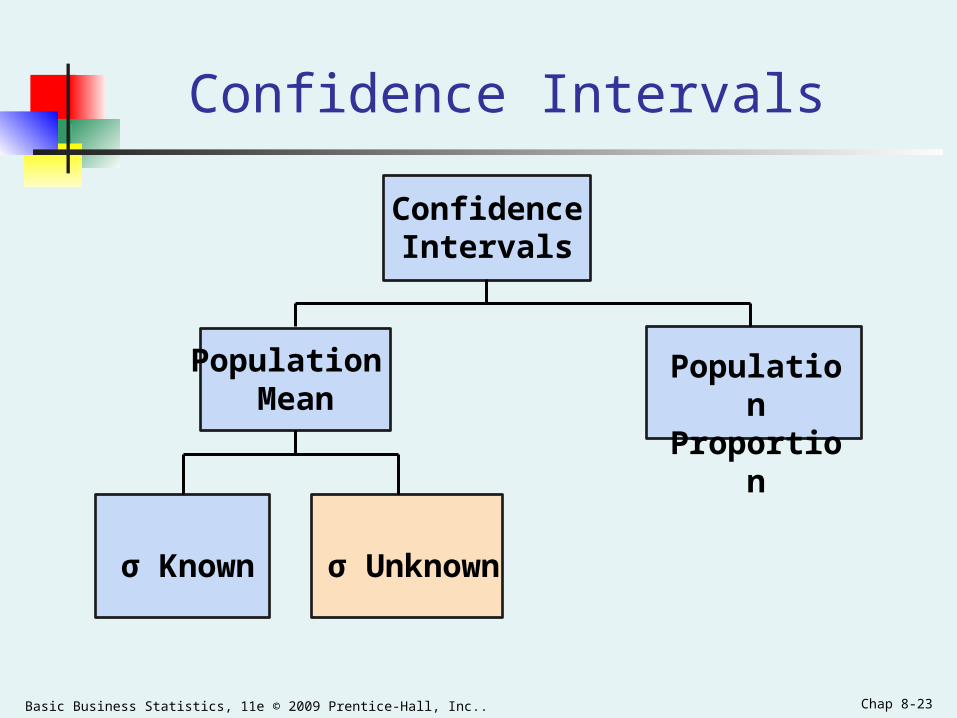
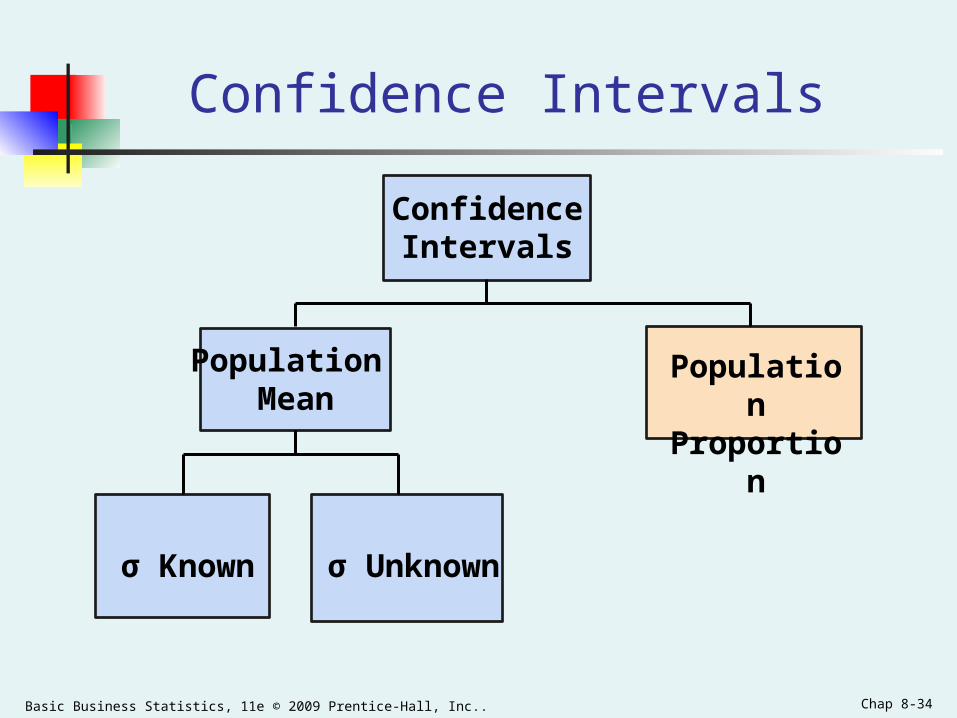
Confidence Intervals
Population Mean
σ Unknown
ConfidenceIntervals
PopulationProportion
σ Known

Basic Business Statistics, 11e © 2009 Prentice-Hall, Inc.. Chap 8-16
Confidence Interval for μ(σ Known)
Assumptions Population standard deviation σ is known Population is normally distributed If population is not normal, use large sample
Confidence interval estimate:
where is the point estimate
Zα/2 is the normal distribution critical value for a probability of /2 in each tail
is the standard error
n
σ/2ZX α
X
nσ/
Basic Business Statistics, 11e © 2009 Prentice-Hall, Inc.. Chap 8-17
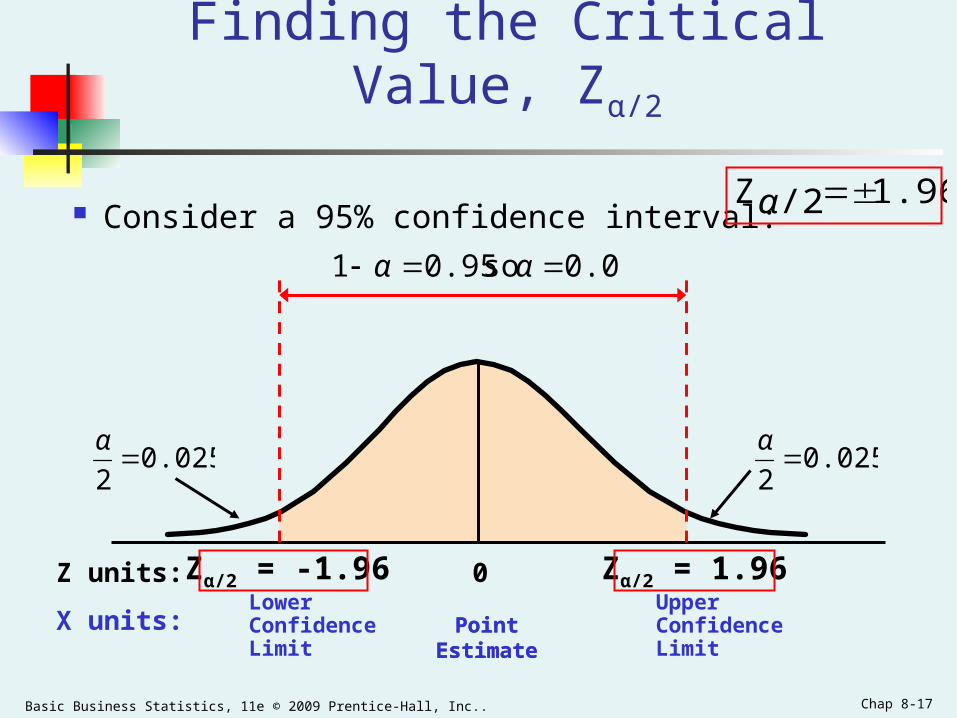
Finding the Critical Value, Zα/2
Consider a 95% confidence interval:
Zα/2 = -1.96 Zα/2 = 1.96
0.05 so 0.951 αα
0.0252
α
0.0252
α
Point EstimateLower Confidence Limit
UpperConfidence Limit
Z units:
X units: Point Estimate
0
1.96/2Z α
Basic Business Statistics, 11e © 2009 Prentice-Hall, Inc.. Chap 8-18
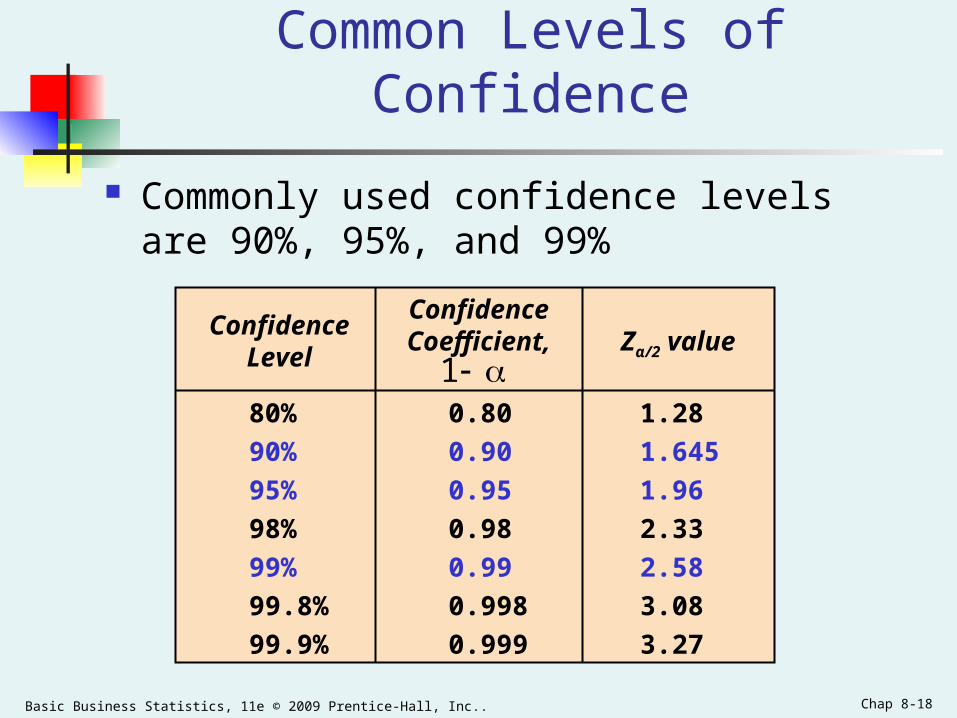
Common Levels of Confidence
Commonly used confidence levels are 90%, 95%, and 99%
Confidence Level
Confidence Coefficient,
Zα/2 value
1.28
1.645
1.96
2.33
2.58
3.08
3.27
0.80
0.90
0.95
0.98
0.99
0.998
0.999
80%
90%
95%
98%
99%
99.8%
99.9%
1
Basic Business Statistics, 11e © 2009 Prentice-Hall, Inc.. Chap 8-19
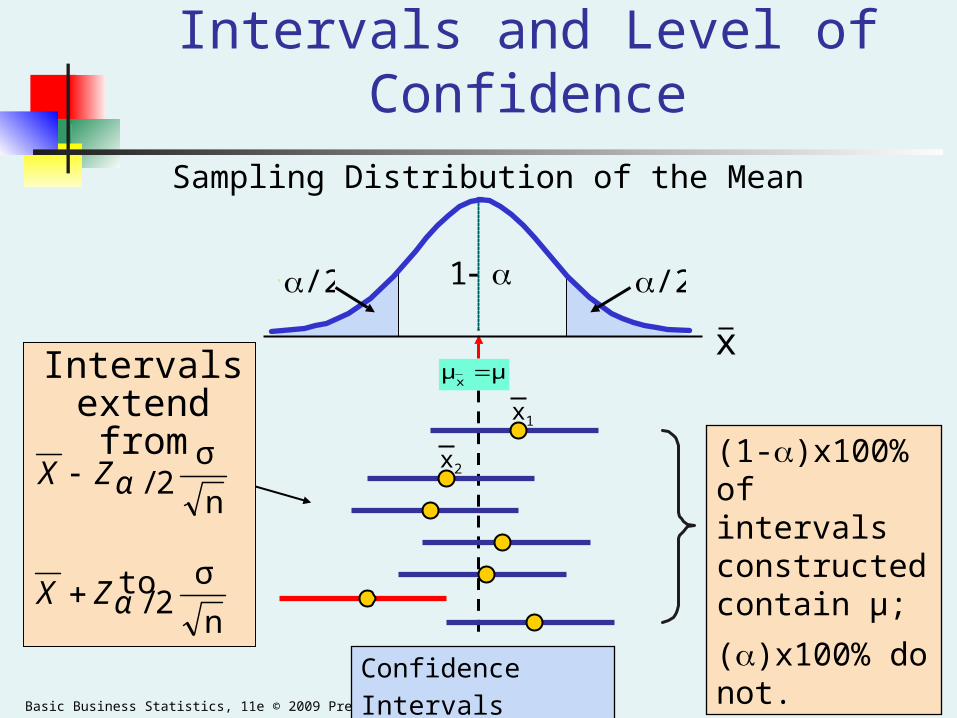
μμx
Intervals and Level of Confidence
Confidence Intervals
Intervals extend from
to
(1-)x100%of intervals constructed contain μ;
()x100% do not.
Sampling Distribution of the Mean
n
σ2/αZX
n
σ2/αZX
x
x1
x2
/2 /21
Basic Business Statistics, 11e © 2009 Prentice-Hall, Inc.. Chap 8-20
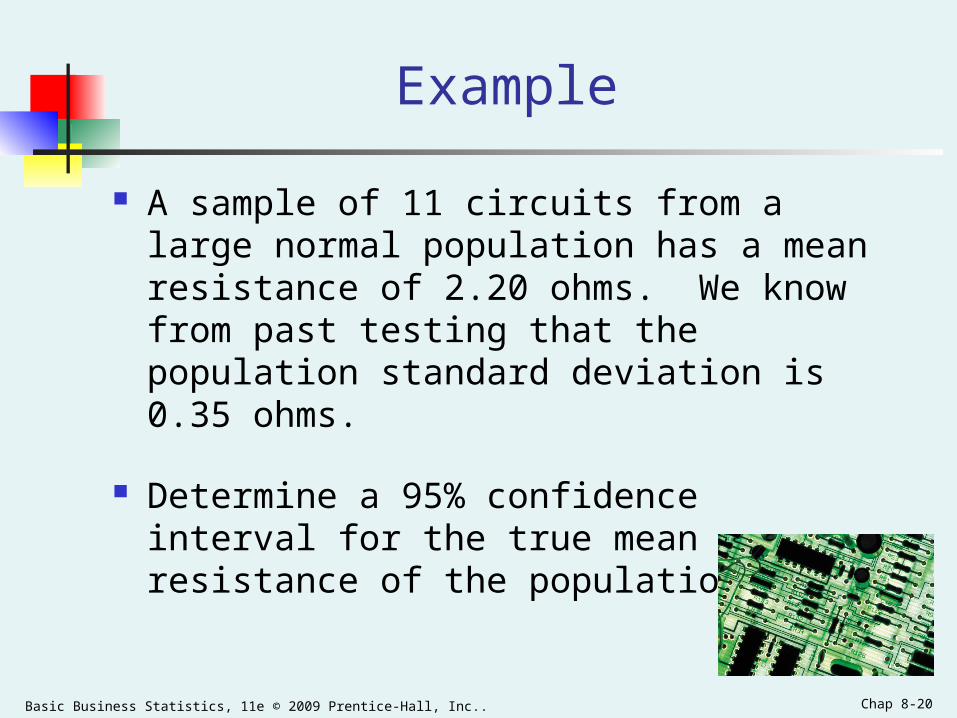
Example
A sample of 11 circuits from a large normal population has a mean resistance of 2.20 ohms. We know from past testing that the population standard deviation is 0.35 ohms.
Determine a 95% confidence interval for the true mean resistance of the population.

Basic Business Statistics, 11e © 2009 Prentice-Hall, Inc.. Chap 8-21
2.4068 1.9932
0.2068 2.20
)11(0.35/ 1.96 2.20
n
σ/2 ZX
μ
α
Example
A sample of 11 circuits from a large normal population has a mean resistance of 2.20 ohms. We know from past testing that the population standard deviation is 0.35 ohms.
Solution:
(continued)

Basic Business Statistics, 11e © 2009 Prentice-Hall, Inc.. Chap 8-22
Interpretation
We are 95% confident that the true mean resistance is between 1.9932 and 2.4068 ohms
Although the true mean may or may not be in this interval, 95% of intervals formed in this manner will contain the true mean
Basic Business Statistics, 11e © 2009 Prentice-Hall, Inc.. Chap 8-23
Confidence Intervals
Population Mean
σ Unknown
ConfidenceIntervals
PopulationProportion
σ Known
Basic Business Statistics, 11e © 2009 Prentice-Hall, Inc.. Chap 8-24
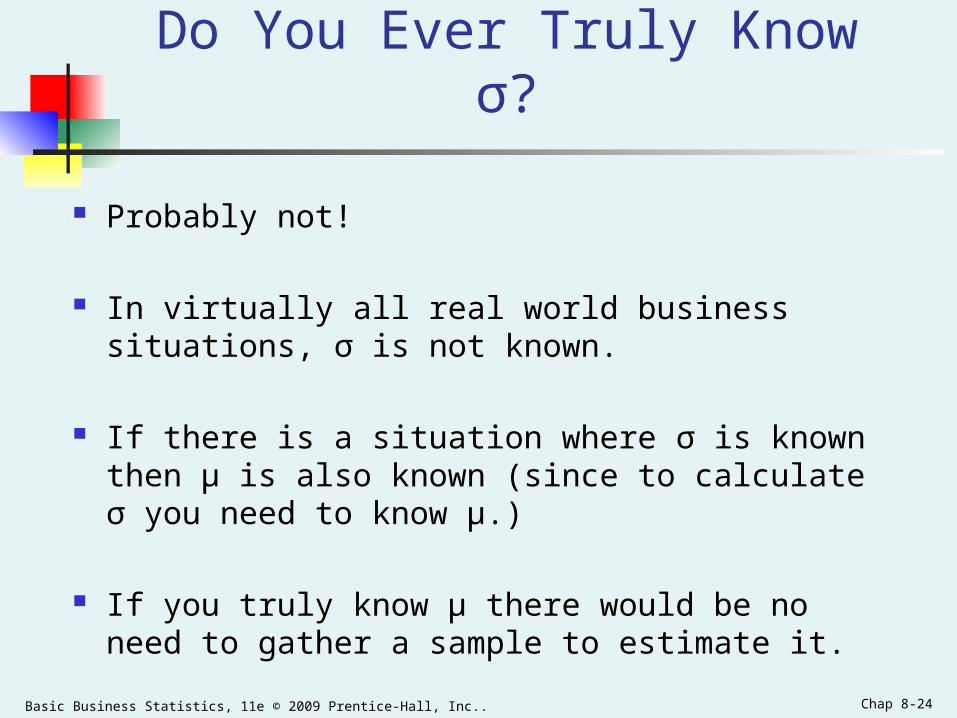
Do You Ever Truly Know σ?
Probably not!
In virtually all real world business situations, σ is not known.
If there is a situation where σ is known then µ is also known (since to calculate σ you need to know µ.)
If you truly know µ there would be no need to gather a sample to estimate it.
Basic Business Statistics, 11e © 2009 Prentice-Hall, Inc.. Chap 8-25
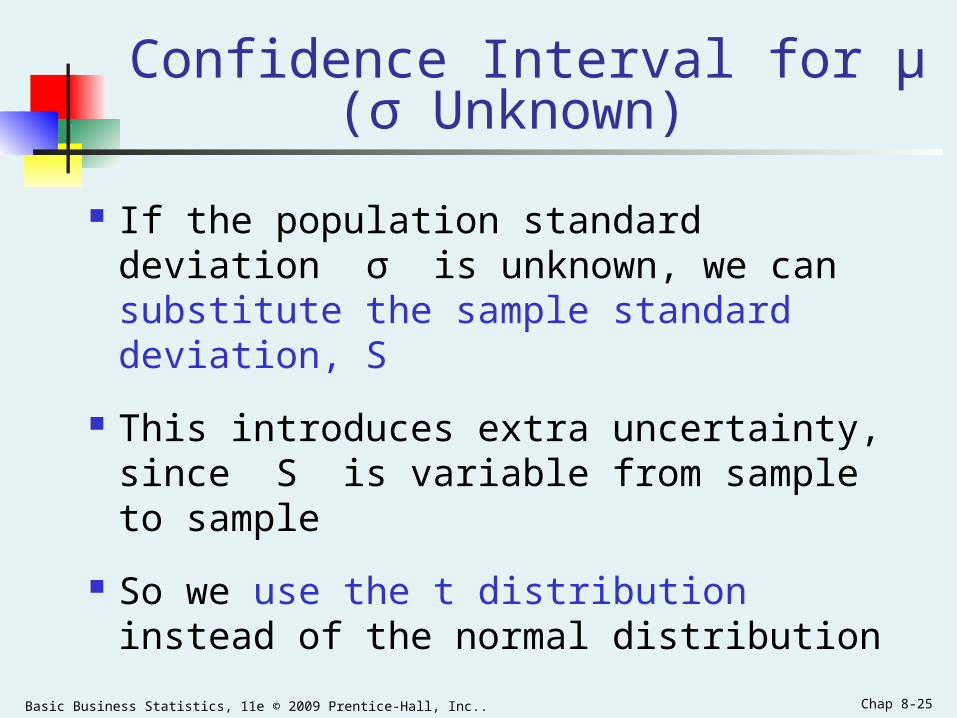
If the population standard deviation σ is unknown, we can substitute the sample standard deviation, S
This introduces extra uncertainty, since S is variable from sample to sample
So we use the t distribution instead of the normal distribution
Confidence Interval for μ(σ Unknown)

Basic Business Statistics, 11e © 2009 Prentice-Hall, Inc.. Chap 8-26
Assumptions Population standard deviation is unknown Population is normally distributed If population is not normal, use large sample
Use Student’s t Distribution Confidence Interval Estimate:
(where tα/2 is the critical value of the t distribution with n -1 degrees of freedom and an area of α/2 in each tail)
Confidence Interval for μ(σ Unknown)
n
StX 2/α
(continued)
Basic Business Statistics, 11e © 2009 Prentice-Hall, Inc.. Chap 8-27
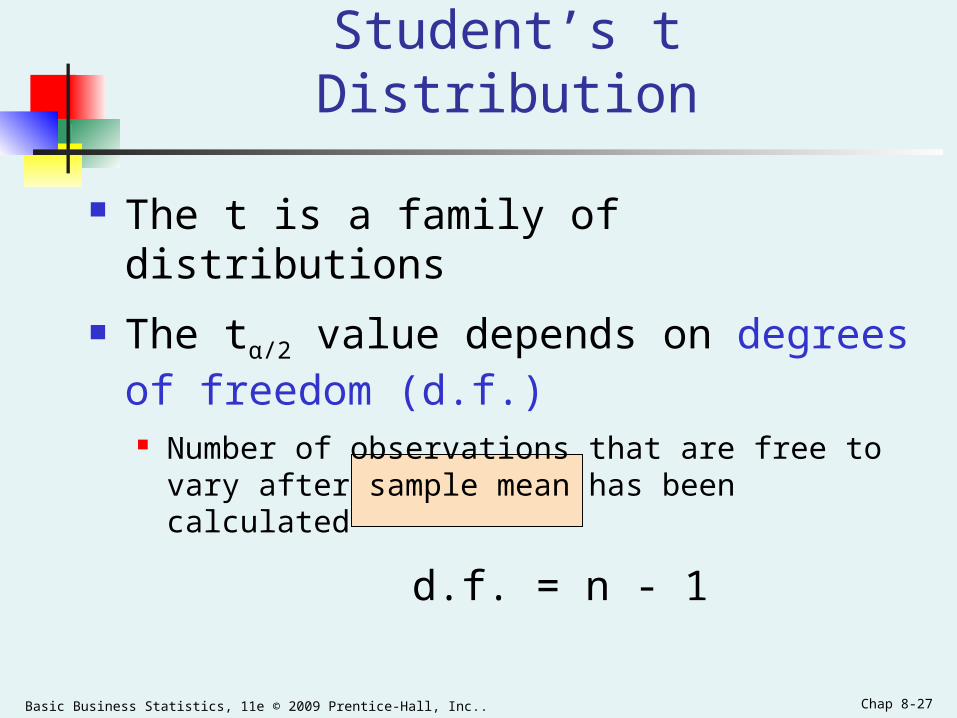
Student’s t Distribution
The t is a family of distributions
The tα/2 value depends on degrees of freedom (d.f.) Number of observations that are free to vary after
sample mean has been calculated
d.f. = n - 1
Basic Business Statistics, 11e © 2009 Prentice-Hall, Inc.. Chap 8-28
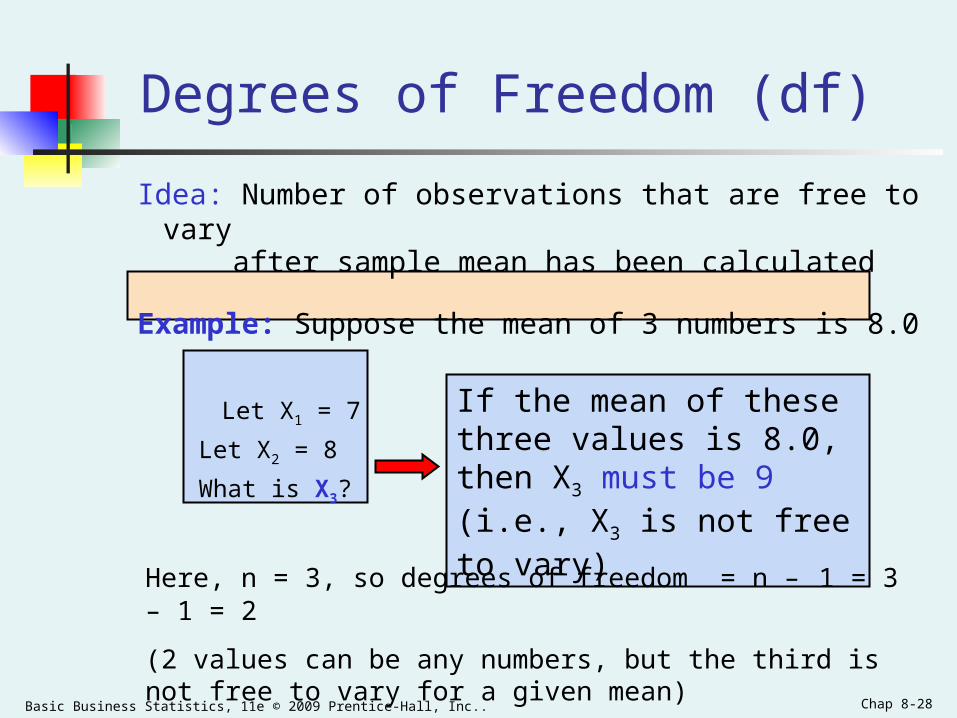
If the mean of these three values is 8.0, then X3 must be 9 (i.e., X3 is not free to vary)
Degrees of Freedom (df)
Here, n = 3, so degrees of freedom = n – 1 = 3 – 1 = 2
(2 values can be any numbers, but the third is not free to vary for a given mean)
Idea: Number of observations that are free to vary after sample mean has been calculated
Example: Suppose the mean of 3 numbers is 8.0
Let X1 = 7
Let X2 = 8
What is X3?
Basic Business Statistics, 11e © 2009 Prentice-Hall, Inc.. Chap 8-29
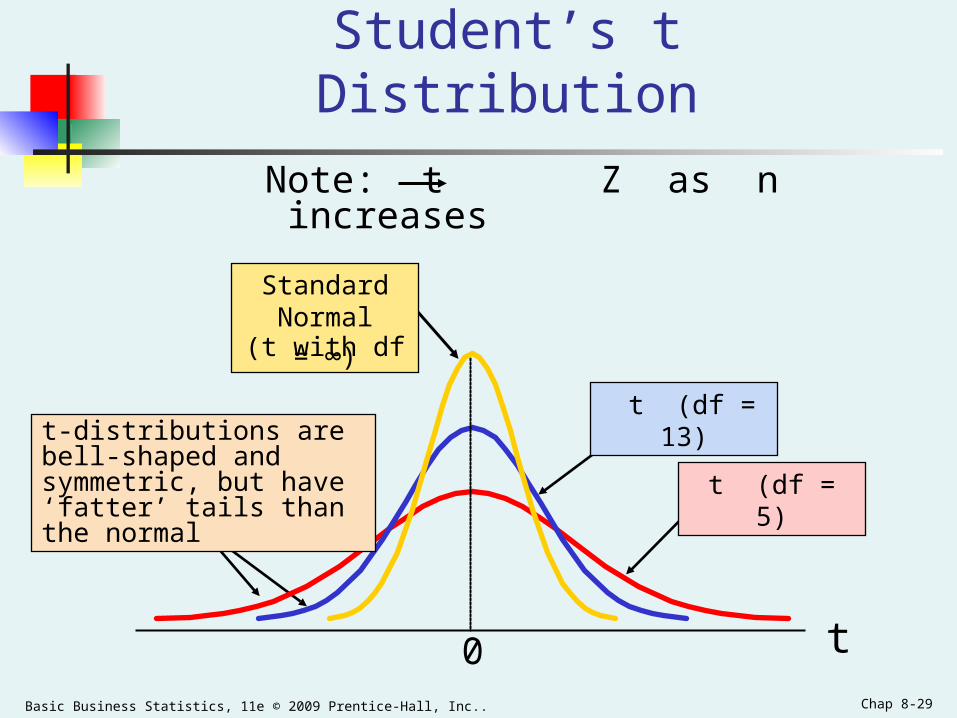
Student’s t Distribution
t0
t (df = 5)
t (df = 13)t-distributions are bell-shaped and symmetric, but have ‘fatter’ tails than the normal
Standard Normal
(t with df = ∞)
Note: t Z as n increases

Basic Business Statistics, 11e © 2009 Prentice-Hall, Inc.. Chap 8-30
Student’s t Table
Upper Tail Area
df .25 .10 .05
1 1.000 3.078 6.314
2 0.817 1.886 2.920
3 0.765 1.638 2.353
t0 2.920The body of the table contains t values, not probabilities
Let: n = 3 df = n - 1 = 2 = 0.10 /2 = 0.05
/2 = 0.05
Basic Business Statistics, 11e © 2009 Prentice-Hall, Inc.. Chap 8-31
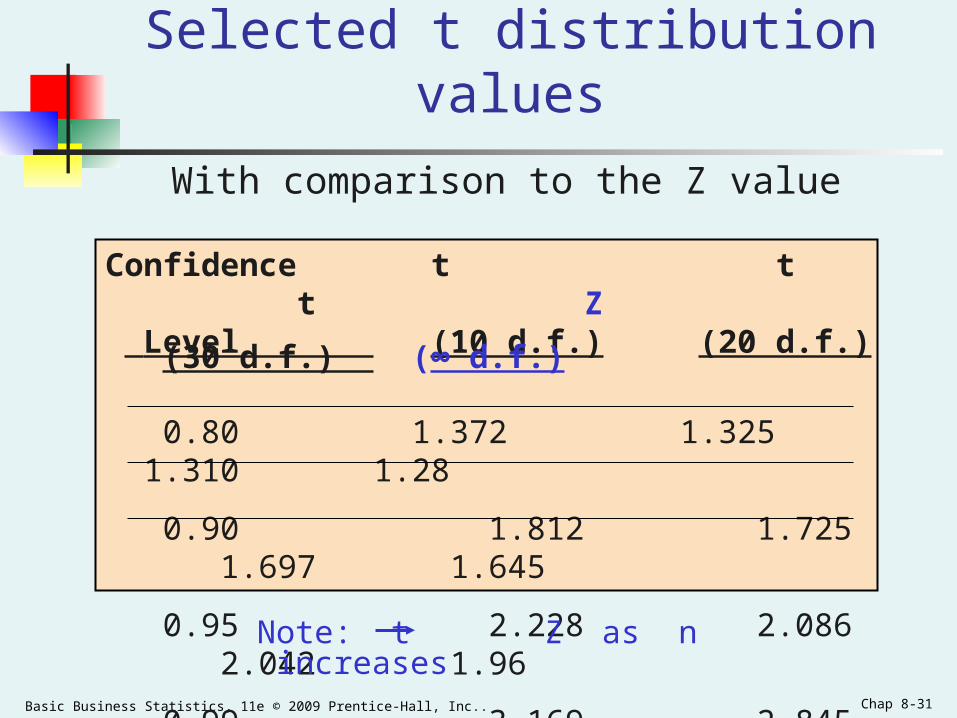
Selected t distribution values
With comparison to the Z value
Confidence t t t Z Level (10 d.f.) (20 d.f.) (30 d.f.) (∞ d.f.)
0.80 1.372 1.325 1.310 1.28
0.90 1.812 1.725 1.697 1.645
0.95 2.228 2.086 2.042 1.96
0.99 3.169 2.845 2.750 2.58
Note: t Z as n increases
Basic Business Statistics, 11e © 2009 Prentice-Hall, Inc.. Chap 8-32
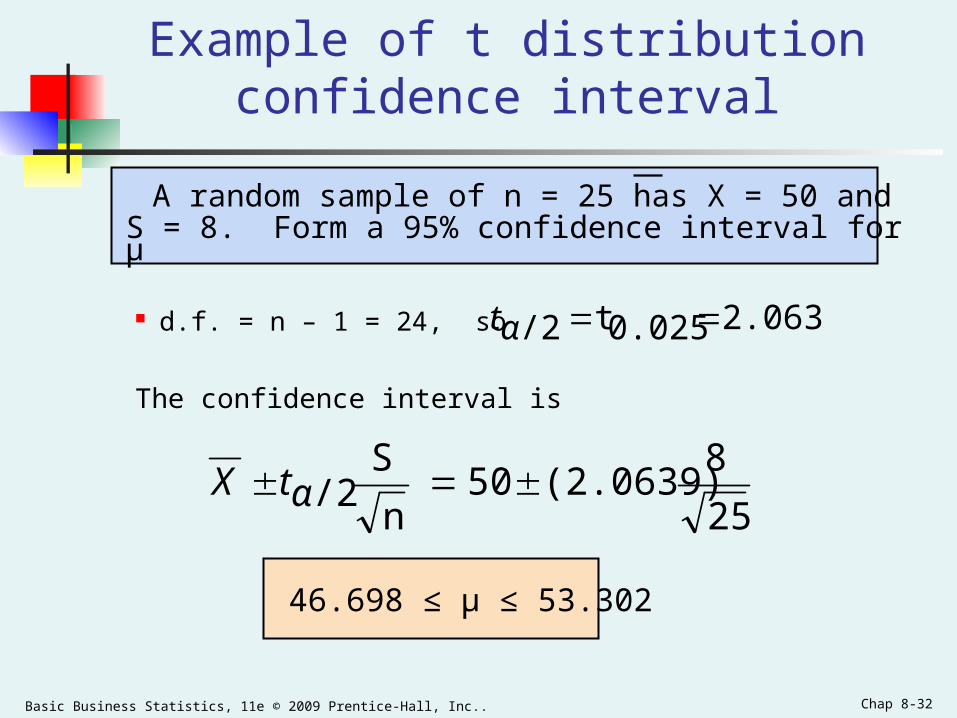
Example of t distribution confidence interval
A random sample of n = 25 has X = 50 and S = 8. Form a 95% confidence interval for μ
d.f. = n – 1 = 24, so
The confidence interval is
2.06390.025t/2 αt
25
8(2.0639)50
n
S/2 αtX
46.698 ≤ μ ≤ 53.302

Basic Business Statistics, 11e © 2009 Prentice-Hall, Inc.. Chap 8-33
Example of t distribution confidence interval
Interpreting this interval requires the assumption that the population you are sampling from is approximately a normal distribution (especially since n is only 25).
This condition can be checked by creating a: Normal probability plot or Boxplot
(continued)
Basic Business Statistics, 11e © 2009 Prentice-Hall, Inc.. Chap 8-34
Confidence Intervals
Population Mean
σ Unknown
ConfidenceIntervals
PopulationProportion
σ Known

Basic Business Statistics, 11e © 2009 Prentice-Hall, Inc.. Chap 8-35
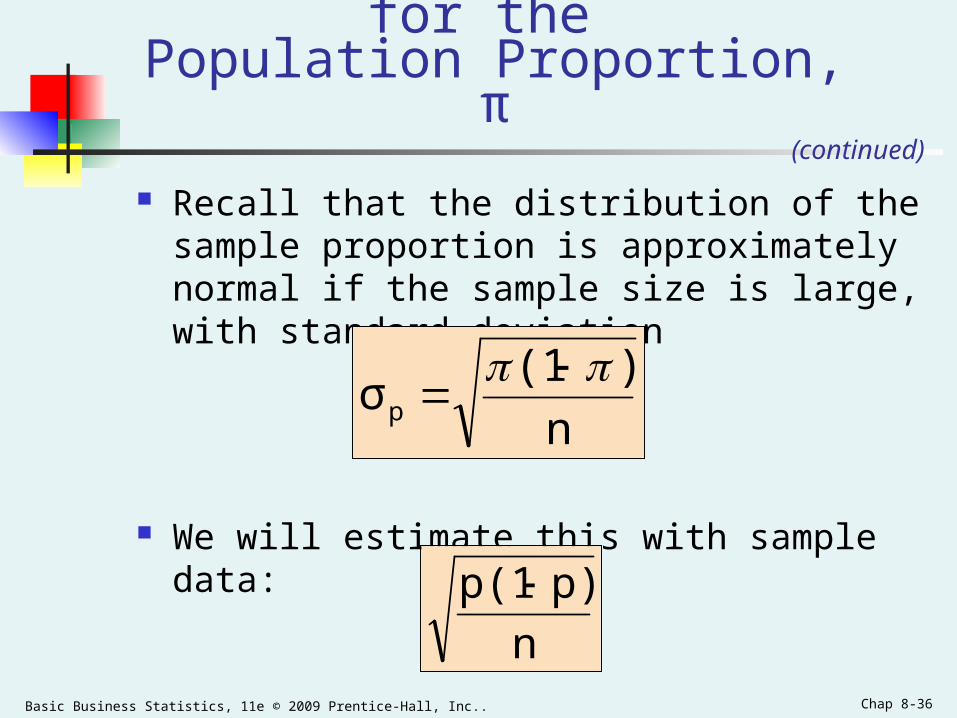
Confidence Intervals for the Population Proportion, π
An interval estimate for the population proportion ( π ) can be calculated by adding an allowance for uncertainty to the sample proportion ( p )
Basic Business Statistics, 11e © 2009 Prentice-Hall, Inc.. Chap 8-36
Confidence Intervals for the Population Proportion, π
Recall that the distribution of the sample proportion is approximately normal if the sample size is large, with standard deviation
We will estimate this with sample data:
(continued)
n
p)p(1
n
)(1σp
Basic Business Statistics, 11e © 2009 Prentice-Hall, Inc.. Chap 8-37
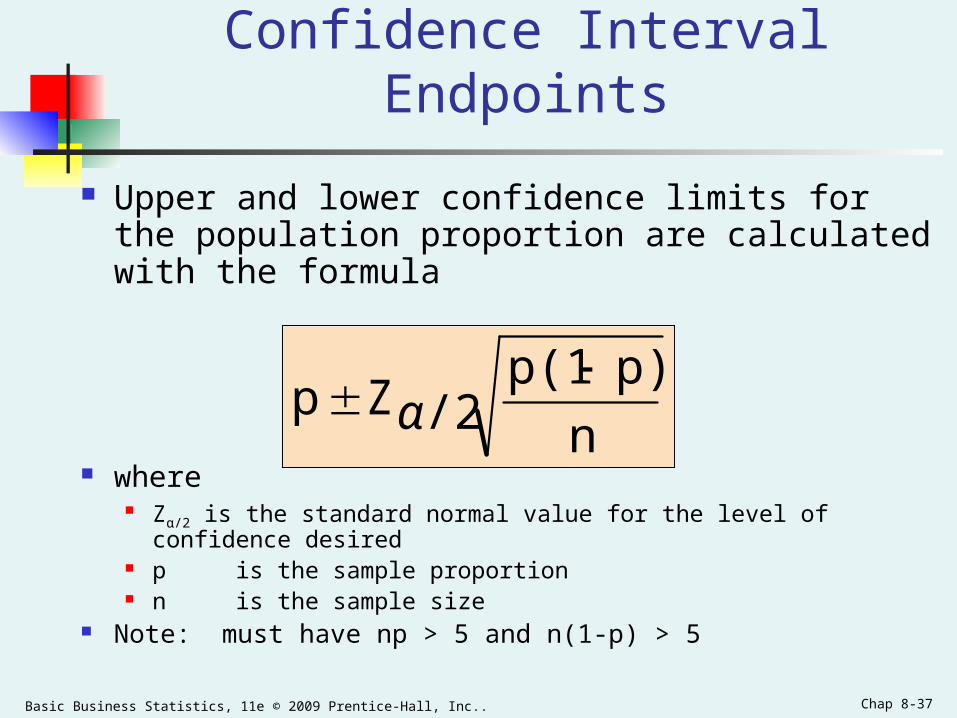
Confidence Interval Endpoints
Upper and lower confidence limits for the population proportion are calculated with the formula
where Zα/2 is the standard normal value for the level of confidence desired p is the sample proportion n is the sample size
Note: must have np > 5 and n(1-p) > 5
n
p)p(1/2Zp
α

Basic Business Statistics, 11e © 2009 Prentice-Hall, Inc.. Chap 8-38
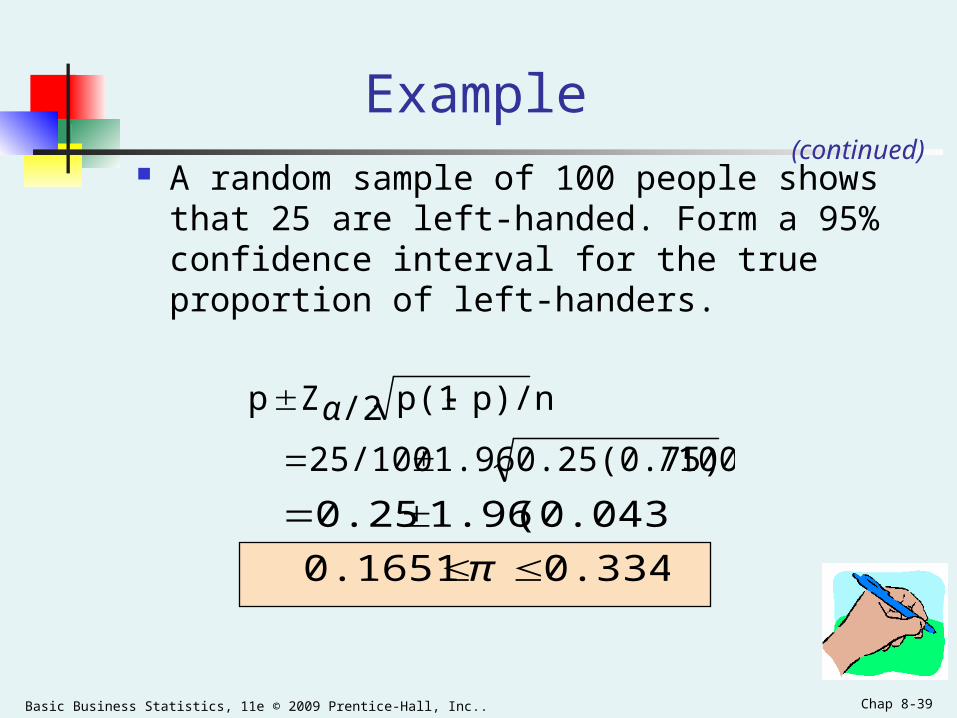
Example
A random sample of 100 people
shows that 25 are left-handed.
Form a 95% confidence interval for
the true proportion of left-handers
Basic Business Statistics, 11e © 2009 Prentice-Hall, Inc.. Chap 8-39
Example A random sample of 100 people shows
that 25 are left-handed. Form a 95% confidence interval for the true proportion of left-handers.
/1000.25(0.75)1.9625/100
p)/np(1/2Zp
α
0.3349 0.1651
(0.0433) 1.96 0.25
π
(continued)
Basic Business Statistics, 11e © 2009 Prentice-Hall, Inc.. Chap 8-40
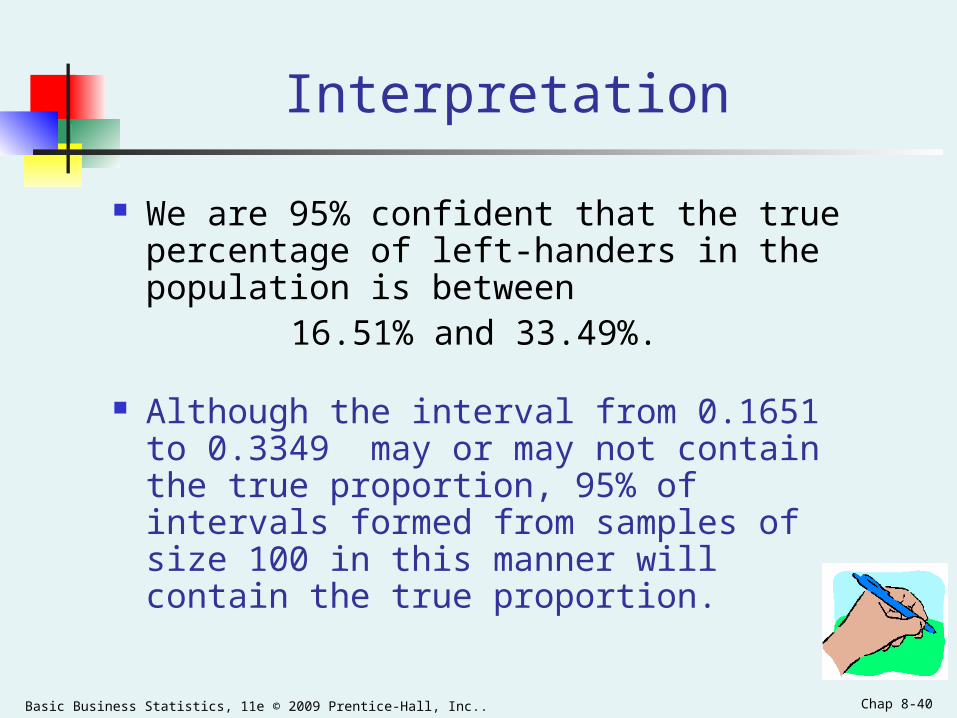
Interpretation
We are 95% confident that the true percentage of left-handers in the population is between
16.51% and 33.49%.
Although the interval from 0.1651 to 0.3349 may or may not contain the true proportion, 95% of intervals formed from samples of size 100 in this manner will contain the true proportion.

Basic Business Statistics, 11e © 2009 Prentice-Hall, Inc.. Chap 8-41
Determining Sample Size
For the Mean
DeterminingSample Size
For theProportion
Basic Business Statistics, 11e © 2009 Prentice-Hall, Inc.. Chap 8-42
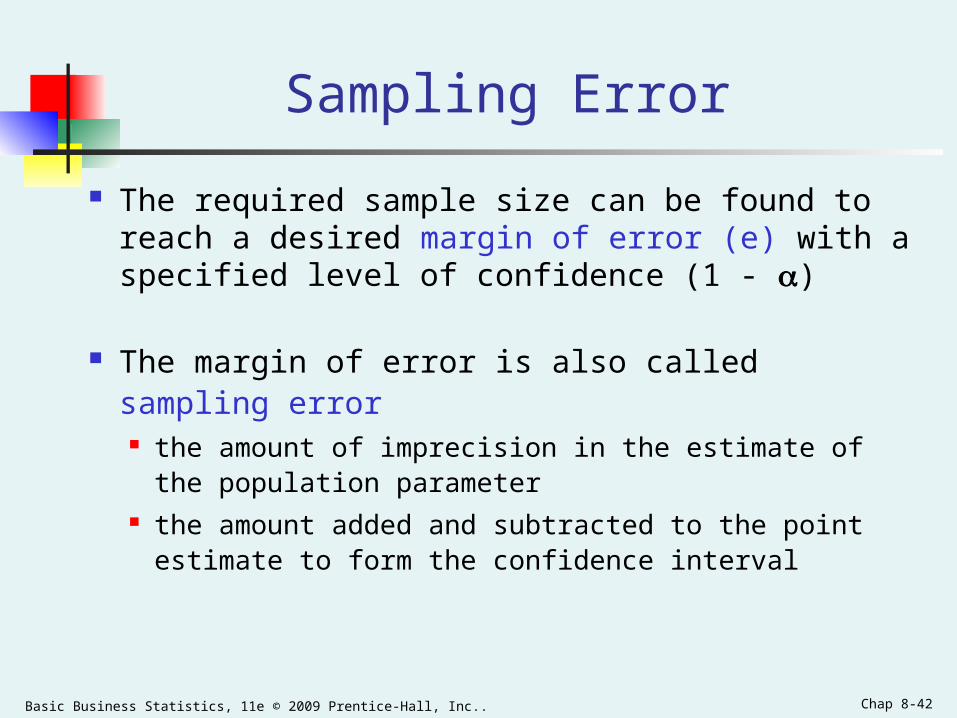
Sampling Error
The required sample size can be found to reach a desired margin of error (e) with a specified level of confidence (1 - )
The margin of error is also called sampling error the amount of imprecision in the estimate of the
population parameter the amount added and subtracted to the point estimate
to form the confidence interval

Basic Business Statistics, 11e © 2009 Prentice-Hall, Inc.. Chap 8-43
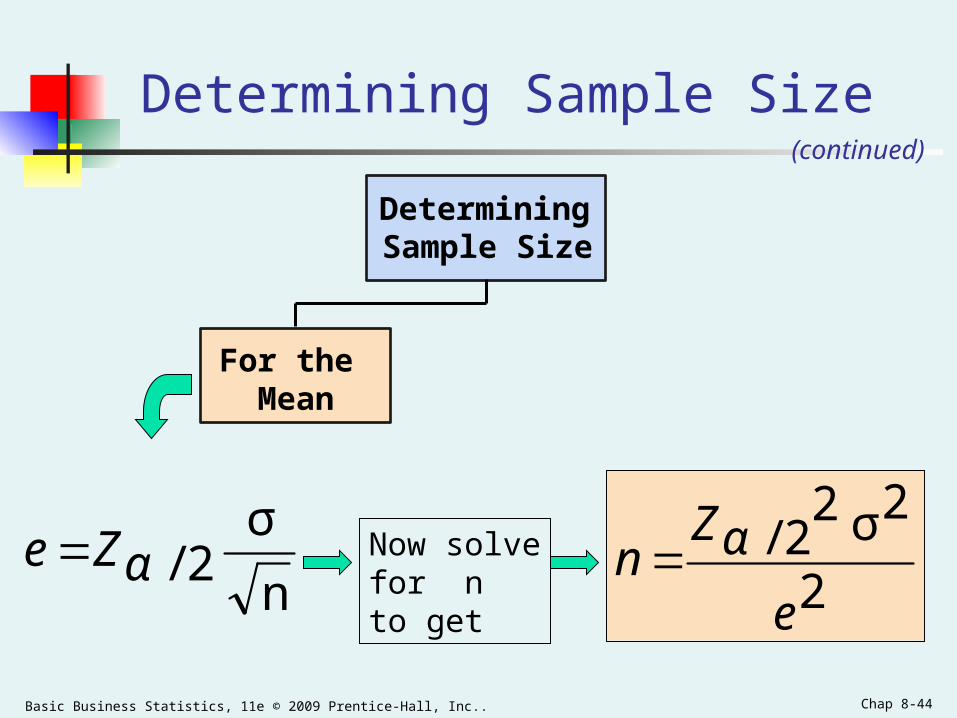
Determining Sample Size
For the Mean
DeterminingSample Size
n
σ2/αZX
n
σ2/αZe
Sampling error (margin of error)
Basic Business Statistics, 11e © 2009 Prentice-Hall, Inc.. Chap 8-44
Determining Sample Size
For the Mean
DeterminingSample Size
n
σ2/αZe
(continued)
2
2σ22/
e
Zn αNow solve
for n to get
Basic Business Statistics, 11e © 2009 Prentice-Hall, Inc.. Chap 8-45
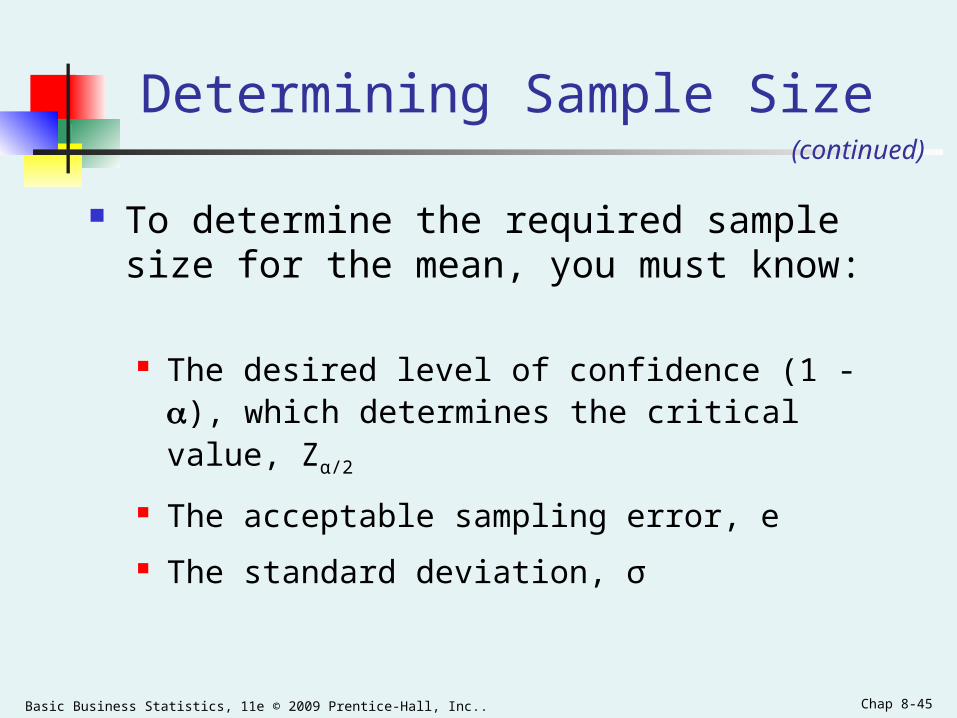
Determining Sample Size
To determine the required sample size for the mean, you must know:
The desired level of confidence (1 - ), which determines the critical value, Zα/2
The acceptable sampling error, e
The standard deviation, σ
(continued)
Basic Business Statistics, 11e © 2009 Prentice-Hall, Inc.. Chap 8-46
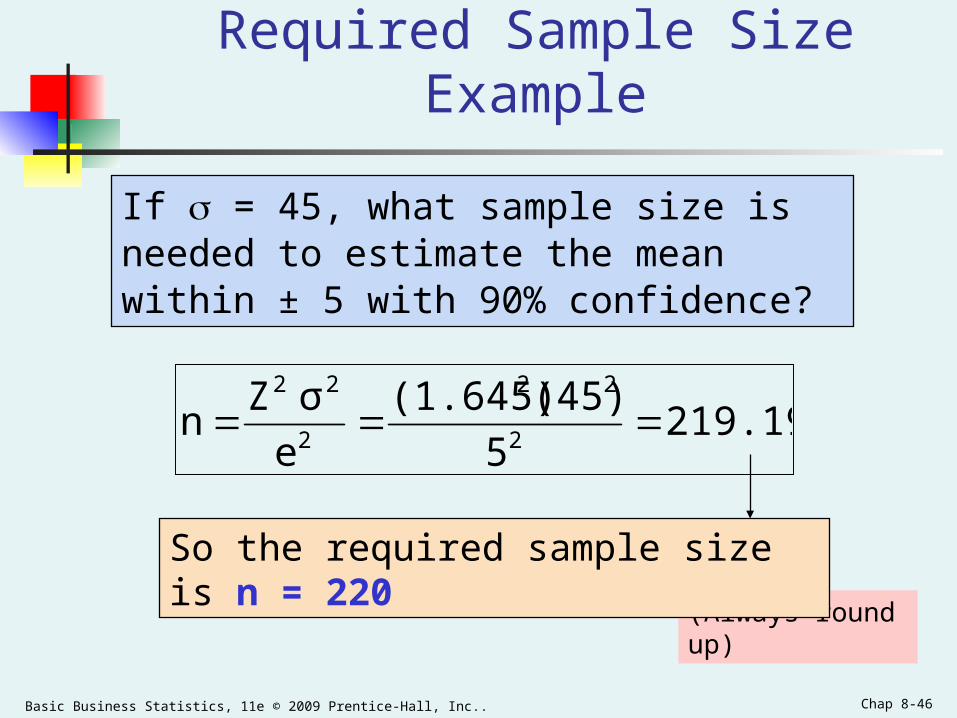
Required Sample Size Example
If = 45, what sample size is needed to estimate the mean within ± 5 with 90% confidence?
(Always round up)
219.195
(45)(1.645)
e
σZn
2
22
2
22
So the required sample size is n = 220
Basic Business Statistics, 11e © 2009 Prentice-Hall, Inc.. Chap 8-47
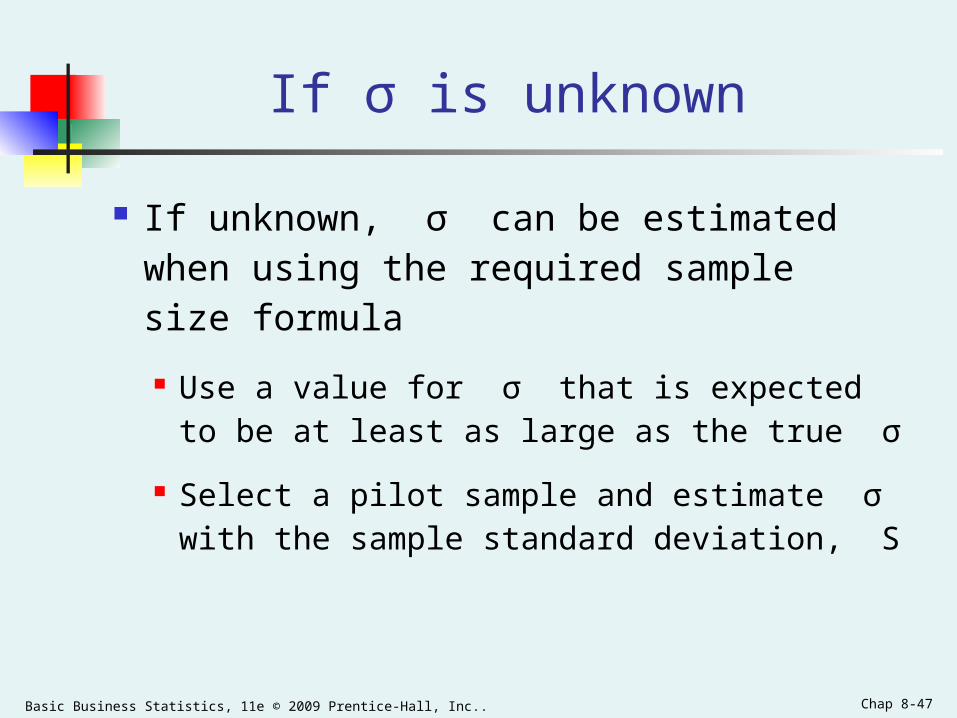
If σ is unknown
If unknown, σ can be estimated when using the required sample size formula
Use a value for σ that is expected to be at least as large as the true σ
Select a pilot sample and estimate σ with the sample standard deviation, S
Basic Business Statistics, 11e © 2009 Prentice-Hall, Inc.. Chap 8-48
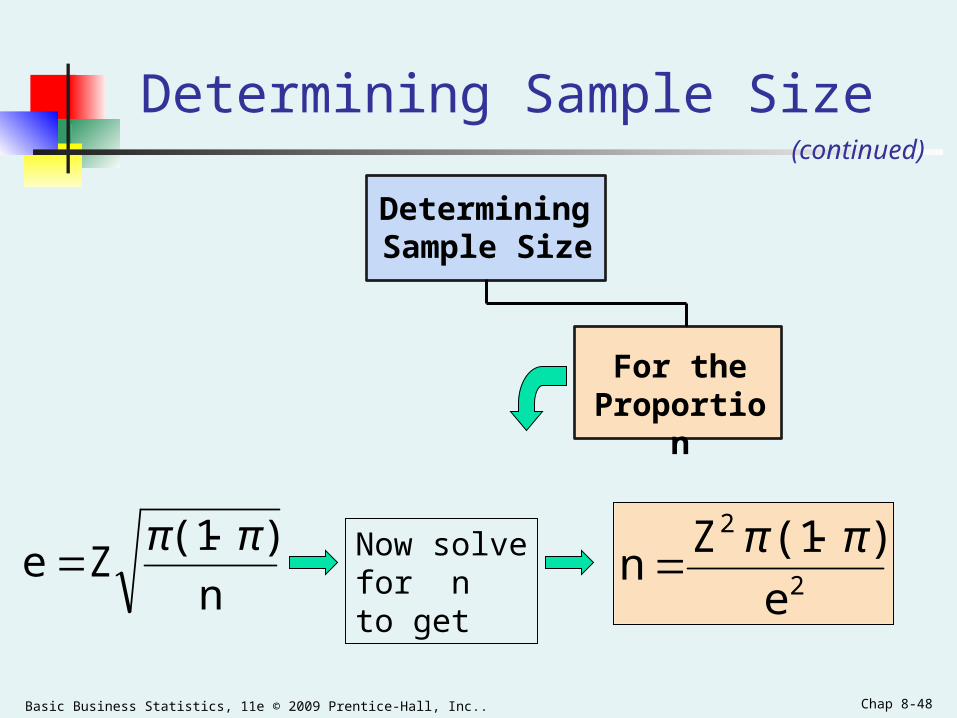
Determining Sample Size
DeterminingSample Size
For theProportion
2
2
e
)(1Zn
ππ Now solve
for n to getn
)(1Ze
ππ
(continued)

Basic Business Statistics, 11e © 2009 Prentice-Hall, Inc.. Chap 8-49
Determining Sample Size
To determine the required sample size for the proportion, you must know:
The desired level of confidence (1 - ), which determines the critical value, Zα/2
The acceptable sampling error, e
The true proportion of events of interest, π
π can be estimated with a pilot sample if necessary (or conservatively use 0.5 as an estimate of π)
(continued)
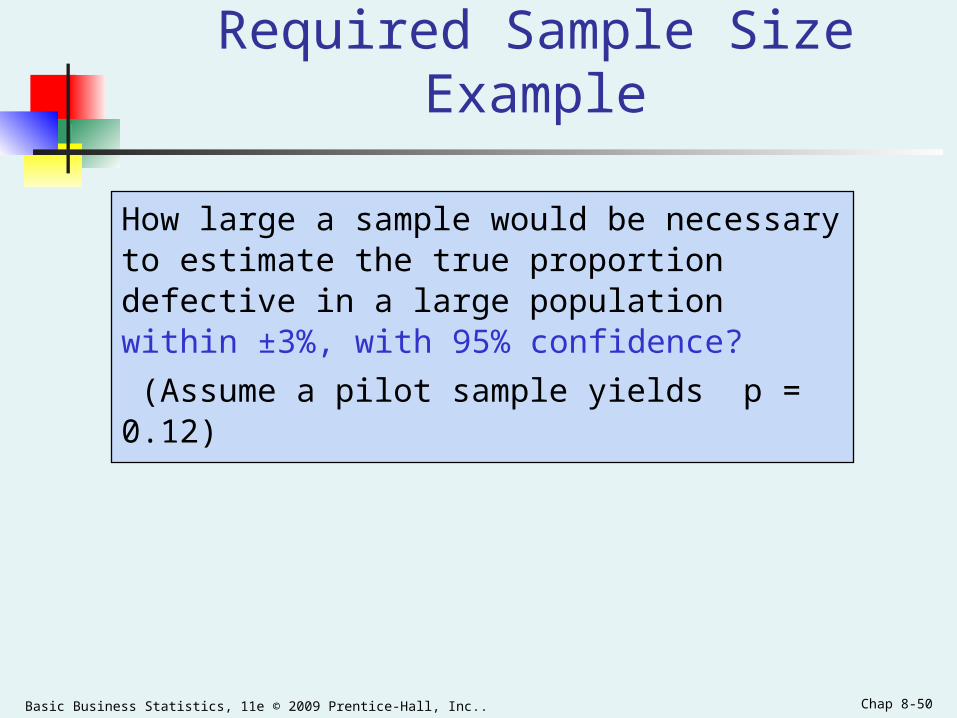
Basic Business Statistics, 11e © 2009 Prentice-Hall, Inc.. Chap 8-50
Required Sample Size Example
How large a sample would be necessary to estimate the true proportion defective in a large population within ±3%, with 95% confidence?
(Assume a pilot sample yields p = 0.12)
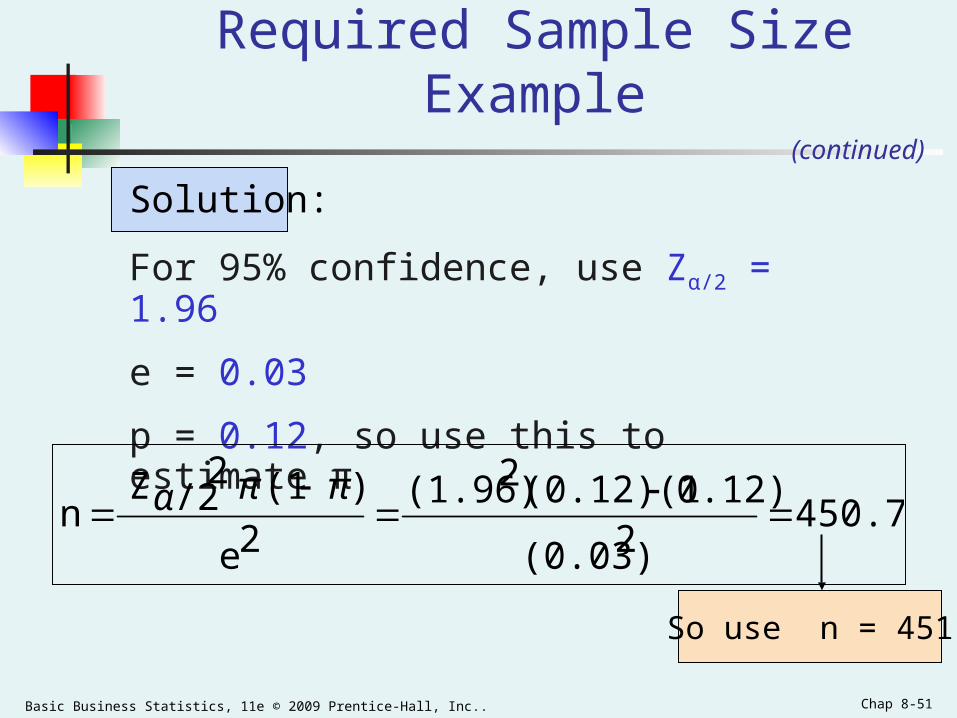
Basic Business Statistics, 11e © 2009 Prentice-Hall, Inc.. Chap 8-51
Required Sample Size Example
Solution:
For 95% confidence, use Zα/2 = 1.96
e = 0.03
p = 0.12, so use this to estimate π
So use n = 451
450.742(0.03)
0.12)(0.12)(12(1.96)2e
)(12/2Z
n
ππα
(continued)
Basic Business Statistics, 11e © 2009 Prentice-Hall, Inc.. Chap 8-52
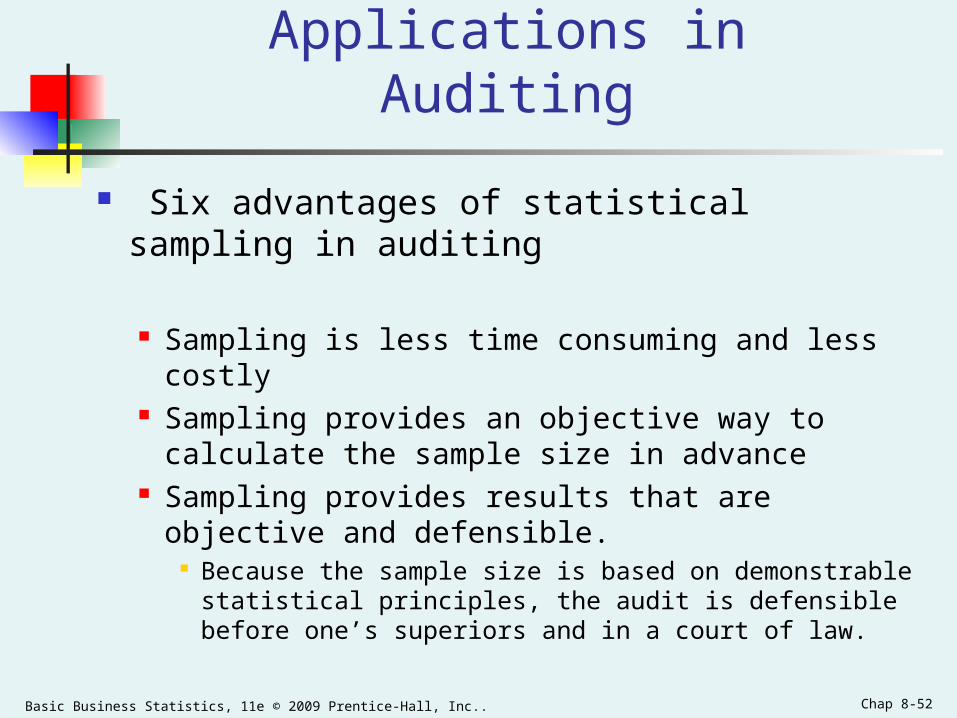
Applications in Auditing
Six advantages of statistical sampling in auditing
Sampling is less time consuming and less costly Sampling provides an objective way to calculate the
sample size in advance Sampling provides results that are objective and
defensible. Because the sample size is based on demonstrable
statistical principles, the audit is defensible before one’s superiors and in a court of law.

Basic Business Statistics, 11e © 2009 Prentice-Hall, Inc.. Chap 8-53
Applications in Auditing
Sampling provides an estimate of the sampling error Allows auditors to generalize their findings to the population
with a known sampling error. Can provide more accurate conclusions about the
population Sampling isoften more accurate for drawing
conclusions about large populations. Examining every item in a large population is subject to
significant non-sampling error Sampling allows auditors to combine, and then
evaluate collectively, samples collected by different individuals.
(continued)
Basic Business Statistics, 11e © 2009 Prentice-Hall, Inc.. Chap 8-54
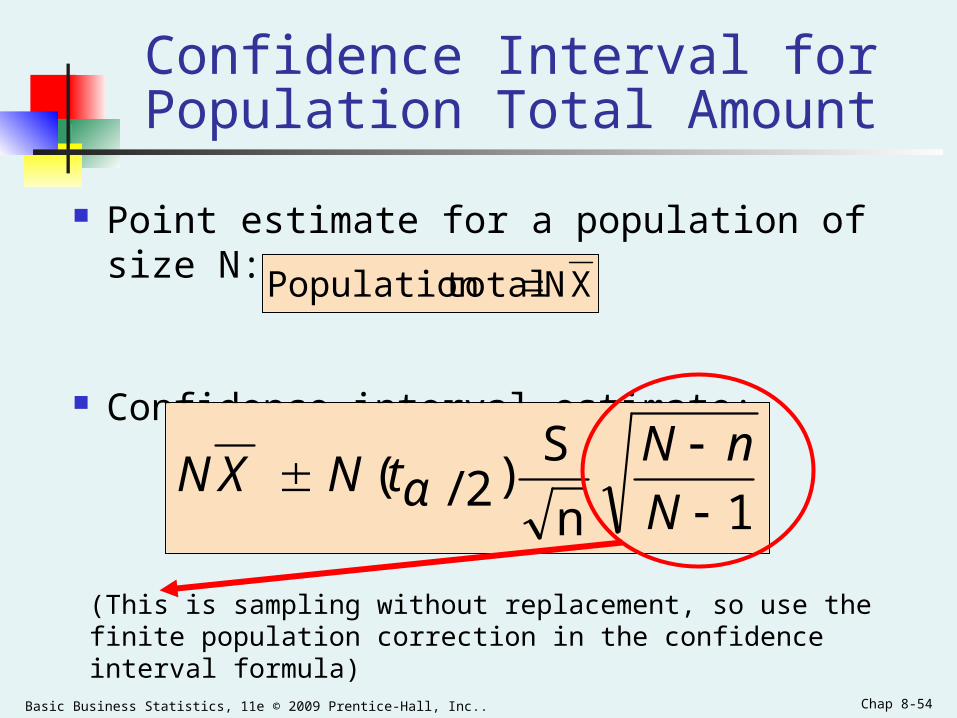
Confidence Interval for Population Total Amount
Point estimate for a population of size N:
Confidence interval estimate:
XN total Population
1n
S)2/(
N
nNtNXN α
(This is sampling without replacement, so use the finite population correction in the confidence interval formula)
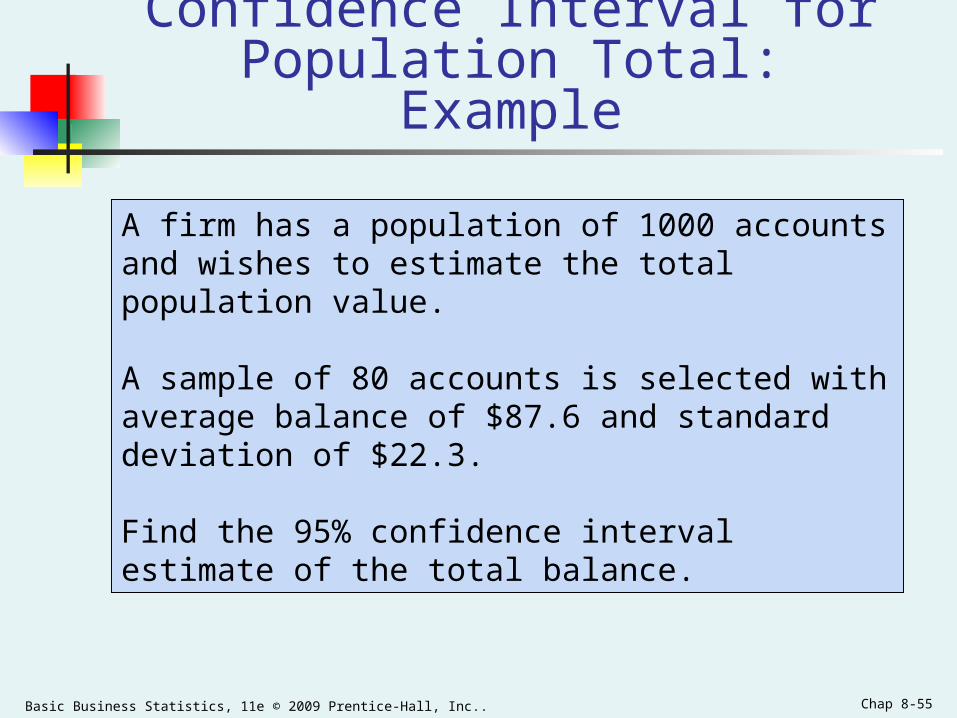
Basic Business Statistics, 11e © 2009 Prentice-Hall, Inc.. Chap 8-55
Confidence Interval for Population Total: Example
A firm has a population of 1000 accounts and wishes to estimate the total population value.
A sample of 80 accounts is selected with average balance of $87.6 and standard deviation of $22.3.
Find the 95% confidence interval estimate of the total balance.

Basic Business Statistics, 11e © 2009 Prentice-Hall, Inc.. Chap 8-56
Example Solution
The 95% confidence interval for the population total balance is $82,837.52 to $92,362.48
48.762,4600,87
11000
801000
80
22.3)9905.1)(1000()6.87)(1000(
1n
S)2/(
N
nNtNXN α
22.3S ,6.87X 80, n ,1000N
Basic Business Statistics, 11e © 2009 Prentice-Hall, Inc.. Chap 8-57
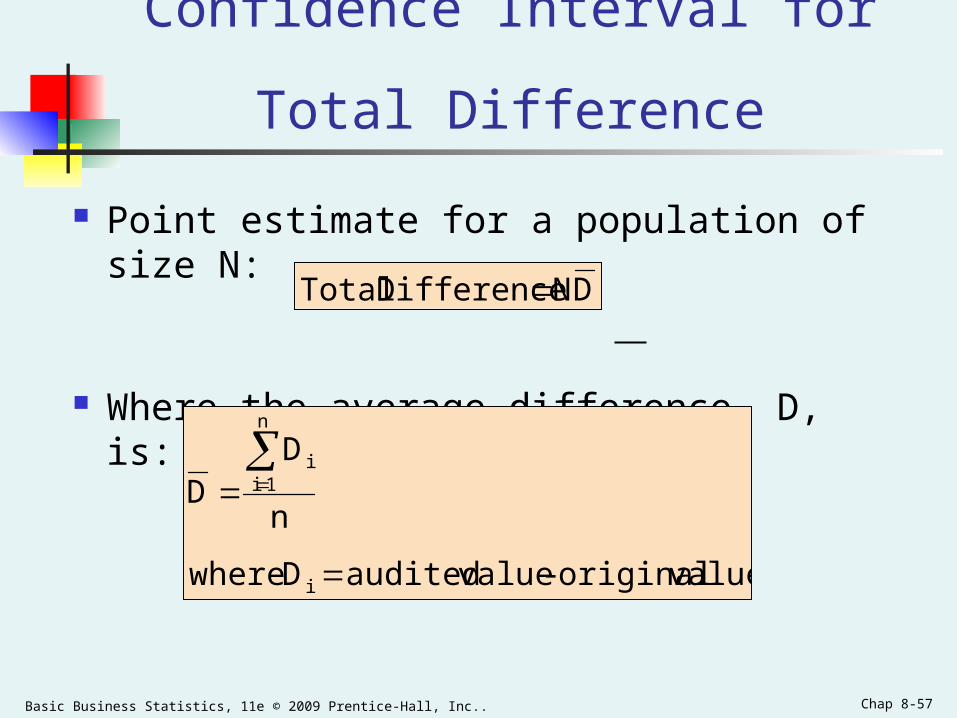
Point estimate for a population of size N:
Where the average difference, D, is:
DN Difference Total
Confidence Interval for Total Difference
value original - value auditedD where
n
DD
i
n
1ii
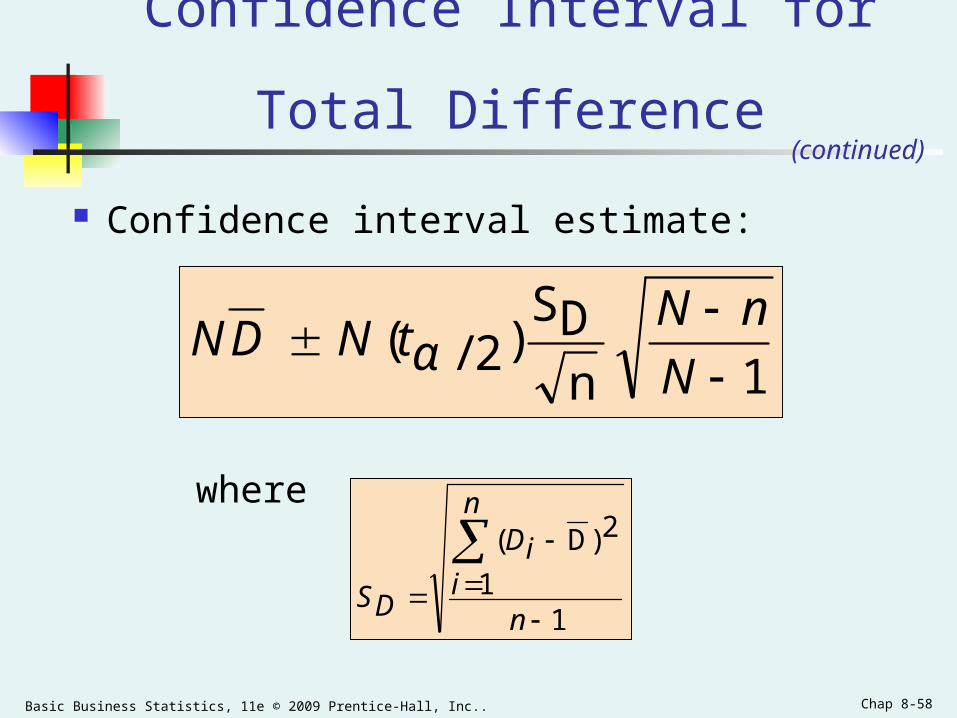
Basic Business Statistics, 11e © 2009 Prentice-Hall, Inc.. Chap 8-58
Confidence interval estimate:
where
1nDS
)2/(
N
nNtNDN α
Confidence Interval for Total Difference
(continued)
11
2)D(
n
n
iiD
DS
Basic Business Statistics, 11e © 2009 Prentice-Hall, Inc.. Chap 8-59
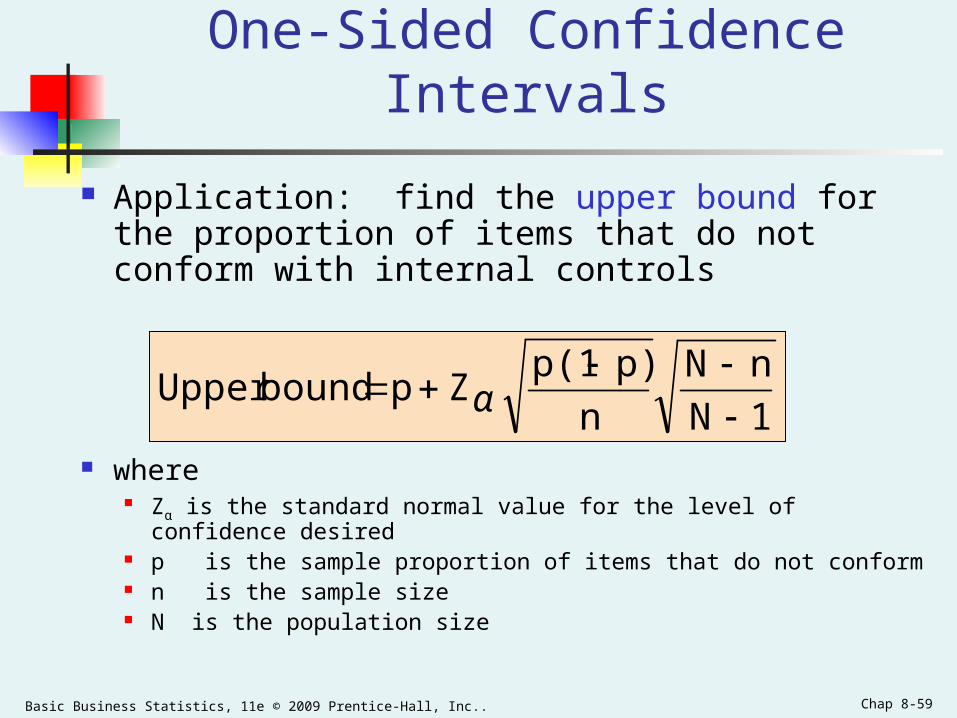
One-Sided Confidence Intervals
Application: find the upper bound for the proportion of items that do not conform with internal controls
where Zα is the standard normal value for the level of confidence desired p is the sample proportion of items that do not conform n is the sample size N is the population size
1N
nN
n
p)p(1Zp boundUpper
α

Basic Business Statistics, 11e © 2009 Prentice-Hall, Inc.. Chap 8-60
Ethical Issues
A confidence interval estimate (reflecting sampling error) should always be included when reporting a point estimate
The level of confidence should always be reported
The sample size should be reported An interpretation of the confidence interval
estimate should also be provided
Basic Business Statistics, 11e © 2009 Prentice-Hall, Inc.. Chap 8-61
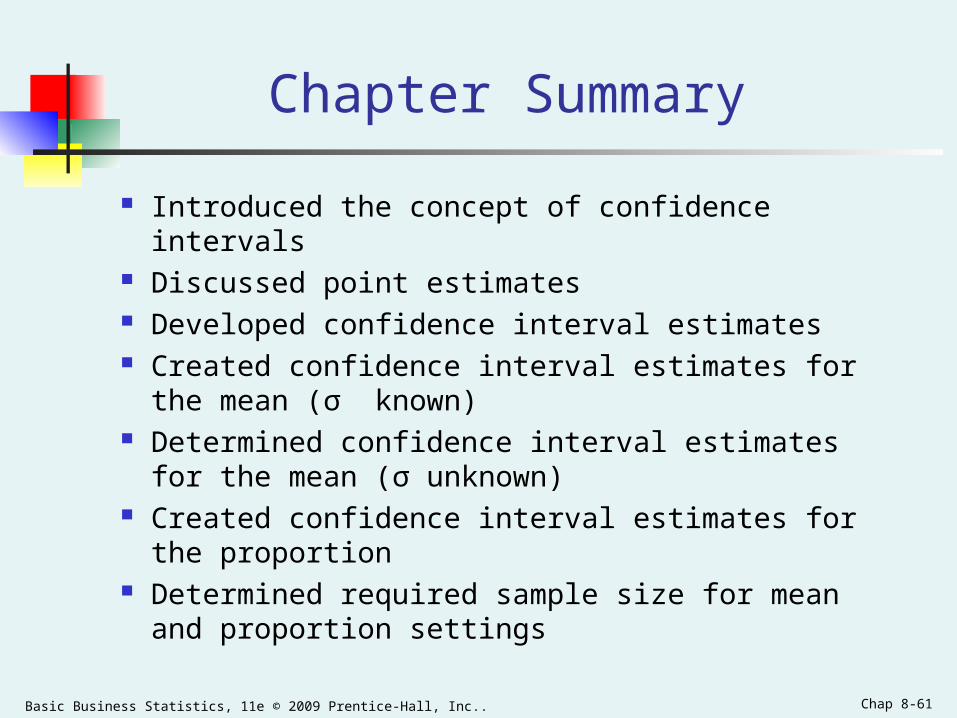
Chapter Summary
Introduced the concept of confidence intervals Discussed point estimates Developed confidence interval estimates Created confidence interval estimates for the mean
(σ known) Determined confidence interval estimates for the
mean (σ unknown) Created confidence interval estimates for the
proportion Determined required sample size for mean and
proportion settings
Basic Business Statistics, 11e © 2009 Prentice-Hall, Inc.. Chap 8-62
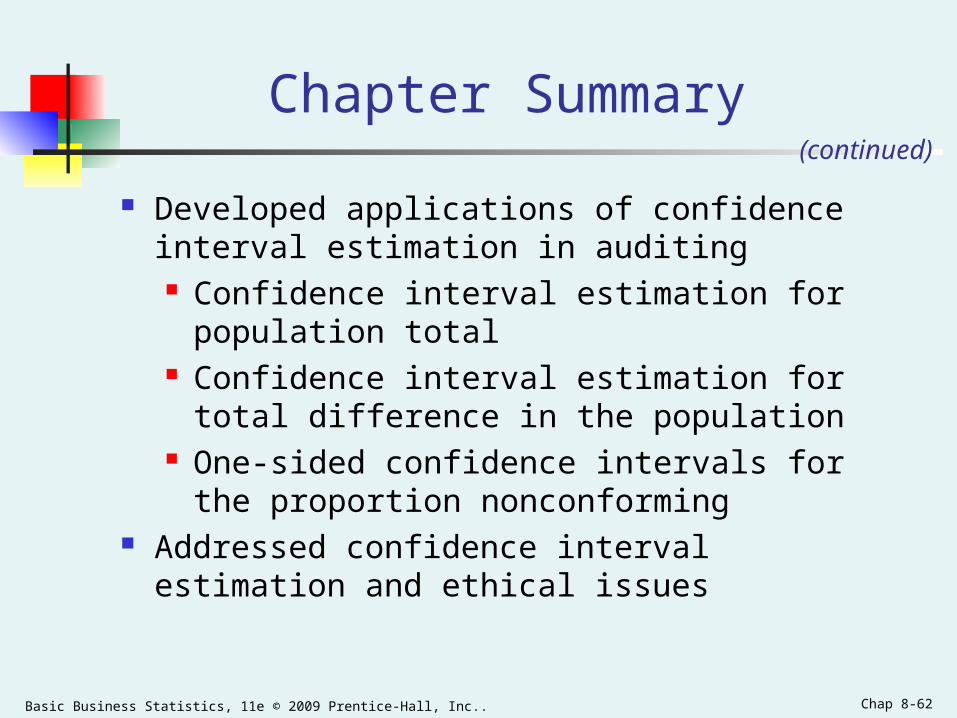
Chapter Summary
Developed applications of confidence interval estimation in auditing Confidence interval estimation for population total Confidence interval estimation for total difference
in the population One-sided confidence intervals for the proportion
nonconforming Addressed confidence interval estimation and ethical
issues
(continued)