BASF analyst conference full year 2014 charts
22
150 years Analyst Conference FY2014 Ludwigshafen, February 27, 2015
-
Upload
basf -
Category
Investor Relations
-
view
11.515 -
download
0
Transcript of BASF analyst conference full year 2014 charts
150 years
Analyst Conference FY2014 Ludwigshafen, February 27, 2015

150 years
Cautionary note regarding forward-looking statements
This presentation may contain forward-looking statements that are subject to risks and uncertainties, including those pertaining to the anticipated benefits to be realized from the proposals described herein. Forward-looking statements may include, in particular, statements about future events, future financial performance, plans, strategies, expectations, prospects, competitive environment, regulation and supply and demand. BASF has based these forward-looking statements on its views and assumptions with respect to future events and financial performance. Actual financial performance could differ materially from that projected in the forward-looking statements due to the inherent uncertainty of estimates, forecasts and projections, and financial performance may be better or worse than anticipated. Given these uncertainties, readers should not put undue reliance on any forward-looking statements. The information contained in this presentation is subject to change without notice and BASF does not undertake any duty to update the forward-looking statements, and the estimates and assumptions associated with them, except to the extent required by applicable laws and regulations.
BASF Analyst Conference FY2014; February 27, 2015 2
150 years
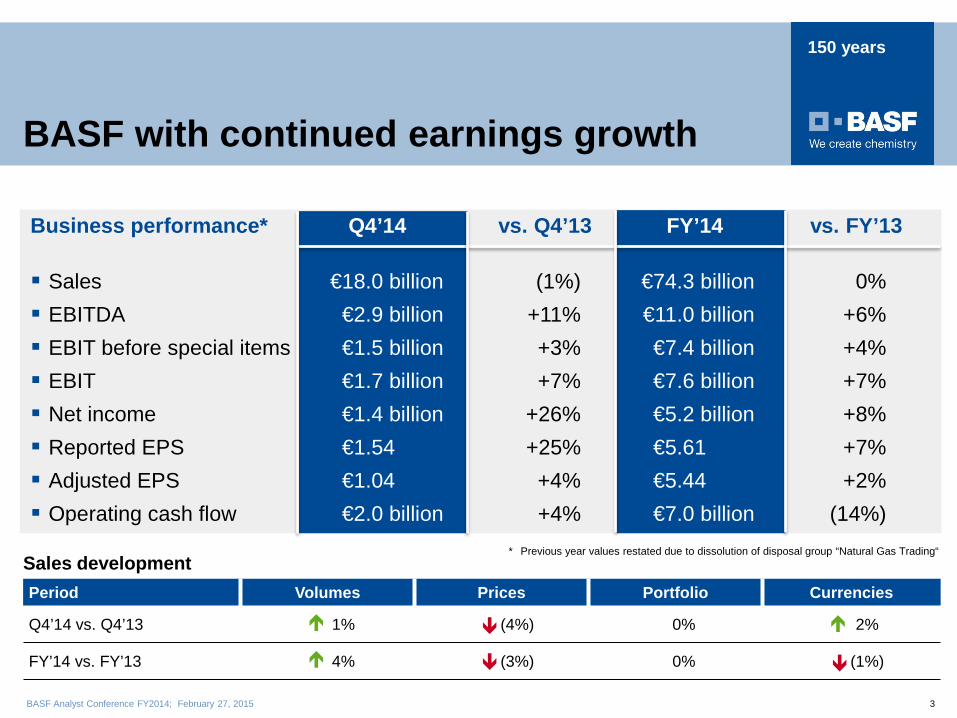
BASF with continued earnings growth
Business performance* Q4’14 vs. Q4’13 FY’14 vs. FY’13 Sales €18.0 billion (1%) €74.3 billion 0% EBITDA €2.9 billion +11% €11.0 billion +6% EBIT before special items €1.5 billion +3% €7.4 billion +4% EBIT €1.7 billion +7% €7.6 billion +7% Net income €1.4 billion +26% €5.2 billion +8% Reported EPS €1.54 +25% €5.61 +7% Adjusted EPS €1.04 +4% €5.44 +2% Operating cash flow €2.0 billion +4% €7.0 billion (14%)
Sales development Period Volumes Prices Portfolio Currencies
Q4’14 vs. Q4’13 1% (4%) 0% 2%
FY’14 vs. FY’13 4% (3%) 0% (1%)
BASF Analyst Conference FY2014; February 27, 2015
* Previous year values restated due to dissolution of disposal group “Natural Gas Trading“
3
150 years
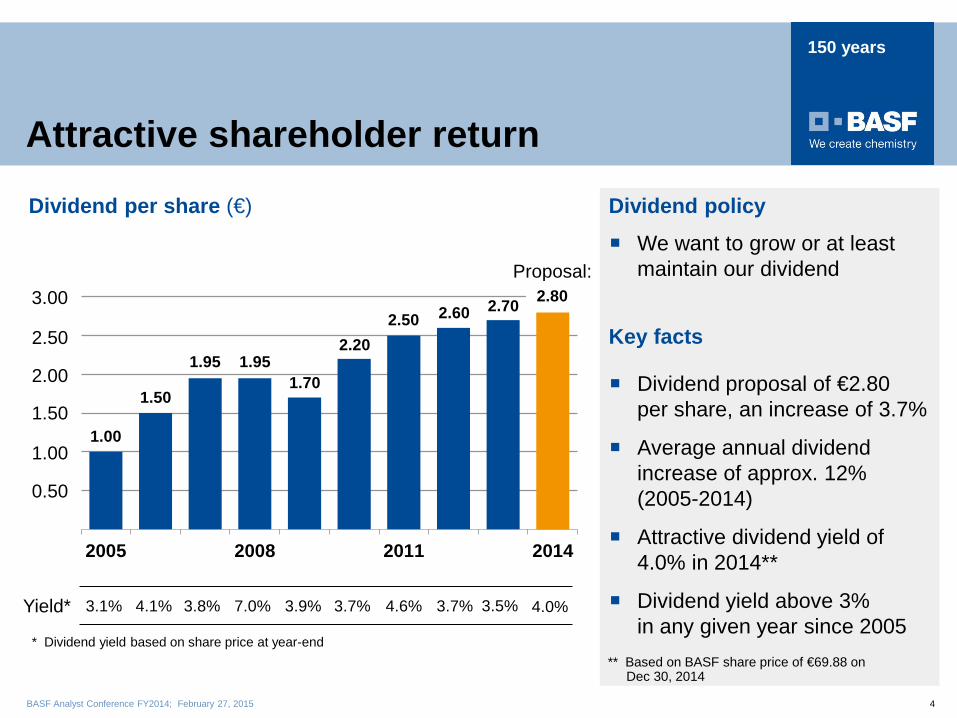
We want to grow or at least maintain our dividend
Dividend proposal of €2.80 per share, an increase of 3.7%
Average annual dividend increase of approx. 12% (2005-2014)
Attractive dividend yield of 4.0% in 2014**
Dividend yield above 3% in any given year since 2005
3.7%
Attractive shareholder return
Key facts
Dividend per share (€)
0,0
0,5
1,0
1,5
2,0
2,5
3,0
2005 2008 2011 2014
0.50
1.00
1.50
2.00
* Dividend yield based on share price at year-end
3.1% 4.1% 3.8% 7.0% 3.9% Yield*
** Based on BASF share price of €69.88 on Dec 30, 2014
Proposal:
4.6%
2.50
3.7%
3.00
3.5% 4.0%
BASF Analyst Conference FY2014; February 27, 2015
1.00
1.50
1.95 1.95 1.70
2.20 2.50 2.60 2.70 2.80
4
Dividend policy
150 years
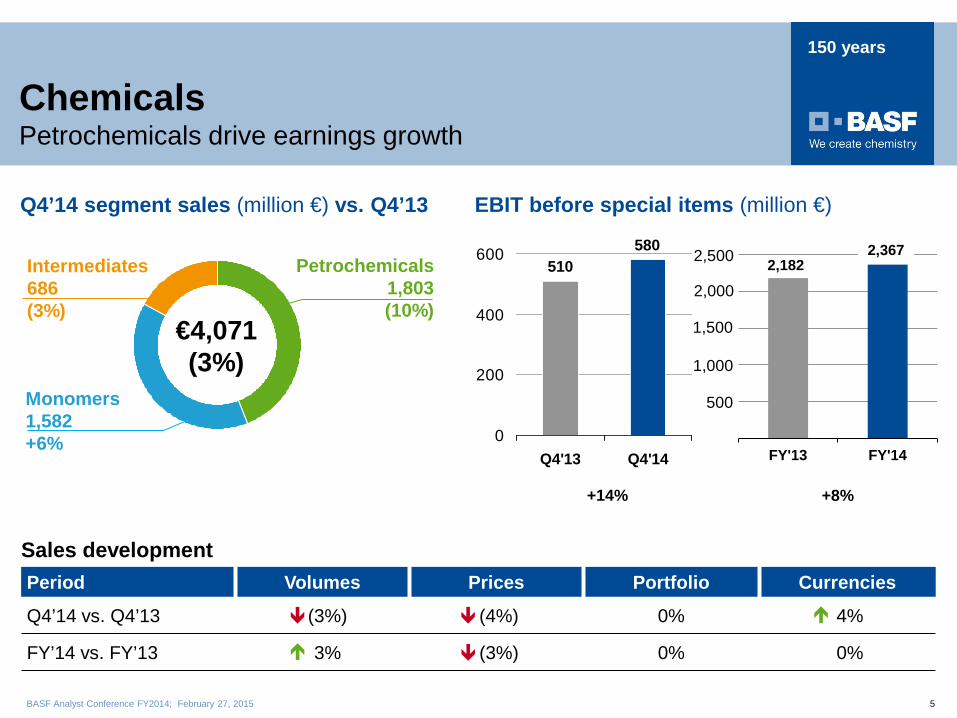
Chemicals Petrochemicals drive earnings growth
Intermediates 686 (3%)
Monomers 1,582 +6%
Petrochemicals 1,803 (10%)
€4,071 (3%)
510580
0
200
400
600
Q4'13 Q4'14
Q4’14 segment sales (million €) vs. Q4’13 EBIT before special items (million €)
Sales development Period Volumes Prices Portfolio Currencies
Q4’14 vs. Q4’13 (3%) (4%) 0% 4%
FY’14 vs. FY’13 3% (3%) 0% 0%
FY'13 FY'14
1,000
2,000
1,500
500
2,500
BASF Analyst Conference FY2014; February 27, 2015
2,182 2,367
+14% +8%
5

150 years
Performance Products Sales slightly up and earnings on prior year level
Performance Chemicals 840 +5%
Care Chemicals
1,164 +1%
€3,718 +1%
Paper Chemicals 341 (1%)
Q4’14 segment sales (million €) vs. Q4’13
Nutrition & Health 492 (4%)
Dispersions & Pigments
881 +1%
216 217
0
100
200
300
Q4'13 Q4'14
Sales development Period Volumes Prices Portfolio Currencies
Q4’14 vs. Q4’13 (2%) 0% 0% 3%
FY’14 vs. FY’13 1% 0% 0% (2%)
EBIT before special items (million €)
FY'13 FY'14
1,000
200
1,200
400 600 800
1,400 1,600
BASF Analyst Conference FY2014; February 27, 2015
1,455 1,365
0% +7%
6
150 years
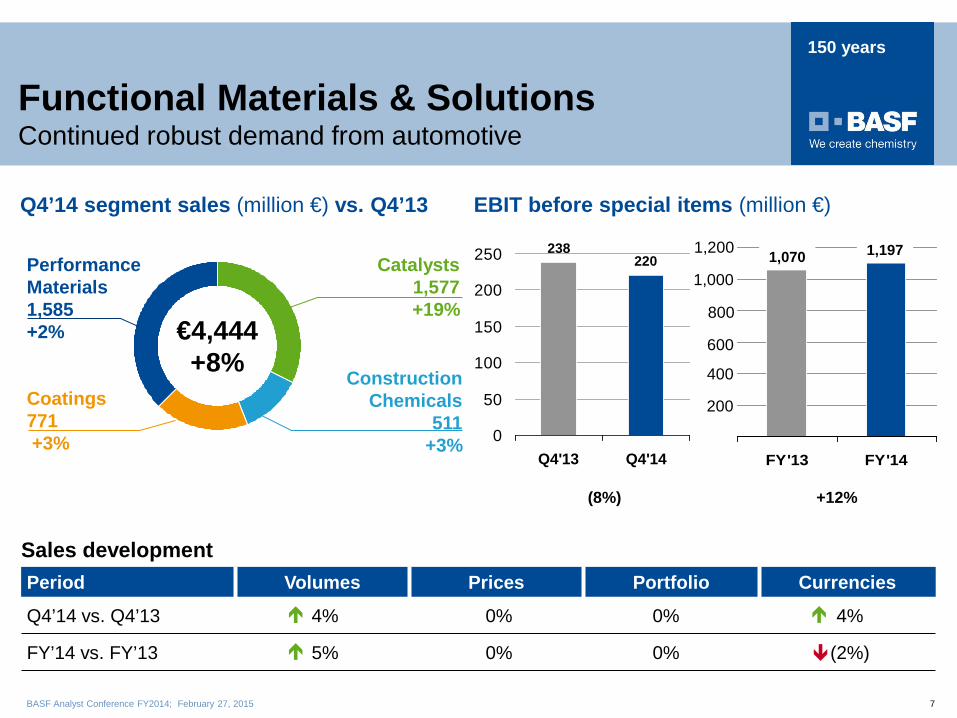
Functional Materials & Solutions Continued robust demand from automotive
Catalysts 1,577
+19%
Construction Chemicals
511 +3%
Coatings 771 +3%
€4,444+8%
Q4’14 segment sales (million €) vs. Q4’13
238220
0
50
100
150
200
250
Q4'13 Q4'14 FY'13 FY'14
Sales development Period Volumes Prices Portfolio Currencies
Q4’14 vs. Q4’13 4% 0% 0% 4%
FY’14 vs. FY’13 5% 0% 0% (2%)
EBIT before special items (million €)
Performance Materials 1,585 +2%
1,000
600
400
200
800
1,200
BASF Analyst Conference FY2014; February 27, 2015
1,197 1,070
(8%) +12%
7

150 years
Agricultural Solutions Strong finish to the year
Q4’14 segment sales (million €) vs. Q4’13
0
200
400
600
800
1,000
Q4 Q42014 2013
890 1,109
020406080
100120140
Q4'13 Q4'14
Sales development Period Volumes Prices Portfolio Currencies
Q4’14 vs. Q4’13 22% (3%) 0% 6%
FY’14 vs. FY’13 5% 2% 0% (3%)
EBIT before special items (million €)
FY'13 FY'14
1,000 1,200
600 800
400 200
1,400
BASF Analyst Conference FY2014; February 27, 2015
1,222 1,109
67
123
+84% (9%)
8
150 years
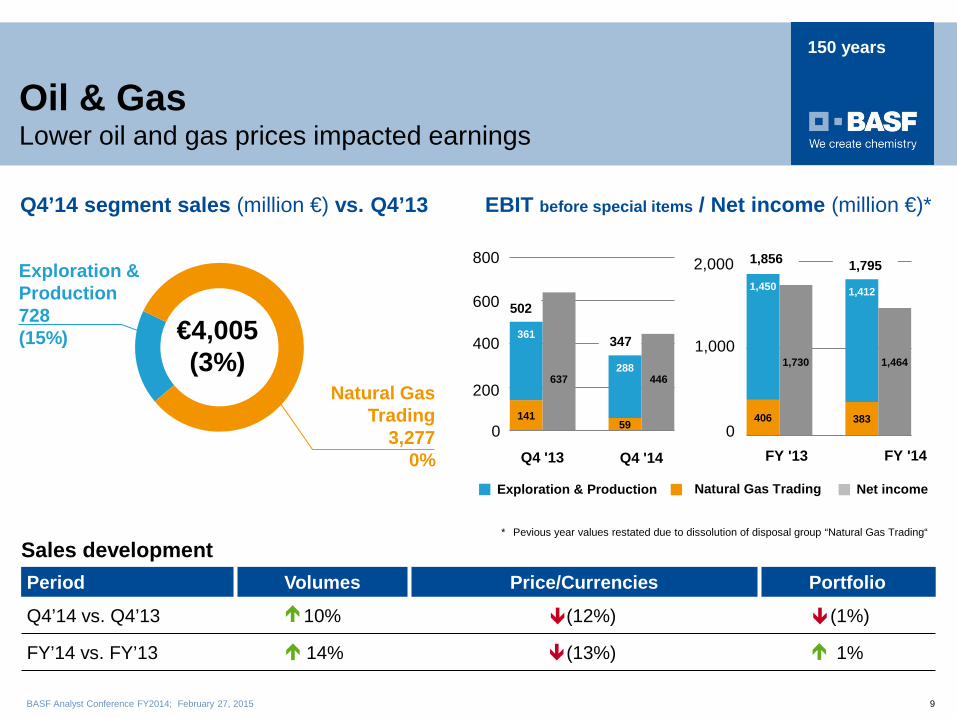
406 383
1,450 1,412
Oil & Gas Lower oil and gas prices impacted earnings
Exploration & Production 728 (15%)
Natural Gas Trading
3,277 0%
€4,005 (3%)
Q4’14 segment sales (million €) vs. Q4’13 EBIT before special items / Net income (million €)*
FY '13 FY '14
Sales development Period Volumes Price/Currencies Portfolio
Q4’14 vs. Q4’13 10% (12%) (1%)
FY’14 vs. FY’13 14% (13%) 1%
Natural Gas Trading Exploration & Production Net income
0
1,000
2,000 1,856 1,795
BASF Analyst Conference FY2014; February 27, 2015
141 59
361
288 637 446
Q4 '13 Q4 '14
502
347
0
200
400
800
1,730 1,464
* Pevious year values restated due to dissolution of disposal group “Natural Gas Trading“
9
600

150 years
Review of ’Other’
Million € Q4 2014 Q4 2013 2014 2013
Sales 700 1,106 3,609 4,190 EBIT before special items (28) (114) (566) (618) Thereof corporate research costs group corporate costs currency results, hedges and other valuation effects other businesses
(98) (59) 110
23
(102) (66)
(109)
99
(389) (218)
(2)
133
(386) (237) (190)
254
Special items 473 3 433 (46)
EBIT 445 (111) (133) (664)
BASF Analyst Conference FY2014; February 27, 2015 10

150 years
Million € 2014 2013* Cash provided by operating activities 6,958 8,100 Thereof changes in net working capital miscellaneous items
(699) (953)
714 (720)
Cash provided by investing activities (4,496) (5,994) Thereof payments related to tangible / intangible assets (5,296) (4,873) acquisitions / divestitures 373 (1,093) Cash used in financing activities (2,478) (1,874) Thereof changes in financial liabilities dividends
288 (2,766)
828 (2,702)
Free cash flow decreased to €1.7 billion; reduction due to a swing in net working capital and higher capex
Payments related to tangible/intangible assets amounted to €5.3 billion (+€423 million) Continued high dividend payout in 2014: ~€2.8 billion
2014
Operating cash flow development in 2014
BASF Analyst Conference FY2014; February 27, 2015
* Previous year values restated due to dissolution of disposal group “Natural Gas Trading“
11

150 years
Balance sheet remains strong Balance sheet 2014 vs. 2013 (billion €)
Liquid funds
Accounts receivable
Long-term assets 28.2
15.4
27.8
38.3
10.2
1.8
Other liabilities
Financial debt
Stockholders’ Equity
Dec 31, 2013
Dec 31, 2013
Dec 31, 2014
Dec 31, 2014
64.2
27.7
14.4
22.1
Inventories
Other assets
9.6
3.7
64.2
Highlights 2014 Increase in long-term assets
by €5.7 billion, due to capex and acquisitions
Increase of pension provisions by €3.6 billion due to continued decline of discount rates
Financial debt increased by €1.0 billion reflecting issuance of bonds
Net debt: €13.7 billion
Net debt/EBITDA ratio: 1.2
Equity ratio: 40%
44.0
10.4
1.7
9.6
4.0
71.4 71.4
BASF Analyst Conference FY2014; February 27, 2015
10.2 11.3
(Previous year values restated due to dissolution of disposal group “Natural Gas Trading“)
12

150 years
Outlook 2015 Expectations for the global economy
2014 (actual)
GDP 2.5%
Chemicals (excl. pharma) 4.0%
Industrial production 3.4%
US$ / Euro 1.33
Oil price: Brent (US$ / bbl) 99
Forecast 2015
2.8%
4.2%
3.6%
1.20
60-70
BASF Analyst Conference FY2014; February 27, 2015 13
150 years
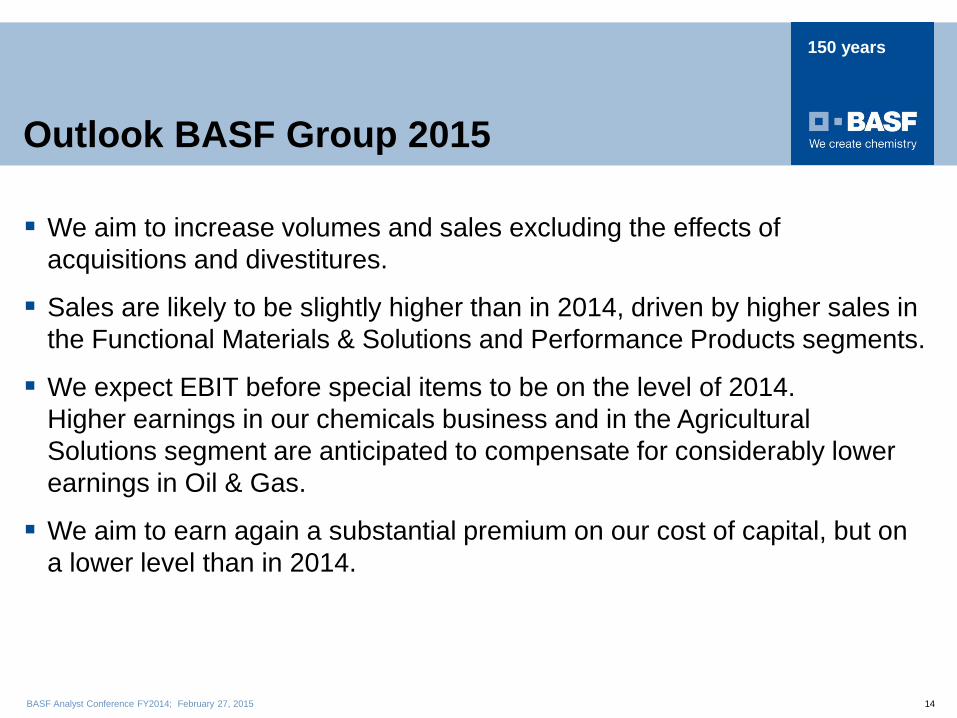
Outlook BASF Group 2015
We aim to increase volumes and sales excluding the effects of acquisitions and divestitures.
Sales are likely to be slightly higher than in 2014, driven by higher sales in the Functional Materials & Solutions and Performance Products segments.
We expect EBIT before special items to be on the level of 2014. Higher earnings in our chemicals business and in the Agricultural Solutions segment are anticipated to compensate for considerably lower earnings in Oil & Gas.
We aim to earn again a substantial premium on our cost of capital, but on a lower level than in 2014.
BASF Analyst Conference FY2014; February 27, 2015 14

150 years
Western European gas prices predominantly market-driven
Gas markets outside of Europe partially regulated (e.g. Russia, Argentina)
Annual oil price sensitivity for O&G segment: ±€20 million EBIT per ±$1 per bbl. (Brent)
Oil & Gas: Impact of the current oil price and measures
Key Facts Production split* 2014
Operational excellence
Cost optimization
CAPEX optimization
Active portfolio management
Measures
Liquids ~25%
~136 million
boe
Natural Gas ~75%
*Exploration & Production
Oil price vs. Western European gas price (2010 = 100)
80
130
180
230
2010 2011 2012 2013 2014
Natural Gas TTF Netherlands Oil price Brent BASF Analyst Conference FY2014; February 27, 2015 15
150 years
16
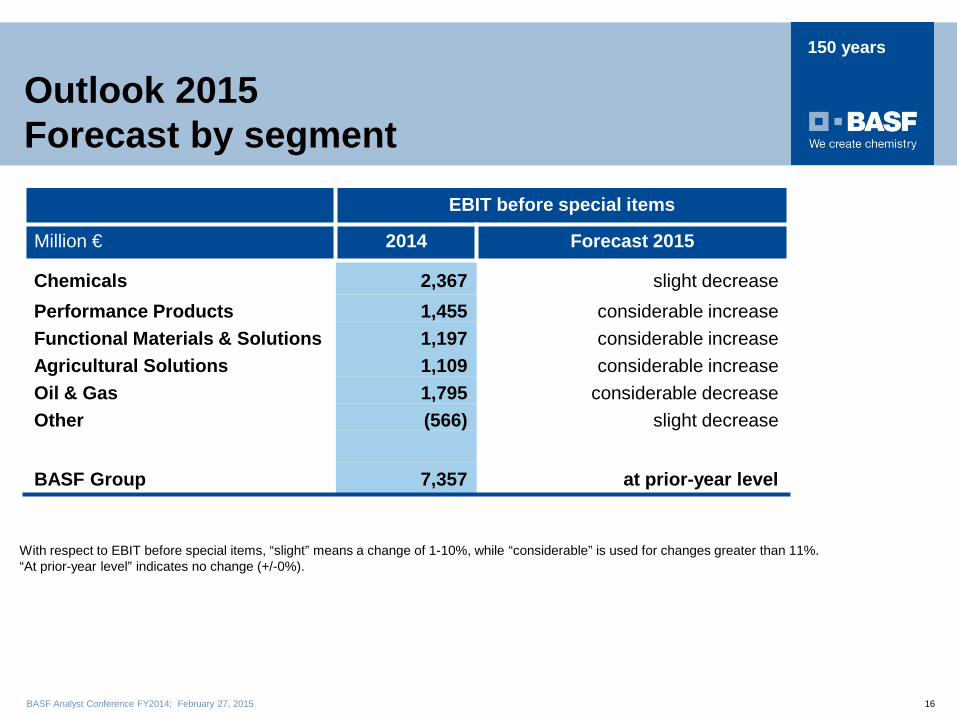
EBIT before special items
Million € 2014 Forecast 2015
Chemicals 2,367 slight decrease Performance Products 1,455 considerable increase Functional Materials & Solutions 1,197 considerable increase Agricultural Solutions 1,109 considerable increase Oil & Gas 1,795 considerable decrease Other (566) slight decrease
BASF Group 7,357 at prior-year level
Outlook 2015 Forecast by segment
With respect to EBIT before special items, “slight” means a change of 1-10%, while “considerable” is used for changes greater than 11%. “At prior-year level” indicates no change (+/-0%).
BASF Analyst Conference FY2014; February 27, 2015

150 years
.
Major investment projects will start up in 2015
Pasir Gudang
Theodore
Polymer dispersions*
Chelating agents*
Coating resins*
Shanghai
17
Upstream businesses Downstream businesses
Major capex projects for start-up in 2015
Camaҫari Acrylic acid +160,000 mt SAP +60,000 mt
BASF Analyst Conference FY2014; February 27, 2015
Chongqing
Nanjing
Geismar
Maoming
Neopentylglycol +40,000 mt
Specialty amines* Ethylene oxide*
MDI +400,000 mt
Isononanol*
TDI complex +300,000 mt Specialty amines* Crop protection products*
Formic acid +50,000 mt Polyurethane systems
Polyamides +100,000 mt
Ludwigshafen
* Capacity not published
Yesan Specialty plastics*
Precious metals recycling*
Cinderford
Guaratingueta Crop protection
formulations*
Automotive catalysts*
Automotive catalysts*
Chennai

150 years
€1.9 billion R&D expenditure in 2014
Further increase of R&D spending in 2015
~10,700 employees in R&D
~3,000 projects
Research Verbund: Cooperations with more than 600 excellent partners from universities, start-ups and industry
Target 2015: – €10 billion of sales from
innovations launched within the last 5 years
Strong commitment to innovation Innovations for a sustainable future
Key facts
BASF Analyst Conference FY2014; February 27, 2015 18
1.5 1.6
1.7 1.8 1.9
0,0
0,5
1,0
1,5
2,0
2010 2011 2012 2013 2014
R&D expenditures (billion €)
Chemicals 10%
Performance Products 19%
Functional Mat. & Sol. 20%
Agricultural Solutions 27%
Oil & Gas 3%
Corporate Research 21%
2.0
1.5
1.0
0.5
0

150 years
19
SAVIVA™ The next generation of
super-absorbent polymers
150 years
20
150 years

150 years
Outlook 2015 by region Chemical production (excl. pharma)
EU
USA
Asia (excl. Japan and South Korea)
Japan
South America
4.2%
1.5%
3.5%
6.9%
1.0%
1.3%
World 4.0%
1.2%
2.7%
7.8%
-0.8%
-2.0% BASF Analyst Conference FY2014; February 27, 2015
2014 (actual) Forecast 2015
21
150 years
BASF Analyst Conference FY2014; February 27, 2015
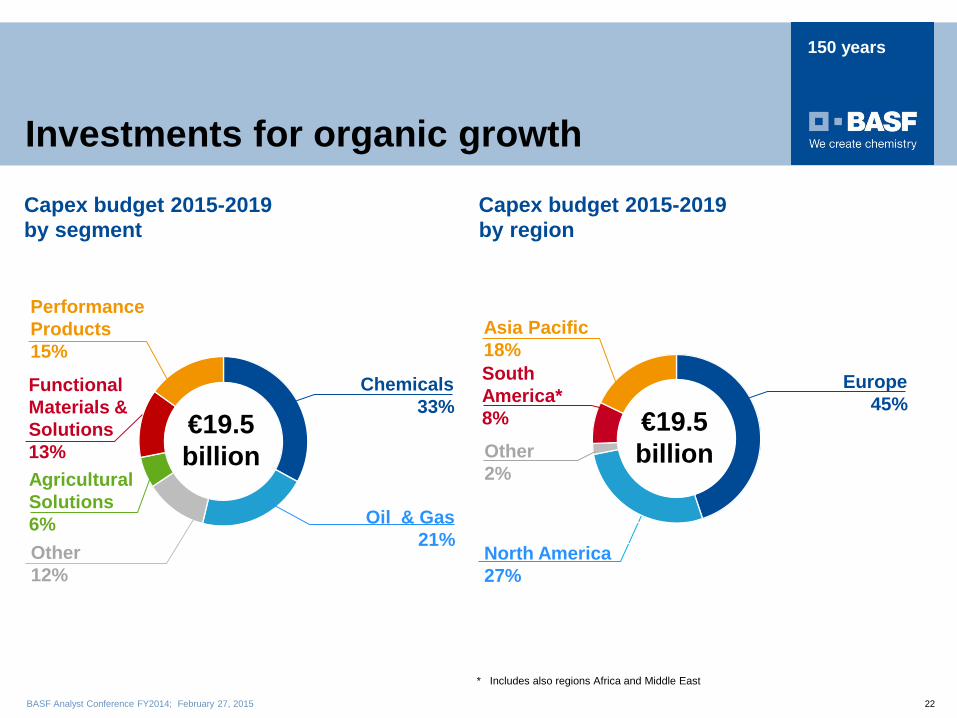
Investments for organic growth
Performance Products 15%
Oil & Gas 21%
€19.5 billion
Functional Materials & Solutions 13%
Capex budget 2015-2019
Other 12%
Chemicals 33%
Capex budget 2015-2019
Asia Pacific 18%
€19.5 billion
South America* 8%
North America 27%
Europe 45%
Agricultural Solutions 6%
Other 2%
by segment by region
* Includes also regions Africa and Middle East
22